Embed Size (px)
Citation preview

January 2017
Institute of Interdisciplinary Research
Working Papers in Interdisciplinary Economics and Business Research
W
ork
ing
Pap
er
37
Consumer Ethnocentrism of Moravian-Silesian Region: Comparison of CETSCALE Research 2013/17
Michal Stoklasa
Working Papers in Interdisciplinary Economics and Business Research Silesian University in Opava School of Business Administration in Karviná Institute of Interdisciplinary Research Univerzitní nám. 1934/3 733 40 Karviná Czech Republic http://www.iivopf.cz/ email: [email protected] +420 596 398 237
Citation
STOKLASA, M., 2017. Consumer Ethnocentrism of Moravian-Silesian Region: Comparison of CETSCALE Research 2013/17. Working Paper in Interdisciplinary Economics and Business Research no. 37. Silesian University in Opava, School of Business Administration in Karviná.

Abstract Michal Stoklasa: Consumer Ethnocentrism of Moravian-Silesian Region: Comparison of CETSCALE Research 2013/17
The aim of this article is to measure the Consumer Ethnocentrism in the Moravian-Silesian region in the Czech Republic utilizing the CETSCALE. The research was focused on finding the strength of individual CETSCALE scales and the dependency of CE on demographic factors. Literature review describes the development of consumer ethnocentrism, and more importantly the CETSCALE, with some of its critics and constraints. Then the research methodology is presented. The research took place in the Moravian-Silesian Region and the sample consisted of 439 respondents. All the data is compared with our previous research from 2013, interpreted and the results are discussed. According to Cronbach's Alpha, the data is consistent and therefore reliable to explain CE. The main findings are the strength of the CE is as high as 66.3% of the overall possible score, which ranks this region amongst ones with the highest CE. In both, the 2013 and 2017 data, we can observe strong evidence of consumers in this region being highly ethnocentric, supporting local products and local producers, with negative perception of foreign products. Highly interesting are the results of the dependence of CE on the demographic factors. In 2014, only education and net monthly income were proven to have statistically significant impact on CE, in 2017 also the age categories.
Key words
Consumer ethnocentrism, CETSCALE, demographic factors, foreign products, regional products.
JEL: M31 Contacts
Michal Stoklasa, Department of Business Economics and Management, School of Business Administration, Silesian University, Univerzitní nám. 1934/3, 733 40 Karviná, Czechia, e-mail: [email protected].
Acknowledgement
Publication of this paper was supported by the Ministry of Education, Youth and Sports within the Institutional Support for Long-term Development of a Research Organization in 2016. The support is gratefully acknowledged.

1
Introduction
The EU has brought us, amongst others, the common market, which allowed the consumers to buy products of many countries. But one of the obstacles in the form of a non-tariff barrier is the consumer ethnocentrism, which simply put indicates a tendency to shun all imported products irrespective of price or quality due to nationalistic reasons (Stere and Trajani, 2015). This theme is highly interesting in 2017 with the unrest in the EU politics and rise of the far right (nationalist) parties, and of course the political programme of the president Trump.
Consumer ethnocentrism gaining its strength can be seen every day around us with campaigns supporting national pride (Irish Product, make America great again, Czech Made), companies proudly presenting the country of origin (made in the Czech Republic), governments pushing laws directly influencing the minimum percentages of national food products in markets, or the exceptionally strong consumer support for regional products, regional markets, regional producers and economies. Although majority of these trends is true for the Czech Republic, only a handful of researchers have conducted a research on consumer ethnocentrism.
The main aim of this article is to research consumer ethnocentrism in Moravian-Silesian Region. The main goal will be fulfilled by utilizing CETSCALE. The research is a follow up on previous CETSCALE research in MS Region from 2014, partial goal of the article is to compare the data. Another partial goal is to utilize the advances in CETSCALE development to test how CE depends on demographic factors for future monetization possibilities.
The first part of the paper presents review of the relevant literature in the field of consumer ethnocentrism and CETSCALE for its measuring. The second part deals with methodology and sample. Third part presents data analysis and discussion of the outcomes.
1. Consumer Ethnocentrism and the CETSCALE
This first chapter serves as the theoretical basis for the research. Ethnocentrism isn’t originally a marketing concept, but has evolved during the 20th century into Consumer Ethnocentrism, that has several scales by which it can be measured, but the most famous and most often used is the CETSCALE by Shimp and Sharma (1987).
1.1. Consumer Ethnocentrism
The foundation for Consumer Ethnocentrism research in Marketing has been laid out by Shimp and Sharma in 1987 with their article „Consumer Ethnocentrism: Construction and Validation of the CETSCALE“, where they introduced the Consumer Ethnocentric Tendencies Scale, that has been broadly used since then. They haven’t been the first ones to address this topic, but their scale became a staple for research of this phenomena.
In order to utilize the concept of Ethnocentrism in Marketing, we have to perceive it in a way that has been first covered by Sumner in 1906, where Ethnocentrism was a purely sociological concept that helped to distinguish between the so called ingroups (the groups the person is a part of) and outgroups (Sumner, 2007). Sumner (2007) also explains ethnocentrism as belief, that our group is more important than others, we are the centre of everything and we judge others compared to us. Throughout the 20th century, the concept of ethnocentrism had spread into other scientific disciplines, for this article, important approach is connected
2
with culture, where for example Koudelka (1997, p. 25) describes ethnocentrism as favouring one’s own culture, and perceiving other cultures different (inferior) and preferring one’s own.
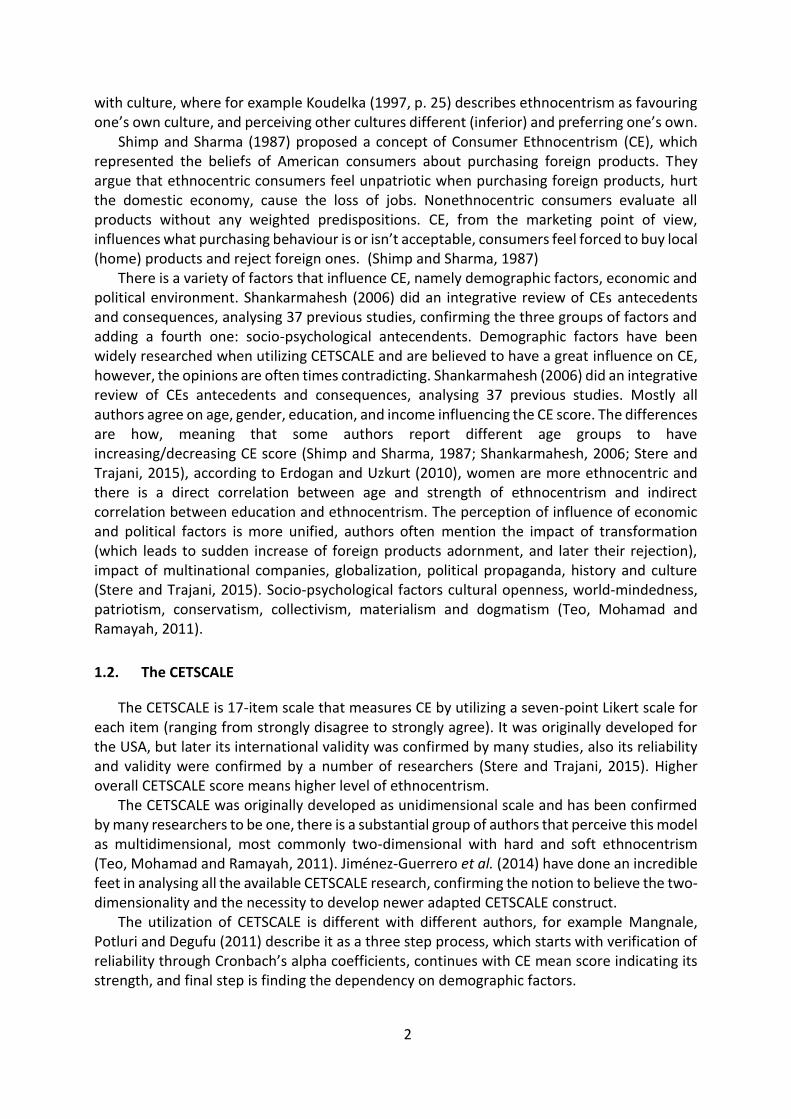
Shimp and Sharma (1987) proposed a concept of Consumer Ethnocentrism (CE), which represented the beliefs of American consumers about purchasing foreign products. They argue that ethnocentric consumers feel unpatriotic when purchasing foreign products, hurt the domestic economy, cause the loss of jobs. Nonethnocentric consumers evaluate all products without any weighted predispositions. CE, from the marketing point of view, influences what purchasing behaviour is or isn’t acceptable, consumers feel forced to buy local (home) products and reject foreign ones. (Shimp and Sharma, 1987)
There is a variety of factors that influence CE, namely demographic factors, economic and political environment. Shankarmahesh (2006) did an integrative review of CEs antecedents and consequences, analysing 37 previous studies, confirming the three groups of factors and adding a fourth one: socio-psychological antecendents. Demographic factors have been widely researched when utilizing CETSCALE and are believed to have a great influence on CE, however, the opinions are often times contradicting. Shankarmahesh (2006) did an integrative review of CEs antecedents and consequences, analysing 37 previous studies. Mostly all authors agree on age, gender, education, and income influencing the CE score. The differences are how, meaning that some authors report different age groups to have increasing/decreasing CE score (Shimp and Sharma, 1987; Shankarmahesh, 2006; Stere and Trajani, 2015), according to Erdogan and Uzkurt (2010), women are more ethnocentric and there is a direct correlation between age and strength of ethnocentrism and indirect correlation between education and ethnocentrism. The perception of influence of economic and political factors is more unified, authors often mention the impact of transformation (which leads to sudden increase of foreign products adornment, and later their rejection), impact of multinational companies, globalization, political propaganda, history and culture (Stere and Trajani, 2015). Socio-psychological factors cultural openness, world-mindedness, patriotism, conservatism, collectivism, materialism and dogmatism (Teo, Mohamad and Ramayah, 2011).
1.2. The CETSCALE
The CETSCALE is 17-item scale that measures CE by utilizing a seven-point Likert scale for each item (ranging from strongly disagree to strongly agree). It was originally developed for the USA, but later its international validity was confirmed by many studies, also its reliability and validity were confirmed by a number of researchers (Stere and Trajani, 2015). Higher overall CETSCALE score means higher level of ethnocentrism.
The CETSCALE was originally developed as unidimensional scale and has been confirmed by many researchers to be one, there is a substantial group of authors that perceive this model as multidimensional, most commonly two-dimensional with hard and soft ethnocentrism (Teo, Mohamad and Ramayah, 2011). Jiménez-Guerrero et al. (2014) have done an incredible feet in analysing all the available CETSCALE research, confirming the notion to believe the two-dimensionality and the necessity to develop newer adapted CETSCALE construct.
The utilization of CETSCALE is different with different authors, for example Mangnale, Potluri and Degufu (2011) describe it as a three step process, which starts with verification of reliability through Cronbach’s alpha coefficients, continues with CE mean score indicating its strength, and final step is finding the dependency on demographic factors.

3
The CETSCALE has many critics. Sharma (2012) did an extensive literature review and found out the same reported misbalances as were described in 1.1 of this article. Furthermore, Sharma (2012) reconceptualises CE as a three-dimensional construct of affective (high ethnocentric consumers prefer domestic products irrespective of their quality – emotional side of CE), cognitive (evaluation bias for domestic vs. foreign), and behavioural (purchase of domestic vs. foreign, even including repeated actions), which leads him to propose a new scale utilizing CETSCALE with other scales, such as consumer animosity, racism, patriotism, nationalism, internationalism, cosmopolitanism and others. As we can clearly see, the original CETSCALE is lacking in many areas to successfully depict current consumers.
However, the original CETSCALE is still functional for what it was designed to do, allowing researchers to fluidly adjust it or its parts to meet the researcher’s needs. Waehning (2015) designed his REGIOSCALE around the original CETSCALE, which allows him to measure region-specific purchase intentions, provide insights into motives why consumers buy regional products, again with regards to demographic factors, as well as regional cultural differences. Waehning (2015) proved that cultural value differences occur on regional level (the culture is not nation level), cultural values have significant impact on consumer purchase intent regarding regional products, and demographic factors do not influence consistently the purchase behaviour.
2. Methodology
This chapter is structured into three parts, the first part explains the research process, the second deals with the samples, and third with hypothesis.
2.1. The research process
To measure consumer ethnocentrism, the CETSCALE scale will be used, with 5 point Likert-scale (where 1 means strongly disagree, 5 strongly agree). There are other possibilities and some criticism (as has been shown in the first chapter), but the CETSCALE reliably depicts the notion to behave in a certain way that the author thinks will have possible monetization possibilities. CETSCALE is also internationally validated scale.
To utilize CETSCALE, which is basically a battery of 17 questions, a questionnaire research has to be carried out. The samples are described in the following subchapter. Hypotheses will be set. The results of the 2017 research will be compared with the 2014 research (2013 data), analysed and interpreted, conclusions will be drawn out, discussed, hypotheses tested.
2.2. The sample
The research took place in Moravian-Silesian Region of the Czech Republic. Only one region was selected due to culture not being shared throughout the whole nation, causing different consumer behaviour in each part of the country. Also the MS Region has a strong tradition in regional products, markets and events, making it a potentially commercially viable for campaigns utilizing CE motives. According to the Czech Statistical Office (further as CSO, 2017), the region has suffered a decline of inhabitants from 1.048.000 in 2013 to 1.033.000 in 2016, in the category of 15+. With the confidence level of 95% and margin of error 5%, the sample needs to be 385+ respondents (Raosoft, 2004).

4
The data from 2013 (published in Stoklasa, Starzyczná and Zotyková, 2014) present a statistically representative sample of MS Region based on basic demographic factors gender, age, education and income. Several thousand people were approached with questionnaires, first by utilizing random choice, data were checked for their validity and reliability, data matrix was created for IBM SPSS. The sample was thinned to have the necessary representability according to the CSO data, quota sampling was utilized to get some specific demographic variations to fill the gaps. In the end the sample consisted of 414 respondents with as close to demographic profile of the MS Region as possible, see Table 1.
In 2017, the time, personnel and financial constraints didn’t allow to have such a great sample, we also see some developing consumer resistance to questionnaire research, but nevertheless the sample is quasi-representative on several levels. The data were collected by random choice, checked for their validity and reliability, data matrix of the sample created for 617 respondents, thinned to 439 to be as representative according to demographic factors as possible, with no further data collection to correct the sample in some necessary demographic factors variants, see Table 1.
Tab. 1: Demographic characteristics of the samples Factor Category Target 2013
(in %) Actual relative 2013 (in %)
Target 2017 (in %)
Actual relative 2017 (in %)
Gender Female 51 51 51 54.6
Male 49 49 49 45.4
Age 15-24 14 13.8 12.3 9.3
25-34 16.4 16.2 15.8 20.1
35-44 18.1 18.1 18.5 19.8
45-54 15.9 15.7 15.9 17.8
55-64 16.4 16.4 16.3 15.3
65-74 11.8 12.6 13.1 11.3
75+ 7.4 7.2 8.1 6.4
Education Primary or none
18.3 18.1 17.1 15.6
Secondary 37.1 37.4 35.7 30.3
Secondary diploma
31.7 31.6 31.7 38.9
Tertiary 12.9 12.8 15.3 15.2
Income 10.000 CZK 39.7 39.6 37.0 27.8
10-20.000 CZK 53.6 53.6 55.0 58.1
20-30.000 CZK 5.8 5.8 6.4 11.2
30.000+ CZK 0.8 1.0 1.5 2.9
Source: Stoklasa, Starzyczná and Zotyková, 2014 for the 2013 data, own research for the 2017 data
In those 4 years, we can see shifts in distribution of different age groups, mainly the
population getting older, rising number of university degrees, and rising income levels. We can clearly see that the first sample is more accurate to demographic factors of the MS Region, simply due to much bigger budget allowing to employ professionals to manually gather the data, versus utilizing mostly online data gathering in 2017.

5
2.3. Hypotheses
The working hypotheses are set as follows:
H1: CETSCALE has good consistency and reliability for measuring consumer ethnocentrism.
H2: Gender does not affect consumer ethnocentrism.
H3: Age does not affect consumer ethnocentrism.
H4: Education does not affect consumer ethnocentrism.
H5: Income does not affect consumer ethnocentrism.
These working hypotheses will then be transformed into statistical hypotheses, where every demographic factor has H0 hypothesis of a statistically insignificant impact and H1 alternative hypothesis.
3. Research results and discussion
This chapter is divided into three parts, where in first the results of the research are presented, in second the hypotheses are tested, and in third the results are interpreted and discussed with some further implications.
3.1. Research results of Consumer Ethnocentrism in MS Region
The first step of work with CETSCALE is the verification of its consistency, and therefore reliability to measure consumer ethnocentrism. That is done through Cronbach's Alpha that has according to Mangnale, Potluri and Degufu (2011) the following scale: > 0.9 excellent, > 0.8 good, > 0.7 acceptable, > 0.6 doubtful, > 0.5 weak, and < 0.5 unacceptable. The results are as follows: for 2013 it is 0.802, and for 2017 it is 0.843, therefore, the reliability of CETSCALE is considered good. The mean score is due to only 5 point Likert scale in the range of 17-85, for 2013 it is 52.26, and for 2017 it is 56.38.
Tab. 2: CETSCALE reliability analysis
Scale No. of Items Cronbach's Alpha Mean SD
CETSCALE 2013 17 0.802 52.26 11.881
CETSCALE 2017 17 0.843 56.38 10.994
Source: Stoklasa, Starzyczná and Zotyková, 2014 for the 2013 data, own research for the 2017 data
The CETSCALE itself contains 17 items. The questions have been reworded for use in the
Czech Republic. The higher the mean is, the stronger the agreement with the statement. We can see that some items are exceptionally strong, such as numbers 1, 4, 5, 6, 9, 12 and 16 in 2013, and items 1, 8, 9, 13 and 16 in 2017. In 2017 the consumers seem to have much stronger opinions with means substantially higher for these aforementioned questions, some other are then significantly lower, namely 14, 15 and 17.
Tab. 3: Results for CETSCALE in MS Region 2013 and 2017
No. Item Mean (2013)
SD (2013)
Rel. (2013)
Mean (2017)
SD (2017)
Rel. (2017)

6
1 Czech customers should always buy Czech products instead of imports
3.95 1.354 0.853 4.26 1.003 0.885
2 Only those products that are unavailable in the CR should be imported
2.61 1.473 0.847 2.91 1.147 0.871
3 Buy Czech products. Keep Czechs working
3.80 1.630 0.852 3.82 1.365 0.875
4 Czech products, first, last, and foremost 3.91 1.363 0.854 4.32 1.057 0.895
5 Purchasing foreign-made products is un-Czech
3.92 1.375 0.836 3.89 1.251 0.893
6 It is not right to purchase foreign made products, because it puts Czechs out of jobs
3.86 1.602 0.851 3.64 1.392 0.861
7 A real Czech should always buy Czech products
1.81 1.291 0.838 2.14 1.196 0.881
8 We should purchase products manufactured in CR instead of letting other countries get rich off us
3.15 1.639 0.839 4.23 1.003 0.872
9 It is always best to purchase Czech products
3.92 1.375 0.853 4.25 1.068 0.873
10 There should be very little trading or purchasing of goods from other countries unless really necessary
2.24 1.165 0.831 2.46 1.165 0.846
11 Czechs should not buy foreign products, because this hurts Czech business and causes unemployment
2.58 1.474 0.835 2.62 1.374 0.887
12 Curbs should be put on all imports 3.82 1.626 0.854 3.64 1.354 0.895
13 It may cost me in the long run but I prefer to support Czech products
2.62 1.480 0.832 4.01 1.167 0.853
14 Foreigners should not be allowed to put their products on our market
2.24 1.165 0.831 2.23 1.042 0.856
15 Foreign products should be taxed heavily to reduce their entry into CR
2.23 1.165 0.862 2.17 1.034 0.861
16 We should buy from foreign countries only those products that we cannot obtain within our own country
3.80
1.630
0.853
4.05
1.001
0.889
17
Czech consumers who purchase products in other countries are responsible for putting their fellow Czechs out of work
1.80 1.261 0.829 1.74 1.384 0.848
Source: Stoklasa, Starzyczná and Zotyková, 2014 for the 2013 data, own research for the 2017 data
3.2. Hypotheses testing
H1 can be accepted based on the score of Cronbach's Alpha, which was 0.802 in 2013, and 0.843 in 2017, both meaning good reliability.
According to Mangnale, Potluri and Degufu (2011), we can test the dependency of consumer ethnocentrism on demographic factors utilizing the analysis of variance ANOVA. This allows to verify whether random variables of a certain individual characteristic have a statistically significant effect on observed values of another individual character. The test is a comparison of the CE mean score with respective demographic factors, at the significance level α = 0.05, i.e. 5%.

7
Tab. 3: ANOVA results for hypotheses 2-5
Hypothesis F (2013) P-value (2013) F (2017) P-value (2017)
H2 0.798 0.372 0.832 0.451
H3 0.744 0.615 16.045 0.000
H4 37.102 0.000 17.461 0.000
H5 196.199 0.000 32.897 0.000
Source: Stoklasa, Starzyczná and Zotyková, 2014 for the 2013 data, own research for the 2017 data
Based on the results seen in Table 3, we can conclude that the statistically significant
impact of education and net monthly income on consumer ethnocentrism can be confirmed, in 2017 also the age category. The gender has no statistically significant impact on consumer ethnocentrism, in 2013 also the age category.
3.3. Discussion
The overall strength of CE was measured 52.26 in 2013 and even 56.38 in 2017, meaning 61.5 and 66.3% of the overall possible score, making the Moravian-Silesian Region strongly ethnocentric region. If we compare it with other CETSCALE research done, we can find MS Region at the top with this score (Teo, Mohamad and Ramayah, 2011).
The questions in CETSCALE can be grouped into thematic groups, authors argue about the number of groups, but mostly settle on 3 or 4. The groups are: preference of Czech products (1, 4, 8, 9 and 13), negative perception of foreign products (5, 12, 15 and 16), foreigner animosity and national pride (2, 7, 10, 12 and 14), employment support (3 and 6, 11 and 17).
In 2013, questions with the highest scores were 1, 3, 4, 5, 6, 9, 12, and 16, all ranged from 3.80 to 3.95. In 2017, our sample showed substantially higher certain scores for 1, 8, 9, 13 and 16, all ranged over 4.0, with some over 4.2, some other are then significantly lower, namely 14, 15 and 17.
In 2014, we have said that the data shows consumers in the MS region prefer their Czech products and have a negative attitude towards foreign products. We have concluded that this region is therefore suitable for product protective branding with the idea of supporting local producers, i.e. regional branding. Strongly ethnocentric minded consumers in the region prefer to purchase products from local regions and do not want to buy products from elsewhere, which could jeopardize their local products. The third group of employment support is probably due to the high unemployment rate in the region. The questions worded with ‘Czech’ all had low scores. (Stoklasa, Starzyczná and Zotyková, 2014)
In 2017, we can still observe strong evidence of consumers in this region being highly ethnocentric, supporting local products and local producers. Consumers are also perceiving all foreign products negatively. Only with the employment support we can see decline, probably connected with the better economic situation in the region and decreasing unemployment rates.
Highly interesting are the results of the dependence of CE on the demographic factors. In 2014, only education and net monthly income were proven to have statistically significant impact on CE, in 2017 also the age categories. This has many potential implications for companies wanting to utilize the knowledge about CE in MS Region. Firstly, it can surely be

8
utilized in the product area of marketing mix, realizing that local products are sought after is a good basis for all the MSEs struggling on the market. But mostly the author sees incredible potential to create tailor made marketing communication campaigns directed at the age groups 35-44 and 45-54, with university and high school diploma, and high/er income. This knowledge can be monetized when designing the target groups for communication of the products, when choosing the correct communication tools and media for these groups, and when creating the communication message. It can also serve importing companies to comprehend how their communication of foreign products has to be adjusted in order to be successful in strongly CE region.
Conclusion
This article presents the research of Consumer Ethnocentrism in Moravian-Silesian Region. It uses the CETSCALE scale developed by Shimp and Sharma (1987). The literature overview documented the historical evolution of consumer ethnocentrism as a concept usable for marketing purposes, it also described the CETSCALE, and revealed certain problem areas of the CETSCALE and some criticism. The research was designed in a way to avoid certain problem areas and test other, namely the dependency of CE on demographic factors, which is surrounded by a debate in other research which factors influence it and how.
The research took place in the Moravian-Silesian Region and the sample consisted of 439 respondents. All the data is compared with our previous research from 2013 published in Stoklasa, Starzyczná and Zotyková, 2014. According to Cronbach's Alpha, the data is consistent and therefore our CETSCALE reliable to explain CE. The main findings are the strength of the CE is as high as 66.3% of the overall possible score, which ranks this region amongst ones with the highest CE. In both, the 2013 and 2017 data, we can observe strong evidence of consumers in this region being highly ethnocentric, supporting local products and local producers, with negative perception of foreign products. Only the employment support declined in 2017, which is probably connected to the better economic situation in the region and decreasing unemployment rates. Highly interesting are the results of the dependence of CE on the demographic factors. In 2014, only education and net monthly income were proven to have statistically significant impact on CE, in 2017 also the age categories.
There are some limitations and constraints of this research. The sample in 2013 was more representative according to the sought after demographic factors, than our research in 2017, which shows certain deviations. In the future work, it would be beneficial to test two-dimensionality of CETSCALE, CETSCALE 10, and compare the results with competing models, such as REGIOSCALE or CES.
References
[1] CSO. Statistical yearbook of the Moravskoslezský Region, 2016. [online]. [2017-17-01]. Available from: https://www.czso.cz/documents/10180/32493487/33010016.pdf/d29a79fc-4c59-42cf-8a7c-1caab8f81997?version=1.11.
[2] Erdogan, B. Z. and C. Uzkurt, 2010. Effects of ethnocentric tendency on consumers’ perception of product attitudes for foreign and domestic products. Cross Cultural Management: An International Journal, vol. 17, no. 4, pp. 393-406.

9
[3] Jiménez-Guerrero, J. F., Gázquez-Abad, J. C. and E. Linares-Agüera, 2014. Using standard CETSCALE and other adapted versions of the scale for measuring conumers ethnocentric tendencies: An analysis of dimensionality. Business Research Quarterly, vol. 17, no. 3, pp. 174-190.
[4] Koudelka, J., 1997. Spotřební chování a Marketing. Praha: Grada Publishing. [5] Mangnale, V. S., Potluri R. M. and H. Degufu, 2011. A study on Ethnoscentric Tendencies
of Ethopian Consumers. Asian Journal of Business Management, vol. 3, no. 4, pp. 241-250.
[6] Raosoft. Sample size calculator, 2004. [online]. [2017-17-01]. Available from: http://www.raosoft.com/samplesize.html.
[7] Shankaharmahesh, M. N., 2006. Consumer ethnocentrism: an integrative review of its antecedents and consequences. International Marketing Review, vol. 23, no. 2, pp. 146-172.
[8] Sharma, P., 2012. Consumer Ethnocentrism: Reconceptualization and Cross-Cultural Validation. AP - Asia-Pacific Advances in Consumer Research, Vol. 10, no. 1, pp. 26-28.
[9] Shimp, T. and S. Sharma, 1987. Consumer Ethnocentrism: Construction and Validation of the Cetscale. Journal of Marketing Research, vol. 14, no. 1, pp. 280-289.
[10] Stere, S. and B. Trajani, 2015. Revie of the theoretical and empirical literature of consumer ethnocentrism. Social Sciences and Education Research Review, vol. 2, no. 1, pp. 44-51.
[11] Stoklasa, M., H. Starzyczná and L. Zotyková, 2014. Consumer Ethnocentrism in MS Region. International Journal of Social, Management, Economics and Business Engineering, vol. 8, no. 3, pp. 750-753.
[12] Sumner, W. G., 2007. Folkways: A Study of Mores, Manners, Customs and Morals. New York: Cosimo.
[13] Teo, P. CH., Mohamad, O and T. Ramayah, 2011. Testing the dimensionality of Consumer Ethnocentrism Scale (CETSCALE) among a young Malaysian consumer market segment. African Journal of Business Management, vol. 5, no. 7, pp. 2805-2816.
[14] Waehning, N., 2015. Consumer motives to purchase regional products: the relationship with regional cultural differences and demographic cariables. Doctoral thesis, Unviersity of Hull.