Embed Size (px)
Citation preview
FYE March FYE March 20132013
SecondSecond QuarterQuarterSecond Second QuarterQuarterFinancialFinancial BriefingBriefing
A Technology and Intelligence Oriented Companythat Turns Wisdom into Business
NAGASE & CO., LTD.NAGASE & CO., LTD.November 22, 2012
Contents Contents
• FYE March 2013 Second Quarter Results
• FYE March 2013 Earnings Projections
• Status of Hayashibara Business
FYEFYE MarchMarch 20132013 Second QuarterSecond Quarter ResultsResultsFYE FYE March March 20132013 Second QuarterSecond Quarter ResultsResults
Consolidated Results
(Billi f )
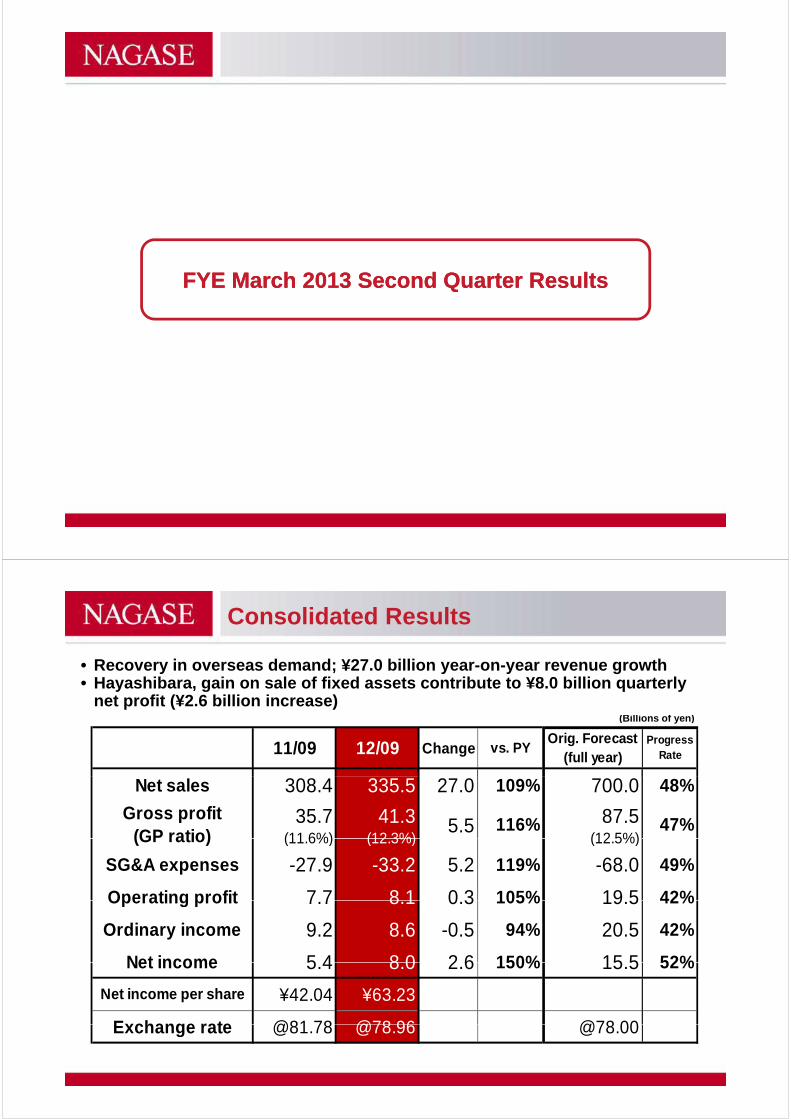
• Recovery in overseas demand; ¥27.0 billion year-on-year revenue growth• Hayashibara, gain on sale of fixed assets contribute to ¥8.0 billion quarterly
net profit (¥2.6 billion increase)(Billions of yen)
11/09 12/09 Change vs. PYOrig. Forecast
(full year)Progress
Rate
Net sales 308.4 335.5 27.0 109% 700.0 48%
Gross profit(GP ratio)
35.7(11 6%)
41.3(12 3%)
5.5 116% 87.5(12 5%)
47%(GP ratio) (11.6%) (12.3%) (12.5%)
SG&A expenses -27.9 -33.2 5.2 119% -68.0 49%
Operating profit 7 7 8 1 0 3 105% 19 5 42%Operating profit 7.7 8.1 0.3 105% 19.5 42%
Ordinary income 9.2 8.6 -0.5 94% 20.5 42%
Net income 5 4 8 0 2 6 150% 15 5 52%Net income 5.4 8.0 2.6 150% 15.5 52%
Net income per share ¥42.04 ¥63.23
Exchange rate @81 78 @78 96 @78 00Exchange rate @81.78 @78.96 @78.00
Net Sales by Region (Domestic, Overseas)Net Sales by Region (Domestic, Overseas)
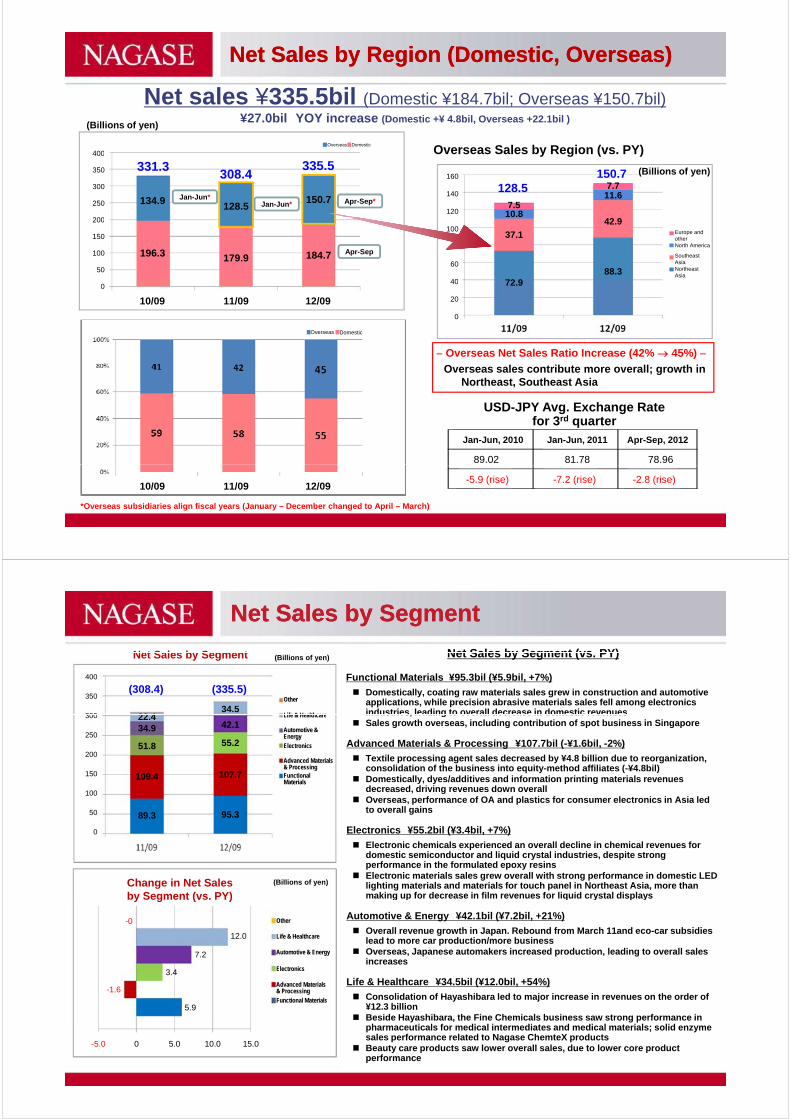
Net sales ¥335 5bil (D ti ¥184 7bil O ¥150 7bil)Net sales ¥335.5bil (Domestic ¥184.7bil; Overseas ¥150.7bil)¥27.0bil YOY increase (Domestic +¥ 4.8bil, Overseas +22.1bil )
Overseas Sales by Region (vs. PY)
(Billions of yen)
Overseas Domestic
400 y g ( )
Apr-Sep*Jan-Jun*Jan-Jun*134.9 128.5
150.7
331.3308.4
335.5400
350
300
250
200
160
140
1207.5
128.5
10.8
7.7150.7
11.6
(Billions of yen)
Apr-Sep196.3 179.9 184.7
200
150
100
50
Europe and otherNorth America
Southeast AsiaNortheast Asia
100
80
60
40
37.1
72 9
42.9
88.3
040
20
0
72.9
Overseas Domestic
10/09 11/09 12/09
Overseas Net Sales Ratio Increase (42% 45%) Overseas sales contribute more overall; growth in
Northeast, Southeast Asia
USD JPY A E h R tUSD-JPY Avg. Exchange Rate for 3rd quarter
Jan-Jun, 2010 Jan-Jun, 2011 Apr-Sep, 2012
89.02 81.78 78.96
*Overseas subsidiaries align fiscal years (January – December changed to April – March)
-5.9 (rise) -7.2 (rise) -2.8 (rise)10/09 11/09 12/09
Net Sales by SegmentNet Sales by Segment
Net Sales by Segment (vs PY)Net Sales by Segment Net Sales by Segment (vs. PY)
Functional Materials ¥95.3bil (¥5.9bil, +7%)
Domestically, coating raw materials sales grew in construction and automotive applications, while precision abrasive materials sales fell among electronics industries, leading to overall decrease in domestic revenues
Net Sales by Segment (Billions of yen)
Other
Life & Healthcare
(308.4)
22 4
(335.5)
34.5
400
350
300 industries, leading to overall decrease in domestic revenues Sales growth overseas, including contribution of spot business in Singapore
Advanced Materials & Processing ¥107.7bil (-¥1.6bil, -2%)
Textile processing agent sales decreased by ¥4.8 billion due to reorganization, consolidation of the business into equity-method affiliates (-¥4.8bil)
D ti ll d / dditi d i f ti i ti t i l
Life & Healthcare
Automotive & Energy
Electronics
Advanced Materials & ProcessingFunctional
22.434.9
51.8
109 4
42.1
55.2
107.7
300
250
200
150 Domestically, dyes/additives and information printing materials revenues
decreased, driving revenues down overall Overseas, performance of OA and plastics for consumer electronics in Asia led
to overall gains
Electronics ¥55.2bil (¥3.4bil, +7%)
Functional Materials
109.4
89.3
107.7
95.3
100
50
0
Electronic chemicals experienced an overall decline in chemical revenues for domestic semiconductor and liquid crystal industries, despite strong performance in the formulated epoxy resins
Electronic materials sales grew overall with strong performance in domestic LED lighting materials and materials for touch panel in Northeast Asia, more than making up for decrease in film revenues for liquid crystal displays
Change in Net Sales by Segment (vs. PY)
(Billions of yen)
Automotive & Energy ¥42.1bil (¥7.2bil, +21%)
Overall revenue growth in Japan. Rebound from March 11and eco-car subsidies lead to more car production/more business
Overseas, Japanese automakers increased production, leading to overall sales increases
y g ( )
Other
Life & Healthcare
Automotive & Energy
-0
12.0
7.2increases
Life & Healthcare ¥34.5bil (¥12.0bil, +54%)
Consolidation of Hayashibara led to major increase in revenues on the order of ¥12.3 billion
Beside Hayashibara, the Fine Chemicals business saw strong performance in h ti l f di l i t di t d di l t i l lid
Electronics
Advanced Materials & Processing
Functional Materials
-1.6
3.4
5.9
pharmaceuticals for medical intermediates and medical materials; solid enzyme sales performance related to Nagase ChemteX products
Beauty care products saw lower overall sales, due to lower core product performance
-5.0 0 5.0 10.0 15.0
Gross Profit by SegmentGross Profit by Segment
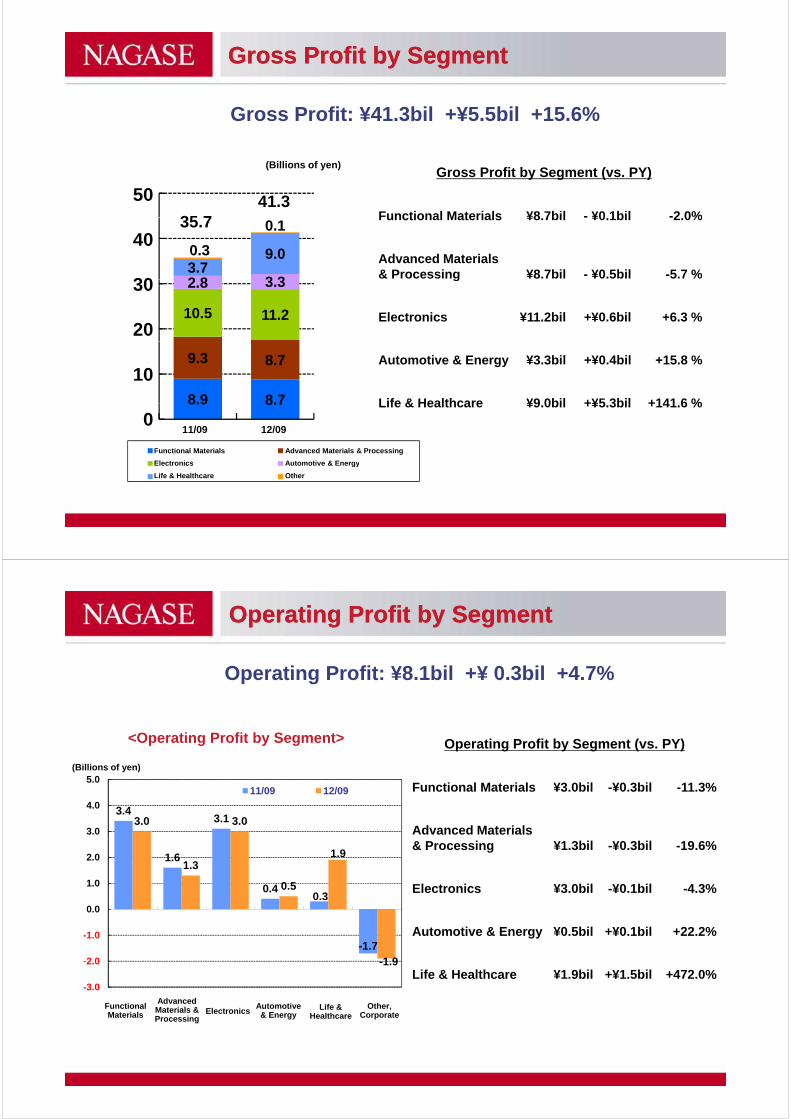
Gross Profit: ¥41.3bil +¥5.5bil +15.6%
50050Gross Profit by Segment (vs. PY)
Functional Materials ¥8 7bil - ¥0 1bil -2 0%41.3
35 7
(Billions of yen)
2 8 3 33.7
9.00.3
0.1
300
40040
30
Functional Materials ¥8.7bil - ¥0.1bil -2.0%
Advanced Materials & Processing ¥8.7bil - ¥0.5bil -5.7 %
35.7
10.5 11.2
2.8 3.3
200
30030
20
g
Electronics ¥11.2bil +¥0.6bil +6.3 %
8.9 8.7
9.3 8.710010
Automotive & Energy ¥3.3bil +¥0.4bil +15.8 %
Life & Healthcare ¥9 0bil +¥5 3bil +141 6 %8.9 8.7
0
機能素材 加工材料電子 自動車・エネルギー
011/09 12/09
Life & Healthcare ¥9.0bil +¥5.3bil +141.6 %
Advanced Materials & Processing
Automotive & Energy
Functional Materials
Electronics電子 自動車 エネルキ生活関連 その他
Automotive & Energy
Other
Electronics
Life & Healthcare
Operating Profit by SegmentOperating Profit by Segment
Operating Profit: ¥8.1bil +¥ 0.3bil +4.7%
<Operating Profit by Segment>
5 0
Operating Profit by Segment (vs. PY)
(Billions of yen)
3.43.13.0 3.0
3.0
4.0
5.011/09 12/09 Functional Materials ¥3.0bil -¥0.3bil -11.3%
Advanced Materials
1.6
0.40.3
1.3
0.5
1.9
1.0
2.0& Processing ¥1.3bil -¥0.3bil -19.6%
Electronics ¥3.0bil -¥0.1bil -4.3%
-1.7
-1 9-2 0
-1.0
0.0
Automotive & Energy ¥0.5bil +¥0.1bil +22.2%
-1.9
-3.0
2.0
Functional Materials
Advanced Materials & Processing
ElectronicsAutomotive & Energy
Other,Corporate
Life & Healthcare ¥1.9bil +¥1.5bil +472.0%
Life & Healthcare
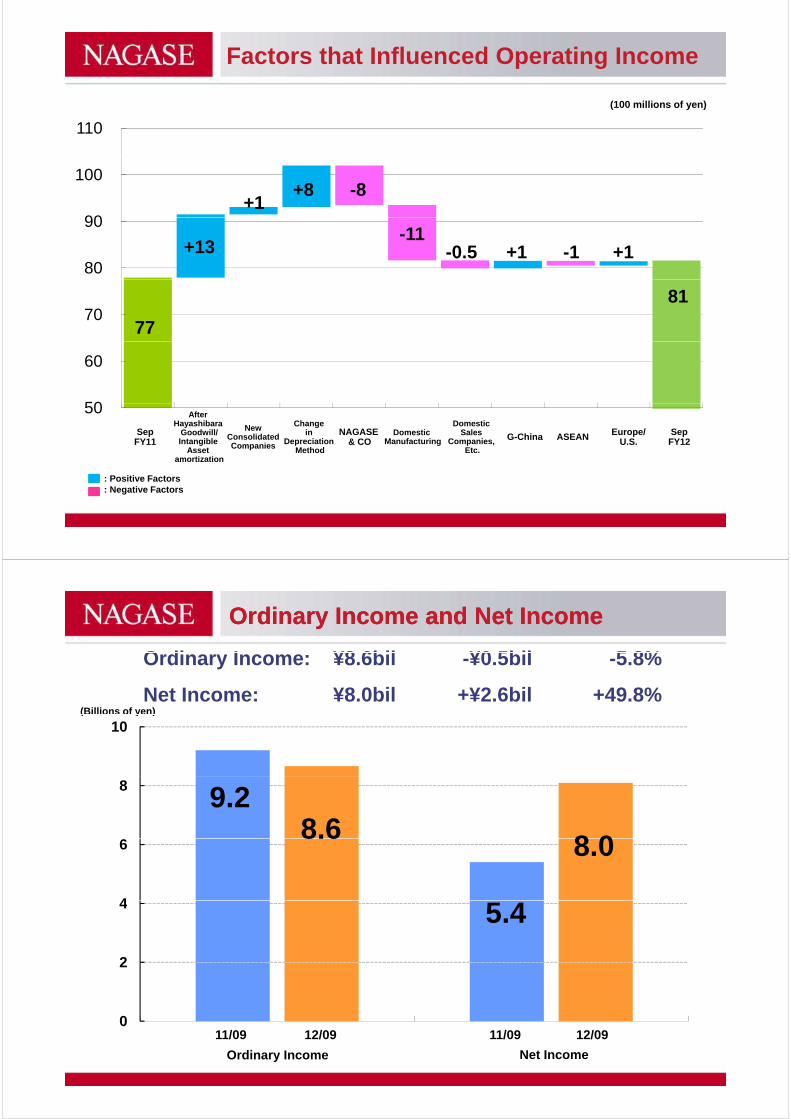
Factors that Influenced Operating Income
(100 millions of yen)
110
90
100
+1+8 -8
80
90
+13 +1-11
-0.5 -1 +1
70 77
81
50
60
SepFY11
After Hayashibara
Goodwill/Intangible
Asset amortization
G-China SepFY12
Change in
Depreciation Method
50 New
ConsolidatedCompanies
NAGASE & CO
DomesticManufacturing
Domestic Sales
Companies, Etc.
Europe/U.S.ASEAN
: Positive Factors: Negative Factors
Ordinary Income and Net IncomeOrdinary Income and Net Income
O di I ¥8 6bil ¥0 5bil 5 8%Ordinary Income: ¥8.6bil -¥0.5bil -5.8%
Net Income: ¥8.0bil +¥2.6bil +49.8%(Billions of yen)
10( y )
9.28.6
8 0
8
8.68.0
4
6
5.4
2
4
0
2
0
Ordinary Income Net Income
11/09 11/09 12/0912/09
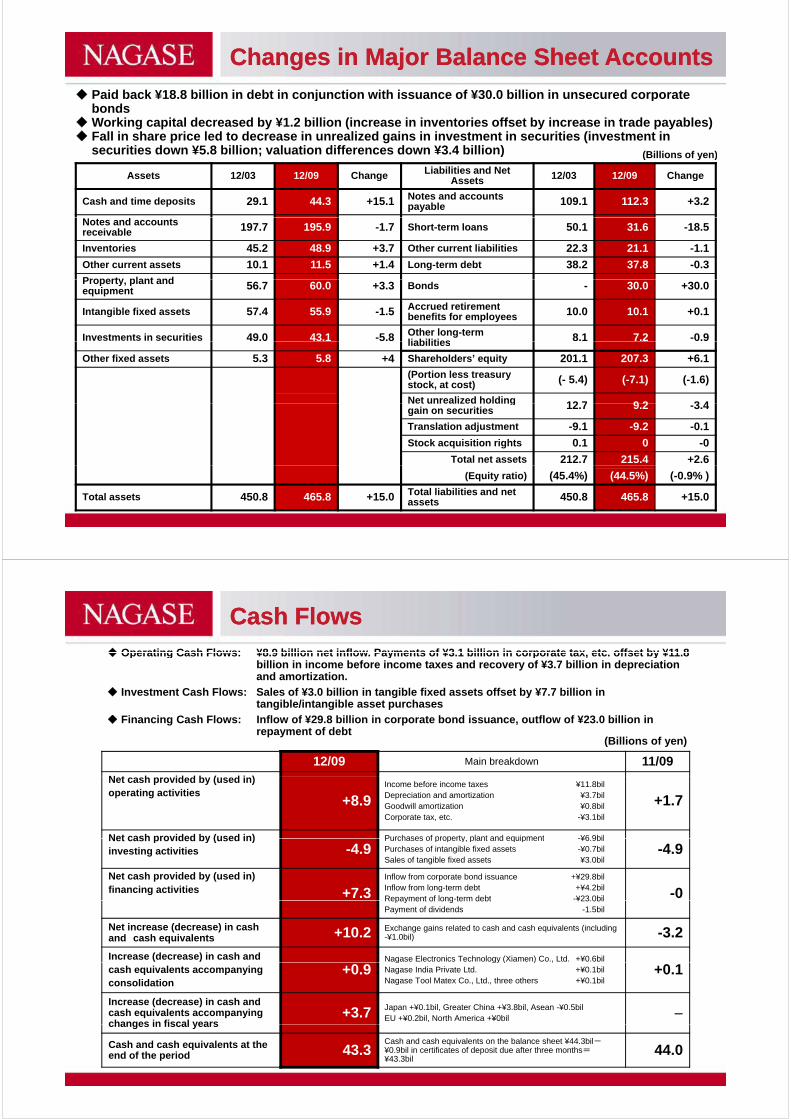
Changes in Major Balance Sheet AccountsChanges in Major Balance Sheet Accounts
Paid back ¥18 8 billion in debt in conjunction with issuance of ¥30 0 billion in unsecured corporate Paid back ¥18.8 billion in debt in conjunction with issuance of ¥30.0 billion in unsecured corporate bonds
Working capital decreased by ¥1.2 billion (increase in inventories offset by increase in trade payables) Fall in share price led to decrease in unrealized gains in investment in securities (investment in
securities down ¥5.8 billion; valuation differences down ¥3.4 billion) (Billions of yen); ) (Billions of yen)
Assets 12/03 12/09 Change Liabilities and Net Assets 12/03 12/09 Change
Cash and time deposits 29.1 44.3 +15.1 Notes and accounts payable 109.1 112.3 +3.2
Notes and accountsreceivable 197.7 195.9 -1.7 Short-term loans 50.1 31.6 -18.5
Inventories 45.2 48.9 +3.7 Other current liabilities 22.3 21.1 -1.1
Other current assets 10.1 11.5 +1.4 Long-term debt 38.2 37.8 -0.3
Property plant andProperty, plant andequipment 56.7 60.0 +3.3 Bonds - 30.0 +30.0
Intangible fixed assets 57.4 55.9 -1.5 Accrued retirement benefits for employees 10.0 10.1 +0.1
Investments in securities 49.0 43.1 -5.8 Other long-term liabilities 8.1 7.2 -0.9liabilities
Other fixed assets 5.3 5.8 +4 Shareholders’ equity 201.1 207.3 +6.1
(Portion less treasury stock, at cost) (- 5.4) (-7.1) (-1.6)
Net unrealized holding 12 7 9 2 3 4Net unrealized holding gain on securities 12.7 9.2 -3.4
Translation adjustment -9.1 -9.2 -0.1
Stock acquisition rights 0.1 0 -0
Total net assets 212.7 215.4 +2.6
(Equity ratio) (45.4%) (44.5%) (-0.9% )
Total assets 450.8 465.8 +15.0 Total liabilities and net assets 450.8 465.8 +15.0
Cash FlowsCash Flows Operating Cash Flows: ¥8 9 billion net inflow Payments of ¥3 1 billion in corporate tax etc offset by ¥11 8 Operating Cash Flows: ¥8.9 billion net inflow. Payments of ¥3.1 billion in corporate tax, etc. offset by ¥11.8
billion in income before income taxes and recovery of ¥3.7 billion in depreciation and amortization.
Investment Cash Flows: Sales of ¥3.0 billion in tangible fixed assets offset by ¥7.7 billion in tangible/intangible asset purchases
(Billions of yen)
Financing Cash Flows: Inflow of ¥29.8 billion in corporate bond issuance, outflow of ¥23.0 billion in repayment of debt
12/09 Main breakdown 11/09N t h id d b ( d i )Net cash provided by (used in)operating activities
+8.9Income before income taxes ¥11.8bilDepreciation and amortization ¥3.7bilGoodwill amortization ¥0.8bilCorporate tax, etc. -¥3.1bil
+1.7
Net cash provided by (used in) Purchases of property plant and equipment -¥6 9bilNet cash provided by (used in)investing activities -4.9
Purchases of property, plant and equipment -¥6.9bilPurchases of intangible fixed assets -¥0.7bilSales of tangible fixed assets ¥3.0bil
-4.9
Net cash provided by (used in)financing activities +7.3
Inflow from corporate bond issuance +¥29.8bilInflow from long-term debt +¥4.2bilRepayment of long-term debt -¥23.0bil -0Repayment of long term debt ¥23.0bilPayment of dividends -1.5bil
Net increase (decrease) in cash and cash equivalents +10.2 Exchange gains related to cash and cash equivalents (including
-¥1.0bil) -3.2
Increase (decrease) in cash and Nagase Electronics Technology (Xiamen) Co., Ltd. +¥0.6bilcash equivalents accompanyingconsolidation
+0.9g gy ( ) ,
Nagase India Private Ltd. +¥0.1bilNagase Tool Matex Co., Ltd., three others +¥0.1bil
+0.1
Increase (decrease) in cash and cash equivalents accompanying changes in fiscal years
+3.7 Japan +¥0.1bil, Greater China +¥3.8bil, Asean -¥0.5bilEU +¥0.2bil, North America +¥0bil
changes in fiscal years
Cash and cash equivalents at theend of the period 43.3
Cash and cash equivalents on the balance sheet ¥44.3bil-¥0.9bil in certificates of deposit due after three months=¥43.3bil
44.0
(Milli f )
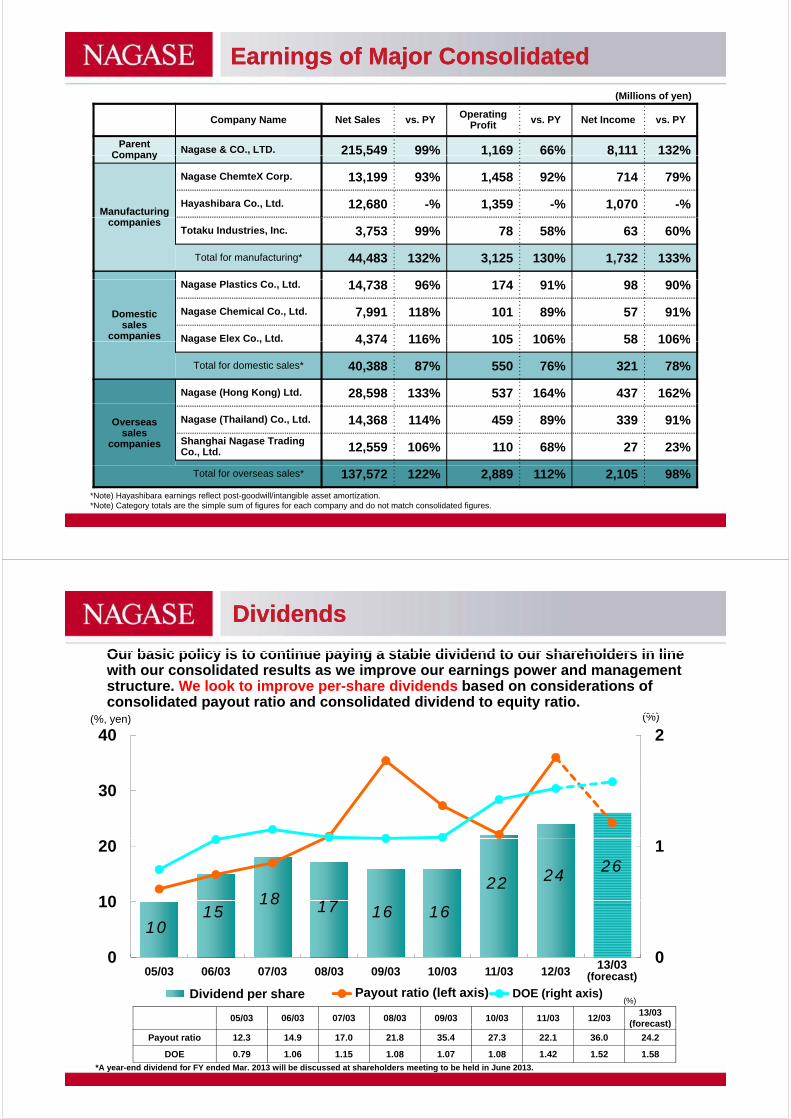
Earnings of Major ConsolidatedEarnings of Major Consolidated
(Millions of yen)
Company Name Net Sales vs. PY OperatingProfit vs. PY Net Income vs. PY
ParentCompany Nagase & CO., LTD. 215,549 99% 1,169 66% 8,111 132%Company , , ,
Manufacturing
Nagase ChemteX Corp. 13,199 93% 1,458 92% 714 79%
Hayashibara Co., Ltd. 12,680 -% 1,359 -% 1,070 -%companies
Totaku Industries, Inc. 3,753 99% 78 58% 63 60%
Total for manufacturing* 44,483 132% 3,125 130% 1,732 133%
Domesticsales
companies
Nagase Plastics Co., Ltd. 14,738 96% 174 91% 98 90%
Nagase Chemical Co., Ltd. 7,991 118% 101 89% 57 91%
Nagase Elex Co., Ltd. 4 374 116% 105 106% 58 106%Nagase Elex Co., Ltd. 4,374 116% 105 106% 58 106%
Total for domestic sales* 40,388 87% 550 76% 321 78%
Nagase (Hong Kong) Ltd. 28,598 133% 537 164% 437 162%
Overseassales
companies
Nagase (Thailand) Co., Ltd. 14,368 114% 459 89% 339 91%
Shanghai Nagase Trading Co., Ltd. 12,559 106% 110 68% 27 23%
Total for overseas sales* 137,572 122% 2,889 112% 2,105 98%
*Note) Hayashibara earnings reflect post-goodwill/intangible asset amortization.*Note) Category totals are the simple sum of figures for each company and do not match consolidated figures.
Our basic policy is to continue paying a stable dividend to our shareholders in line
DividendsDividends
Our basic policy is to continue paying a stable dividend to our shareholders in line with our consolidated results as we improve our earnings power and management structure. We look to improve per-share dividends based on considerations of consolidated payout ratio and consolidated dividend to equity ratio.
(%)(% )
240(%)(%, yen)
30
1
10
20
18 1722 24 26
00
10
1015
18 17 1616
13/03 0005/03 06/03 07/03 08/03 09/03 10/03 11/03 12/03 13/03(予)
1株当たり配当金 配当性向(左軸) DOE(右軸)Payout ratio (left axis) DOE (right axis)
05/03 06/03 07/03 08/03 09/03 10/03 11/03 12/0313/03
(forecast)
(%)Dividend per share
13/03(forecast)
(forecast)
Payout ratio 12.3 14.9 17.0 21.8 35.4 27.3 22.1 36.0 24.2
DOE 0.79 1.06 1.15 1.08 1.07 1.08 1.42 1.52 1.58
*A year-end dividend for FY ended Mar. 2013 will be discussed at shareholders meeting to be held in June 2013.
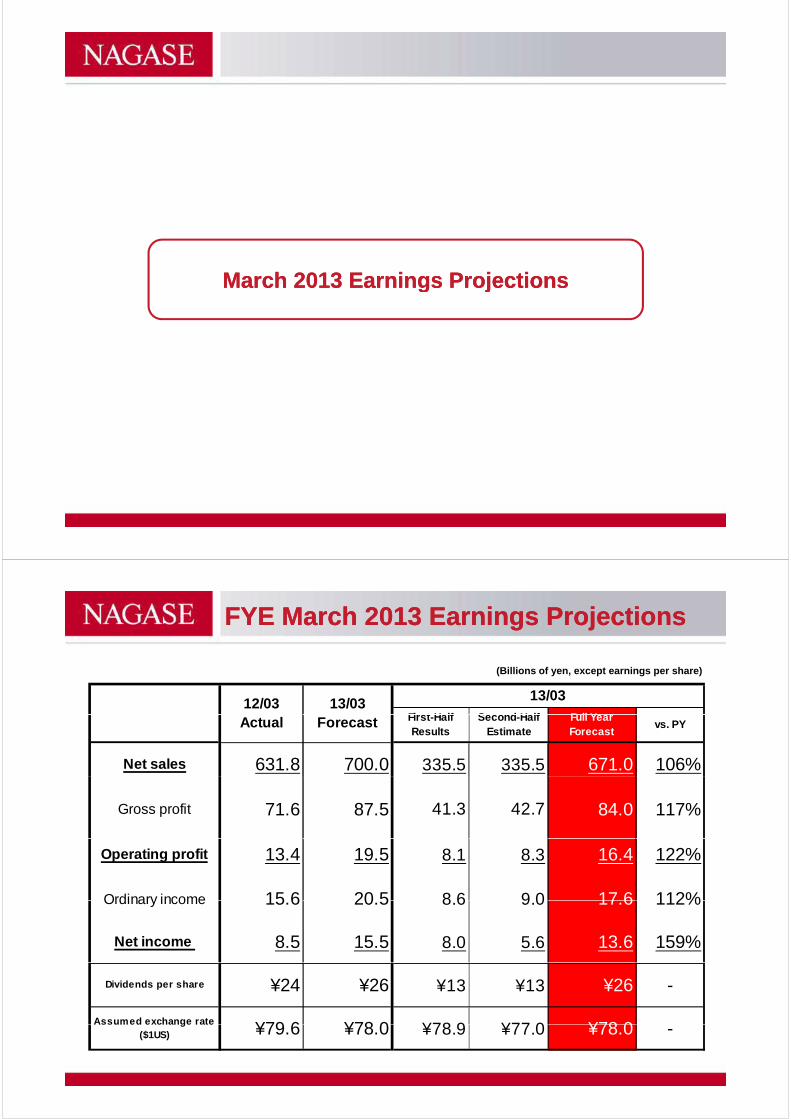
March 2013 Earnings ProjectionsMarch 2013 Earnings ProjectionsMarch 2013 Earnings ProjectionsMarch 2013 Earnings Projections
FYE March 2013 Earnings ProjectionsFYE March 2013 Earnings Projections
(Billions of yen, except earnings per share)
Fi t H lf S d H lf F ll Y
13/0312/03 13/03
First-HalfResults
Second-HalfEstimate
Full YearForecast
vs. PY
Net sales 631.8 700.0 335.5 335.5 671.0 106%
Actual Forecast
Gross profit 71.6 87.5 41.3 42.7 84.0 117%
Operating profit 13.4 19.5 8.1 8.3 16.4 122%
Ordinary income 15 6 20 5 8 6 9 0 17 6 112%Ordinary income 15.6 20.5 8.6 9.0 17.6 112%
Net income 8.5 15.5 8.0 5.6 13.6 159%
Dividends per share ¥24 ¥26 ¥13 ¥13 ¥26 -
Assumed exchange rate ¥79 6 ¥78 0 ¥78 9 ¥77 0 ¥78 0Assumed exchange rate($1US) ¥79.6 ¥78.0 ¥78.9 ¥77.0 ¥78.0 -
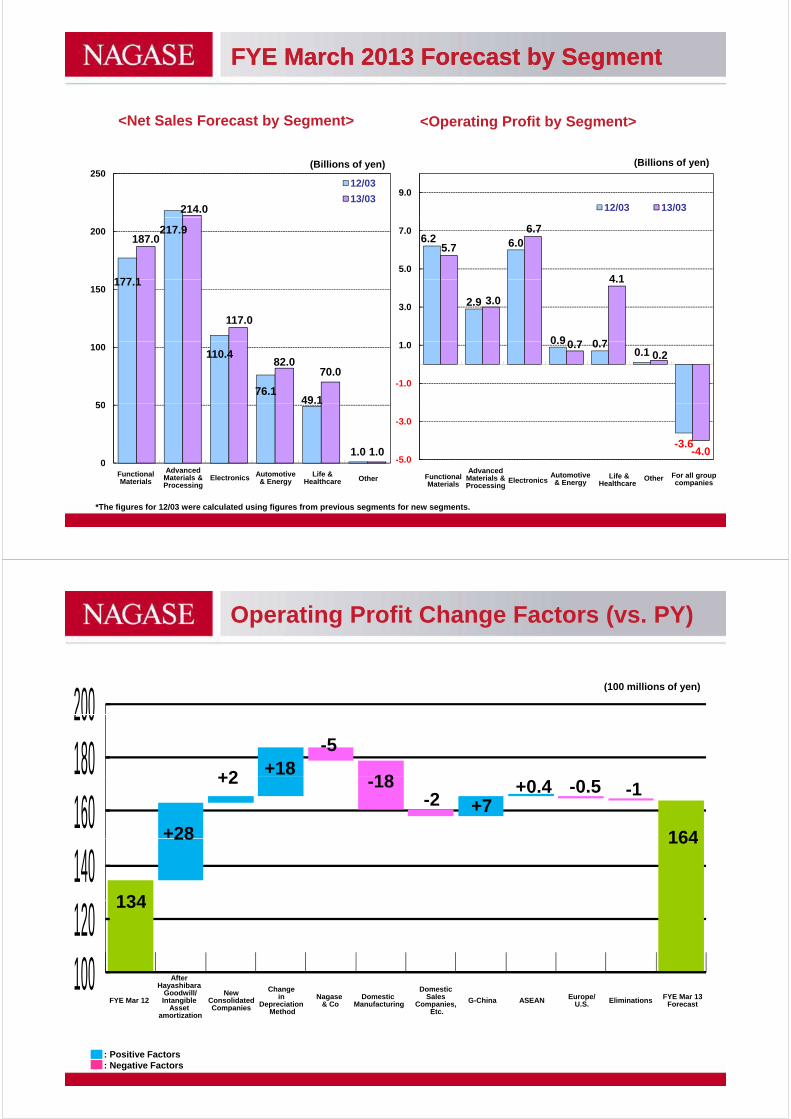
FYE March 2013 Forecast by SegmentFYE March 2013 Forecast by Segment
<Net Sales Forecast by Segment> <Operating Profit by Segment>
214.0
25012/03
13/039.0
12/03 13/03
(Billions of yen) (Billions of yen)
177 1
217.9 187.0
2006.2 6.0 5.7
6.7
4 15.0
7.0
177.1
117.0
150
2.9
0 9 0 7
3.0
0 7
4.1
3.0
110.4
76.1 49.1
82.0 70.0
50
1000.9 0.7
0.1 0.7
0.2
-1.0
1.0
49.1
1.0 1.0 0
50
-3.6-4.0
-5.0
-3.0
0FunctionalMaterials
AdvancedMaterials &Processing
Electronics Automotive& Energy
Life & Healthcare
FunctionalMaterials
AdvancedMaterials &Processing
ElectronicsLife &
HealthcareFor all groupcompanies
Other Automotive& Energy
Other
*The figures for 12/03 were calculated using figures from previous segments for new segments.
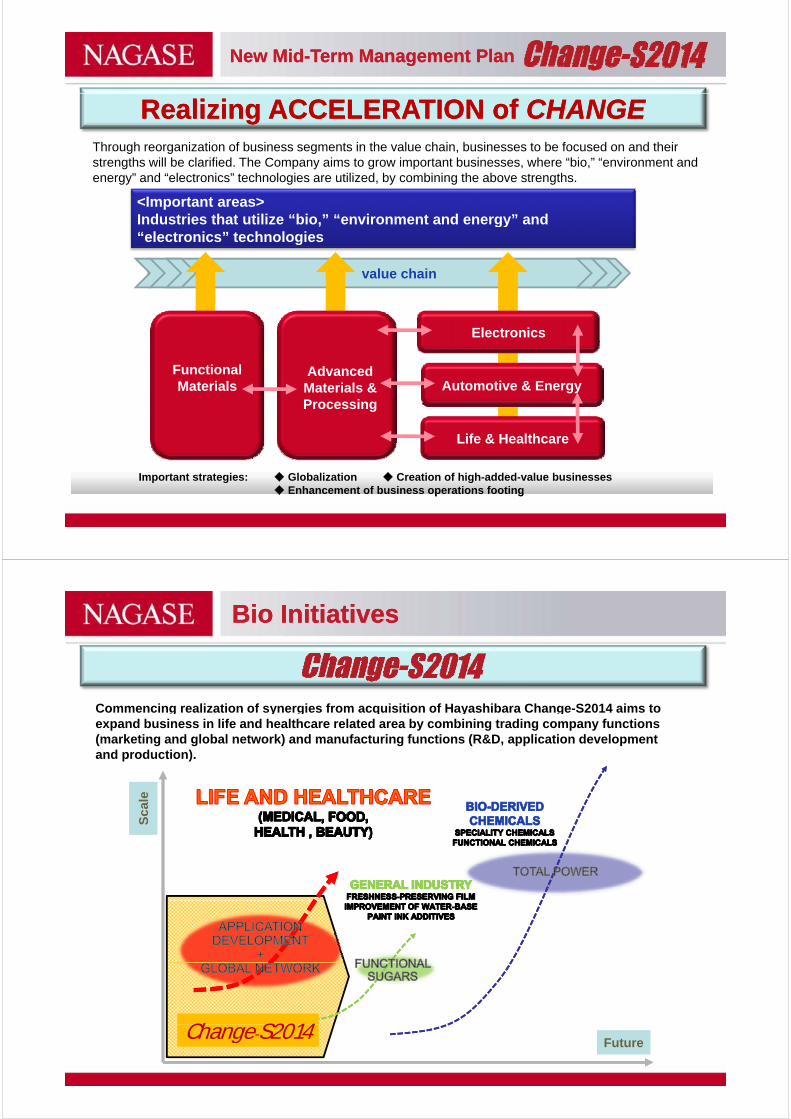
Operating Profit Change Factors (vs. PY)
200(100 millions of yen)
180200
+2 +18-5
18
160+2
+28
+7
164
-1-18-2
+0.4 -0.5
140134
28 164
100120
134
100FYE Mar 12 G-China FYE Mar 13
Forecast
Change in
Depreciation Method
EliminationsNew
ConsolidatedCompanies
Nagase & Co
DomesticManufacturing
Domestic Sales
Companies, Etc.
Europe/U.S.ASEAN
After Hayashibara
Goodwill/Intangible
Asset amortization
: Positive Factors: Negative Factors
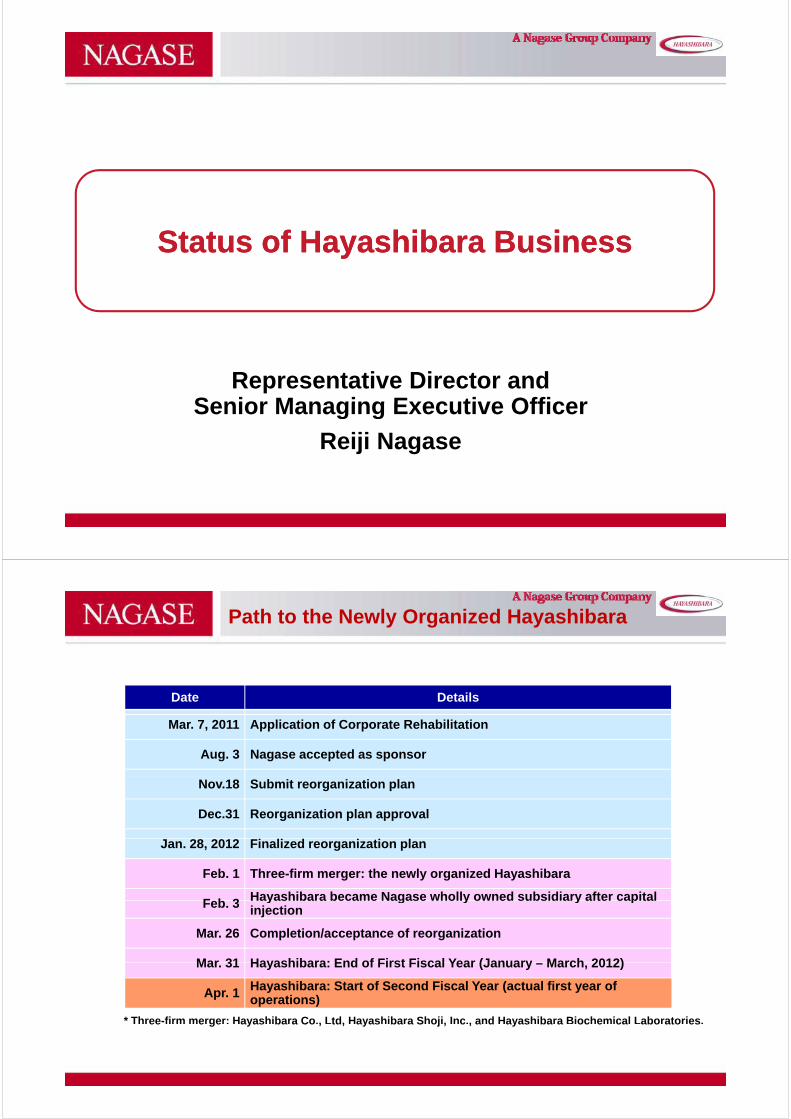
NewNew MidMid--Term Term Management Management PlanPlan
Realizing ACCELERATION of Realizing ACCELERATION of CHANGECHANGEThrough reorganization of business segments in the value chain, businesses to be focused on and theirstrengths will be clarified. The Company aims to grow important businesses, where “bio,” “environment andenergy” and “electronics” technologies are utilized, by combining the above strengths.
<Important areas>Industries that utilize “bio ” “environment and energy” and
value chain
Industries that utilize “bio,” “environment and energy” and“electronics” technologies
Electronics
Automotive & EnergyFunctional Materials
Advanced Materials & Processing
Life & Healthcare
Processing
Important strategies: ◆ Globalization ◆ Creation of high-added-value businesses◆ Enhancement of business operations footing
Important strategies: ◆ Globalization ◆ Creation of high-added-value businesses◆ Enhancement of business operations footing
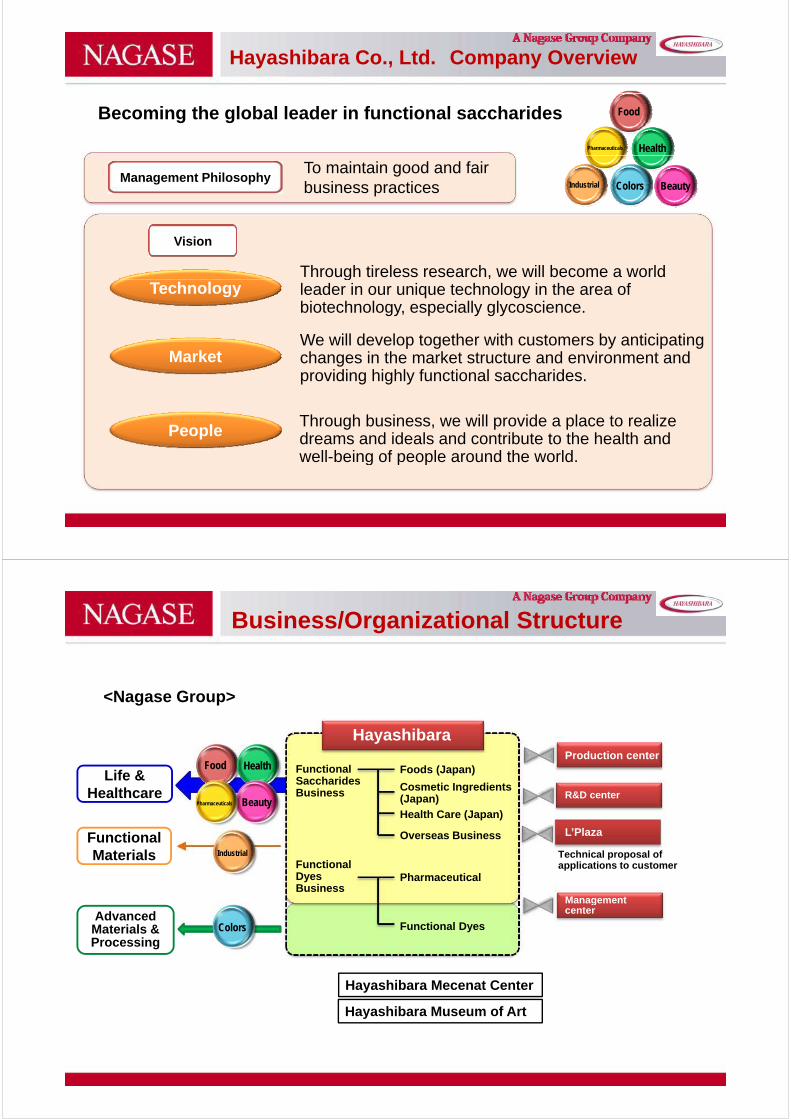
Bio InitiativesBio Initiatives
Commencing realization of synergies from acquisition of Hayashibara Change-S2014 aims tog y g q y gexpand business in life and healthcare related area by combining trading company functions(marketing and global network) and manufacturing functions (R&D, application development and production).
Sca
le
Change S2014Future
Change-S2014
Status of Hayashibara BusinessStatus of Hayashibara Business
Representative Director and Senior Managing Executive Officer
Reiji Nagase
Senior Managing Executive Officer
Path to the Newly Organized Hayashibara
Date Details
Mar. 7, 2011 Application of Corporate Rehabilitation
Aug. 3 Nagase accepted as sponsor
Nov.18 Submit reorganization plan
Dec.31 Reorganization plan approval
Jan. 28, 2012 Finalized reorganization plan
Feb. 1 Three-firm merger: the newly organized Hayashibara
F b 3 Hayashibara became Nagase wholly owned subsidiary after capitalFeb. 3 Hayashibara became Nagase wholly owned subsidiary after capital injection
Mar. 26 Completion/acceptance of reorganization
Mar 31 Hayashibara: End of First Fiscal Year (January March 2012)
* Three-firm merger: Hayashibara Co., Ltd, Hayashibara Shoji, Inc., and Hayashibara Biochemical Laboratories.
Mar. 31 Hayashibara: End of First Fiscal Year (January – March, 2012)
Apr. 1 Hayashibara: Start of Second Fiscal Year (actual first year of operations)
ee e ge ayas ba a Co , td, ayas ba a S oj , c , a d ayas ba a oc e ca abo ato es
Hayashibara Co., Ltd. Company Overview
Becoming the global leader in functional saccharides Food
Pharmaceuticals Health
To maintain good and fair business practices
Management PhilosophyIndustrial Colors Beauty
Through tireless research, we will become a world
Vision
gleader in our unique technology in the area of biotechnology, especially glycoscience.
We will develop together with customers by anticipating
Technology
We will develop together with customers by anticipating changes in the market structure and environment and providing highly functional saccharides.
Market
PeopleThrough business, we will provide a place to realize dreams and ideals and contribute to the health and well-being of people around the world.g p p
Business/Organizational Structure
<Nagase Group>
Functional S h id
Foods (Japan)Life &
Hayashibara Production center
Food HealthSaccharides Business Cosmetic Ingredients
(Japan)
Health Care (Japan)
Overseas Business
Life & Healthcare
Functional
R&D center
L’Plaza
Pharmaceuticals Beauty
Overseas Business
Functional Dyes Business
Pharmaceutical
Management
Functional Materials Technical proposal of
applications to customerIndustrial
Functional Dyes
Management centerAdvanced
Materials & Processing
Colors
Hayashibara Mecenat Center
Hayashibara Museum of Art
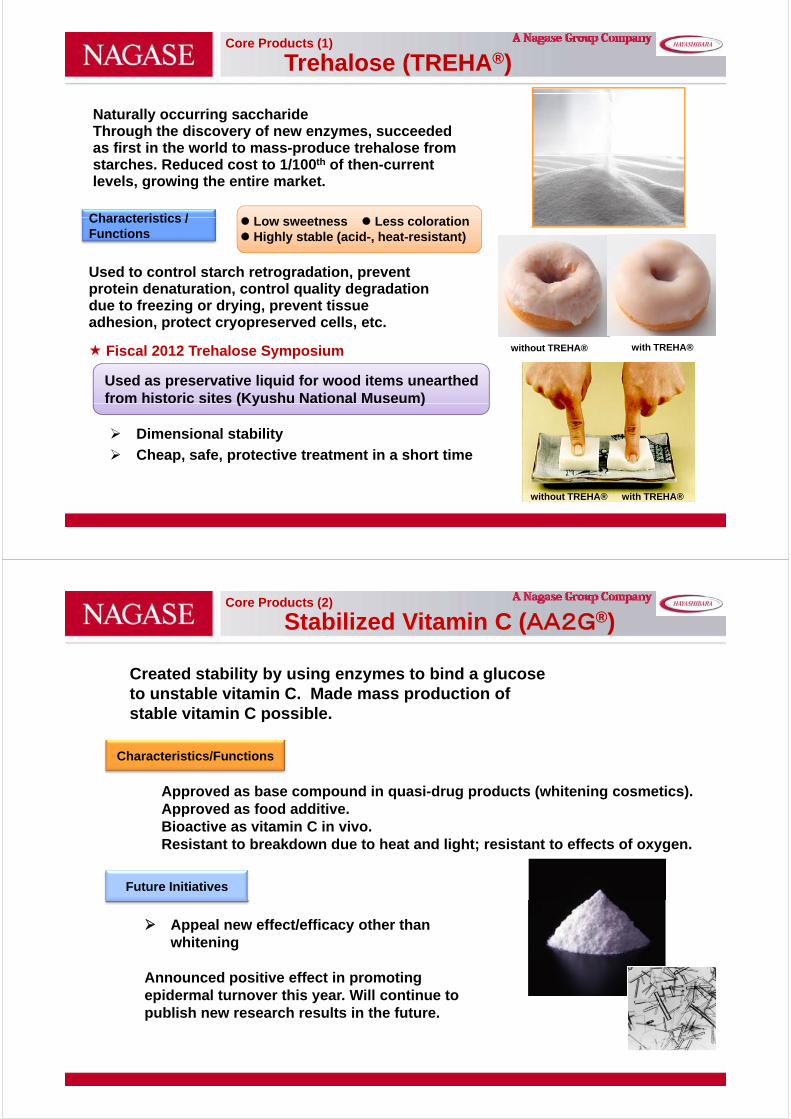
Trehalose (TREHA®)Core Products (1)
Naturally occurring saccharideThrough the discovery of new enzymes, succeeded as first in the world to mass-produce trehalose from pstarches. Reduced cost to 1/100th of then-current levels, growing the entire market.
Characteristics / L t L l tiCharacteristics /Functions
Used to control starch retrogradation, prevent
Low sweetness Less coloration Highly stable (acid-, heat-resistant)
g pprotein denaturation, control quality degradation due to freezing or drying, prevent tissue adhesion, protect cryopreserved cells, etc.
without TREHA® Fiscal 2012 Trehalose Symposium
Used as preservative liquid for wood items unearthed from historic sites (Kyushu National Museum)
with TREHA®
Dimensional stability
Cheap, safe, protective treatment in a short time
( y )
with TREHA®without TREHA®
Stabilized Vitamin C (AA2G®)Core Products (2)
Created stability by using enzymes to bind a glucose to unstable vitamin C. Made mass production of stable vitamin C possiblestable vitamin C possible.
Characteristics/Functions
Approved as base compound in quasi-drug products (whitening cosmetics).Approved as food additive.Bioactive as vitamin C in vivo.R i b kd d h d li h i ff fResistant to breakdown due to heat and light; resistant to effects of oxygen.
Future Initiatives
Appeal new effect/efficacy other than whitening
Announced positive effect in promoting epidermal turnover this year. Will continue to publish new research results in the future.
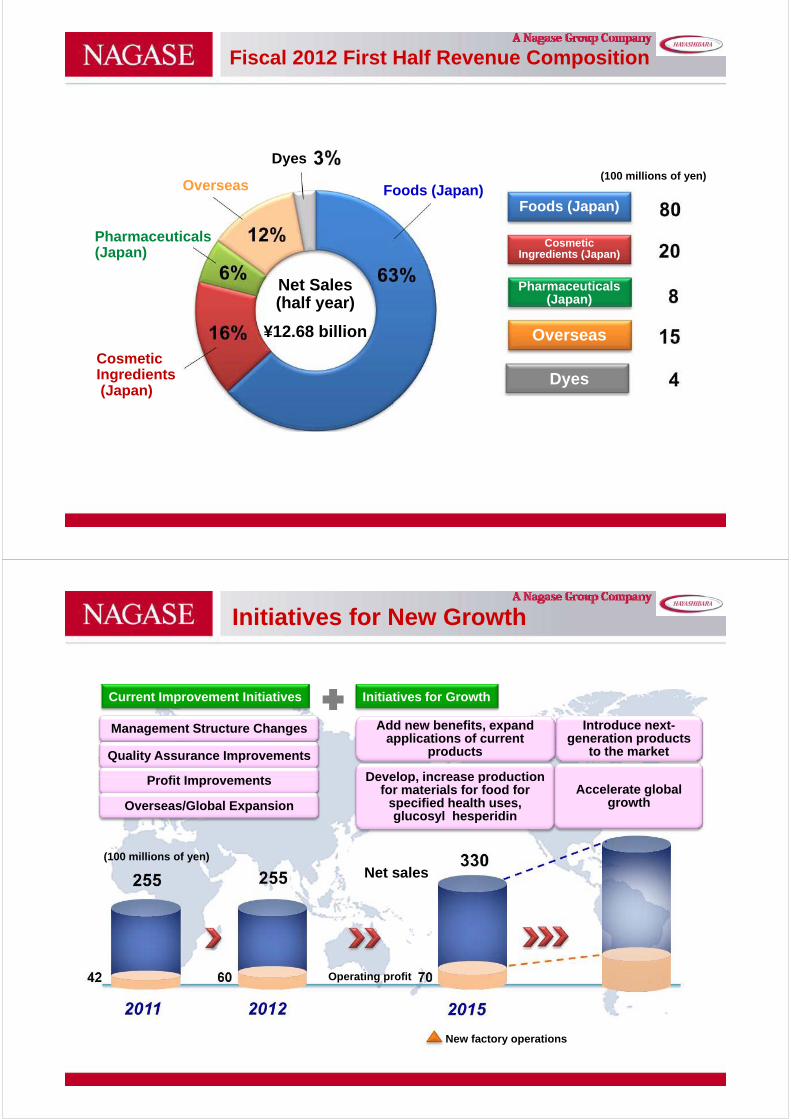
Fiscal 2012 First Half Revenue Composition
D es
Foods (Japan)Foods (Japan)
Dyes
Overseas(100 millions of yen)
Cosmetic Ingredients (Japan)
Pharmaceuticals (Japan)
N t S l Pharmaceuticals (Japan)
Overseas
Net Sales(half year)
¥12.68 billion
DyesCosmeticIngredients(Japan)
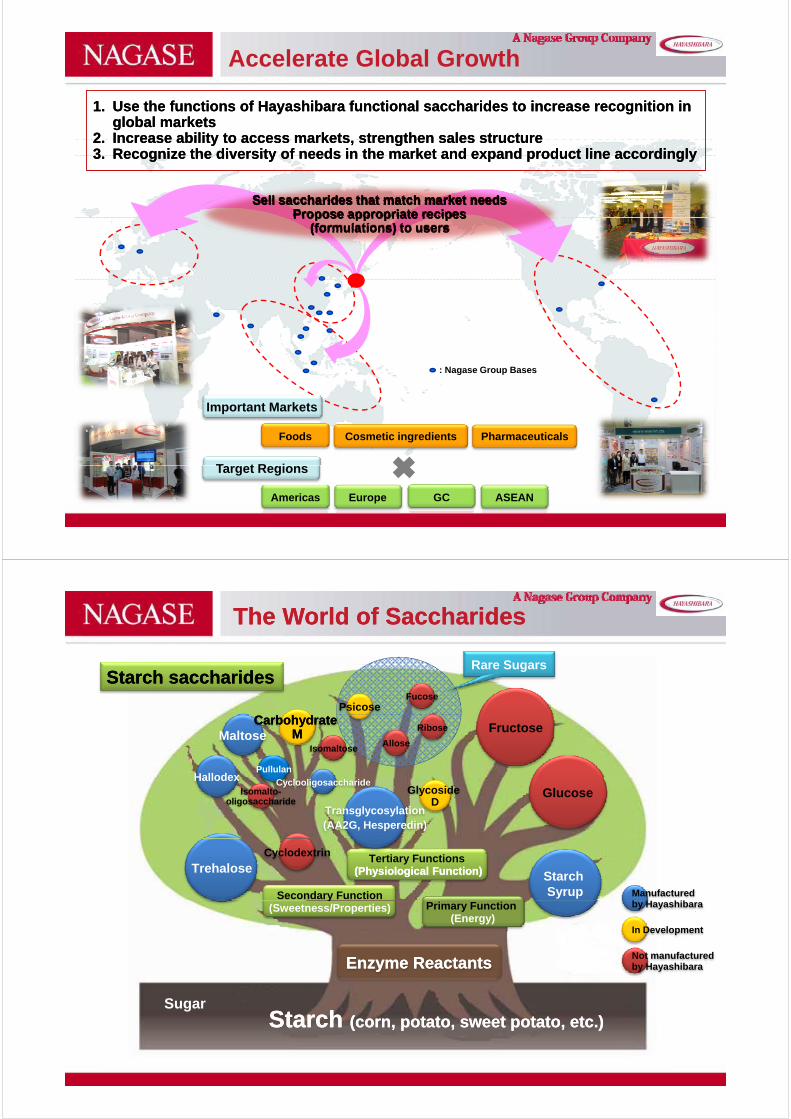
Initiatives for New Growth
Current Improvement Initiatives Initiatives for Growth
Management Structure Changes
Quality Assurance Improvements
P fit I t
Add new benefits, expand applications of current
products
Introduce next-generation products
to the market
Develop increase productionProfit Improvements
Overseas/Global Expansion
Develop, increase production for materials for food for
specified health uses, glucosyl hesperidin
Accelerate global growth
Net sales(100 millions of yen)
Operating profit
New factory operations
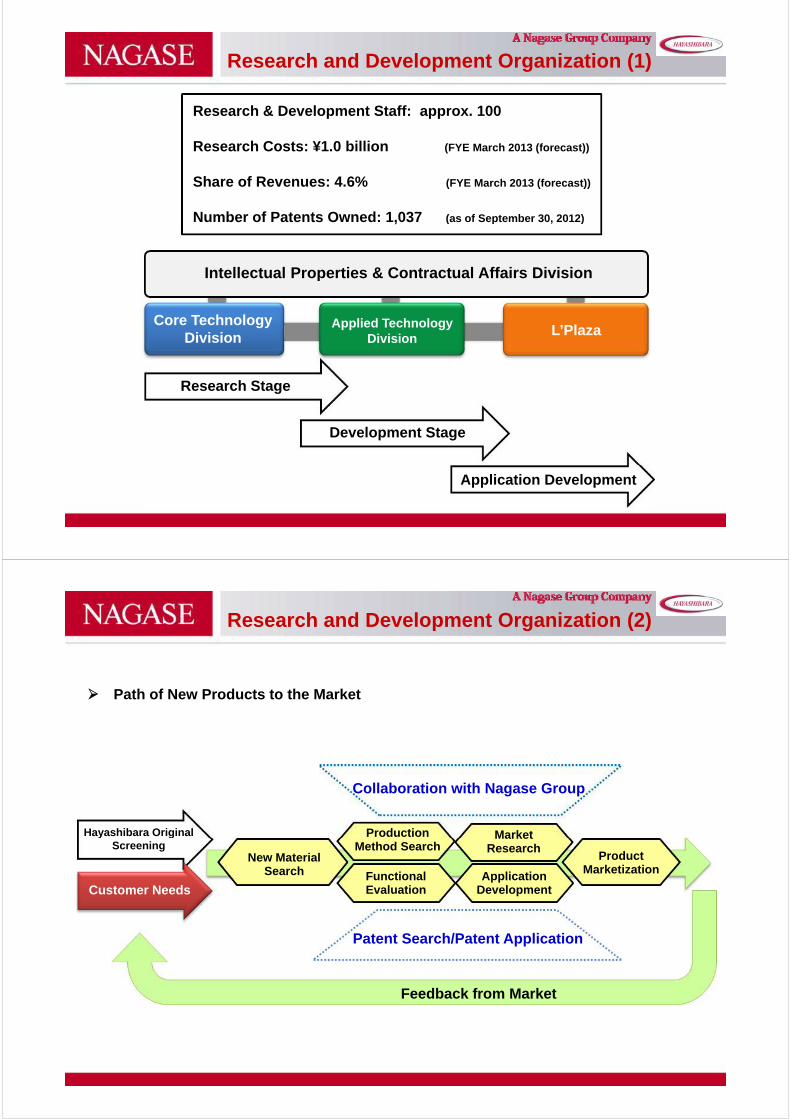
Accelerate Global Growth
1. Use the functions of Hayashibara functional saccharides to increase recognition in global markets
2. Increase ability to access markets, strengthen sales structure3 Recognize the diversity of needs in the market and expand product line accordingly
1. Use the functions of Hayashibara functional saccharides to increase recognition in global markets
2. Increase ability to access markets, strengthen sales structure3 Recognize the diversity of needs in the market and expand product line accordingly3. Recognize the diversity of needs in the market and expand product line accordingly3. Recognize the diversity of needs in the market and expand product line accordingly
Sell saccharides that match market needsPropose appropriate recipes
Sell saccharides that match market needsPropose appropriate recipesPropose appropriate recipes
(formulations) to usersPropose appropriate recipes
(formulations) to users
: Nagase Group Bases
I t t M k t
Foods Cosmetic ingredients Pharmaceuticals
T t R i
Important Markets
Americas Europe GC ASEAN
Target Regions
The World of The World of SaccharidesSaccharides
Psicose
Starch saccharidesStarch saccharidesFucose
Rare Sugars
Isomaltose
Fructose
Pullulan
MaltoseAllose
Carbohydrate Carbohydrate MM
Hallodex
Ribose
GlucoseHallodex Cyclooligosaccharide
Glycoside D
Transglycosylation(AA2G, Hesperedin)
Isomalto-oligosaccharide
TrehaloseCyclodextrin
Starch SyrupSecondary Function
Tertiary Functions(Physiological Function)(Physiological Function)
Manufactured b H hib
Enzyme ReactantsEnzyme Reactants
Primary Function (Energy)
y(Sweetness/Properties) by Hayashibara
Not manufactured
In Development
Enzyme ReactantsEnzyme Reactants
StarchStarch (corn potato sweet potato etc )(corn potato sweet potato etc )Sugar
by Hayashibara
Starch Starch (corn, potato, sweet potato, etc.)(corn, potato, sweet potato, etc.)
Research and Development Organization (1)
Research & Development Staff: approx. 100
Research Costs: ¥1.0 billion (FYE March 2013 (forecast))
Share of Revenues: 4.6% (FYE March 2013 (forecast))
Number of Patents Owned: 1 037 (as of September 30 2012)Number of Patents Owned: 1,037 (as of September 30, 2012)
Intellectual Properties & Contractual Affairs Division
L’Plaza
p
Core Technology Division
Applied Technology DivisionDivision Division
Research Stage
Development Stage
Application Development
Research and Development Organization (2)
Path of New Products to the Market
Hayashibara Original Production Market
Collaboration with Nagase Group
Screening
Customer Needs
Product Marketization
New Material Search
Method Search
Functional Evaluation
Market Research
Application Development
Patent Search/Patent Application
Feedback from Market
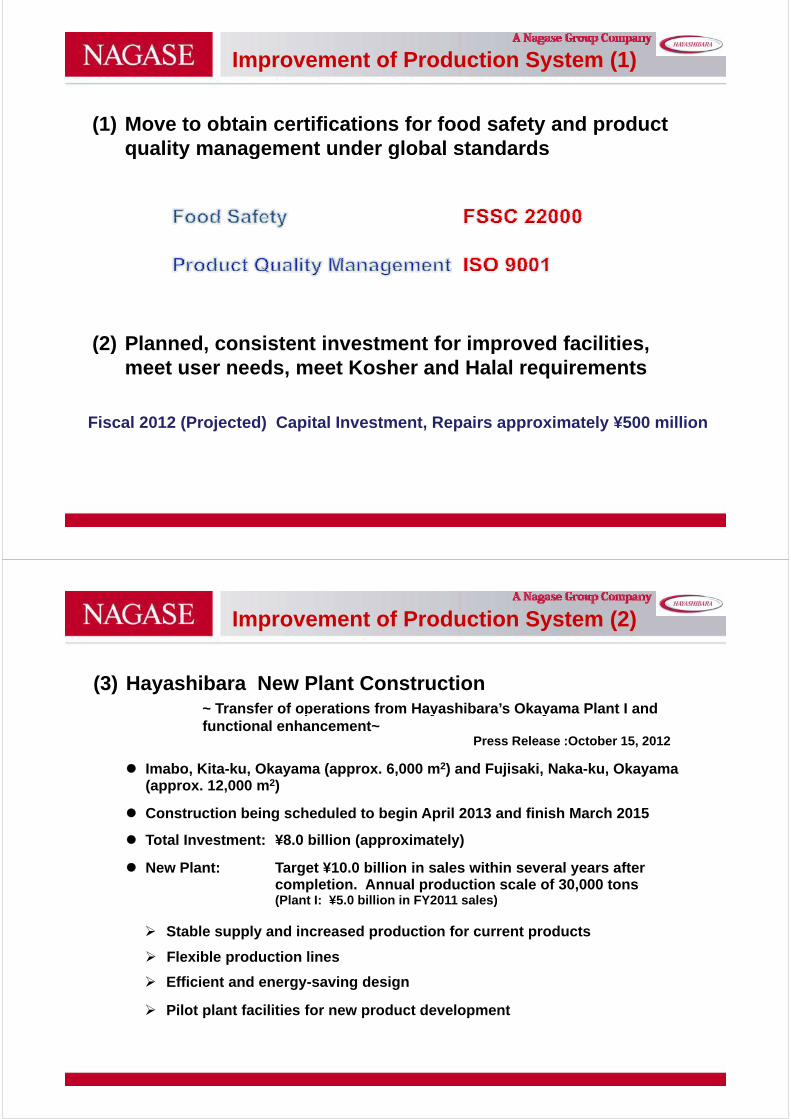
Improvement of Production System (1)
(1) Move to obtain certifications for food safety and product quality management under global standardsq y g g
(2) Planned consistent investment for improved facilities(2) Planned, consistent investment for improved facilities, meet user needs, meet Kosher and Halal requirements
Fiscal 2012 (Projected) Capital Investment, Repairs approximately ¥500 million
Improvement of Production System (2)
(3) Hayashibara New Plant Construction~ Transfer of operations from Hayashibara’s Okayama Plant I and
Press Release :October 15, 2012
p y yfunctional enhancement~
Imabo, Kita-ku, Okayama (approx. 6,000 m2) and Fujisaki, Naka-ku, Okayama y ( ) j y(approx. 12,000 m2)
Construction being scheduled to begin April 2013 and finish March 2015
Total Investment: ¥8 0 billion (approximately) Total Investment: ¥8.0 billion (approximately)
New Plant: Target ¥10.0 billion in sales within several years after completion. Annual production scale of 30,000 tons(Plant I: ¥5 0 billion in FY2011 sales)
Stable supply and increased production for current products
Flexible production lines
(Plant I: ¥5.0 billion in FY2011 sales)
Pilot plant facilities for new product development
p
Efficient and energy-saving design
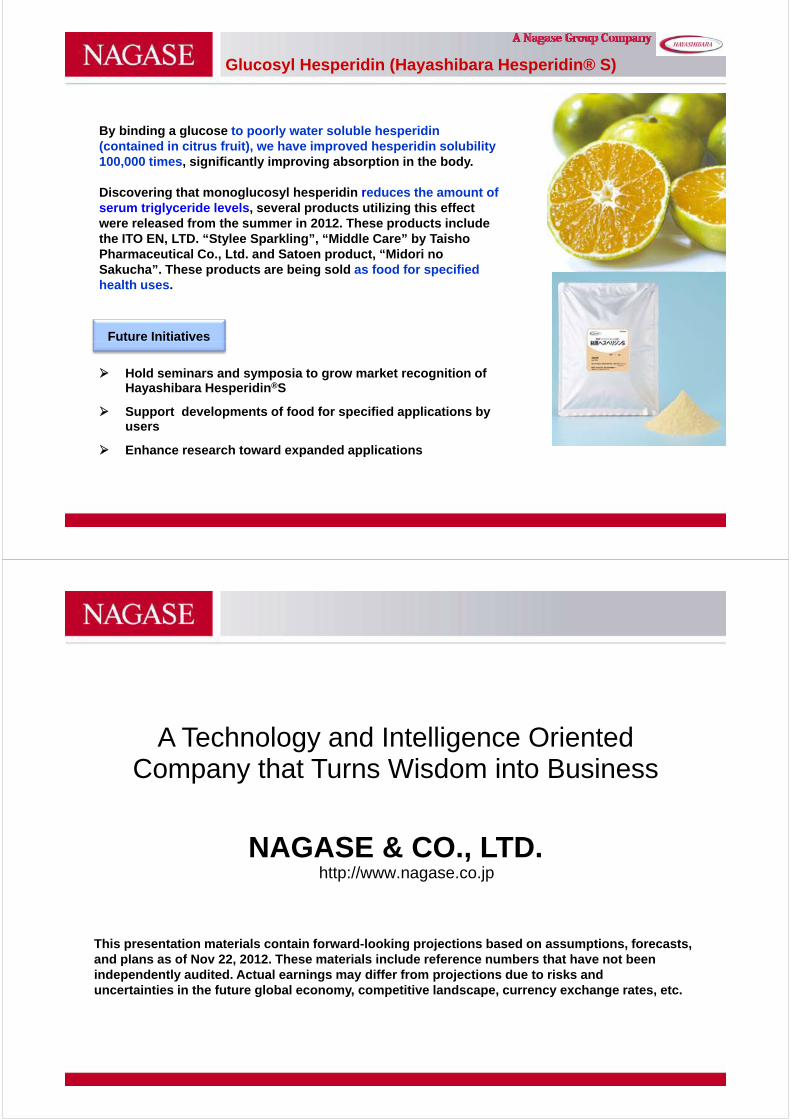
Glucosyl Hesperidin (Hayashibara Hesperidin® S)
By binding a glucose to poorly water soluble hesperidin (contained in citrus fruit), we have improved hesperidin solubility 100,000 times, significantly improving absorption in the body.
Discovering that monoglucosyl hesperidin reduces the amount of serum triglyceride levels, several products utilizing this effect were released from the summer in 2012. These products include the ITO EN, LTD. “Stylee Sparkling”, “Middle Care” by Taisho Pharmaceutical Co., Ltd. and Satoen product, “Midori no Sakucha”. These products are being sold as food for specified health uses.
Future Initiatives
Hold seminars and symposia to grow market recognition of Hayashibara Hesperidin®S
Support developments of food for specified applications by users
Enhance research toward expanded applications
A Technology and Intelligence OrientedCompany that Turns Wisdom into BusinessCompany that Turns Wisdom into Business
NAGASE & CO LTDhttp://www.nagase.co.jp
NAGASE & CO., LTD.
This presentation materials contain forward-looking projections based on assumptions, forecasts,and plans as of Nov 22, 2012. These materials include reference numbers that have not beenand plans as of Nov 22, 2012. These materials include reference numbers that have not been independently audited. Actual earnings may differ from projections due to risks anduncertainties in the future global economy, competitive landscape, currency exchange rates, etc.