Embed Size (px)
Citation preview

27 February 2020
FY’19 and 4Q’19Results Presentation

1
Contents
Bill Winters
Group Chief Executive
2
and 19
Andy Halford
Group Chief Financial Officer
5
Appendix 29
Macroeconomic outlook, novel coronavirus responses and interest rate sensitivity 30
Fixed income information 34
Sustainability 44
Definitions and important notice 52

2
Group Chief Executive
Bill Winters

3
We delivered on our strategic and financial commitments in 2019
• Network1 and Affluent2 activities continue to deliver premium growth and returns
• Massive push on digitisation and innovation is starting to pay off
• Encouraging progress optimising performance in four of our largest markets
• Productivity metrics continue to improve across the board
• First buy-back completed (second due shortly), and agreement to sell Permata
• Taking bold and ambitious actions to lead the way on global sustainability issues
Strategic
Priorities
Financial
Framework
• Principal measure return on tangible equity improved 130bps to 6.4% …
• … driven by continued cost, risk and capital discipline
• Grew underlying profit before tax 8%, earnings per share 23% and dividend 29%
• Underlying momentum in 4Q’19 continued in first weeks of 2020
1. Network activities: corporate and institutional banking services offered to clients utilising our unique network in 59 markets across Asia, Africa and the Middle East2. Affluent activities: personal banking services offered to affluent and emerging affluent customers
We passed several important strategic milestones, generated profitable growth and returned surplus capital

4
We are now fitter - more able to both adapt to challenges and seize opportunities
• We are supporting clients to transition into lower carbon technologies
• We are working with clients in higher CO2 industries to reduce emissions
• We are leading partnerships with other banks to align lending with the Paris Agreement
• We are working with partners to better understand the mechanics of risk transformation
We are better equipped to lead in a rapidly evolving world
Building a more skilled
and productive
workforce
Reducing climate risk
is the opportunity of
our time
• We are enabling client-centric ways of working
• We are deploying our diverse talent into the areas of biggest opportunity
• We are creating an inclusive culture that uses our diversity to best serve our clients
and communities
• We are building a future-ready workforce, with strong digital and people leadership
skills supported by health and wellbeing initiatives

5
Group Chief Financial Officer
Andy Halford
6
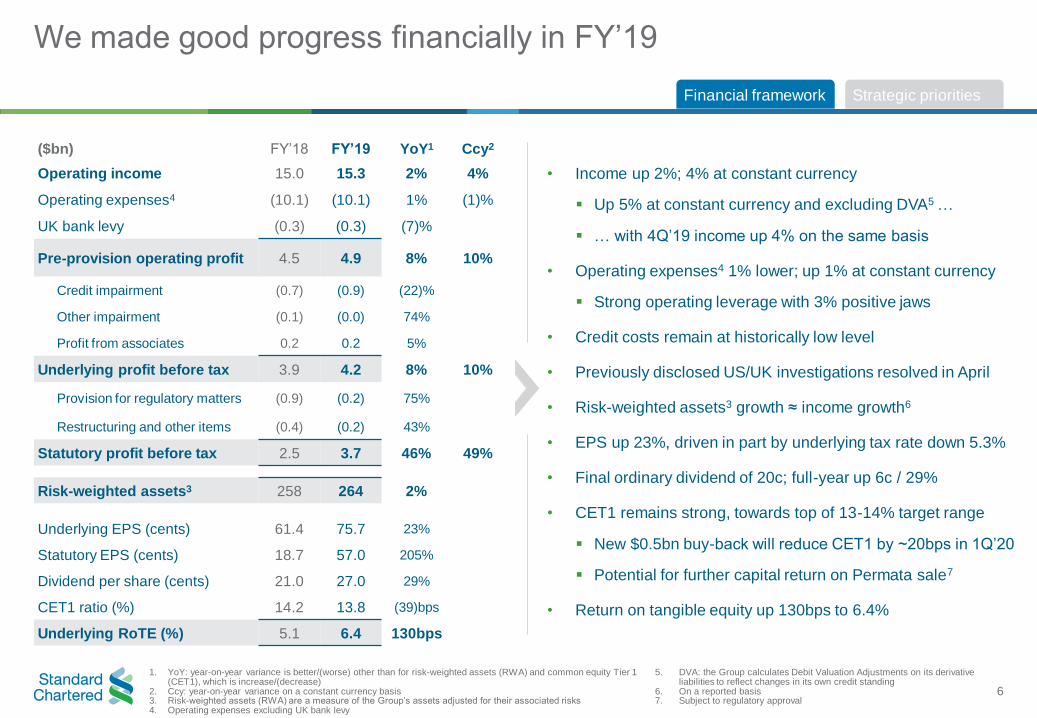
We made good progress financially in FY’19
Financial framework Strategic priorities
• Income up 2%; 4% at constant currency
▪ Up 5% at constant currency and excluding DVA5 …
▪ … with 4Q’19 income up 4% on the same basis
• Operating expenses4 1% lower; up 1% at constant currency
▪ Strong operating leverage with 3% positive jaws
• Credit costs remain at historically low level
• Previously disclosed US/UK investigations resolved in April
• Risk-weighted assets3 growth ≈ income growth6
• EPS up 23%, driven in part by underlying tax rate down 5.3%
• Final ordinary dividend of 20c; full-year up 6c / 29%
• CET1 remains strong, towards top of 13-14% target range
▪ New $0.5bn buy-back will reduce CET1 by ~20bps in 1Q’20
▪ Potential for further capital return on Permata sale7
• Return on tangible equity up 130bps to 6.4%
1. YoY: year-on-year variance is better/(worse) other than for risk-weighted assets (RWA) and common equity Tier 1 (CET1), which is increase/(decrease)
2. Ccy: year-on-year variance on a constant currency basis3. Risk-weighted assets (RWA) are a measure of the Group’s assets adjusted for their associated risks4. Operating expenses excluding UK bank levy
($bn) FY’18 FY’19 YoY1 Ccy2
Operating income 15.0 15.3 2% 4%
Operating expenses4 (10.1) (10.1) 1% (1)%
UK bank levy (0.3) (0.3) (7)%
Pre-provision operating profit 4.5 4.9 8% 10%
Credit impairment (0.7) (0.9) (22)%
Other impairment (0.1) (0.0) 74%
Profit from associates 0.2 0.2 5%
Underlying profit before tax 3.9 4.2 8% 10%
Provision for regulatory matters (0.9) (0.2) 75%
Restructuring and other items (0.4) (0.2) 43%
Statutory profit before tax 2.5 3.7 46% 49%
Risk-weighted assets3 258 264 2%
Underlying EPS (cents) 61.4 75.7 23%
Statutory EPS (cents) 18.7 57.0 205%
Dividend per share (cents) 21.0 27.0 29%
CET1 ratio (%) 14.2 13.8 (39)bps
Underlying RoTE (%) 5.1 6.4 130bps
5. DVA: the Group calculates Debit Valuation Adjustments on its derivative liabilities to reflect changes in its own credit standing
6. On a reported basis7. Subject to regulatory approval

7
Our primary performance measure RoTE continued to improve
Underlying return on tangible equity (RoTE) increased 130bps driven by strong positive jaws and lower equity
EquityFY’18
0.7%
Net interest
income
(0.2%)
Fees and
other income
Expenses Impairment
5.1%
0.1%
(0.1%)
0.5%
0.0%
0.2% 6.4%
Tax and UK
bank levy
RWA FY’19
Financial framework Strategic priorities
Underlying RoTE

8
Income ($m)
FY’19 income was up 4% at constant currency; up 5% ex-DVA1
Clear underlying business momentum: strong Financial Markets and Transaction Banking partially offset by Treasury
Financial framework Strategic priorities
1. DVA: the Group calculates Debit Valuation Adjustments on its derivative liabilities to reflect changes in its own credit standing2. Prior year Corporate Finance income included $67m of ship operating lease business income which was reclassed to restructuring, excluding the impact of this decision
Corporate Finance FY’19 income was up 2% YoY on a reported basis
22% 5% 5% 6% 8% (2)% (26)%
538
195
194
103 56
FY’18
constant
currency adj
for DVA1
Retail
Products
FY’18 Currency
impact
Wealth
Management
DVA1 FY’19Treasury
& Other
Corporate
Finance2
Lending &
Portfolio
Management
Transaction
Banking
Financial
Markets
ex-DVA1
14,968
(288)14,503
(25)
(293)
15,271
(177)
+5%

9
Income ($m)
4Q’19 income was up 1% at constant currency; up 4% ex-DVA1
Similar trends in 4Q with continued strength in Financial Markets and good Wealth Management performance
Financial framework Strategic priorities
177
72
4322
(110)
4Q’18 Retail
Products
(118)
Lending &
Portfolio
Management
Treasury
& Other
Transaction
Banking
Wealth
Management
4Q’18
constant
currency adj
for DVA1
DVA1
(36)
Financial
Markets
ex-DVA1
Corporate
Finance2
(30)
3,447
(18)
Currency
impact
3,595
4Q’19
3,597
+4%
33% 21% 5% 12% (2)% (10)% (43)%
1. DVA: the Group calculates Debit Valuation Adjustments on its derivative liabilities to reflect changes in its own credit standing2. Prior year Corporate Finance income included $17m of ship operating lease business income which was reclassed to restructuring

10
All client segments grew, generated positive jaws and improved RoTE1 in FY’19
1. Return on tangible equity: Group average tangible equity is allocated to client segments based on average RWA utilised and the global level underlying effective tax rate is applied uniformly
2. YoY: Year-on-year (FY’19 vs FY’18) % variance is increase/(decrease)3. RWA: risk-weighted assets
Financial framework Strategic priorities
Income $7.2bn
Expenses $4.4bn
Profit before tax $2.3bn
RWA3 $132bn
FY’19 FY’19 vs FY’18 (inc/(dec)) YoY2
Income $5.2bn
Expenses $3.8bn
Profit before tax $1.1bn
RWA3 $44bn
Income $1.5bn
Expenses $0.9bn
Profit before tax $0.4bn
RWA3 $28bn
Income $0.6bn
Expenses $0.5bn
Profit before tax $0.1bn
RWA3 $6bn
12%
2%
5%
(1)%+6% Jaws
3%
0%
5%
4%
+3% Jaws
(8)%
(2)%
6%+8% Jaws
100%
(3)%
9%
12%
nm+15% Jaws
Private Banking
RoTE 7.3%+8.3%pt
Commercial Banking
RoTE 7.3%+3.9%pt
Corporate & Institutional Banking
RoTE 8.5%+1.1%pt
Retail Banking
RoTE 12.6%+0.8%pt
Corporate businesses grew profits strongly; Retail Banking continues to be the highest returning client segment

11
1. YoY: year-on-year (FY’19 vs FY’18) % variance is increase/(decrease)2. RWA: risk-weighted assets
Financial framework Strategic priorities
Income $6.2bn
Expenses $3.8bn
Profit before tax $2.4bn
RWA2 $86bn
Income $4.2bn
Expenses $2.7bn
Profit before tax $1.0bn
RWA2 $89bn
Income $2.6bn
Expenses $1.7bn
Profit before tax $0.7bn
RWA2 $49bn
Income $1.7bn
Expenses $1.5bn
Profit before tax $0.2bn
RWA2 $44bn
Broad-based improvement in operating profit in all regions
Europe & Americas
Africa & Middle East
Greater China & North Asia
ASEAN & South Asia
Strong profit growth in ASA and AME and resilient performance in GCNA; positive jaws in all regions
FY’19 FY’19 vs FY’18 (inc/(dec)) YoY1
3%
6%
0%
(1)%
(2)%
(4)%
(7)%
+1% Jaws
+7% Jaws
29%
+2% Jaws
1%
3%
2%
8%
+2% Jaws
(1)%
1%
6%
6%

12
Lower contribution from Central & other items
Treasury Capital
Corporate Centre costs
UK bank levy
Strategic investments
Treasury Markets
Other non-segment
specific items
Associates and
Joint Ventures
Client Segment Centrally managed Region
Portfolio Management
Other global items
Financial framework Strategic priorities
Central & other items (segment) Central & other items (region)
• Higher external debt costs offset by a favourable change in
hedge ineffectiveness and increased internal capital
charges
• Income and profits primarily impacted by higher rates
internally paid on liabilities and one-off liquidity
requirements
FY’19 FY’18 YoY%¹
Income $0.6bn $0.6bn 9
Costs $0.7bn $0.7bn (9)
Profit / (loss) before tax $(0.1)bn $(0.2)bn 25
RWA $(4)bn $(5)bn 17
FY’19 FY’18 YoY%¹
Income $0.9bn $1.2bn (26)
Costs $0.9bn $0.9bn 1
Profit / (loss) before tax2 $0.2bn $0.5bn (58)
RWA $53bn $50bn 6
1. YoY: year-on-year (FY’19 vs FY’18) variance is better/(worse) other than for risk-weighted assets (RWA), which is increase/(decrease)2. Profit before tax includes profit from associates and joint ventures
Items excluded from Client Segments Items excluded from Regions
Items excluded from both
Client Segments and Regions

13
Tight control over expenses creates capacity to invest in our future…
• Operating expenses down 1%; up 1% constant currency
▪ Positive jaws and costs < inflation: in line with guidance
▪ Regulatory costs declined 13%
• Continue to target annual cost growth below inflation …
• … and positive jaws in 2020
• Investment in aggregate maintained at FY’18 level
▪ 29% increase in ‘strategic’ initiatives
o ~2/3 on improving/creating digital capabilities
• Nature of regulatory investment continues to evolve
▪ Completion of specific programs including IFRS9 and
BCBS 2392
Operating expenses1 ($bn)
Cash investment ($bn)
Substantial investment budget maintained; with a greater proportion on strategic initiatives
Financial framework Strategic priorities
Regulatory Systems replacements
System enhancements Strategic
1. Excludes the UK bank levy, which is paid in the second half of the year2. IFRS9: International Financial Reporting Standard 9 / BCBS 239: Basel Committee on Banking Supervision – Standard 239
1H 2H
4.8 5.1 5.0
5.1 5.0 5.1
2017 2018 2019
9.9 10.1 10.1
0.7 0.70.5
0.1
0.4 0.40.4
0.40.5 0.6
0.1
1.6
2017
0.1
2018 2019
1.61.5

14
… and should enable us to maintain positive jaws in a softer income environment
Cost discipline is now embedded within the organisation and several management levers can be deployed
Financial framework Strategic priorities
Cost-to-income ratio1
Income-to-cost jaws1
0.1% 2.8%2.3% • Improving productivity is a key strategic priority
▪ Increasing revenue from targeted client acquisition,
conversion and retention …
▪ … while improving efficiency to multiply revenues with
the same (or fewer) resources
• Areas of most flexibility in the cost base include:
▪ Variable pay
▪ Management actions responding to lower growth
o Flexing salary inflation
o Headcount management to optimise productivity
o Postponing non-priority investment
• Regulatory costs continue to decline
1. On a reported basis; excludes the UK bank levy
FY’17 FY’18 FY’19
69.3%
67.8%
65.9%

15
Credit quality stable year-on-year; impairment remainsat historically low level
1. IFRS9 became effective from 1 January 2018. Comparable periods have not been restated2. Credit impairment for loans & advances to customers over average loans & advances to
customers (2018 includes both ongoing business and the liquidation portfolio)3. 2018 includes the liquidation portfolio transferred into ongoing business from 1 Jan 2019
1,200
752 643
263
906
FY’17
-12
740
FY’19FY’18
Credit quality ($bn)3
Credit impairment ($m)1 / Loan loss rate (bps)2
3.5 2.9 2.4
8.7
4.8 5.3
1.5
1.5 1.6
01.01.18 31.12.18
9.2
31.12.19
13.7
9.3
Early Alerts CG125Net Stage 3 L&A4
Financial framework Strategic priorities
4. Stage 3 Net loans and advances to customers5. CG12: Credit Grade 12 accounts6. Sovereign rating downgrades in Zimbabwe, Zambia and Lebanon impacted
the ratings of certain accounts in those countries
50bps 21bps 27bps
Loan loss rate2
(bps)
Stage 3 Credit impairment1 Stage 1 & 2 Credit
impairment1
Credit impairment increased in 2019 but remains at historically low levels
• Credit impairment increase driven by stage 1 & 2
▪ Loan loss rate2 27bps
▪ Stage 1 & 2 up $275m ~50% from deteriorating macro
economic variables
▪ Stage 3 reduced again, by $109m
• Other impairment down $(110)m to $38m
▪ Ship leasing now in restructuring
• Credit quality was stable YoY
• Gross stage 3 assets down 12% to $7.4bn
▪ 2.7% of gross loans and advances: lowest since 2014
• CG125 up 5% reflecting a number of sovereign downgrades6
• Cover ratio after collateral stable at 85%

16
1. YoY: year-on-year (FY’19 vs FY’18). OPAC = Operating account 2. Adjusted Net interest income (NII) is the difference between interest received on assets and interest paid on liabilities excluding interest expense to fund the trading book 3. The Group has changed its accounting policy for NII and the basis of preparation of its Net Interest Margin (NIM) to better reflect the underlying performance of its banking
book. See note 1 to the financial statements in the Annual Report of Accounts for further details
The balance sheet is growing; we are focusing on self-help actions to start to stabilise net interest margin in 2020
FY’18 FY’19 YoY1
Gross asset yield (bps) 318 334 16bps
Gross liability rate paid (bps) 165 192 27bps
Adjusted Net interest margin3
(bps)169 162 (7)bps
Adjusted Net interest income2,3
($bn)8.0 8.0 -
5%
2%
YoY1
Broad-based balance sheet growth… …with an improving mix
Average liabilities3 ($bn) YoY1
Average assets ($bn)3
3%
Financial framework Strategic priorities
8%
Other interest earning assets
Customer interest earning assets
Non-interest earning assets
Other non-interest bearing liabilities and shareholder funds
Interest bearing liabilities
Non-interest bearing customer accounts & deposits to banks
• FY’19 NIM down 7bps; 4Q’19 NIM down 7bps QoQ to 154bps
▪ Driven by Rates and Margin pressure …
▪ … but better liability mix: OPAC1 up $19bn / 22% in 2H’19
• Factors that would mitigate rate pressure on NII/NIM in 2020:
▪ Interest earning assets growth
▪ Further improvement in the asset and liability mix
▪ Improving pricing on OPAC balances
▪ Driving funding benefits from new liquidity hubs (HK/SG)
▪ Lower interest rate sensitivity in the banking book
262 275
215 220
202 222
FY’18 FY’19
430 445
91 98
162 173
FY’18 FY’19

17
Strong capital is supporting growth, higher dividends and share buy-backs
Risk-weighted assets ($bn)
1.0
2018
underlying
CET1
FY’18 Buy-
backs2
Restructuring
and
regulatory
Underlying
profit after
tax
(0.4)
Dividends3 RWA and
other
FY’19
13.713.8
14.2
(0.2)
(0.6)
(0.3)
+16bps
6.4
3.41.2
1.0
Credit
migration
Asset
growth
FY’19FXModel
Change4
RWA
Efficiencies
/ disposals
Operational
Risk
Market
Risk
258.3
FY’18
(0.4)
(4.8) (0.9)
264.1
+$5.8bn
• RWA1 up 2% / $5.8bn from FY’18 to $264bn
• Income RoRWA1 = 5.8%
▪ Has improved from 4.6% in 2015 …
▪ … and in every year since
• Maintain guidance of RWA < Income growth 2019-21
• RWA optimisation initiatives ongoing
• Completion of Permata sale to release ~$9.5bn of RWA
CET1 ratio1 (%)
• (55)bps from buy-back2, restructuring, regulatory provisions
• Underlying CET1 increased by 16bps
▪ Profit +105bps partially offset by dividends and RWA1
• $0.5bn buy-back will reduce CET1 by ~20bps in 1Q’20
▪ Potential for further capital return on Permata sale
• UK leverage ratio of 5.2% vs regulatory minimum of 3.7%
Financial framework Strategic priorities
1. Common equity tier 1 ratio: a measure of CET1 capital as a percentage of RWA / RWA: risk-weighted assets / RoRWA: annualised profit as a percentage of RWA
2. CET1 ratio impact of $1bn share buy-back programme and the acquisition of shares to satisfy remuneration-related employee awards to avoid share count dilution
3. Dividends include paid and foreseeable Tier 1 (preference share and Additional Tier 1) distributions and ordinary share dividends
4. Model changes includes -$(0.9)bn Credit Risk, +$0.5bn Market Risk, +$1.4bn C&O

18
Good progress delivering the financial framework outcomes in first year of plan
2019-21 targets @ Feb’19 FY’19
Income 5-7% CAGR1 +4%
(constant currency)• Growth likely below 5% in 2020
RoTE >10% by 20211 +130bps
(YoY)
• Continue to target at least 10%
• Now believe it will take longer to achieve
ExpensesGrowth < Inflation
2
Positive jaws3
+1%(constant currency)
3% jaws
• Targeting 4th consecutive year of positive jaws
Capital13-14% CET1
1ratio
2x dividend (by 2021)4
Invest / distribute surplus
13.8%
27c, up 29%
$1bn
• $0.5bn buy-back starting shortly
• Potential for further return on Permata sale
Financial framework Strategic priorities
1. RoTE: underlying return on tangible equity / CAGR: compound annual growth rate / CET1: common equity tier 1
2. Excluding the UK bank levy
3. Positive jaws: income growth > cost growth, excluding the UK bank levy4. The FY’18 full-year ordinary dividend per share has the potential to double by 2021
Outlook @ Feb’20

19
Group Chief Executive
Bill Winters

20
Clients
‘Next + New’ income2 +22%
Income
Network³($bn)
+6%
Network %4 66% 69% 69% Flat
Network Capital-lite %5 56% 59% 59% Flat
ROTE
Network3 10% 13% 16% +3%pt
Corporate &
Institutional Banking
4% 7% 8% +1%pt
Investing in our network continues to deliver income growth at premium returns
• Adding new clients attracted by our network
▪ Good progress with OECD-based corporates
• Deepening relationships with existing clients
▪ Capital-lite income growing at a faster rate
▪ Reducing % of sub-optimal returning RWA
• Market share in global trade increased in 20196
▪ Global reduction largely a US-China issue …
▪ … where we have a relatively low share
▪ Supply chains shifting to Vietnam, Taiwan, etc…
▪ … where we have a more differentiated offering
1. FY’19 YoY: year-on-year (FY’19 vs FY’18) variance2. ‘Next’ clients: those that have the potential to deliver significant and sustainable income
growth; ‘New’ clients: new-to-bank, mainly based in OECD markets3. ‘Network’ income: that generated outside of a client’s headquarter country (excluding risk
management, trading and ship leasing)
4. Network income as a % of Corporate & Institutional Banking Income (excluding risk management, trading and ship leasing)
5. ‘Capital-lite’ income: that generated from products with lower RWA consumption or of a non-funding nature
6. Swift Documentary Letters of Credit global volumes (MT 700)
4.04.4 4.7
FY’17 FY’18 FY’19
Financial framework Strategic priorities
FY’19 YoY1

21
Our affluent client business showed resilience in less buoyant conditions
Financial framework Strategic priorities
1. FY’19 YoY: year-on-year (FY’19 vs FY’18) variance2. Number of qualified priority banking clients in the top 10 Retail Banking Priority markets3. Affluent income is that generated from Priority and Premium clients in the Retail Banking
segment and from clients in the Private Banking segment
• Affluent client base continues to grow
• Private Banking in-flows picked up significantly
▪ AUM per RM5 up 30% since 2017
• Income from Affluent clients growing as a % of
total Retail Banking + Private Banking income
• Launched “Priority Private”6 in five markets
▪ HK, Singapore, China, Taiwan, Malaysia
• ‘Premium’ banking offering now in ten markets
▪ Taiwan and Pakistan the latest to launch
Clients
Income
ROTE
Affluent³ 27% 28% 26% -2%pt
Retail Banking +
Private Banking
9% 10% 12% +2%pt
3.1 3.3 3.5
FY’19 YoY1
FY’17 FY’18 FY’19
+8%Number of Retail
Banking Priority clients2
Private Banking Net New
Money ($bn)
Affluent3 % of Retail Banking
+ Private Banking
Affluent3 ($bn)+6%
+2%pt58% 60% 62%
2.2
0.7
2.6
Affluent AUM4 ($bn)
+1.9bn
+19%
4. Private Banking, Retail Priority and Retail Premium Wealth Management Assets Under management. This replaces the previously reported KPI “WM + Deposits % of Retail Banking”, which was 64% in 2019 up 2%pts on 2018 of 61%
5. AUM: assets under management / RM: relationship manager6. Priority Private for high net worth clients with AUM>USD1m
22
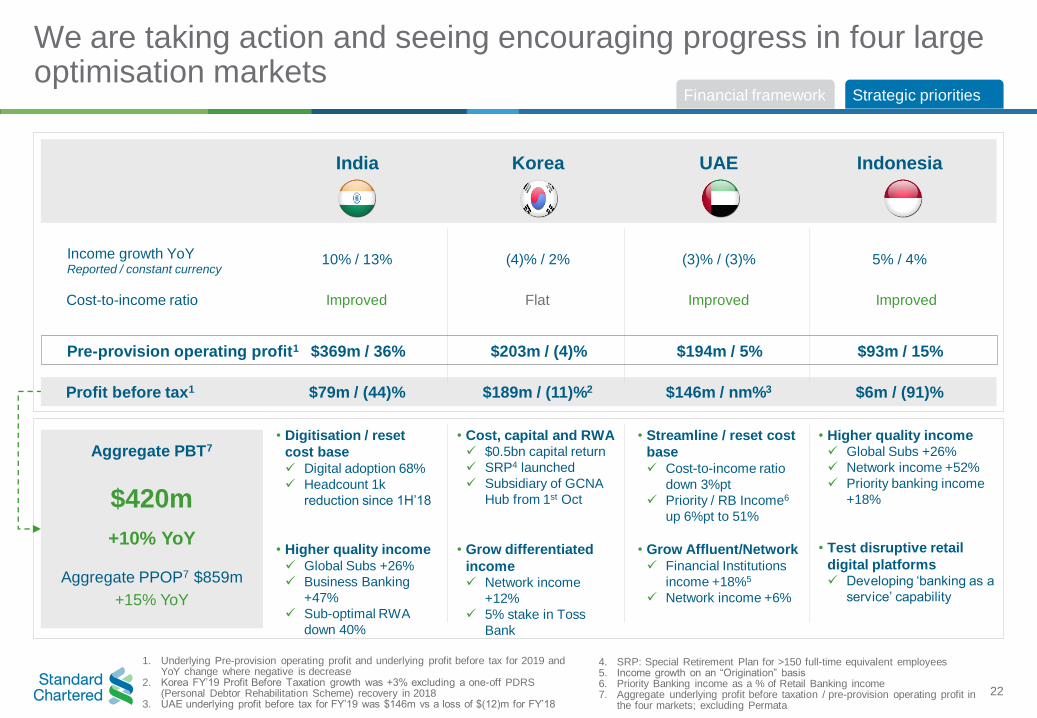
We are taking action and seeing encouraging progress in four large optimisation markets
• Digitisation / reset
cost base✓ Digital adoption 68%
✓ Headcount 1k
reduction since 1H’18
• Higher quality income✓ Global Subs +26%
✓ Business Banking
+47%
✓ Sub-optimal RWA
down 40%
• Cost, capital and RWA✓ $0.5bn capital return
✓ SRP4 launched
✓ Subsidiary of GCNA
Hub from 1st Oct
• Grow differentiated
income✓ Network income
+12%
✓ 5% stake in Toss
Bank
• Streamline / reset cost
base✓ Cost-to-income ratio
down 3%pt
✓ Priority / RB Income6
up 6%pt to 51%
• Grow Affluent/Network✓ Financial Institutions
income +18%5
✓ Network income +6%
• Higher quality income✓ Global Subs +26%
✓ Network income +52%
✓ Priority banking income
+18%
• Test disruptive retail
digital platforms✓ Developing ‘banking as a
service’ capability
Income growth YoYReported / constant currency
10% / 13% (4)% / 2% (3)% / (3)% 5% / 4%
Profit before tax1 $79m / (44)% $189m / (11)%2 $146m / nm%3 $6m / (91)%
Cost-to-income ratio
Aggregate PBT7
$420m
+10% YoY
Aggregate PPOP7 $859m
+15% YoY
India IndonesiaKorea UAE
1. Underlying Pre-provision operating profit and underlying profit before tax for 2019 and YoY change where negative is decrease
2. Korea FY’19 Profit Before Taxation growth was +3% excluding a one-off PDRS (Personal Debtor Rehabilitation Scheme) recovery in 2018
3. UAE underlying profit before tax for FY’19 was $146m vs a loss of $(12)m for FY’18
Financial framework Strategic priorities
4. SRP: Special Retirement Plan for >150 full-time equivalent employees5. Income growth on an “Origination” basis6. Priority Banking income as a % of Retail Banking income7. Aggregate underlying profit before taxation / pre-provision operating profit in
the four markets; excluding Permata
Pre-provision operating profit1 $369m / 36% $203m / (4)% $194m / 5% $93m / 15%
Improved Flat Improved Improved

23
We are driving operational improvements to scale revenue and improve efficiency
• Digital sales gaining significant traction
• Income productivity measures > headline income
▪ 4% YoY reduction in business full-time employees
• New Digital Channels & Data Analytics division
▪ Digitised ~3,000 corporate clients6
• Aligning the organisation around ‘client journeys’
▪ 7 client journeys now in-flight
• Optimised corporate entity structure
▪ Capital and liquidity hub for Greater China & North
Asia centred on Hong Kong
▪ Merged branch and subsidiary in Singapore
Clients
Retail Banking %
of digital sales2 16% 21% 28% +7%pt
Corporate & Institutional
Banking on-boarding³ (Days)-1 day
Income productivity
Income per FTE4
($000s)+5%
RAR per client-facing FTE5
($000s)+10%
Cost efficiency
Cost:income ratio(ex UK bank levy)
69% 68% 66% -2%pt
414489
540
165173
182
16
8 7
Financial framework Strategic priorities
1. FY’19 YoY: year-on-year (FY’19 vs FY’18) variance2. Digital sales as a % of total sales3. Days to on-board a new Corporate & Institutional Banking client4. Income over the past 12 months divided by the 12 month rolling average of full-time
equivalent (FTE) employees
5. Risk-adjusted revenue (income minus impairment) over the past 12 months divided by the 12 month rolling average of client-facing FTEs
6. Clients that have moved from manual to digital initiation
FY’19 YoY1
FY’17 FY’18 FY’19

24
We are executing multiple exciting digital initiatives to transform our business
5. % of Commercial Banking clients active on the Group’s proprietary Straight2Bank (S2B) application6. Utilising Standard Chartered’s banking capabilities to provide ‘white label’ financial services to e-
commerce platforms, enabling them to offer banking products such as loans, credit cards and savings accounts to customers on their channels using their own brands
7. Source: Global Finance Awards
Financial framework Strategic priorities
Greater China & North Asia:
• Beta-testing Hong Kong virtual bank
• LINE (Taiwan) and Toss Bank (Korea) partnerships
ASEAN & South Asia:
• Preparing ‘banking as a service’6 capabilities
• Singapore and Malaysia:
▪ Real time on-boarding now live
▪ Partnering Sage to support SMEs
Africa & Middle East:
• Digital-only banks opened in further 8 Africa markets
▪ ~150k new accounts (3x client acquisition levels)
• Launched digital credit card issuance in UAE
• QR code payments rolled out in 3 Africa markets
“Best Global Consumer Digital Bank”7
FY’17 FY’18 FY’19
FY’19 YoY1Retail Banking
Mobile adoption² 23% 29% 35% +6%pts
Digital adoption³ 45% 49% 54% +5%pts
Corporate &
Institutional Banking
FM digital volume ($m)4
Commercial Banking
S2B utilisation5 55% 65% 68% +3%pts
1. FY’19 YoY: year-on-year (FY’19 vs FY’18) variance 2. Mobile adoption by active clients3. Mobile and online adoption by active clients4. Financial Markets sales income originated via E-platforms
+9%
121
144157

25
• Addressing $2.5tn a year
funding gap for low-carbon
infrastructure in AAME1
• Funding and facilitating $75bn
towards SDGs1 by end-2024
▪ $40bn sustainable
infrastructure
▪ $35bn renewable energy
• World’s first sustainable
deposit: >$1bn raised
Our purpose drives our business decisions, bold actions and ambitious commitments
Our purpose: Driving commerce and prosperity through our unique diversity
• Refreshed Sustainability
Aspirations support SDGs1
• Plan to achieve ‘net zero’
emissions2 by 2030
• TCFD1 report published
▪ Supporting clients to
transition away from
thermal coal by 2030
▪ Reviewing activities in
other high CO2 sectors
• Building capability in data,
digital and people leadership
• ~10k colleagues certified in
new ways of working
• >80% of people leaders
completed inclusive
leadership training
• China ‘corridor’ bankers being
deployed in key Belt & Road
locations
• Launched ‘Futuremakers’ to
tackle inequality and promote
inclusion
▪ Projects now in 34 markets
▪ Engaged 100,000 girls in
education programmes
• Launched Women In Tech
Incubators in three new
markets in 2019
▪ Nigeria, Pakistan and UAE
We understand our
responsibilities
We will lead sustainable financing across
emerging markets
We will maximise return from investment
in our people
We support the communities where we
work and live
Financial framework Strategic priorities
This is a small selection of the actions taken and commitments made in 2019
Further information can be found in the 2019 Annual Report
1. SDG: United Nation’s Sustainable Development Goals / TCFD: Taskforce on Climate-related Financial Disclosures / AAME: Asia, Africa and the Middle East2. ‘Net zero’ emissions means in aggregate we will not produce any emissions from our operations. For example, a net zero carbon building is a building that is fully powered
from on-site and/or off-site renewable energy sources

26
262250
241
233
153126
2018 2019 2020 2021
Significant income headwinds likely in 2020
• Key interest rates have reduced and are likely to fall further
• Estimated 1yr interest rate earnings sensitivity1
▪ +50bps c.$140m
▪ -50bps c.$(120)m
As at Feb’20
Global GDP
growth2
Hong Kong GDP
growth2
As at Feb’19
3.6%
2.7%
2019e 2020e 2019 2020e
3.0%
3.6% 3.1%
-1.5% -2.4%
3.0%
Financial framework Strategic priorities
Clear underlying momentum in areas of differentiation, but conditions have become more challenging
1. See ‘Macroeconomic outlook and interest rate sensitivity’ in Appendix; assume parallel shift in yield curves at beginning of period2. Current-year basis – Real GDP growth rates for 2019 and 2020 (%). Source: Standard Chartered Global Research
USD 3-month LIBOR (bps)
Forward rates @ Feb’20
Forward rates @ Feb’19
• Markets in Asia still driving global growth, but at a slower rate
• Hong Kong has moved into recession
• Novel coronavirus (Covid-19) outbreak
$(290)m $(180)m $(120)m
-50bps
earnings
sensitivity1

27
We are executing our strategy to create the leading bank for clients in Asia, Africa and the Middle East
We are in the right markets and our strategy is working
• We continue to target at least 10% RoTE
▪ This is the minimum expected of the franchise, and is already the hurdle rate used for business decisions
▪ We are focused on a fifth successive year of improvement in 2020
▪ 2020 headwinds are expected to be transitory, but we now believe it will take longer to achieve 10% than we previously envisaged
Financial framework Strategic priorities
• Our strategy is working and remains appropriate
▪ We will not jeopardise our secured foundations …
▪ … or compromise on the quality of income we are generating
▪ We will continue to invest in areas of existing strength and to create new
differentiated advantages
• I am confident we have set ourselves up for lasting success
▪ We welcome and will adapt to challenges, as we have done since 2015
▪ We are in the right markets guided by the right strategy …
▪ … and are united through our purpose to drive commerce and prosperity through
our unique diversity
• Not practicable to quantify
exact impact of Covid-191
• Currently assuming a
manageable largely 1H’20
impact …
• … resulting in suppressed
income + additional ECL2
• Additional and more
significant negative impact if
it extends into 2H’20
1. See page 32 in the Appendix for the range of actions we are currently taking to respond to the Covid-19 outbreak 2. ECL: expected credit loss represents the present value of expected cash shortfalls over the residual term of financial assets, undrawn commitment or financial guarantees
Covid-19 Update

28

29
Appendix

30
Appendix:Macroeconomic outlook, novel coronavirus responses and interest rate sensitivity

31
• Central bank easing in 2019
• Monetary and fiscal policy support in 2020 in novel
coronavirus affected countries
• Bottoming out of the electronics cycle and inventory
rebuild
• Escalation in trade tensions
• High debt, ageing populations and de-globalization
• Spread of novel coronavirus
Real GDP growth1 (%) 2019 2020e
Hong Kong -1.2 -2.4
China 6.1 5.5
Korea 2.0 2.0
India 5.0 5.6
Indonesia 5.0 5.0
Singapore 0.7 0.8
Nigeria 2.4 3.0
UAE 1.7 2.1
UK 1.2 1.0
USA 2.3 1.7
2020 will be a year of soft but stabilising growth for the global economy
Potential headwinds
Potential tailwinds
GC
NA
AS
AA
ME
EA
1. Source: Standard Chartered Global Research, India’s financial year starts in April each year. The forecasts for 2020 reflect Global Research projections, and not necessarily those of the Board
Economic uncertainty remains high Novel coronavirus outbreak to impact growth in Q1

32
Covid-19 response: we care about our employees, clients and communities
• Launched relief measures to support our clients
▪ Mortgage principal payment holiday
▪ Principal moratorium to support small and medium enterprises
▪ Trade finance loans extension for Commercial and Business Banking clients
▪ Additional coverage for life insurance plan, with non face-to-face application channels for specific products
▪ Relief loan and fee waivers for personal clients
• Instigated precautionary measures to protect our employees and clients
▪ No face-to-face service in some sub-branches in Mainland China
▪ Around a quarter of our branches in Hong Kong remain closed currently
• Supporting our communities with donations
▪ $384k to the Hong Kong Council of Social Service for epidemic supplies
▪ $144k to Wuhan Municipal Charity Foundation and Hubei Provincial Charity Foundation
▪ Global employee fund-raising appeal with the Group matching employee donations up to $100k for Wuhan
33
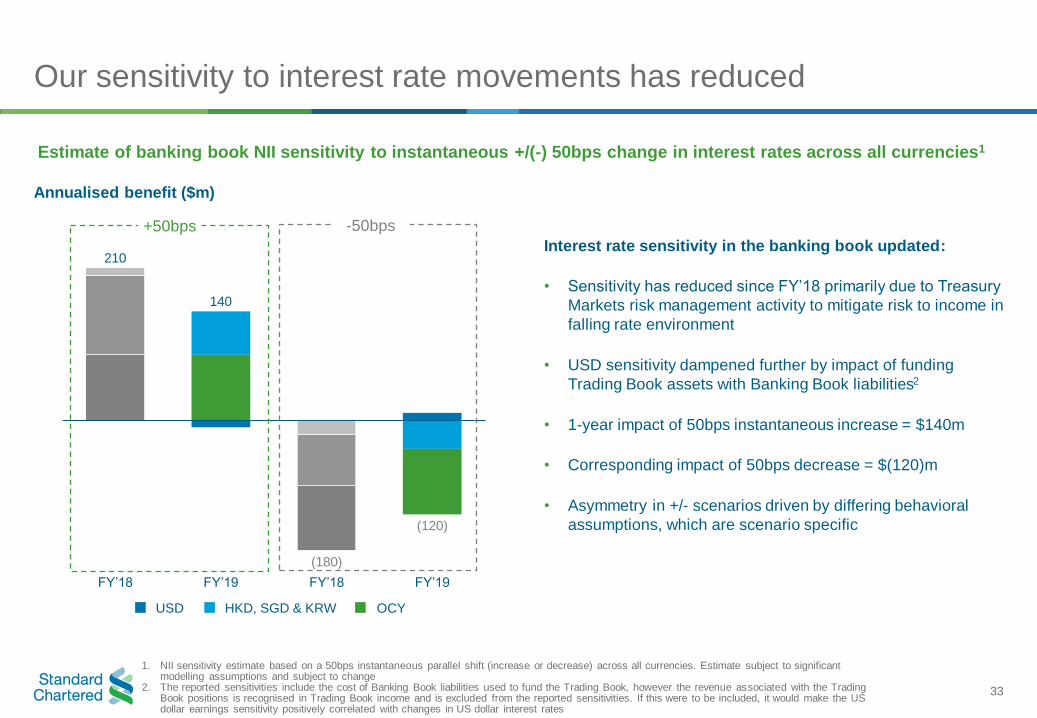
Our sensitivity to interest rate movements has reduced
Interest rate sensitivity in the banking book updated:
• Sensitivity has reduced since FY’18 primarily due to Treasury
Markets risk management activity to mitigate risk to income in
falling rate environment
• USD sensitivity dampened further by impact of funding
Trading Book assets with Banking Book liabilities2
• 1-year impact of 50bps instantaneous increase = $140m
• Corresponding impact of 50bps decrease = $(120)m
• Asymmetry in +/- scenarios driven by differing behavioral
assumptions, which are scenario specific
Estimate of banking book NII sensitivity to instantaneous +/(-) 50bps change in interest rates across all currencies1
Annualised benefit ($m)
210
FY’18
140
(180)
FY’19 FY’18 FY’19
(120)
-50bps+50bps
HKD, SGD & KRWUSD OCY
1. NII sensitivity estimate based on a 50bps instantaneous parallel shift (increase or decrease) across all currencies. Estimate subject to significant modelling assumptions and subject to change
2. The reported sensitivities include the cost of Banking Book liabilities used to fund the Trading Book, however the revenue associated with the Trading Book positions is recognised in Trading Book income and is excluded from the reported sensitivities. If this were to be included, it would make the US dollar earnings sensitivity positively correlated with changes in US dollar interest rates

34
Appendix:Fixed income information

35
47%
34%
10%
4%5%
CIB
RB
CB
PB
C&OI
40%
28%
17%
11%
4%
GCNA
ASA
AME
EA
C&OI
7%
18%
19%
8%5%
12%
8%
13%
3%7%
Trade Cash Mgmt & Custody
Financial Markets Corporate Finance
Lending Wealth Management
CCPL Deposits
Mortgage Treasury
markets income from Asia,
Africa &
Middle East
4 client segments &
4 regions
39%
24%
5%
20%
11%1%
FX
Rates
Commodities
Credit & Cap Mkt
CSDG
Other FM
Group income by productGroup income by region and segment
Standard Chartered overview
Financial
Markets
$15.3bn$15.3bn
$2.9bn
Over 160 years in some of the world's most dynamic markets FY’19 Performance highlights
59 >80% 4 $15.3bn(FY’18: $15.0bn)
$4.2bn(FY’18: $3.9bn)
13.8%(FY’18: 14.2%)
6.4%(FY’18: 5.1%)
Operating income Profit before taxation
Common equity tier 1 ratio Return on tangible equity
1
1. Includes Debit Valuation Adjustment of ($100m)

36
27%
9%
5%
13%3%2%
18%
8%
15%
Hong Kong
Korea
China
Singapore
India
UAE
UK
US
Other
50%
34%
8%
5%3%
CIB
RB
CB
PB
C&OI
25%
11%
5%
15%5%
3%
13%
5%
18%
Hong Kong
Korea
China
Singapore
India
UAE
UK
US
Other
55%32%
7%4% 2%
CIB
RB
CB
PB
C&OI
44%
23%
7%
7%
10%
9%Loans & advances to customers
Investment securities
Cash & balances at central banks
Derivatives
Loans & advances to banks
Other assets
68%4%
5%
7%
6%
2%8%
Customer accounts
Other debt securities in issue
Senior debt
Derivatives
Deposits by banks
Subordinated liabilities& other borrowed fundsOther liabilities
Balance sheet diversity
FY’19 Balance sheet assets
FY’19 Customer accounts by market and segment
FY’19 Customer loans & advances by market and segment
$720bn
$670bn
$315bn
$453bn
FY’19 Balance sheet liabilities
1. Loans & advances to customers includes FVTPL

37
92%
6% 2%Level 1
Level 2A
Level 2B
34%
15%2%
49%
Greater China &North Asia
ASEAN & SouthAsia
Africa & Middle East
Europe & Americas
$158bn
Liquid and resilient balance sheet
Total customer deposits ($bn) 1
Advances to deposits ratio ($bn) 1 FY’19 LCR eligible assets by region and type
Liquidity coverage ratio ($bn)
1. Excludes repurchase agreements and other similar secured borrowing
223 219 239
175 189 173
FY'18 1H'19 FY'19
CASA Time deposits & other
251 260 265
398 408 412
63% 64% 64%
FY'18 1H'19 FY'19
Loans and advances to customers Customer accounts
Advances to deposits ratio
398 408 412
150 155 158
97 111 110
154%
139%144%
FY'18 1H'19 FY'19
HQLA Net outflows Liquidity coverage ratio

38
CET1 requirements
4.5%
1.9%
1.0%
2.5%
FY'19 Requirements BoE stress test requirements
Capital Conservation Buffer
CCyB
G-SII
Pillar 2A
Pillar 1
AT1 conversion trigger: 7.0%
FY’19 MDA 5 threshold: 10.2%
FY’19 CET1: 13.8%
6.8%
~$18.0bn 4
3.6%
~$9.5bn 4
0.35%
BoE stress test hurdle rate: 6.9% 6
• Strong CET1 ratio at upper end of 13-14% target range
• Any breach of the MDA ¹ threshold would restrict discretionary distributions (dividends, variable pay and AT1 coupons)
• Combined Buffer comprises the G-SII buffer (G-SII), Countercyclical buffer (CCyB) and the Capital Conservation buffer ²
• FY’19 Standard Chartered PLC distributable reserves of $14.3bn
• Increase in UK CCyB to 2 per cent from 1 per cent is estimated to increase the Group’s CCyB by 6bps 3
1. MDA refers to Maximum Distributable Amount. This is based on the CET1 buffers in force as at 1 January 2019 2. The Combined Buffer is based on known requirements as at 31 December 2019 and is subject to change 3. Increase in UK countercyclical buffer will take effect from 16 December 2020. CCyB of 0.35% shown in the chart is the current requirement4. Absolute buffers are based on 31 December 2019 5. The MDA thresholds assumes that the maximum 2.1% of the Pillar 1 and Pillar 2A requirement has been met with AT16. Hurdle rate based on 2019 Bank of England Stress Test
6.9%
~$18.2bn 4

39
1. Hurdle rate based on 2019 Bank of England Stress Test2. Excludes SC PLC senior with a remaining maturity of less than 1 year3. Tier 2 instruments eligible under the MREL framework
• CET1 towards top of 13-14% target range: strong capital
supporting growth, higher dividends and share buy-backs
• Passed 2019 BoE stress test, increased resilience to stress:
lower stress drawdowns and higher stress buffers
• Lower leverage ratio an outcome of RWA optimisation, lower
RWA density, capital-lite growth and higher capital returns
• UK leverage ratio of 5.2%: substantial headroom to minimum
requirement of 3.7%
• Ahead of expected 2022 MREL of 26.7% today
Strong balance sheet position
CET1
AT1
Tier 2 3
PLCSenior
10.2%
6.9%
3.7%
26.7%
3.6%
6.9%
1.5%
1.9%
0%
5%
10%
15%
20%
25%
30%
FY'19 CET1Minimum
BoE SThurdle rate
UK LeverageRatio
MREL
Capital & MREL surplus vs. end-point requirements
2
Requirement surplus Requirement met
PLC Senior Tier 2 AT1 CET1
1
CET1 ratio – BoE Stress Test (%)
210bps
13.6% 13.6% 14.2%
7.6% 7.9%
9.0%
6.2%6.7% 6.9%
2017 result 2018 result 2019 result
CET1% Post MA CET1% BoE ST hurdle rate
Stress buffer
520bps
140bps
Stress drawdown600bps
1

40
Funding
USD EUR GBP OtherUSD
Total
Senior 12.4 3.4 0.8 3.3 19.9
Tier 2 9.7 3.3 0.9 0.5 14.4
AT1 6.5 0.0 0.3 0.6 7.3
Total 28.5 6.7 2.0 4.4 41.6
Currency mix ($bn) 1
1. SC PLC only 2. SC PLC & SCB: modelled on earlier of call date or maturity date3. United Nations Sustainable Development Goals
Maturity profile ($bn) 2
2019 SC PLC issuance of ~$7.7bn across 4 currencies
2.0 2.0 1.0 0.6
2.1
0.5
2.0
2.0 1.6
2.0
5.5
2.9
2.2
1.8
2020 2021 2022 2023 2024
AT1 Tier 2 PLC Senior
SGD 750m AT1 – Inaugural SGD AT1
• PNC5.25 at a coupon of 5.375%
• Diversified market access in a key market for the Group
USD 100m Senior – Formosa zero coupon
• 30NC5+5 at IRR 4.90%
• Inaugural SC PLC zero coupon issuance
AUD 1bn Senior – Dual tranche Kangaroo
• 6NC5 split between fixed and float
• Inaugural SC PLC AUD issuance
EUR 500m Senior – EM focused sustainability bond
• 8NC7 Sustainability Bond – 1st emerging markets focused
• Use of proceeds aligned to UN SDGs 3
USD MREL issuances
• Tier 2 USD 1bn (10.25NC5.25)
• Senior USD 4.8bn in total (3NC2, 6NC5, 11NC10)
• USD 2bn 6NC5 Senior and EUR 750m 8NC7 Senior in January
2020 issuance progress
41
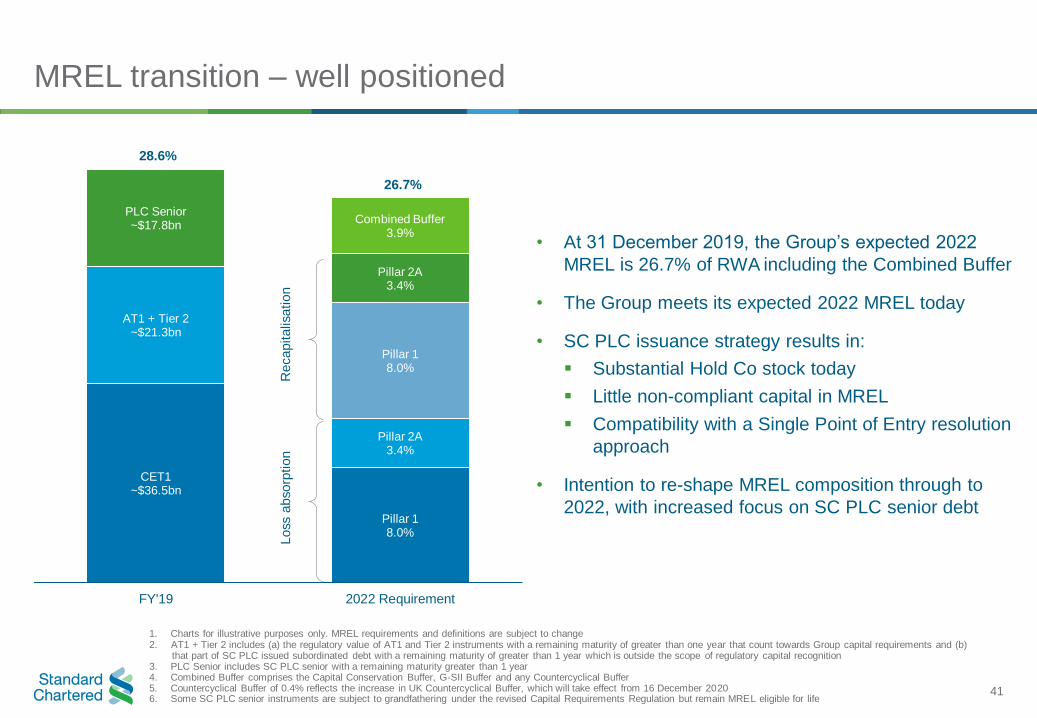
Pillar 18.0%
Pillar 2A3.4%
Pillar 18.0%
Pillar 2A3.4%
Combined Buffer3.9%
CET1~$36.5bn
AT1 + Tier 2~$21.3bn
PLC Senior ~$17.8bn
FY'19 2022 Requirement
MREL transition – well positioned
• At 31 December 2019, the Group’s expected 2022
MREL is 26.7% of RWA including the Combined Buffer
• The Group meets its expected 2022 MREL today
• SC PLC issuance strategy results in:
▪ Substantial Hold Co stock today
▪ Little non-compliant capital in MREL
▪ Compatibility with a Single Point of Entry resolution
approach
• Intention to re-shape MREL composition through to
2022, with increased focus on SC PLC senior debt
Loss a
bsorp
tion
Recapitalisation
28.6%
26.7%
1. Charts for illustrative purposes only. MREL requirements and definitions are subject to change2. AT1 + Tier 2 includes (a) the regulatory value of AT1 and Tier 2 instruments with a remaining maturity of greater than one year that count towards Group capital requirements and (b)
that part of SC PLC issued subordinated debt with a remaining maturity of greater than 1 year which is outside the scope of regulatory capital recognition3. PLC Senior includes SC PLC senior with a remaining maturity greater than 1 year4. Combined Buffer comprises the Capital Conservation Buffer, G-SII Buffer and any Countercyclical Buffer 5. Countercyclical Buffer of 0.4% reflects the increase in UK Countercyclical Buffer, which will take effect from 16 December 20206. Some SC PLC senior instruments are subject to grandfathering under the revised Capital Requirements Regulation but remain MREL eligible for life

42
Internal MREL
1. There are currently instruments issued externally from the Group’s main operating company (Standard Chartered Bank) and certain other banking subsidiaries, these instruments would rank pari-passu with internally issued instruments
2. Based on accounting carrying values
Group’s issuance framework (non-equity MREL)
• SC PLC is the sole issuer of external MREL
• External MREL down-streamed to material
subsidiaries via internal issuance
• Internal MREL required for the Group’s 5 material
subsidiaries
• Internal MREL scaled in the 75-90% range as per
FSB TLAC term sheet
• Expected sum of internal MREL < the Group’s
external MREL
• Internal instruments in the form of AT1, Tier 2 and
senior non-preferred
KR($0.5bn)
CN($0.0bn)
SG($1.8bn)
SC PLC($39.5bn)
UK($19.5bn)
Material Subs
External MREL
HK($5.1bn)
Internal MREL ($26.9bn)

43
Standard Chartered Group – simplified legal structure
Principal Branches Principal Subsidiaries
China
A+/-/A
India
UAE
South Africa
Japan
UK
Indonesia
US
Principal Subsidiaries 1
Standard Chartered Bank
Hong KongA+/A1/-
(S&P/Moody’s/Fitch)
Standard Chartered PLCBBB+/A2/A
(S&P/Moody’s/Fitch)
Standard Chartered BankA/A1/A+
(S&P/Moody’s/Fitch)
Singapore
A/A1/A
Nigeria
Malaysia
-/Baa1/-
100%
100%
100%
99.87%
100%
Germany
A/A1/A
Taiwan
A/-/A
Korea
A/A2/A
100%
100%
Thailand
-/Baa1/A-
100%
1. SCB China transferred to SCB Hong Kong on 1 June 2019; SCB Korea and SCB Taiwan transferred to SCB Hong Kong on 1 October 2019

44
Appendix:Sustainability

45
Impact Driven Financing Social Impact Responsible Banking
• We will lead in sustainable financing
across emerging markets
• 2.5 million households helped through
$1bn of microfinance loans
• Largest commercial provider of
blended finance 3
• Launched the world’s first blue bond
(Republic of Seychelles) and the first
Sustainable Deposit
• Managing the impact of our activities on
communities and the environment
• Standard Chartered ESG risk team
active since 1997
• Minimum standards & 7 position
statements govern our activity
• >19,000 individual client ESG
assessments each year
• $2.5tn SDG financing gap in emerging
and low income countries 1
• Achieving global CO2 targets will be
mainly driven in Africa and Asia
• SDGs 90% financed in developed
markets, 60% financed in developing
markets but only 10% financed in
Africa 2
Corporate Governance, Anti‐Corruption
Climate impact, pollution
and waste, biodiversity, prohibited
sectors
Labour standards,
supply chain, health and
safety
Collaboration with Development
Finance Institutions
Funding linked to desired social
outcomes
ESG filtersClimate
mitigation and adaption
Defined taxonomy
linking finance to SDGs
Our sustainable finance philosophy
1. UNDP report 2. https://www.unepfi.org/positive-impact/rethinking-impact3. Convergence

46
Standard Chartered Bank Presence
59 6 15 25 13 37
Footprintmarkets
Markets in Greater China &
North Asia
Markets in ASEAN & South
Asia
Markets in Africa & Middle East
Markets in Europe & America
OECD Development Assistance Committee countries in our footprint
Financing impact in some of the world’s least developed countries through a UK regulated institution…
#3 #1#1Trade bank worldwide 1 Project finance infrastructure
advisor in our markets 2Commercial provider of
blended finance 3
AAMSCI rating
We directly and indirectly support $2.8 billion
of value-added impact in East Africa…
Equivalent to 2.1% of the region’s GDP
We support direct and indirect employment
to 1.7% of the region’s labour force 4
1. Oliver Wyman Transaction Banking Benchmarking Study 20162. 2H’18 Dealogic Project Finance League Table3. Convergence4. SCB East Africa Study 2018
Standard Chartered: a unique opportunity
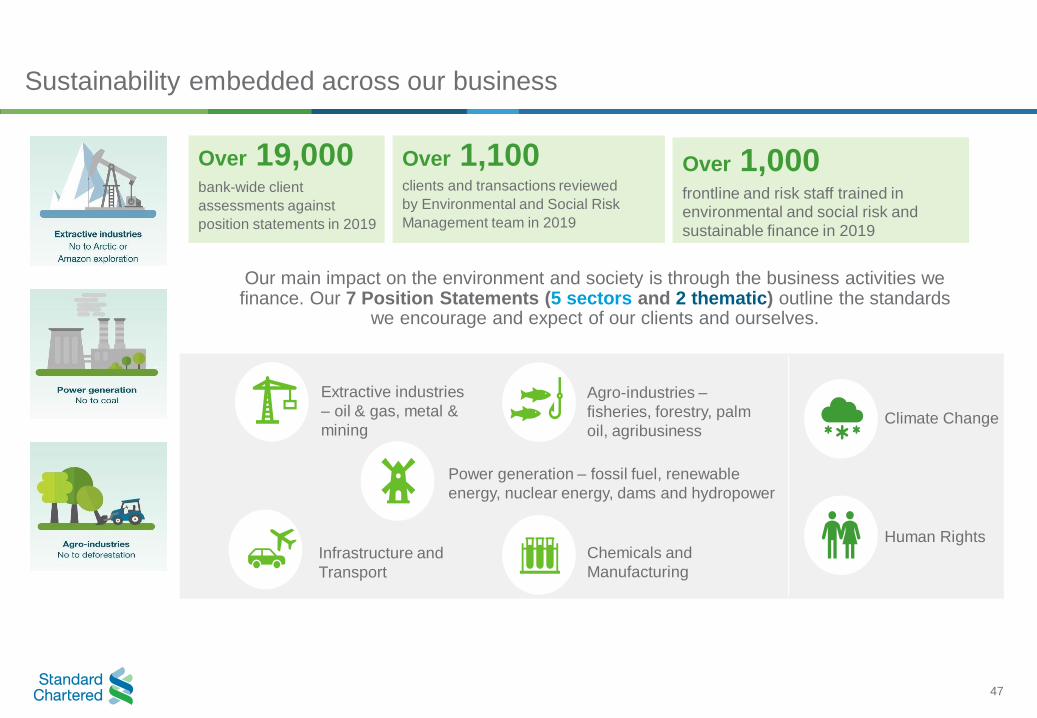
47
bank-wide client
assessments against
position statements in 2019
Over 19,000clients and transactions reviewed
by Environmental and Social Risk
Management team in 2019
Over 1,100frontline and risk staff trained in environmental and social risk and
sustainable finance in 2019
Over 1,000
Our main impact on the environment and society is through the business activities we finance. Our 7 Position Statements (5 sectors and 2 thematic) outline the standards
we encourage and expect of our clients and ourselves.
Extractive industries
– oil & gas, metal &
mining
Power generation – fossil fuel, renewable
energy, nuclear energy, dams and hydropower
Agro-industries –
fisheries, forestry, palm
oil, agribusiness
Infrastructure and
Transport
Chemicals and
Manufacturing
Human Rights
Climate Change
Sustainability embedded across our business
48
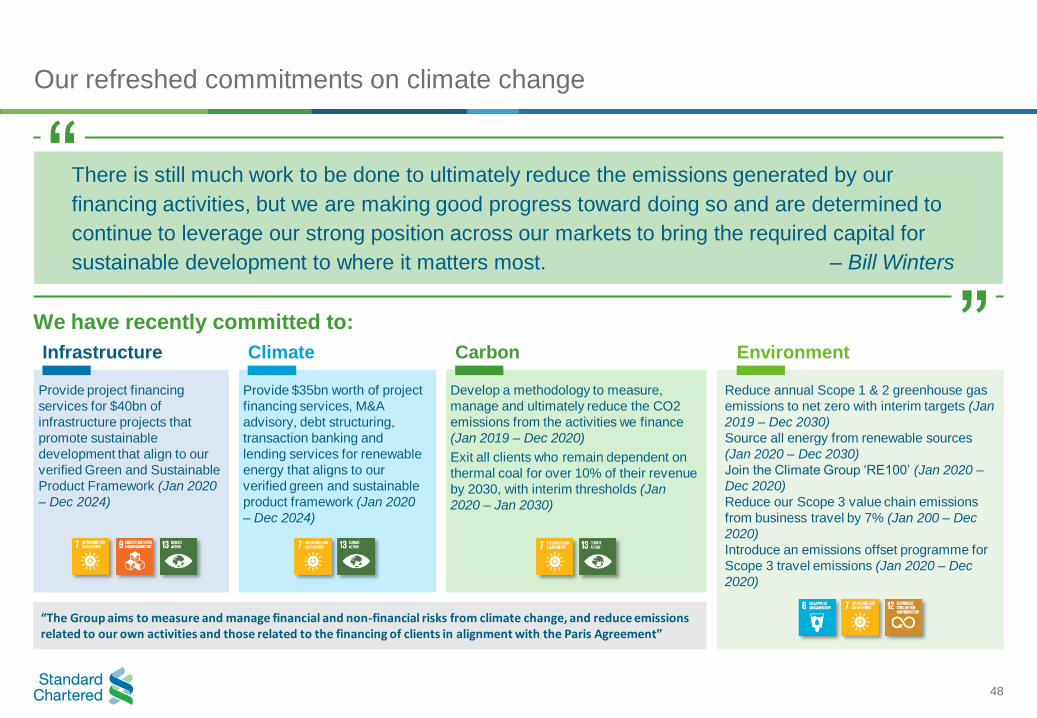
Our refreshed commitments on climate change
“The Group aims to measure and manage financial and non-financial risks from climate change, and reduce emissions related to our own activities and those related to the financing of clients in alignment with the Paris Agreement”
There is still much work to be done to ultimately reduce the emissions generated by our
financing activities, but we are making good progress toward doing so and are determined to
continue to leverage our strong position across our markets to bring the required capital for
sustainable development to where it matters most. – Bill Winters
“
”We have recently committed to:
Infrastructure
Provide project financing
services for $40bn of
infrastructure projects that
promote sustainable
development that align to our
verified Green and Sustainable
Product Framework (Jan 2020
– Dec 2024)
Climate
Provide $35bn worth of project
financing services, M&A
advisory, debt structuring,
transaction banking and
lending services for renewable
energy that aligns to our
verified green and sustainable
product framework (Jan 2020
– Dec 2024)
Carbon
Develop a methodology to measure,
manage and ultimately reduce the CO2
emissions from the activities we finance
(Jan 2019 – Dec 2020)
Exit all clients who remain dependent on
thermal coal for over 10% of their revenue
by 2030, with interim thresholds (Jan
2020 – Jan 2030)
Environment
Reduce annual Scope 1 & 2 greenhouse gas
emissions to net zero with interim targets (Jan
2019 – Dec 2030)
Source all energy from renewable sources
(Jan 2020 – Dec 2030)
Join the Climate Group ‘RE100’ (Jan 2020 –
Dec 2020)
Reduce our Scope 3 value chain emissions
from business travel by 7% (Jan 200 – Dec
2020)
Introduce an emissions offset programme for
Scope 3 travel emissions (Jan 2020 – Dec
2020)

49
Leading private sector catalyser of finance for the SDGs in our footprint
Green & Sustainable Product FrameworkGreen and Sustainable Product Framework launched in 2019 governs Green and Sustainable Products, developed with Sustainalytics
Sustainable Deposits…
• Launched the world’s first Sustainable Deposit which is
available in London, Singapore, Hong Kong and New York
• Sustainable Deposits give clients the chance to deposit funds
referenced to assets that align to UN SDGs
• Investors can put money to work addressing some of the
world’s biggest long term threats such as: climate change,
health, financial inclusion and education
• In Jan 2019 we hit our 12 month target 6 months early having
raised $1bn in Sustainable Deposits
Sustainability Bonds…
• Issued the Group’s inaugural EUR 500m emerging markets
focused Sustainability Bond
• First emerging markets focussed sustainability bond bringing
capital to where it matters most to combat climate change
and increase access to finance for entrepreneurs
• Impact in emerging markets, but credit risk against Standard
Chartered PLC
Green and Sustainability Linked Loans
• 909% growth year on year in green and sustainable loans to
clients from $3.2bn to $29.1bn (2018 vs. 2019)
Green, Social and Sustainability Bonds
• 201% growth year on year in green, social and sustainability
bonds to clients from $9.1bn to $18.3bn (2018 vs. 2019)
Renewables & Clean tech
• 690% growth year on year in renewables & clean tech from
$2.9bn to $20bn (2018 vs. 2019)
Sustainable infrastructure
• 7% growth year on year in sustainable infrastructure from
$20.8bn to $22.3bn (2018 vs. 2019)

50
Financing the SDGs where it matters the most
• Leader in sustainable finance, acting
as book runner and placement agent
for the landmark $12m Women’s
Livelihood Bond
• Thought leader in dialogue with the
Green Bond Principles and Climate
Bond Initiative organisations
• SC PLC issued the first emerging markets
focused sustainability bond in June 2019
• Launched the world's first Sustainable
Deposit, dedicated to financing sustainable
assets in developing countries aligned to the
United Nations SDGs
• World’s first Islamic finance
sustainability loan via an USD 2bn
Conventional and Murabaha RCF for
DP World
• Green-line syndicated loan: Türk
Eximbank’s EUR 348m and USD 140m
MIGA-covered loan
• Market leader in blended finance,
having led several award winning
debt raisings in Ghana, Kenya,
Pakistan, South Africa, Sierra Leone
Leadership in Sustainable Finance Committed to Sustainability
Environmental and Social Risk Management policy created in 1997
‘Here for good’ brand promise established in 2000
Launched Sustainability philosophy in 2018
Sustainable finance team promoting Environment, Social, and Governance (ESG) and Sustainable Development Goal (SDG) financing globally
Market leader in originating and executing Green, Social, and Sustainability bonds
New emissions cap commitment in 2018
Committed specialist team looking at clean technology solutions
Pioneering Solutions in the Industry
Africa’s Best Bank for Sustainable Finance 2019
Deal of the Year 2018
Asia Pacific Green/SRI Bond
Best SRI Bond 2016
TSKB’s Green / Sustainable Bond
Green Bond Pioneer Award 2019
Republic of Seychelles’ Blue Bond
Green Finance Deal of the Year (Middle East) 2019
DP World’s $2bn Green Revolving Credit Facility
Renewable Energy Deal of the year – Solar - 2019
Wardha Solar (Maharashtra) Private Limited
Best Green Bond 2018
Agricultural Development Bank of China Green Bond
#1 Bank in Blended Finance
World’s Best for Sustainable Finance

51
Sustainable finance governance
We have overhauled our sustainable finance, climate and sustainability governance this year with dedicated
forums reporting to management and the Board
• This gives greater board oversight over sustainability matters, including climate risk and sustainable finance
• Tighter controls on labelling of green and sustainable transactions to ensure there is no greenwashing or SDG washing
Sustainable Finance
Champions
Climate Risk Management
Forum
Group Risk Committee
Board
Sustainable Finance
Working Group
Human Rights Working
Group
Brand, Values and Conduct
Committee
Sustainability Bond
Committee
Board Risk Committee
Sustainability Forum

52
Appendix:Definitions and important notice
53
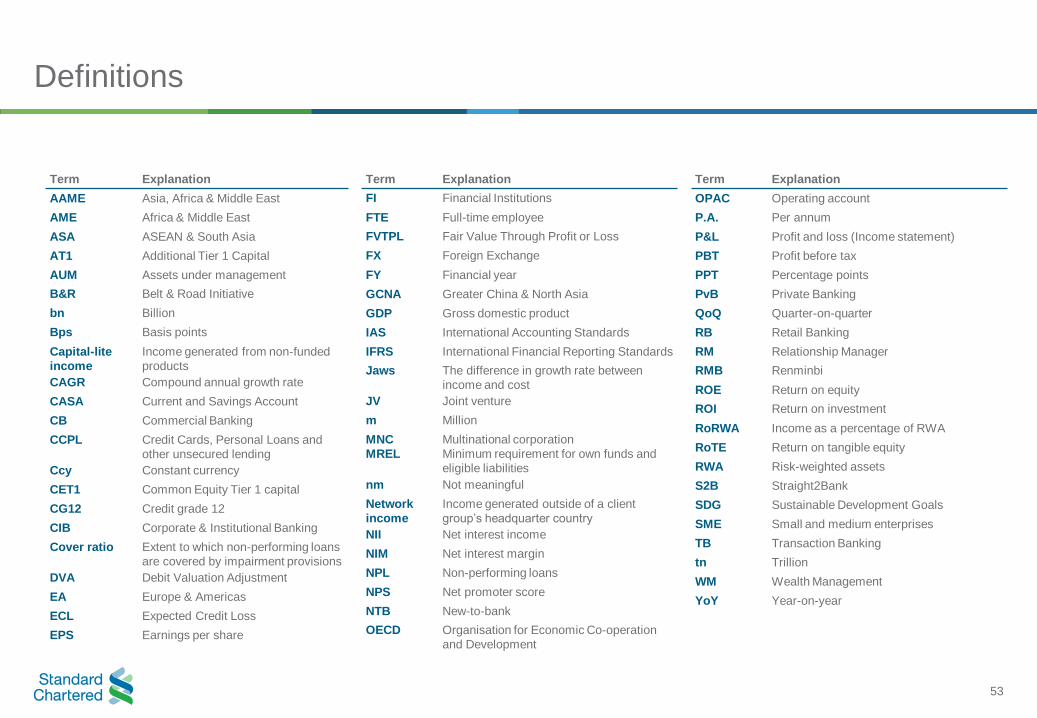
Definitions
Term Explanation
AAME Asia, Africa & Middle East
AME Africa & Middle East
ASA ASEAN & South Asia
AT1 Additional Tier 1 Capital
AUM Assets under management
B&R Belt & Road Initiative
bn Billion
Bps Basis points
Capital-lite
income
Income generated from non-funded
products
CAGR Compound annual growth rate
CASA Current and Savings Account
CB Commercial Banking
CCPL Credit Cards, Personal Loans and
other unsecured lending
Ccy Constant currency
CET1 Common Equity Tier 1 capital
CG12 Credit grade 12
CIB Corporate & Institutional Banking
Cover ratio Extent to which non-performing loans
are covered by impairment provisions
DVA Debit Valuation Adjustment
EA Europe & Americas
ECL Expected Credit Loss
EPS Earnings per share
Term Explanation
OPAC Operating account
P.A. Per annum
P&L Profit and loss (Income statement)
PBT Profit before tax
PPT Percentage points
PvB Private Banking
QoQ Quarter-on-quarter
RB Retail Banking
RM Relationship Manager
RMB Renminbi
ROE Return on equity
ROI Return on investment
RoRWA Income as a percentage of RWA
RoTE Return on tangible equity
RWA Risk-weighted assets
S2B Straight2Bank
SDG Sustainable Development Goals
SME Small and medium enterprises
TB Transaction Banking
tn Trillion
WM Wealth Management
YoY Year-on-year
Term Explanation
FI Financial Institutions
FTE Full-time employee
FVTPL Fair Value Through Profit or Loss
FX Foreign Exchange
FY Financial year
GCNA Greater China & North Asia
GDP Gross domestic product
IAS International Accounting Standards
IFRS International Financial Reporting Standards
Jaws The difference in growth rate between
income and cost
JV Joint venture
m Million
MNC
MREL
Multinational corporation
Minimum requirement for own funds and
eligible liabilities
nm Not meaningful
Network
income
Income generated outside of a client
group’s headquarter country
NII Net interest income
NIM Net interest margin
NPL Non-performing loans
NPS Net promoter score
NTB New-to-bank
OECD Organisation for Economic Co-operation
and Development

54
This document contains or incorporates by reference “forward-looking statements” regarding the belief or current expectations of Standard Chartered PLC (the “Company”), the board
of the Company (the “Directors”) and other members of its senior management about the strategy, businesses and performance of the Company and its subsidiaries (the “Group”) and
the other matters described in this document. Generally, words such as ‘‘may’’, ‘‘could’’, ‘‘will’’, ‘‘expect’’, ‘‘intend’’, ‘‘estimate’’, ‘‘anticipate’’, ‘‘believe’’, ‘‘plan’’, ‘‘seek’’, ‘‘continue’’ or
similar expressions are intended to identify forward-looking statements.
Forward-looking statements involve inherent risks and uncertainties. They are not guarantees of future performance and actual results could differ materially from those contained in
the forward-looking statements. Recipients should not place reliance on, and are cautioned about relying on, any forward-looking statements. Forward-looking statements are based on
current views, estimates and assumptions and involve known and unknown risks, uncertainties and other factors, many of which are outside the control of the Group and are difficult to
predict. Such risks, factors and uncertainties may cause actual results to differ materially from any future results or developments expressed or implied from the forward-looking
statements. Such risks, factors and uncertainties include but are not limited to: changes in the credit quality and the recoverability of loans and amounts due from counterparties;
changes in the Group’s financial models incorporating assumptions, judgments and estimates which may change over time; risks relating to capital, capital management and liquidity;
risks associated with implementation of Basel III and uncertainty over the timing and scope of regulatory changes in various jurisdictions in which the Group operates; risks arising out
of legal and regulatory matters, investigations and proceedings; operational risks inherent in the Group’s business; risks arising out of the Group’s holding company structure; risks
associated with the recruitment, retention and development of senior management and other skilled personnel; risks associated with business expansion and engaging in acquisitions;
reputational, compliance, conduct, information and cyber security and financial crime risks; global macroeconomic and geopolitical risks; risks arising out of the dispersion of the
Group’s operations, the locations of its businesses and the legal, political and economic environment in such jurisdictions; competition; risks associated with the UK Banking Act 2009
and other similar legislation or regulations; changes in the credit ratings or outlook for the Group; market, interest rate, commodity prices, equity price and other market risk; foreign
exchange risk; financial market volatility; systemic risk in the banking industry and among other financial institutions or corporate borrowers; country risk; risks arising from operating in
markets with less developed judicial and dispute resolution systems; risks arising out of regional hostilities, terrorist attacks, social unrest or natural disasters; climate related transition
and physical risks; business model disruption risks; the implications of a post-Brexit and the disruption that may result in the United Kingdom and globally from the withdrawal of the
United Kingdom from the European Union; and failure to generate sufficient level of profits and cash flows to pay future dividends.
Any forward-looking statement contained in this document is based on past or current trends and/or activities of the Company and should not be taken as a representation that such
trends or activities will continue in the future. No statement in this document is intended to be a profit forecast or to imply that the earnings of the Company and/or the Group for the
current year or future years will necessarily match or exceed the historical or published earnings of the Company and/or the Group. Each forward-looking statement speaks only as of
the date of the particular statement. Except as required by any applicable law or regulations, the Company expressly disclaims any obligation or undertaking to release publicly or
make any updates or revisions to any forward-looking statement contained herein whether as a result of new information, future events or otherwise.
Nothing in this document shall constitute, in any jurisdiction, an offer or solicitation to sell or purchase any securities or other financial instruments, nor shall it constitute a
recommendation or advice in respect of any securities or other financial instruments or any other matter.
Important notice