Embed Size (px)
Citation preview

FY2018 1 st Quarter Business Result
Yamaha Motor Co., Ltd.May 10, 2018
(Ticker symbol:7272)Premium Boat
EXULT43
● Forecast Consolidated Results
Forecast consolidated results stated herein are based on the management's assumptions and beliefs in light of information currently available and involve risks and uncertainties. Please be advised that actual results may differ significantly from those discussed in the Forecast Consolidated Results. Potential risks and uncertainties include, but are not limited to, general economic conditions in Yamaha Motor’s major markets, changing consumer preferences and currency exchange rate fluctuations.
Agenda
FY2018 Business Resultsfor First Quarter
Tatsumi Okawa Director
2
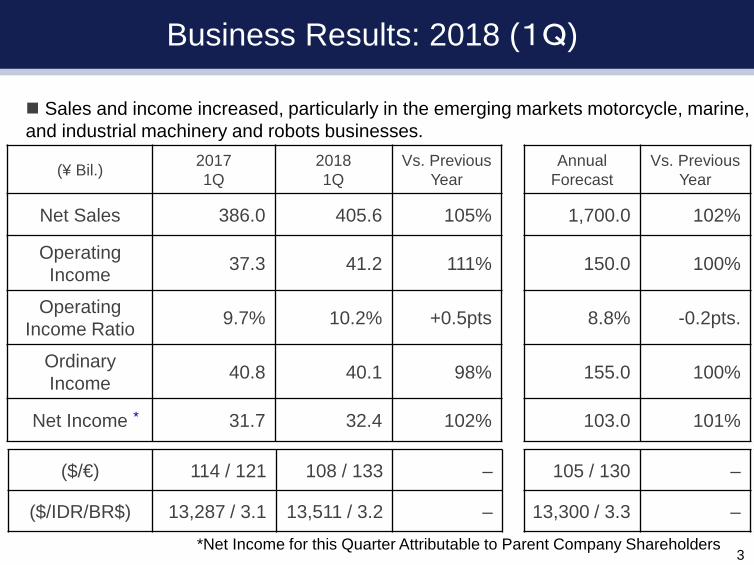
Business Results: 2018 (1Q)
(¥ Bil.) 20171Q
20181Q
Vs. Previous Year
Annual Forecast
Vs. Previous Year
Net Sales 386.0 405.6 105% 1,700.0 102%
Operating Income 37.3 41.2 111% 150.0 100%
Operating Income Ratio 9.7% 10.2% +0.5pts 8.8% -0.2pts.
Ordinary Income 40.8 40.1 98% 155.0 100%
Net Income 31.7 32.4 102% 103.0 101%
($/€) 114 / 121 108 / 133 – 105 / 130 –
($/IDR/BR$) 13,287 / 3.1 13,511 / 3.2 – 13,300 / 3.3 –
*Net Income for this Quarter Attributable to Parent Company Shareholders
*
Sales and income increased, particularly in the emerging markets motorcycle, marine, and industrial machinery and robots businesses.
3
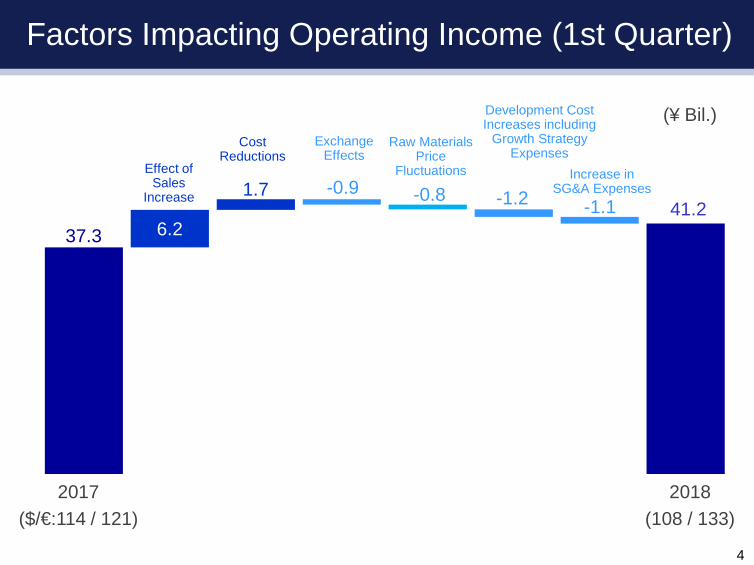
37.3 6.2
1.7 -0.9 -0.8 -1.2 -1.1 41.2
Cost Reductions
Increase in SG&A Expenses
Effect of Sales
Increase
Exchange Effects
Raw Materials Price
Fluctuations
Development Cost Increases including
Growth Strategy Expenses
2017($/€:114 / 121)
2018(108 / 133)
(¥ Bil.)
4
Factors Impacting Operating Income (1st Quarter)
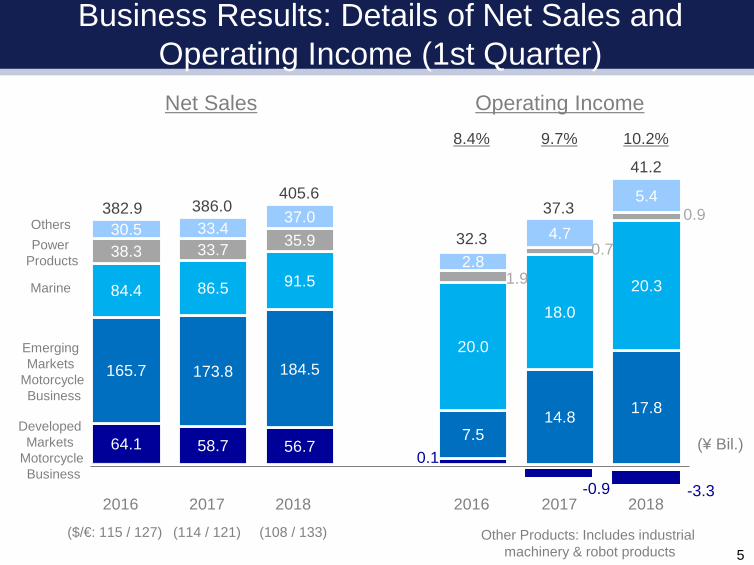
64.1 58.7 56.7
165.7 173.8 184.5
84.4 86.5 91.5
38.3 33.7 35.930.5 33.4
37.0
0.17.5
14.8 17.8
20.0
18.020.31.9
0.7
0.9
2.8
4.7
5.4
0
100
200
300
400
500
600
0
1,000
2,000
3,000
4,000
5,000
6,000
-0.9
Net Sales Operating Income
Others
Marine
PowerProducts
Emerging Markets
MotorcycleBusiness
Other Products: Includes industrialmachinery & robot products
9.7% 10.2%
(¥ Bil.)
8.4%
2017 20182016 2017 20182016
Developed Markets
MotorcycleBusiness
382.9 386.0405.6
32.3
37.3
41.2
Business Results: Details of Net Sales and Operating Income (1st Quarter)
5($/€: 115 / 127) (114 / 121) (108 / 133)
-3.3
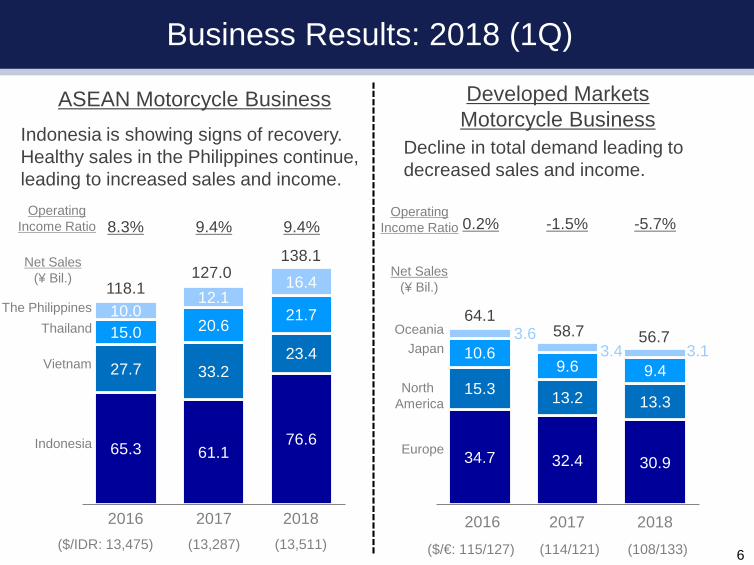
65.3 61.176.6
27.7 33.223.4
15.0 20.621.710.0
12.116.4
16年 17年 18年
Business Results: 2018 (1Q)
ASEAN Motorcycle Business
Net Sales (¥ Bil.)
Operating Income Ratio
118.1127.0
The Philippines
138.1
8.3% 9.4% 9.4%
Vietnam
Thailand
Indonesia
2016 2017 2018
Indonesia is showing signs of recovery. Healthy sales in the Philippines continue, leading to increased sales and income.
6($/IDR: 13,475) (13,287) (13,511)
34.7 32.4 30.9
15.3 13.2 13.3
10.69.6 9.4
3.63.4 3.1
16年 17年 18年
Developed MarketsMotorcycle Business
Net Sales (¥ Bil.)
Operating Income Ratio
64.158.7
Europe
NorthAmerica
OceaniaJapan
56.7
0.2% -1.5% -5.7%
2016 2017 2018
Decline in total demand leading to decreased sales and income.
($/€: 115/127) (114/121) (108/133)
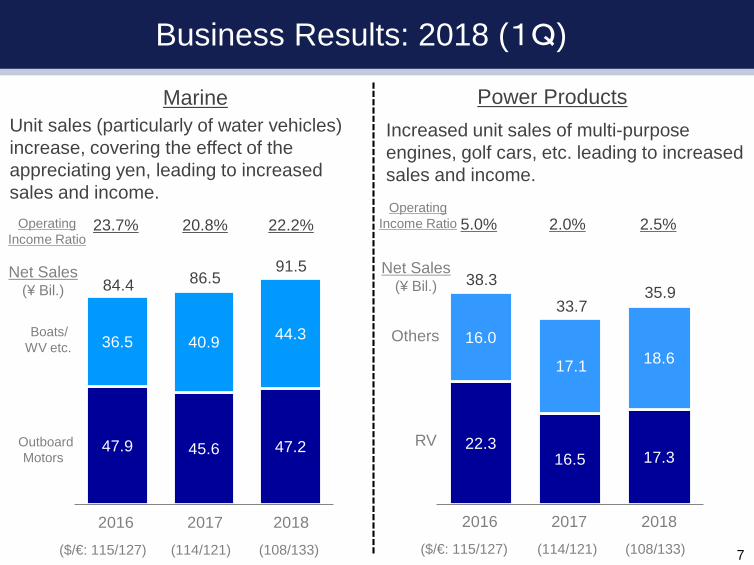
47.9 45.6 47.2
36.5 40.9 44.3
16年 17年 18年
Business Results: 2018 (1Q)
Outboard Motors
Boats/ WV etc.
84.4 86.5
23.7% 20.8%
91.5
22.2%
Net Sales (¥ Bil.)
Operating Income Ratio
2016 2017 2018
MarineUnit sales (particularly of water vehicles) increase, covering the effect of the appreciating yen, leading to increased sales and income.
7($/€: 115/127) (114/121) (108/133)
22.316.5 17.3
16.0
17.1 18.6
16年 17年 18年
38.3
RV
Others
33.735.9
5.0% 2.0% 2.5%
Power Products
Net Sales (¥ Bil.)
Operating Income Ratio
2016 2017 2018
($/€: 115/127) (114/121) (108/133)
Increased unit sales of multi-purpose engines, golf cars, etc. leading to increased sales and income.
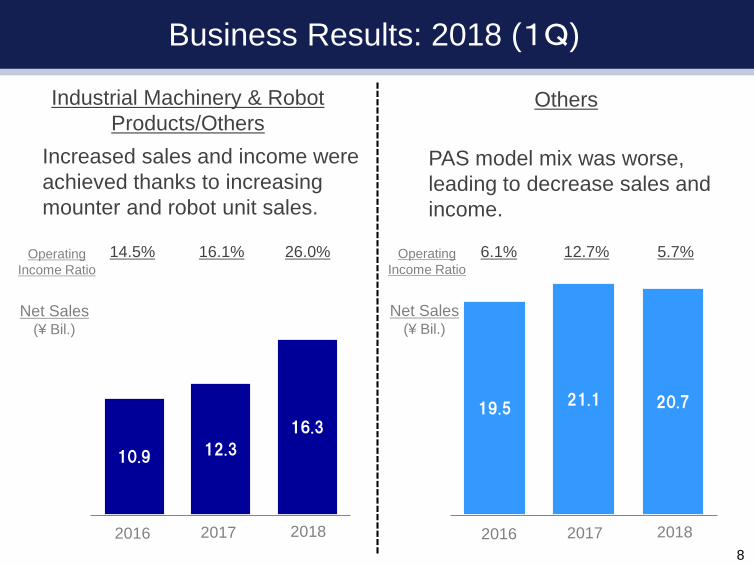
10.9 12.3
16.3
16年 17年 18年
19.521.1 20.7
16年 17年 18年
Business Results: 2018 (1Q)
Increased sales and income were achieved thanks to increasing mounter and robot unit sales.
8
Industrial Machinery & Robot Products/Others
Net Sales (¥ Bil.)
Operating Income Ratio
2016 2017 2018
14.5% 16.1% 26.0% 6.1% 12.7% 5.7%
2016 2017 2018
Others
PAS model mix was worse, leading to decrease sales and income.
Net Sales (¥ Bil.)
Operating Income Ratio

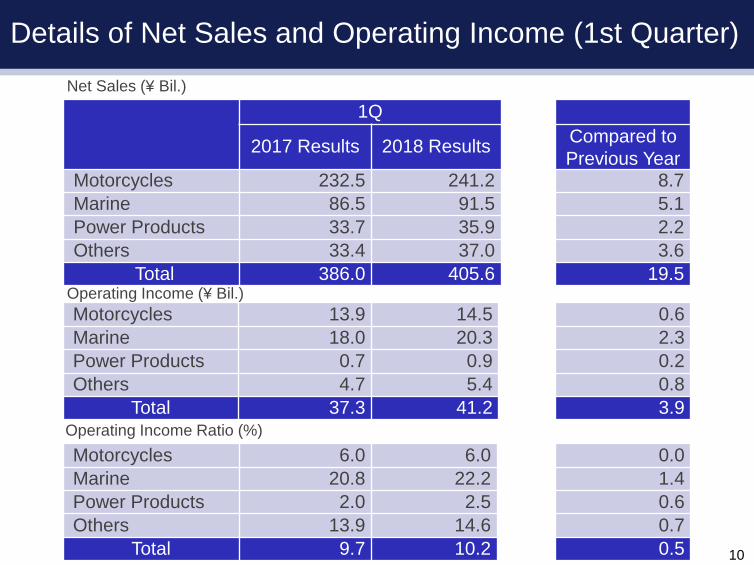
1Q
2017 Results 2018 Results Compared to Previous Year
Motorcycles 232.5 241.2 8.7Marine 86.5 91.5 5.1Power Products 33.7 35.9 2.2Others 33.4 37.0 3.6
Total 386.0 405.6 19.5
Motorcycles 13.9 14.5 0.6Marine 18.0 20.3 2.3Power Products 0.7 0.9 0.2Others 4.7 5.4 0.8
Total 37.3 41.2 3.9
Motorcycles 6.0 6.0 0.0Marine 20.8 22.2 1.4Power Products 2.0 2.5 0.6Others 13.9 14.6 0.7
Total 9.7 10.2 0.5
Net Sales (¥ Bil.)
Operating Income (¥ Bil.)
Operating Income Ratio (%)
10
Details of Net Sales and Operating Income (1st Quarter)
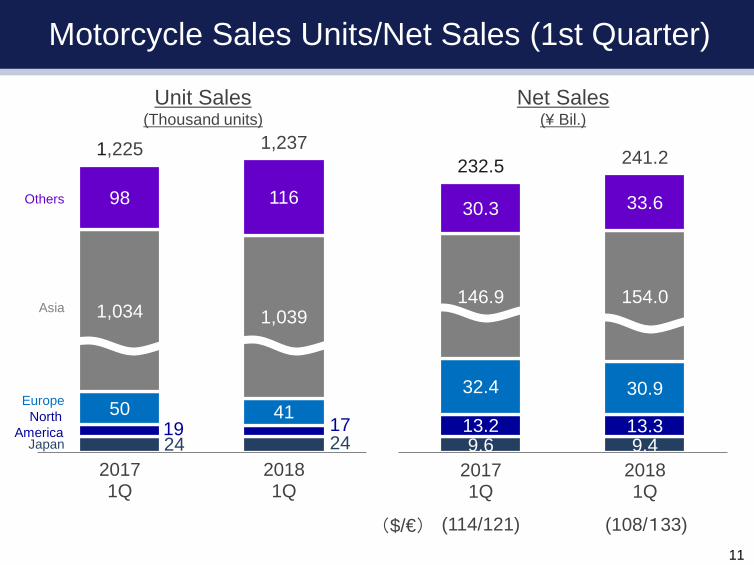
24 2419 17
50 41
1,034 1,039
98 116
1,225 1,237
20171Q
20181Q
9.6 9.413.2 13.3
32.4 30.9
146.9 154.0
30.3 33.6
232.5 241.2
20171Q
20181Q
Net Sales(¥ Bil.)
Unit Sales(Thousand units)
Asia
EuropeNorth
AmericaJapan
Others
(108/133)(114/121)($/€)11
Motorcycle Sales Units/Net Sales (1st Quarter)
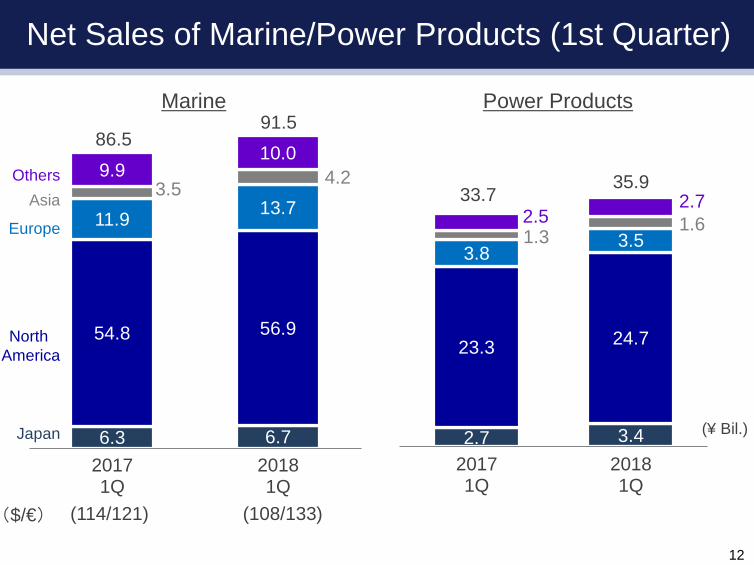
6.3 6.7
54.8 56.9
11.9 13.73.5 4.29.9
10.0
20171Q
20181Q
2.7 3.4
23.3 24.7
3.83.51.3
1.62.52.7
20171Q
20181Q
Asia
Europe
North America
Japan
Others
Marine Power Products
(¥ Bil.)
86.591.5
33.735.9
(114/121) (108/133)
Net Sales of Marine/Power Products (1st Quarter)
12
($/€)
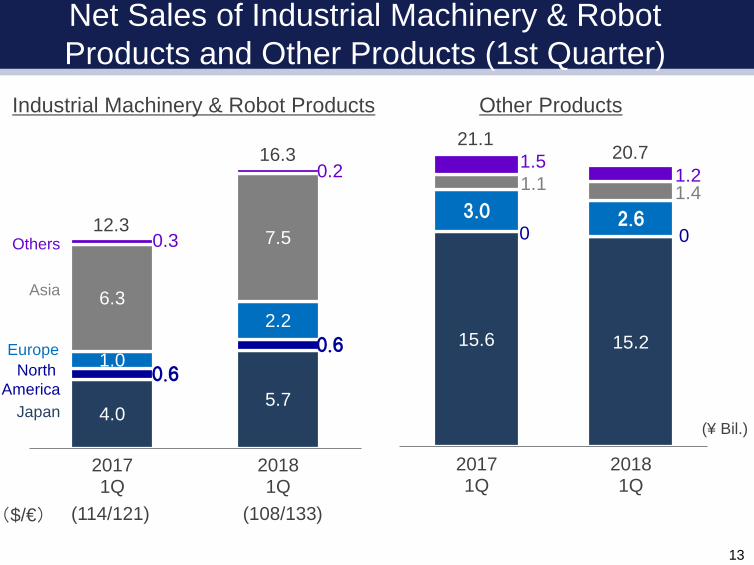
4.05.7
0.6
0.61.0
2.26.3
7.50.3
0.2
20171Q
20181Q
15.6 15.2
0 03.0 2.6
1.1 1.4
1.51.2
20171Q
20181Q
Asia
EuropeNorth
AmericaJapan
Others
Industrial Machinery & Robot Products Other Products
(¥ Bil.)
12.3
16.321.1
20.7
(114/121) (108/133)
Net Sales of Industrial Machinery & Robot Products and Other Products (1st Quarter)
13
($/€)
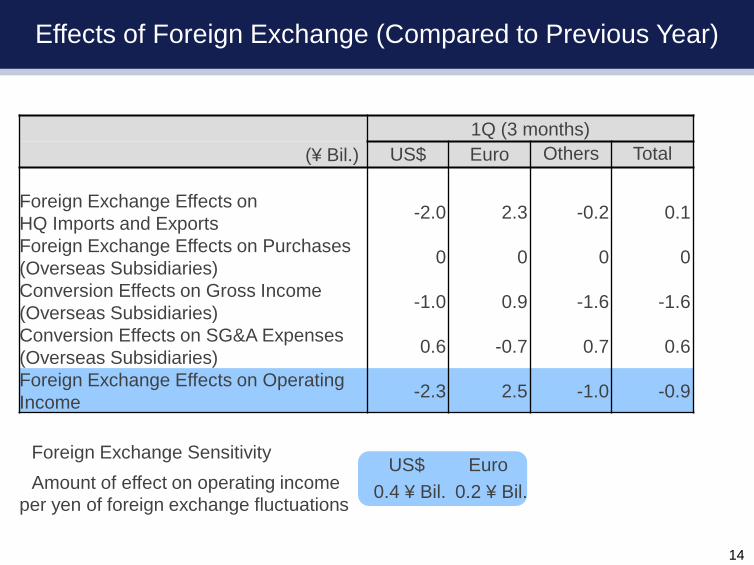
1Q (3 months)(¥ Bil.) US$ Euro Others Total
Foreign Exchange Effects onHQ Imports and Exports -2.0 2.3 -0.2 0.1
Foreign Exchange Effects on Purchases (Overseas Subsidiaries) 0 0 0 0
Conversion Effects on Gross Income (Overseas Subsidiaries) -1.0 0.9 -1.6 -1.6
Conversion Effects on SG&A Expenses (Overseas Subsidiaries) 0.6 -0.7 0.7 0.6
Foreign Exchange Effects on Operating Income -2.3 2.5 -1.0 -0.9
Foreign Exchange SensitivityAmount of effect on operating income
per yen of foreign exchange fluctuations
US$0.4 ¥ Bil.
Euro0.2 ¥ Bil.
14
Effects of Foreign Exchange (Compared to Previous Year)
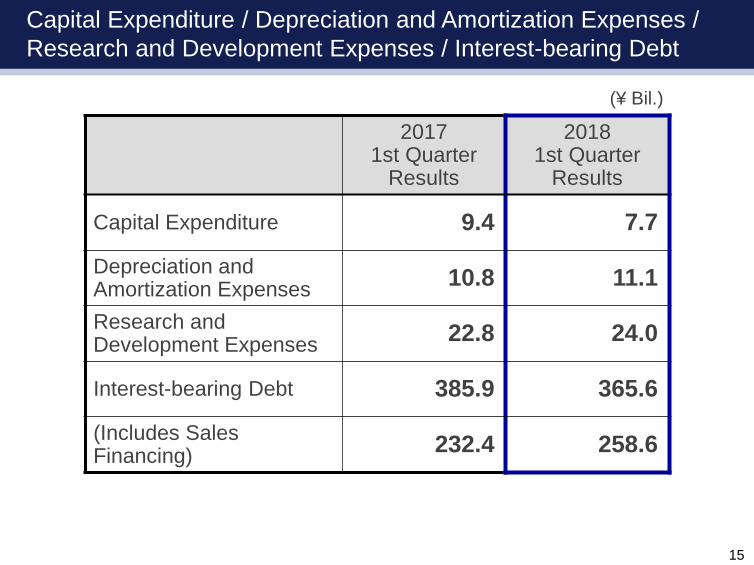
20171st Quarter
Results
20181st Quarter
Results
Capital Expenditure 9.4 7.7
Depreciation and Amortization Expenses 10.8 11.1
Research and Development Expenses 22.8 24.0
Interest-bearing Debt 385.9 365.6
(Includes Sales Financing) 232.4 258.6
(¥ Bil.)
15
Capital Expenditure / Depreciation and Amortization Expenses / Research and Development Expenses / Interest-bearing Debt