Embed Size (px)
Citation preview
Toyota Motor CorporationFebruary 4, 2015
MIRAI
FY2015 Third QuarterFinancial Results
2
Cautionary Statement with Respect to Forward-Looking StatementsThis presentation contains forward-looking statements that reflect Toyota’s plans and expectations. These forward-looking statements are not guarantees of future performance and involve known and unknown risks, uncertainties and other factors that may cause Toyota’s actual results, performance, achievements or financial position to be materially different from any future results, performance, achievements or financial position expressed or implied by these forward-looking statements. These factors include, but are not limited to: (i) changes in economic conditions, market demand, and the competitive environment affecting the automotive markets in Japan, North America, Europe, Asia and other markets inwhich Toyota operates; (ii) fluctuations in currency exchange rates, particularly with respect to the value of the Japanese yen, the U.S. dollar, the euro, the Australian dollar, the Russian ruble, the Canadian dollar and the British pound, and interest rates fluctuations; (iii) changes in funding environment in financial markets and increased competition in the financial services industry; (iv) Toyota’s ability to market and distribute effectively; (v) Toyota’s ability to realize production efficiencies and to implement capital expenditures at the levels and times planned by management; (vi) changes in the laws, regulations and government policies in the markets in which Toyota operates that affect Toyota’s automotive operations, particularly laws, regulations and government policies relating to vehicle safety including remedial measures such as recalls, trade, environmental protection, vehicle emissions and vehicle fuel economy, as well as changes in laws, regulations and government policies that affect Toyota’s other operations, including the outcome of current and future litigation and other legal proceedings, government proceedings and investigations; (vii) political and economic instability in the markets in which Toyota operates; (viii) Toyota’s ability to timely develop and achieve market acceptance of new products that meet customer demand; (ix) any damage to Toyota’s brand image; (x) Toyota’s reliance on various suppliers for the provision of supplies; (xi) increases in prices of raw materials; (xii) Toyota’s reliance on various digital and information technologies; (xiii) fuel shortages or interruptions in electricity, transportation systems, labor strikes, work stoppages or other interruptions to, or difficulties in, the employment of labor in the major markets where Toyota purchases materials, components and supplies for the production of its products or where its products are produced, distributed orsold; and (xiv) the impact of natural calamities including the negative effect on Toyota’s vehicle production and sales.A discussion of these and other factors which may affect Toyota’s actual results, performance, achievements or financial position is contained in Toyota’s annual report on Form 20-F, which is on file with the United States Securities and Exchange Commission.
3
Caution concerning Insider TradingUnder Japanese securities laws and regulations (the "Regulations"), subject to certain exceptions, any person who receives certain material information relating to the business, etc. of Toyota which may be contained in this document is prohibited from trading in Toyota's shares or certain other transactions related to such shares (as set forth in the Regulations) until such material information is deemed to be made public. Under the Regulations, material information is deemed to be made public when (i) such material information is notified to a stock exchange and is disclosed by ways of electromagnetic means as prescribed by the ordinance of the Cabinet Office (posting on the TDnet (Timely Disclosure Network) information service ) or (ii) twelve (12) hours have elapsed since a listed company, such as Toyota, disclosed such material information to at least two (2) media sources as prescribed by the Regulations.
FY2015 Third QuarterFinancial Results
FY2015 Third Quarter Financial Performance
FY2015 Financial Forecasts
4
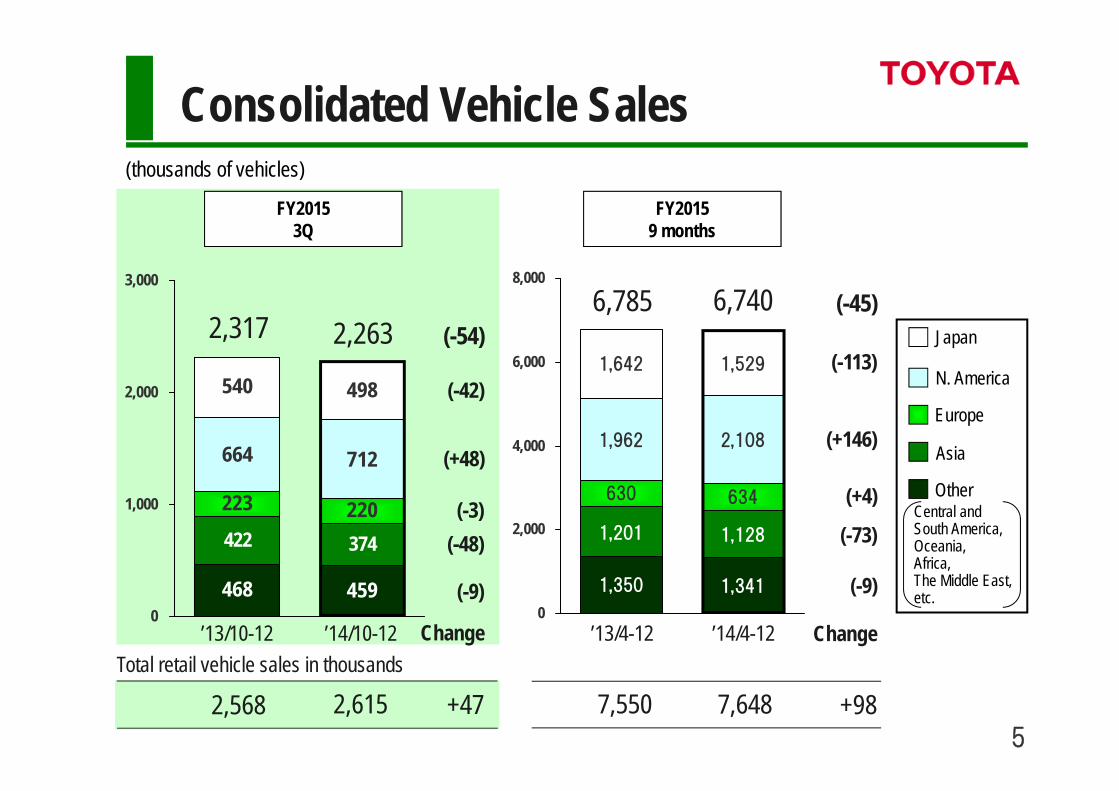
52,568 2,615 +47
FY20153Q
7,550 7,648 +98
FY20159 months
1,350 1,341
1,201 1,128
630 634
1,962
1,642 1,529
2,108
0
2,000
4,000
6,000
8,000
468 459
422 374
223 220
664 712
540 498
0
1,000
2,000
3,0006,740
2,317 2,2636,785
’13/10-12 Change’14/10-12 ’13/4-12 ’14/4-12
Japan
Asia
Europe
N. America
Other
(-54)
(-42)
(+48)
(-3)(-48)
(-9)
(-45)
(-113)
(+146)
(+4)
(-73)
(-9)
Change
Consolidated Vehicle Sales(thousands of vehicles)
Total retail vehicle sales in thousands
Central and South America, Oceania,Africa,The Middle East, etc.
6
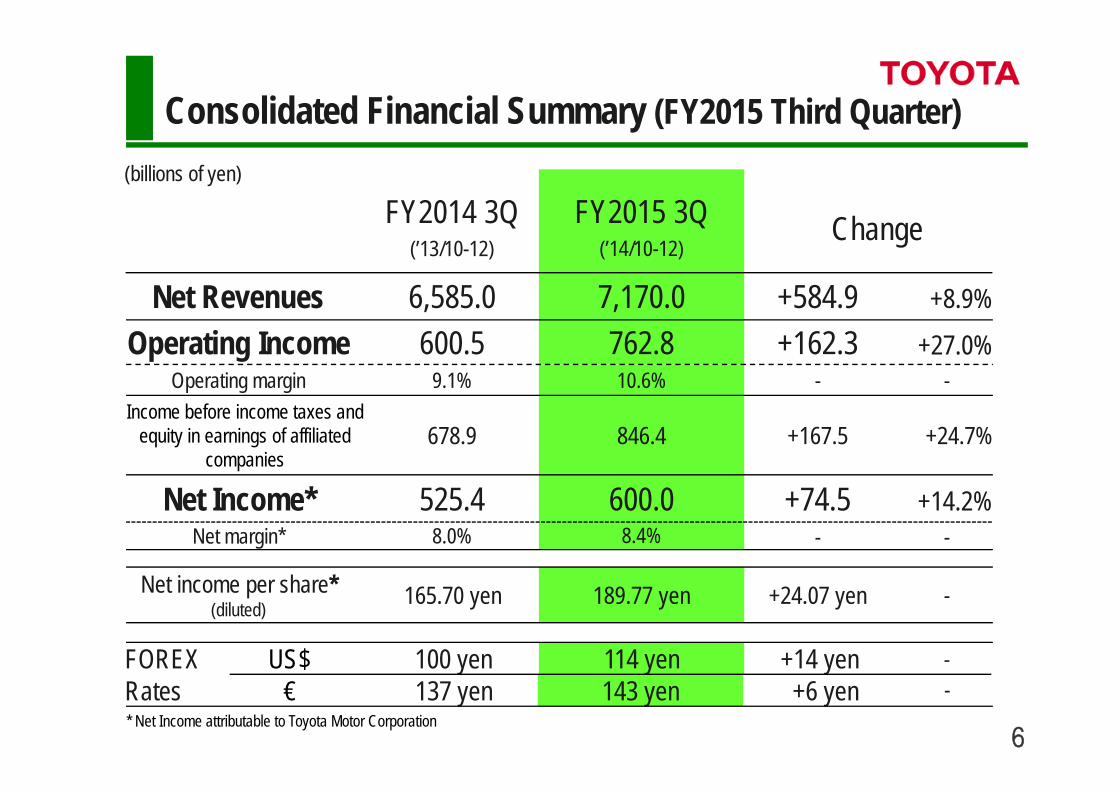
-+24.07 yen189.77 yen165.70 yen
+14 yen114 yen100 yen+6 yen143 yen137 yen
-+14.2%
+24.7%
-
+8.9%
-8.4%8.0%+74.5600.0525.4
-10.6%9.1%
+167.5846.4678.9
+162.3762.8600.5+584.97,170.06,585.0
ChangeFY2015 3Q(’14/10-12)
FY2014 3Q(’13/10-12)
+27.0%
--
Consolidated Financial Summary (FY2015 Third Quarter)(billions of yen)
Net RevenuesOperating Income
Operating marginIncome before income taxes and
equity in earnings of affiliated companies
Net Income*Net margin*
Net income per share*(diluted)
FOREX Rates
US$€
* Net Income attributable to Toyota Motor Corporation
7
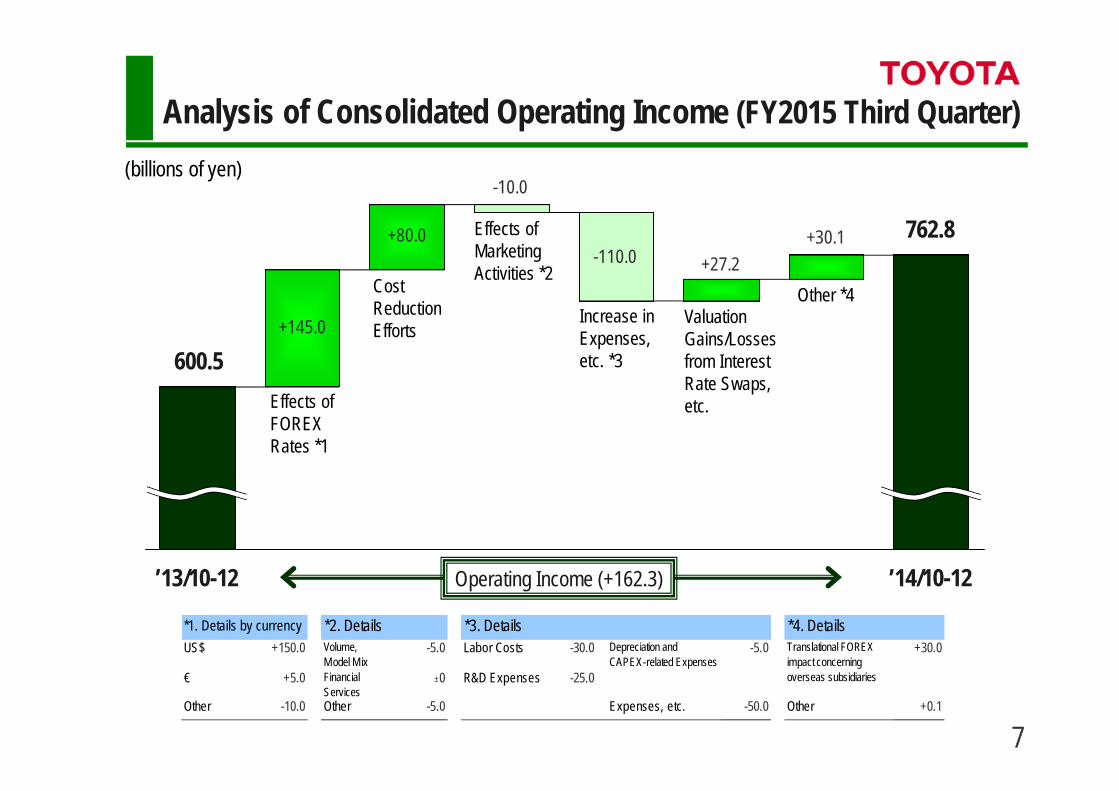
+80.0
+145.0
-10.0
+30.1-110.0 +27.2
’13/10-12
US$ +150.0 Volume,Model M ix
-5.0 Labor Costs -30.0
€ +5.0 FinancialServices
±0 R&D Expenses -25.0
Other -10.0 Other -5.0 Expenses, etc. -50.0 Other +0.1
*2. Details*1. Details by currency+30.0-5.0
*4. Details*3. DetailsDepreciation andCAPEX-related Expenses
Translational FOREXimpact concerningoverseas subsidiaries
’14/10-12
600.5
762.8
Operating Income (+162.3)
Analysis of Consolidated Operating Income (FY2015 Third Quarter)(billions of yen)
Effects of FOREX Rates *1
Cost Reduction Efforts
Effects of Marketing Activities *2
Increase in Expenses, etc. *3
Valuation Gains/Lossesfrom Interest Rate Swaps, etc.
Other *4
8
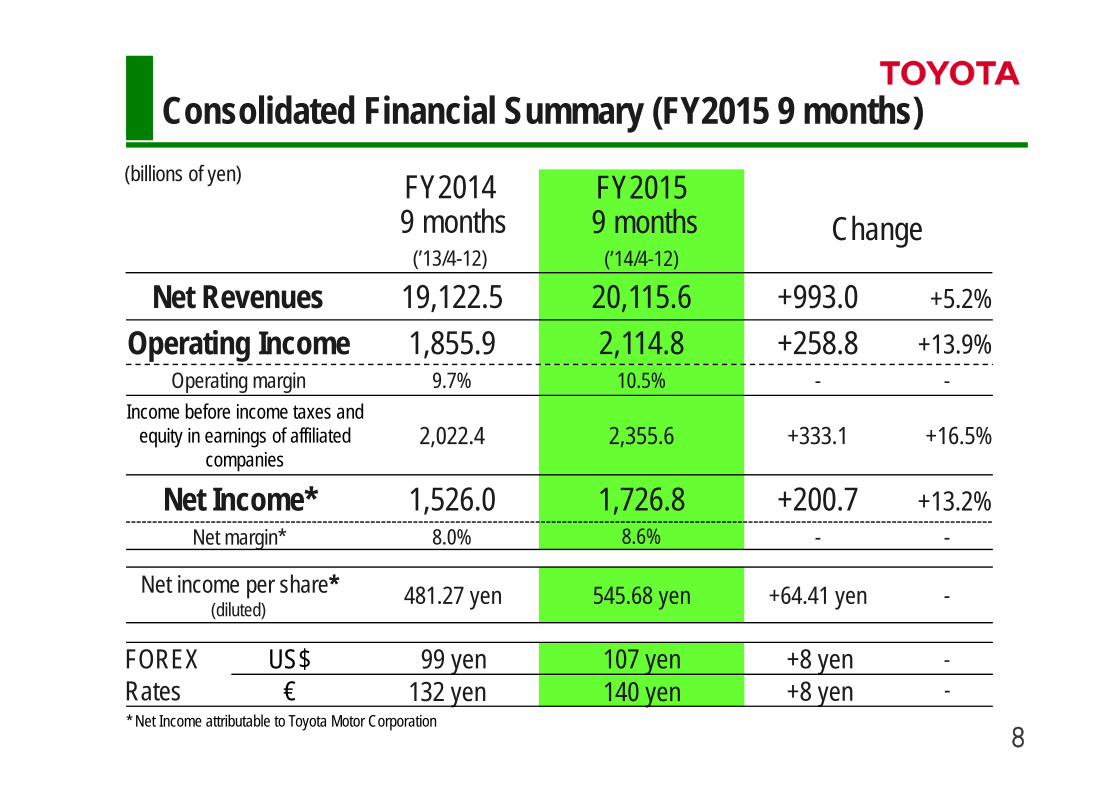
FY2015 9 months
(’14/4-12)
545.68 yen
107 yen140 yen
8.6%1,726.8
10.5%
2,355.6
2,114.820,115.6
-+64.41 yen481.27 yen
+8 yen99 yen+8 yen132 yen
-+13.2%
+16.5%
-
+5.2%
-8.0%+200.71,526.0
-9.7%
+333.12,022.4
+258.81,855.9+993.019,122.5
Change
+13.9%
--
Consolidated Financial Summary (FY2015 9 months)(billions of yen) FY2014
9 months(’13/4-12)
Net RevenuesOperating Income
Operating marginIncome before income taxes and
equity in earnings of affiliated companies
Net Income*Net margin*
Net income per share*(diluted)
FOREX Rates
US$€
* Net Income attributable to Toyota Motor Corporation

9
+200.0
+215.0
-30.0
+36.0-240.0
+77.8
’13/4-12
US$ +230.0 Volume,Model M ix
-75.0 Labor Costs -70.0
€ +20.0 FinancialServices
-5.0 R&D Expenses -35.0
Other -35.0 Other +50.0 Expenses, etc. -130.0 Other -1.0
*2. Details*1. Details by currency+37.0-5.0
*4. Details*3. DetailsDepreciation andCAPEX-related Expenses
Translational FOREXimpact concerningoverseas subsidiaries
’14/4-12
1,855.9
2,114.8
Operating Income (+258.8)
Analysis of Consolidated Operating Income (FY2015 9 months)(billions of yen)
Cost Reduction Efforts
Effects of FOREX Rates *1
Effects of Marketing Activities *2
Increase in Expenses, etc. *3
Valuation Gains/Lossesfrom Interest Rate Swaps, etc.
Other *4
10
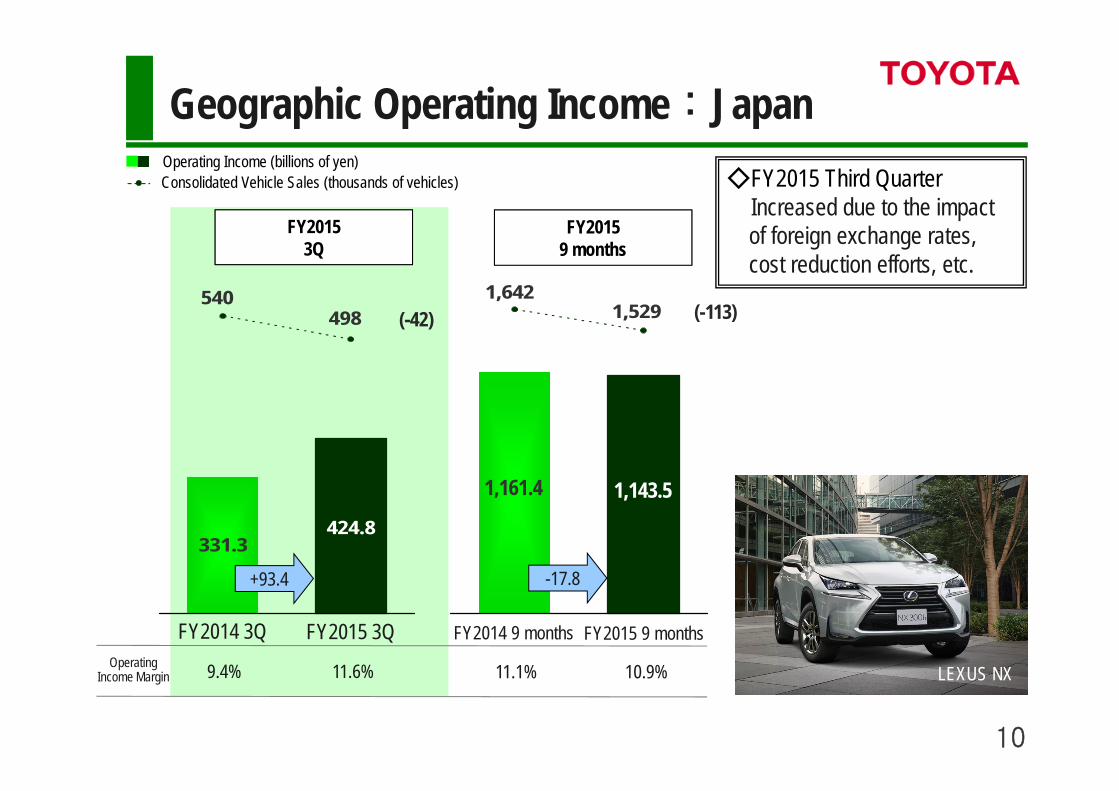
10.9%
FY2015 3Q
331.3424.8
498540
FY2014 3Q FY2015 3Q
9.4% 11.6%
●
(-42) 1,5291,642
FY2014 9 months FY2015 9 months
11.1%
(-113)
LEXUS NX
+93.4 -17.8
FY20159 months
1,161.4 1,143.5
◇FY2015 Third Quarter Increased due to the impactof foreign exchange rates, cost reduction efforts, etc.
Geographic Operating Income:JapanOperating Income (billions of yen)Consolidated Vehicle Sales (thousands of vehicles)
OperatingIncome Margin
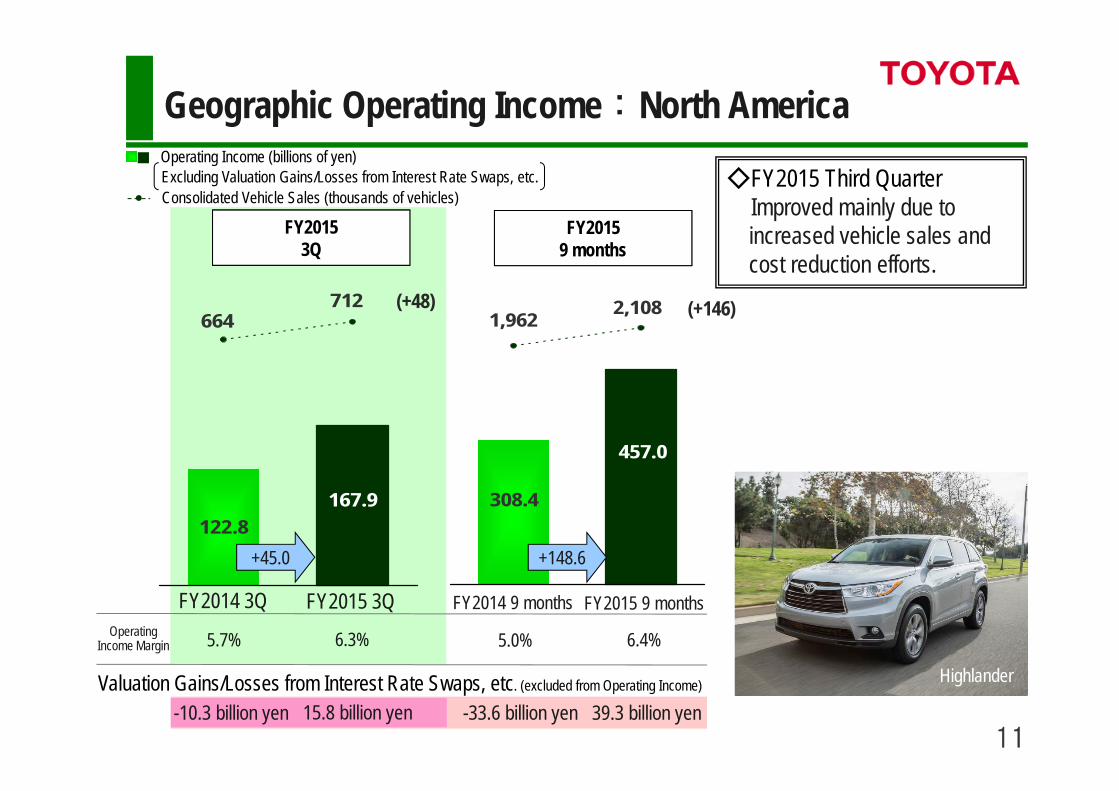
1115.8 billion yen
6.4%
167.9122.8
664712
FY2014 3Q FY2015 3Q
5.7% 6.3%
●
(+48)
-10.3 billion yen
308.4
457.0
1,962 2,108
FY2014 9 months FY2015 9 months
5.0%
(+146)
-33.6 billion yen 39.3 billion yen
Highlander
+148.6
◇FY2015 Third QuarterImproved mainly due to increased vehicle sales andcost reduction efforts.
+45.0
FY20153Q
FY20159 months
Geographic Operating Income:North AmericaOperating Income (billions of yen)Excluding Valuation Gains/Losses from Interest Rate Swaps, etc.Consolidated Vehicle Sales (thousands of vehicles)
OperatingIncome Margin
Valuation Gains/Losses from Interest Rate Swaps, etc. (excluded from Operating Income)
12
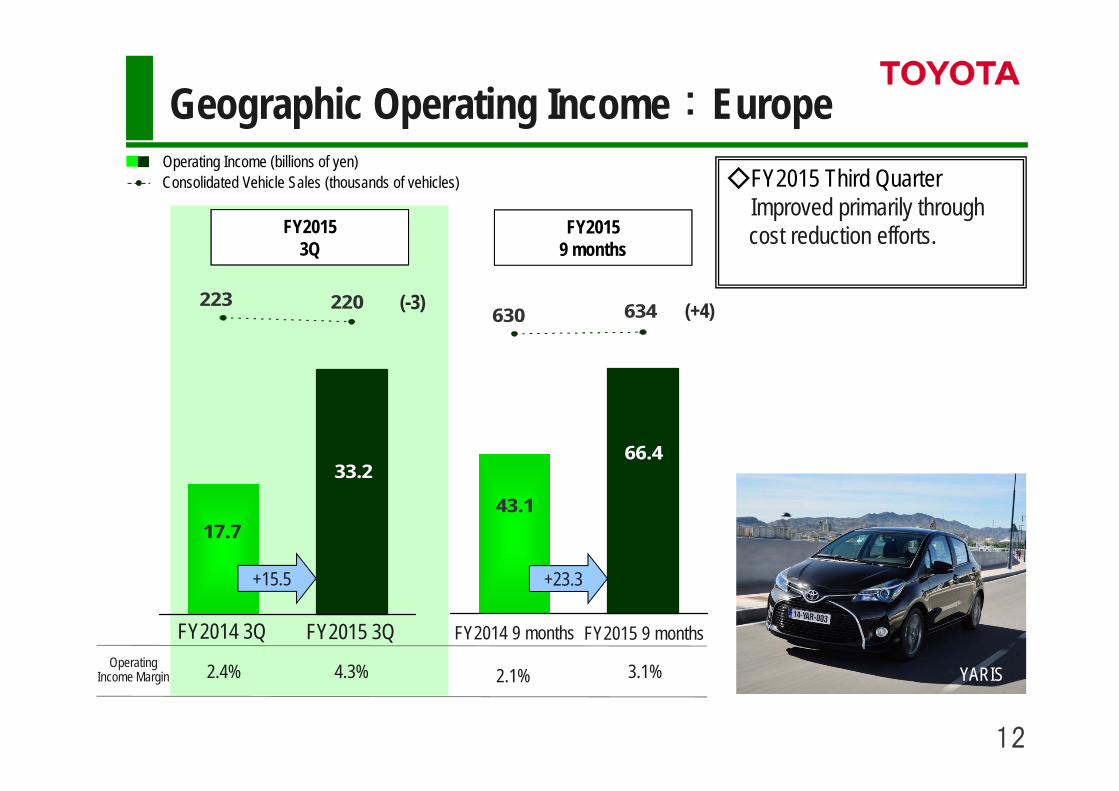
YARIS
17.7
33.2
220223
FY2014 3Q FY2015 3Q
2.4% 4.3%
●
(-3)
43.1
66.4
634630
FY2014 9 months FY2015 9 months
2.1% 3.1%
(+4)
+15.5 +23.3
◇FY2015 Third QuarterImproved primarily throughcost reduction efforts.FY2015
3QFY2015
9 months
Geographic Operating Income:Europe
OperatingIncome Margin
Operating Income (billions of yen)Consolidated Vehicle Sales (thousands of vehicles)
13
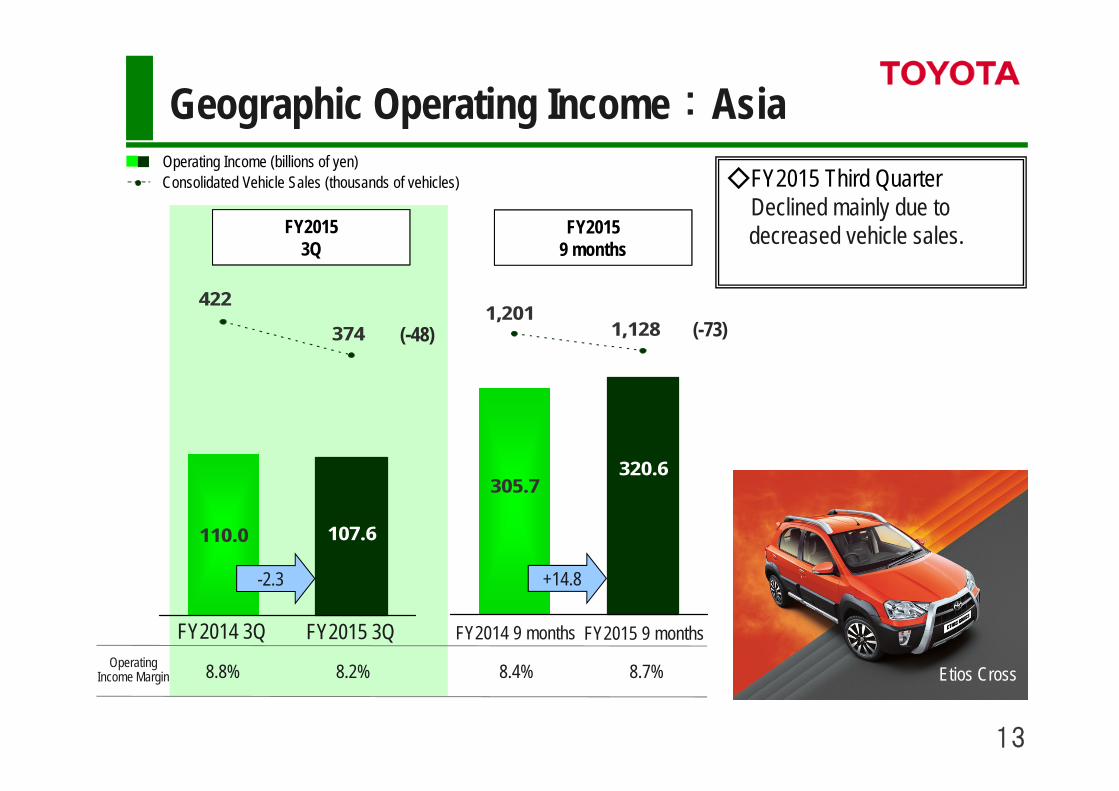
Etios Cross8.7%
110.0 107.6
374
422
FY2014 3Q FY2015 3Q
8.8% 8.2%
●
(-48)
305.7320.6
1,1281,201
FY2014 9 months FY2015 9 months
8.4%
(-73)
-2.3 +14.8
FY20153Q
FY20159 months
◇FY2015 Third Quarter Declined mainly due todecreased vehicle sales.
Geographic Operating Income:Asia
OperatingIncome Margin
Operating Income (billions of yen)Consolidated Vehicle Sales (thousands of vehicles)
14
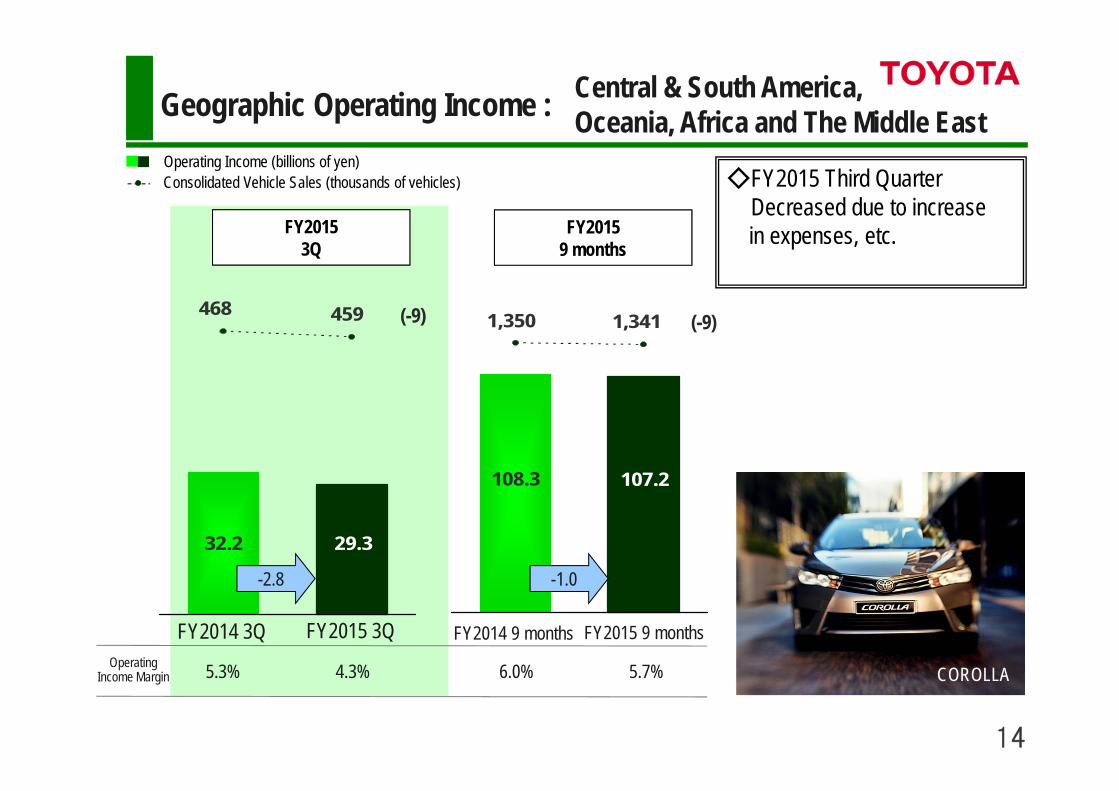
29.332.2
468 459
FY2014 3Q FY2015 3Q
5.3% 4.3%
●
(-9)
108.3 107.2
1,3411,350
FY2014 9 months FY2015 9 months
6.0% 5.7%
(-9)
COROLLA
-2.8 -1.0
◇FY2015 Third QuarterDecreased due to increasein expenses, etc.FY2015
3QFY2015
9 months
Geographic Operating Income : Central & South America, Oceania, Africa and The Middle East
OperatingIncome Margin
Operating Income (billions of yen)Consolidated Vehicle Sales (thousands of vehicles)
15
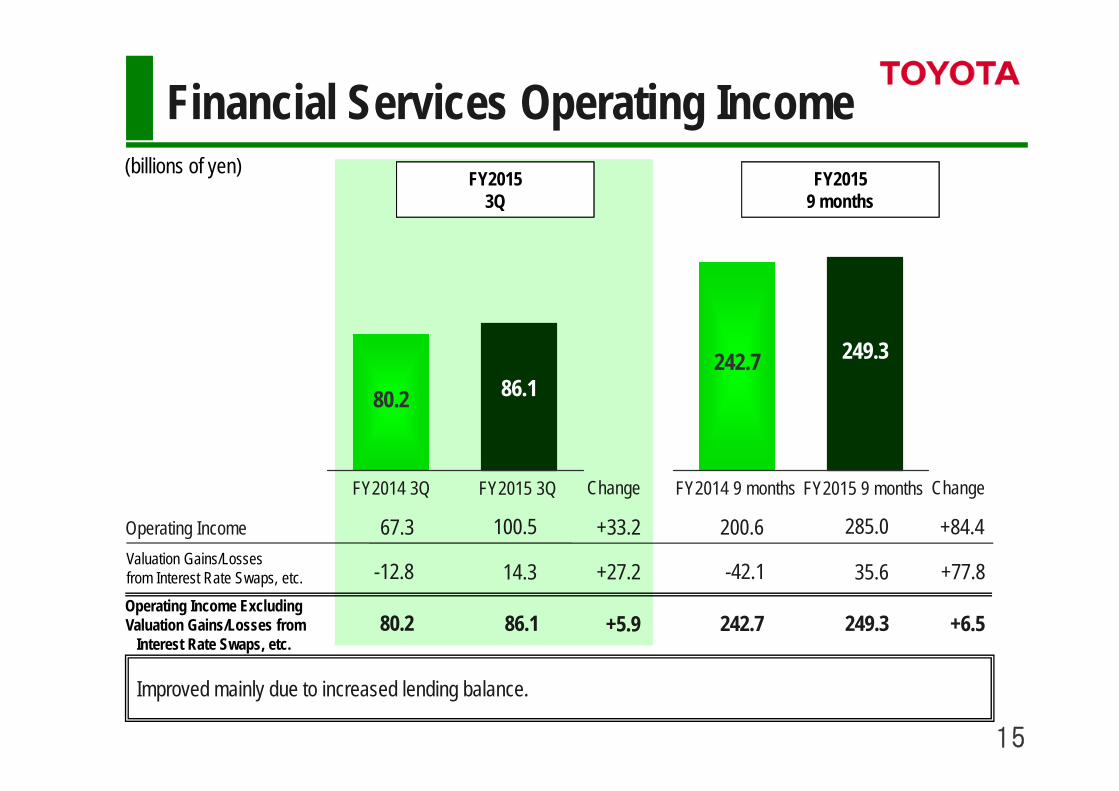
+84.4
+77.8
+33.2
+27.2-12.8
80.2 86.1 +5.9
14.3
67.3 100.5
FY2014 3Q FY2015 3Q Change
Improved mainly due to increased lending balance.
-42.1
242.7 249.3 +6.5
35.6
200.6 285.0
FY2014 9 months FY2015 9 months Change
FY20153Q
FY20159 months
242.7 249.3
80.2 86.1
Financial Services Operating Income(billions of yen)
Operating IncomeValuation Gains/Lossesfrom Interest Rate Swaps, etc.
Operating Income ExcludingValuation Gains/Losses from
Interest Rate Swaps, etc.
16
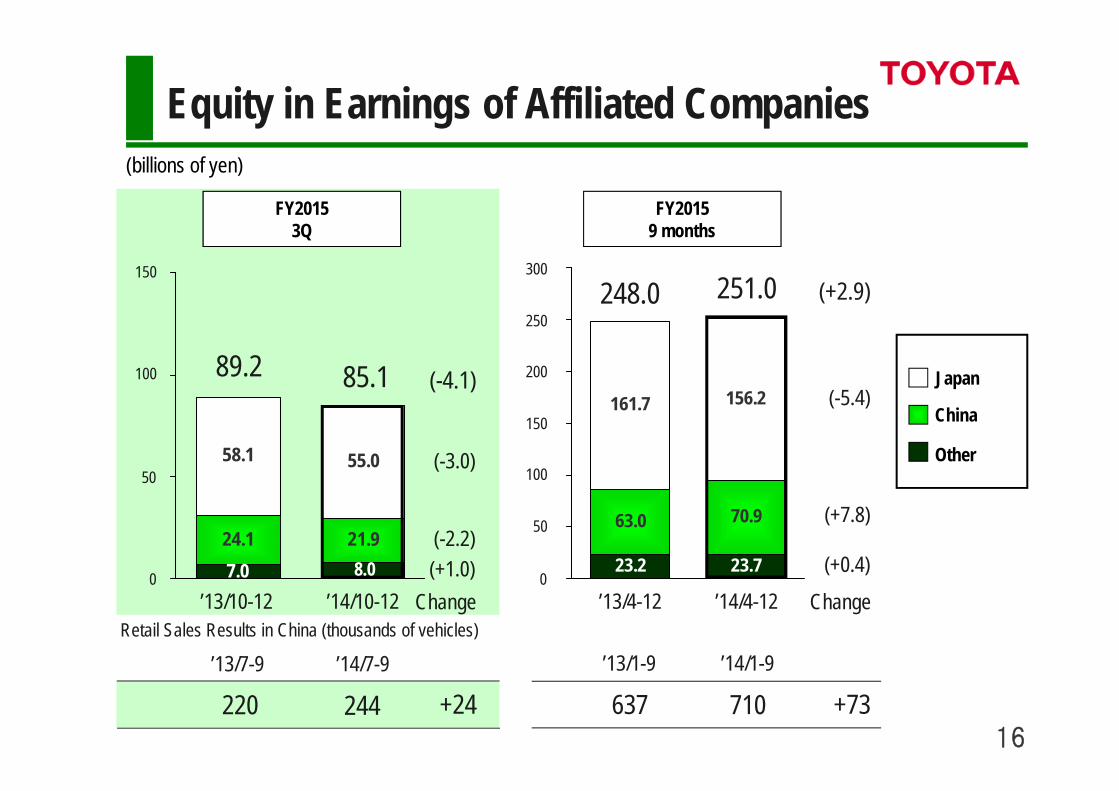
23.2 23.7
70.963.0
156.2161.7
0
500
1,000
1,500
2,000
2,500
3,000
7.021.924.1
55.058.1
0
500
1,000
1,500
’14/10-12 ’13/4-12 ’14/4-12Change Change
China
Japan
Other
’13/10-12
220 244 +24
FY20153Q
637 710 +73
FY20159 months
’13/7-9 ’14/7-9 ’13/1-9 ’14/1-9
251.0
89.2 85.1
248.0
(-2.2)(+1.0)
(+2.9)
(+7.8)
(-3.0)
(-4.1)(-5.4)
(+0.4)8.0
Equity in Earnings of Affiliated Companies(billions of yen)
150
100
50
0
300
100
150
200
250
50
0
Retail Sales Results in China (thousands of vehicles)
FY2015 Third QuarterFinancial Results
FY2015 Third Quarter Financial Performance
FY2015 Financial Forecasts
17
18
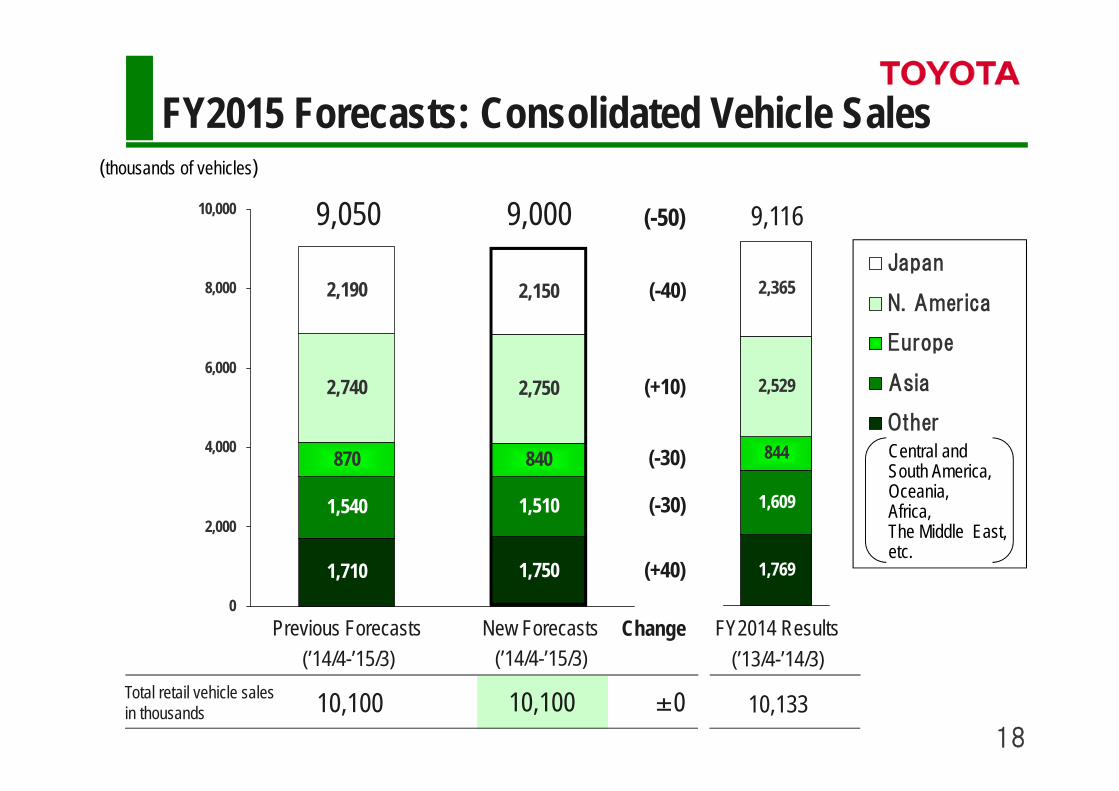
1,769
1,609
844
2,529
2,365Japan
N. America
Europe
Asia
Other
1,710 1,750
1,540 1,510
870 840
2,740 2,750
2,190 2,150
0
2,000
4,000
6,000
8,000
10,000 9,050 9,000 (-50)
(-40)
(+10)
(-30)
(-30)
(+40)
(’14/4-’15/3) (’14/4-’15/3)Change
9,116
(’13/4-’14/3)
10,100 10,100 ±0 10,133
FY2015 Forecasts: Consolidated Vehicle Sales(thousands of vehicles)
Previous Forecasts New Forecasts FY2014 Results
Total retail vehicle sales in thousands
Central and South America,Oceania,Africa,The Middle East, etc.
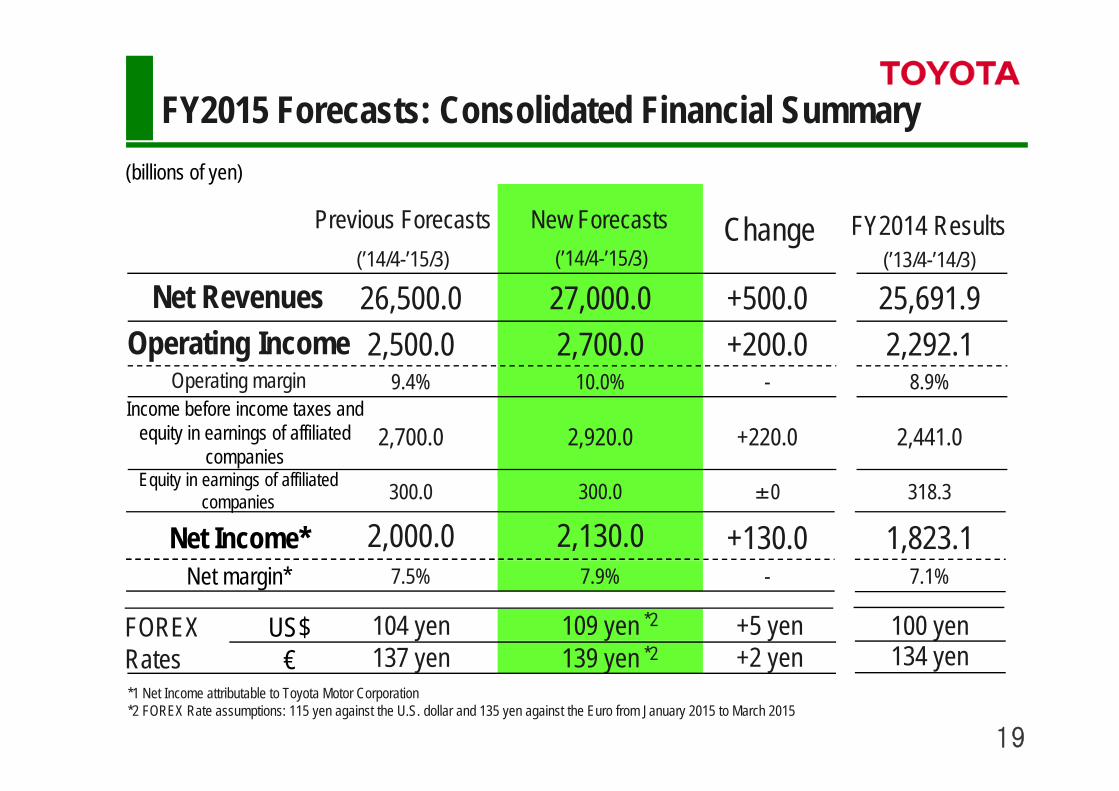
19
Change
100 yen
+130.0±0
109 yen139 yen
2,130.0
10.0%
2,920.0
2,700.027,000.0
300.0
7.9% 7.1%
318.3
+5 yen+2 yen
-
+220.0
+200.0+500.0
-
104 yen137 yen
2,000.0
9.4%
2,700.0
2,500.026,500.0
300.0
7.5%
134 yen
1,823.1
8.9%
2,441.0
2,292.125,691.9
FY2015 Forecasts: Consolidated Financial Summary(billions of yen)
Previous Forecasts(’14/4-’15/3)
New Forecasts(’14/4-’15/3)
FY2014 Results(’13/4-’14/3)
Net RevenuesOperating Income
Operating marginIncome before income taxes and
equity in earnings of affiliated companies
Equity in earnings of affiliated companies
Net Income*Net margin*
FOREX Rates
US$€
*1 Net Income attributable to Toyota Motor Corporation*2 FOREX Rate assumptions: 115 yen against the U.S. dollar and 135 yen against the Euro from January 2015 to March 2015
*2
*2
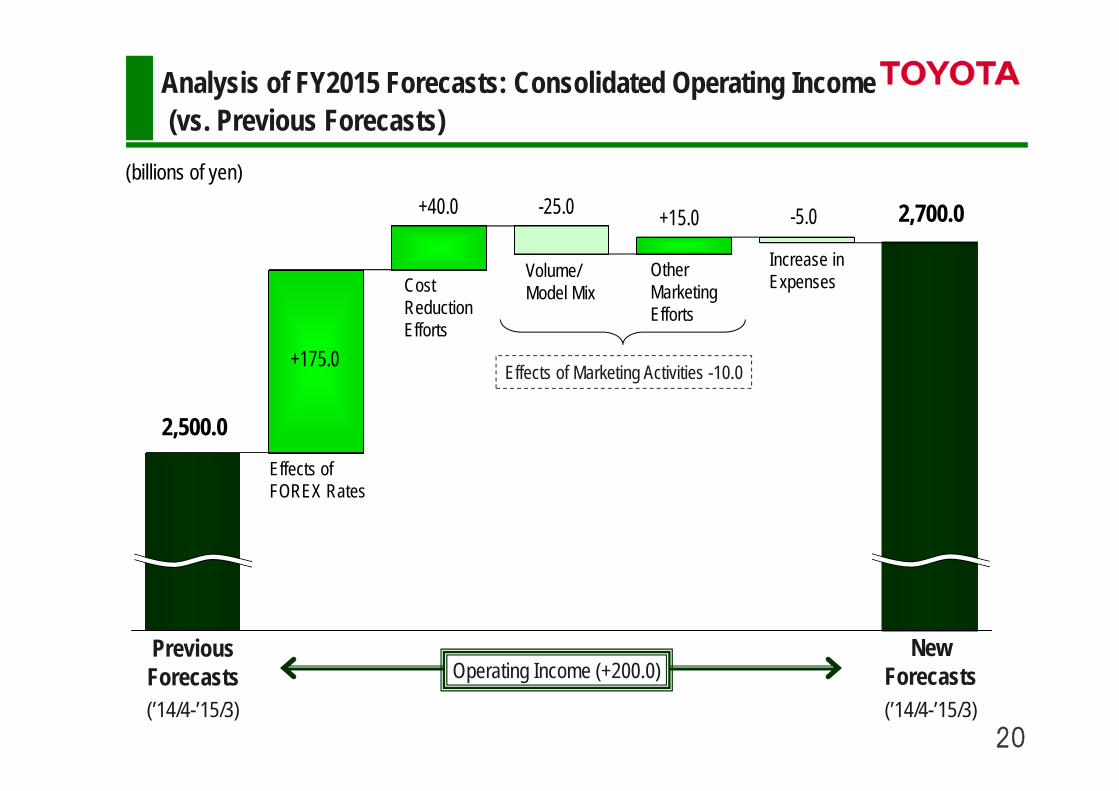
20
+175.0
-25.0 +15.0 -5.0+40.0
2,500.0
Operating Income (+200.0)
(’14/4-’15/3) (’14/4-’15/3)
2,700.0
Analysis of FY2015 Forecasts: Consolidated Operating Income(vs. Previous Forecasts)
(billions of yen)
Effects of FOREX Rates
Cost Reduction Efforts
Volume/Model Mix
Other Marketing Efforts
Increase in Expenses
Effects of Marketing Activities -10.0
Previous Forecasts
New Forecasts
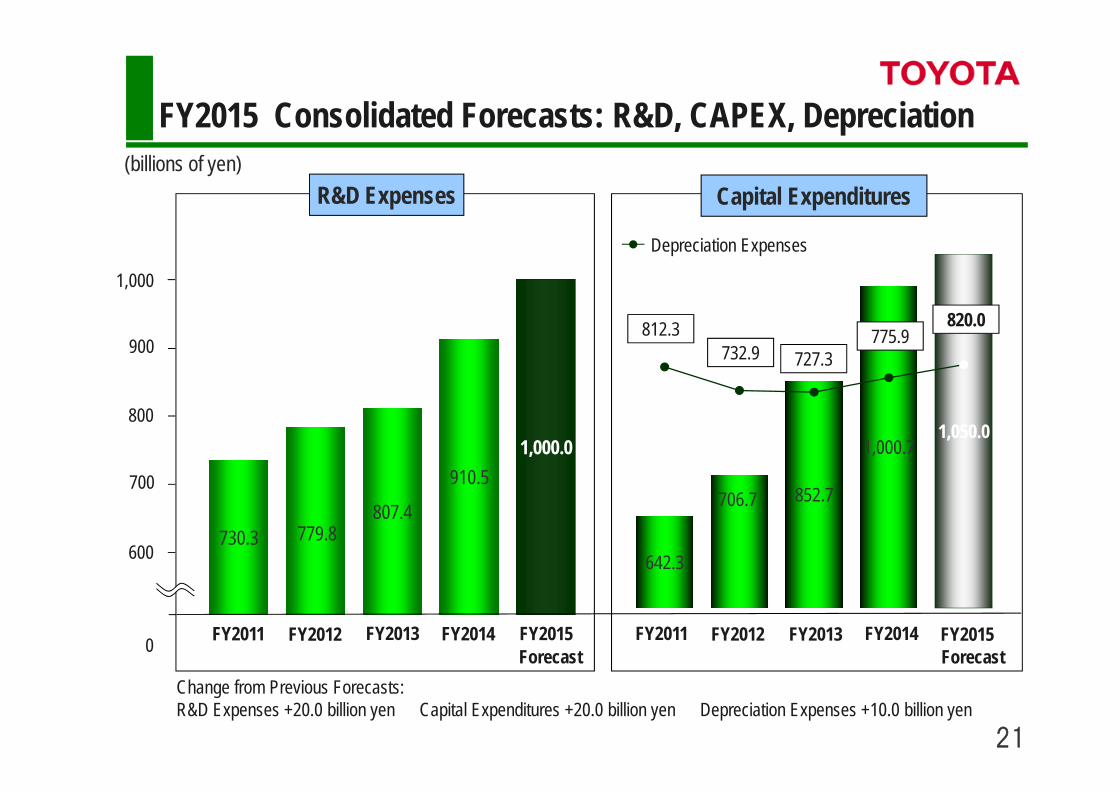
21
8,000
9,000
1,000.0
779.8730.3807.4
910.5
642.3
706.7 852.7
1,000.71,050.0
812.3732.9 727.3
775.9820.0
FY2011 FY2012 FY2013 FY2014 FY2015 FY2011 FY2012 FY2013 FY2014 FY2015Forecast
10,000
7,000
6,000
0
●
FY2015 Consolidated Forecasts: R&D, CAPEX, Depreciation(billions of yen)
R&D Expenses Capital Expenditures
Depreciation Expenses
Change from Previous Forecasts:R&D Expenses +20.0 billion yen Capital Expenditures +20.0 billion yen Depreciation Expenses +10.0 billion yen
1,000
900
800
700
600
0 Forecast
Toyota Motor CorporationFebruary 4, 2015
ALPHARD
FY2015 Third QuarterFinancial Results
VELLFIRE
23
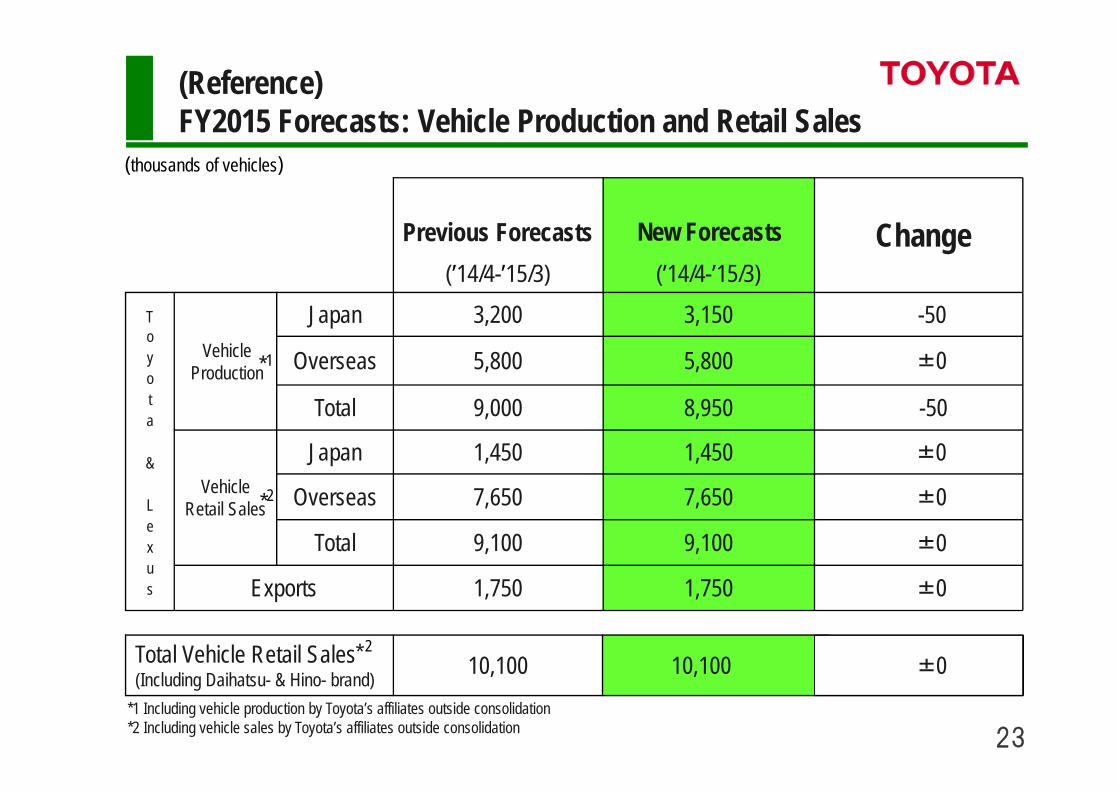
5,800
10,100
1,750
9,100
7,650
1,450
8,950
3,150(’14/4-’15/3)
±010,100
±01,750Exports
9,100Total
7,650Overseas
±01,450Japan
-509,000 Total
5,800Overseas
3,200JapanToyota
&
Lexus
Change(’14/4-’15/3)
±0
±0
±0
-50
(Reference) FY2015 Forecasts: Vehicle Production and Retail Sales
(thousands of vehicles)
VehicleProduction
VehicleRetail Sales
1*
*2
Total Vehicle Retail Sales(Including Daihatsu- & Hino- brand)
*1 Including vehicle production by Toyota’s affiliates outside consolidation*2 Including vehicle sales by Toyota’s affiliates outside consolidation
Previous Forecasts New Forecasts
* 2
24
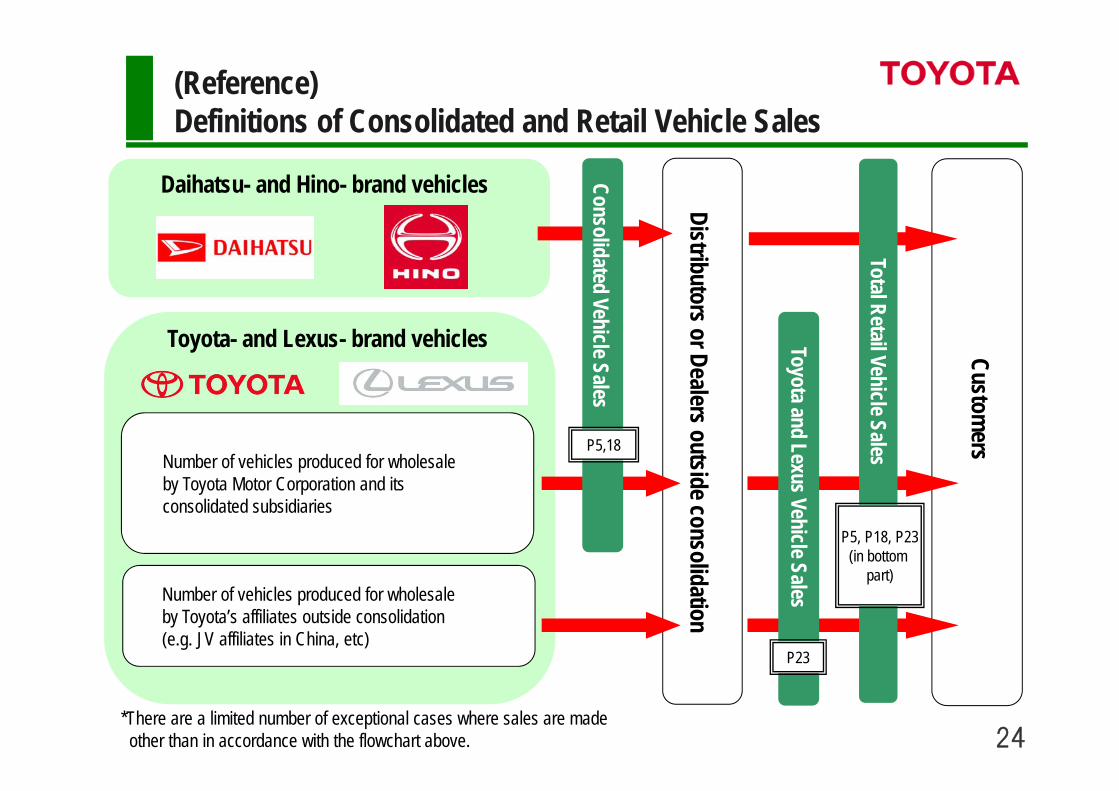
(Reference)Definitions of Consolidated and Retail Vehicle Sales
Daihatsu- and Hino- brand vehicles
Toyota- and Lexus- brand vehicles
Number of vehicles produced for wholesale by Toyota Motor Corporation and its consolidated subsidiaries
Number of vehicles produced for wholesale by Toyota’s affiliates outside consolidation (e.g. JV affiliates in China, etc)
Distributors or Dealers outside consolidation
Customers
Total Retail Vehicle Sales
Toyota and Lexus Vehicle Sales
*There are a limited number of exceptional cases where sales are made other than in accordance with the flowchart above.
P23
P5, P18, P23(in bottom
part)
P5,18
Consolidated Vehicle Sales