Embed Size (px)
Citation preview
FY2015
Nippon Paint Holdings Group Business Briefing
24 November, 2015
1. Performance highlights2. Topics
2-1. Chinese business2-2. Progress on mid-term management plan and strategic alliance2-3. Progress on mid-term management plan
Automotive coatings business : Mitsuo Yamada, CEO of NPAU2-4. Progress on mid-term management plan
Decorative paints business : Shingo Aida, CEO of NPTU3. Q&A session
Today’s Agenda
NPAU: Nippon Paint Automotive Coatings Co LtdNPTU: Nippon Paint Co Ltd
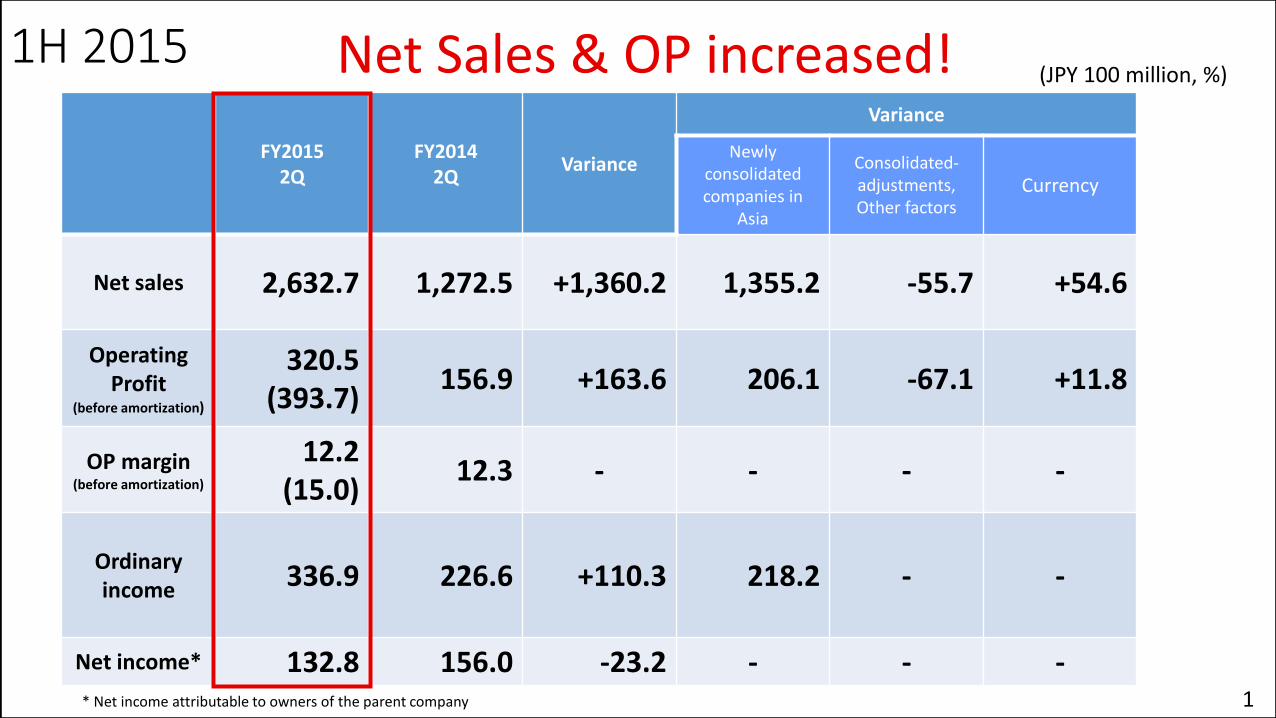
1H 2015
FY20152Q
FY20142Q
Variance
Variance
Newly consolidated companies in
Asia
Consolidated-adjustments, Other factors
Currency
Net sales 2,632.7 1,272.5 +1,360.2 1,355.2 -55.7 +54.6
OperatingProfit
(before amortization)
320.5(393.7)
156.9 +163.6 206.1 -67.1 +11.8
OP margin(before amortization)
12.2(15.0)
12.3 - - - -
Ordinaryincome 336.9 226.6 +110.3 218.2 - -
Net income* 132.8 156.0 -23.2 - - -
(JPY 100 million, %)Net Sales & OP increased!
* Net income attributable to owners of the parent company 1
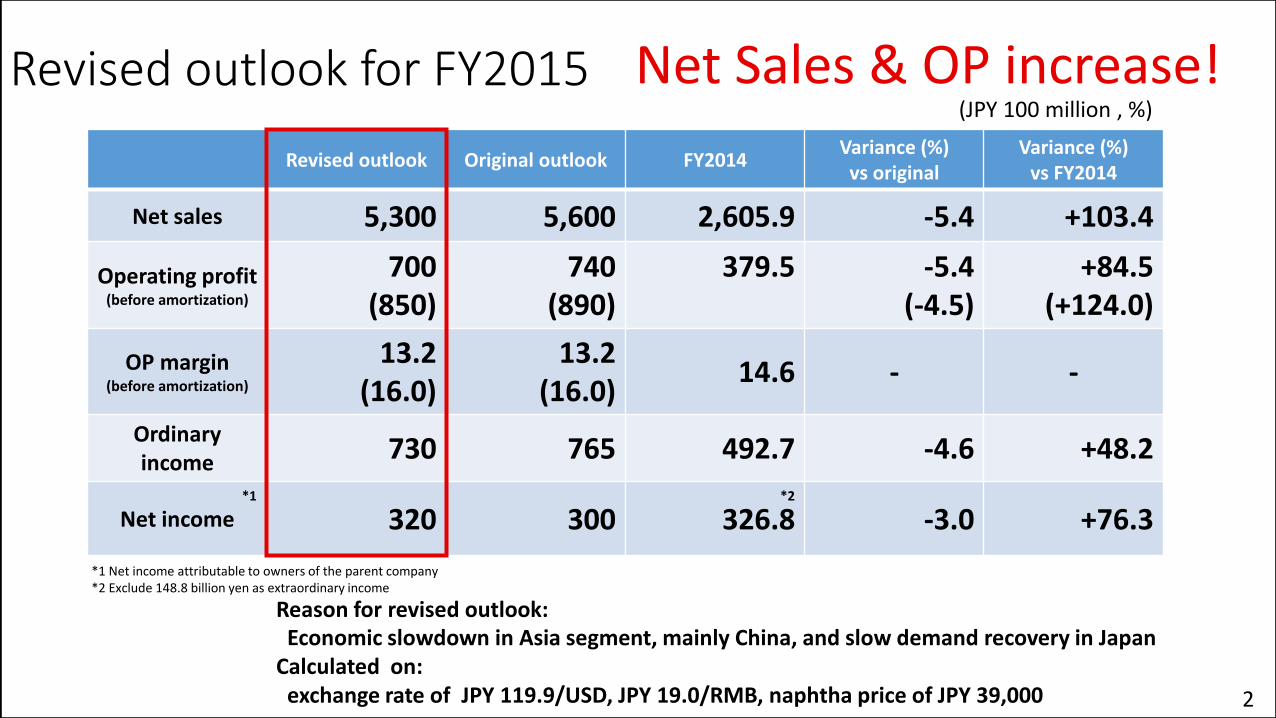
Revised outlook for FY2015
Revised outlook Original outlook FY2014Variance (%)
vs originalVariance (%)
vs FY2014
Net sales 5,300 5,600 2,605.9 -5.4 +103.4
Operating profit(before amortization)
700(850)
740(890)
379.5 -5.4(-4.5)
+84.5(+124.0)
OP margin (before amortization)
13.2(16.0)
13.2(16.0)
14.6 - -
Ordinaryincome 730 765 492.7 -4.6 +48.2
Net income 320 300 326.8 -3.0 +76.3
(JPY 100 million , %)
Reason for revised outlook:Economic slowdown in Asia segment, mainly China, and slow demand recovery in Japan
Calculated on:exchange rate of JPY 119.9/USD, JPY 19.0/RMB, naphtha price of JPY 39,000
Net Sales & OP increase!
*1 Net income attributable to owners of the parent company*2 Exclude 148.8 billion yen as extraordinary income
2
*2*1
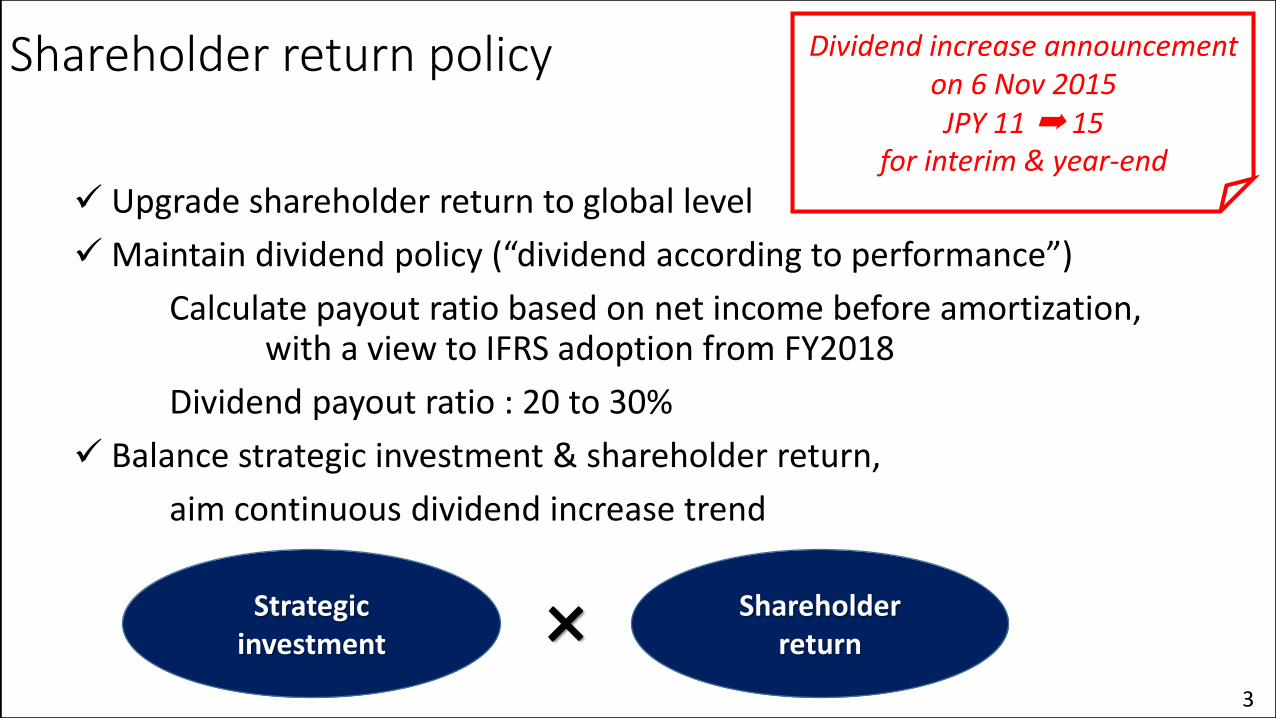
Shareholder return policy
Upgrade shareholder return to global level
Maintain dividend policy (“dividend according to performance”)
Calculate payout ratio based on net income before amortization, with a view to IFRS adoption from FY2018
Dividend payout ratio : 20 to 30%
Balance strategic investment & shareholder return,
aim continuous dividend increase trend
Strategic investment
Shareholder return×
Dividend increase announcement on 6 Nov 2015JPY 11 ➡ 15
for interim & year-end
3
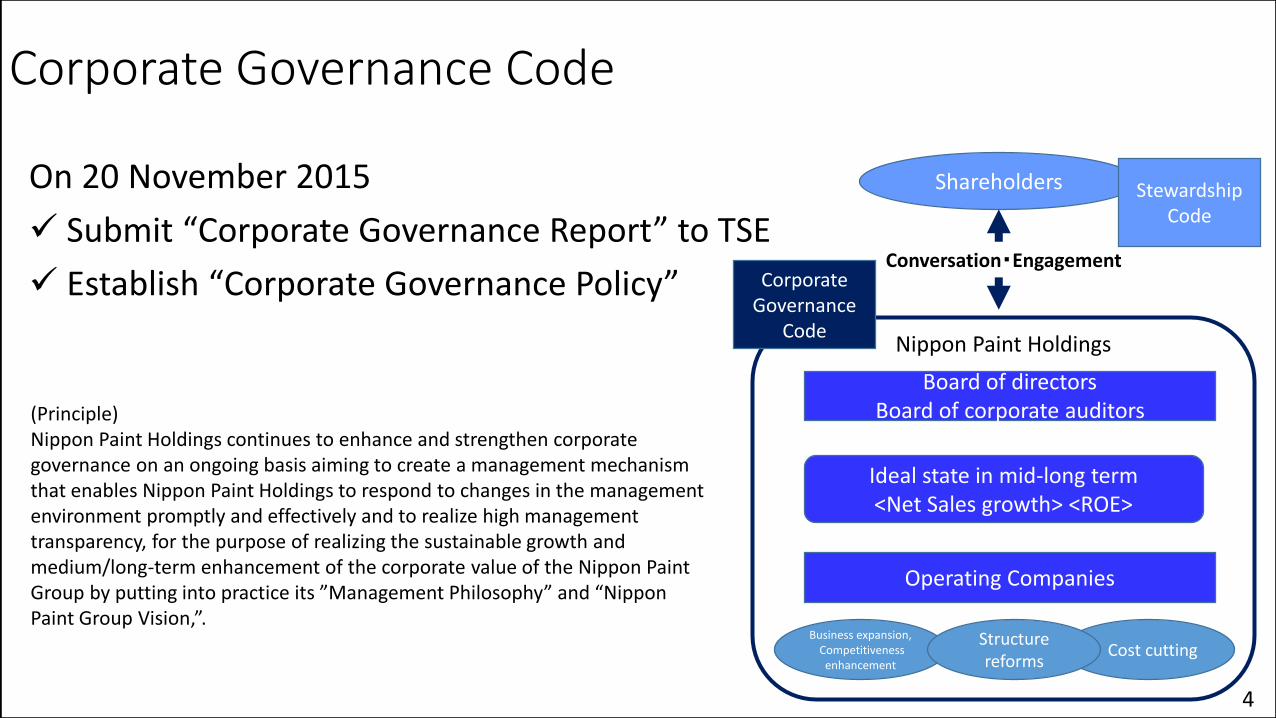
(Principle)Nippon Paint Holdings continues to enhance and strengthen corporate governance on an ongoing basis aiming to create a management mechanism that enables Nippon Paint Holdings to respond to changes in the management environment promptly and effectively and to realize high management transparency, for the purpose of realizing the sustainable growth and medium/long-term enhancement of the corporate value of the Nippon Paint Group by putting into practice its ”Management Philosophy” and “Nippon Paint Group Vision,”.
Corporate Governance Code
On 20 November 2015
Submit “Corporate Governance Report” to TSE
Establish “Corporate Governance Policy”
Shareholders
Nippon Paint Holdings
Board of directorsBoard of corporate auditors
Ideal state in mid-long term<Net Sales growth> <ROE>
Operating Companies
Cost cuttingBusiness expansion,
Competitivenessenhancement
Structure reforms
Conversation・EngagementCorporate
GovernanceCode
Stewardship Code
4
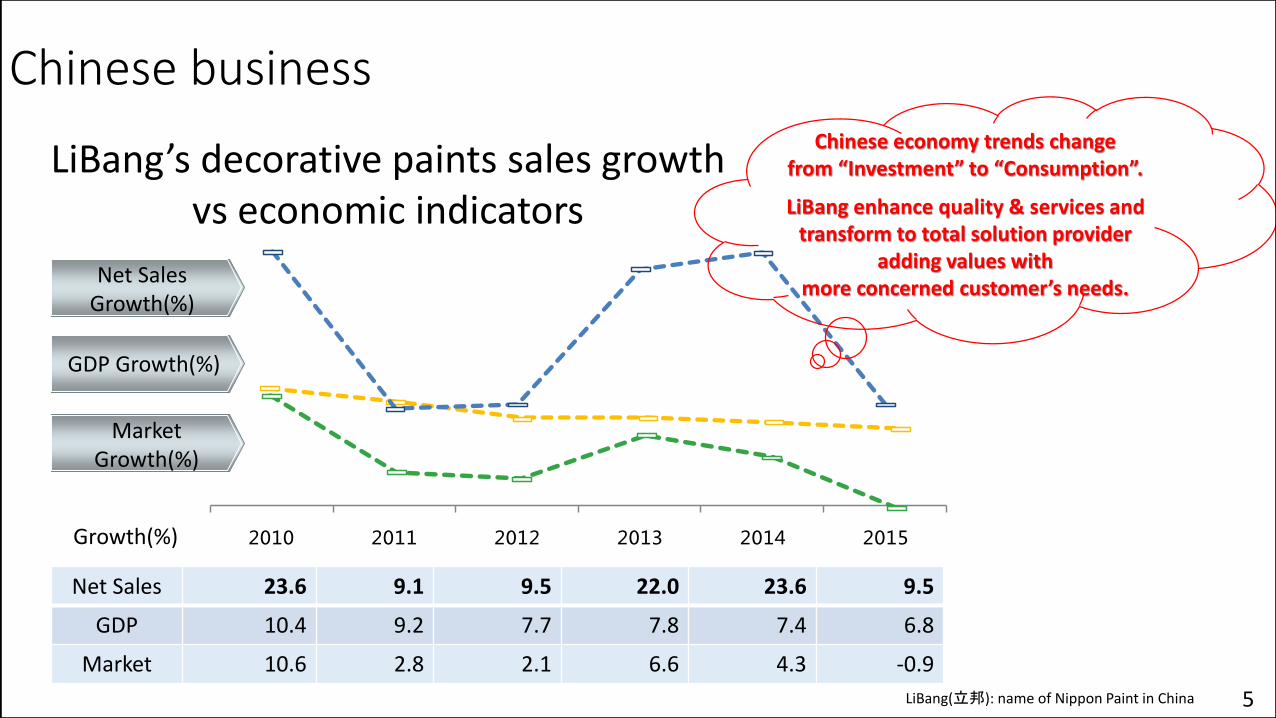
2010 2011 2012 2013 2014 2015
Net Sales Growth(%)
GDP Growth(%)
Market Growth(%)
LiBang’s decorative paints sales growth vs economic indicators
Net Sales 23.6 9.1 9.5 22.0 23.6 9.5
GDP 10.4 9.2 7.7 7.8 7.4 6.8
Market 10.6 2.8 2.1 6.6 4.3 -0.9
Growth(%)
Chinese economy trends change from “Investment” to “Consumption”.
LiBang enhance quality & services and transform to total solution provider
adding values withmore concerned customer’s needs.
LiBang(立邦): name of Nippon Paint in China
Chinese business
5
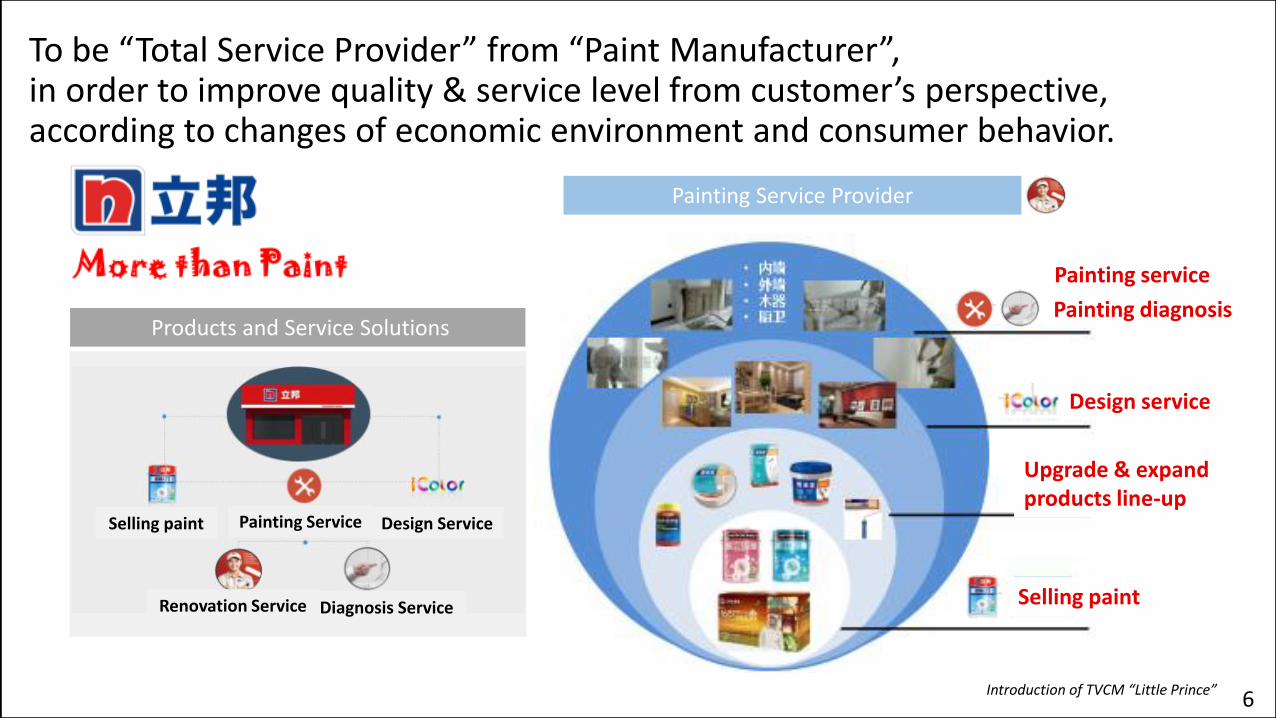
Painting Service Provider
Selling paint Painting Service Design Service
Renovation Service Diagnosis Service
Painting service
Design service
Upgrade & expand products line-up
Products and Service Solutions
To be “Total Service Provider” from “Paint Manufacturer”, in order to improve quality & service level from customer’s perspective, according to changes of economic environment and consumer behavior.
Introduction of TVCM “Little Prince”
Painting diagnosis
Selling paint
6
NPS: Net Promoter ScoreIndex of possibility to recommend products or services to your friends or colleagues
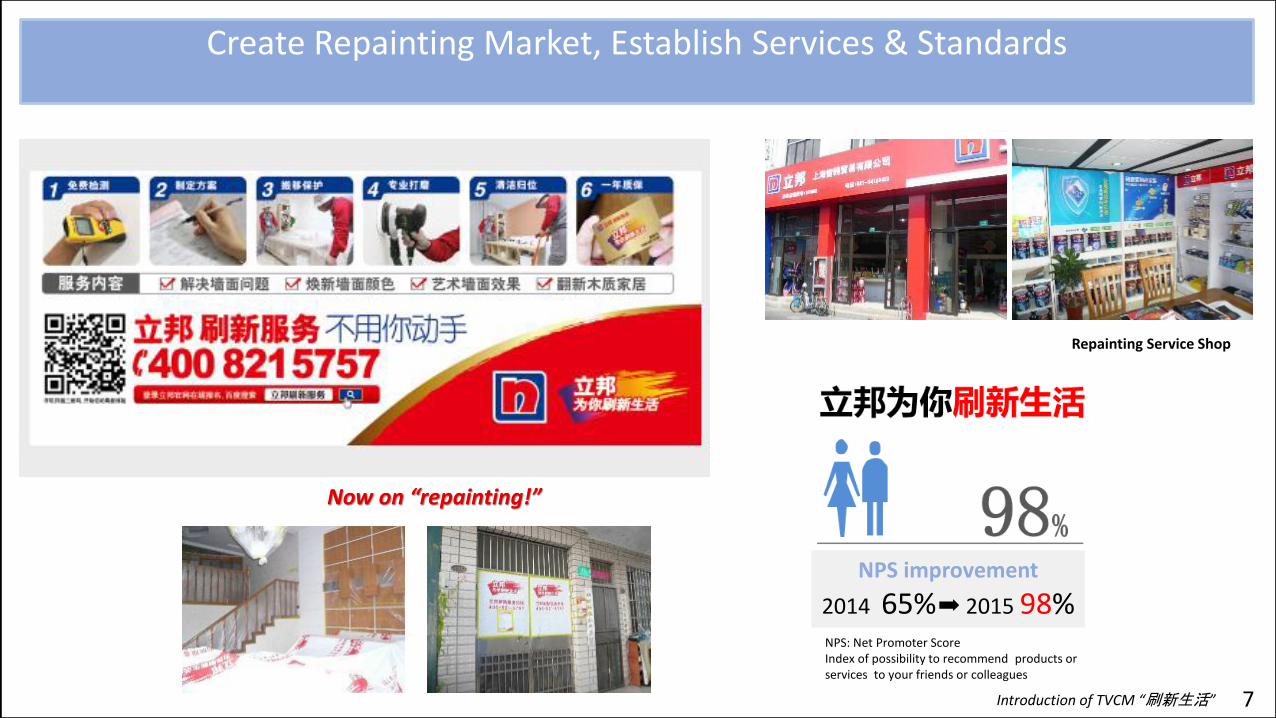
Repainting Service Shop
Now on “repainting!”
NPS improvement
2014 65%➡ 2015 98%
Create Repainting Market, Establish Services & Standards
Introduction of TVCM “刷新生活” 7
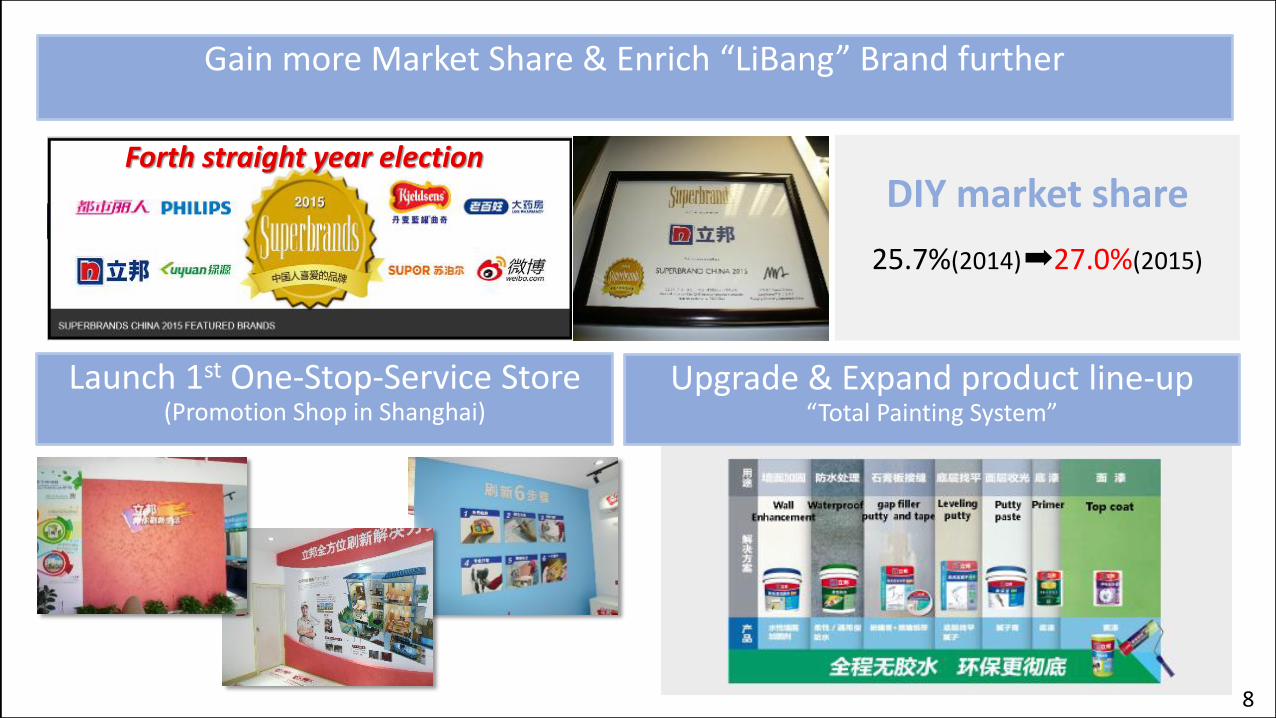
DIY market share
25.7%(2014)➡27.0%(2015)
Forth straight year election
Gain more Market Share & Enrich “LiBang” Brand further
Launch 1st One-Stop-Service Store (Promotion Shop in Shanghai)
Upgrade & Expand product line-up“Total Painting System”
8
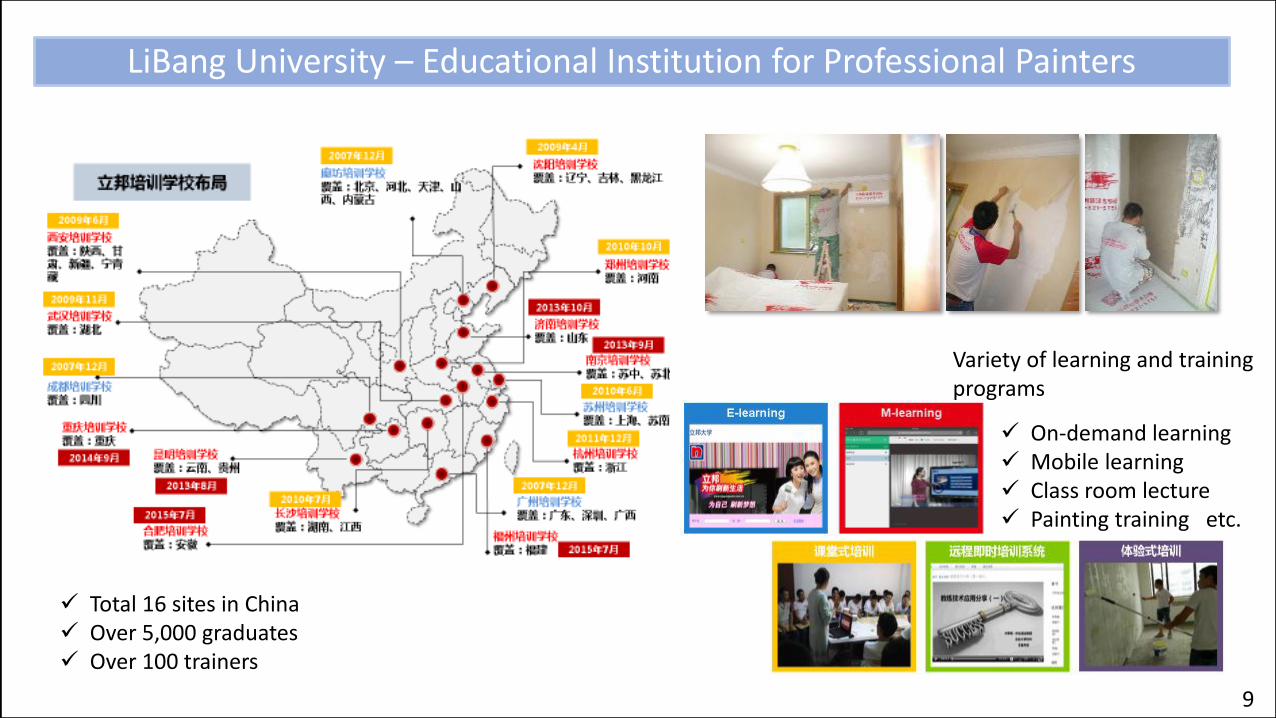
Total 16 sites in China Over 5,000 graduates Over 100 trainers
Variety of learning and training programs
On-demand learning Mobile learning Class room lecture Painting training etc.
LiBang University – Educational Institution for Professional Painters
9
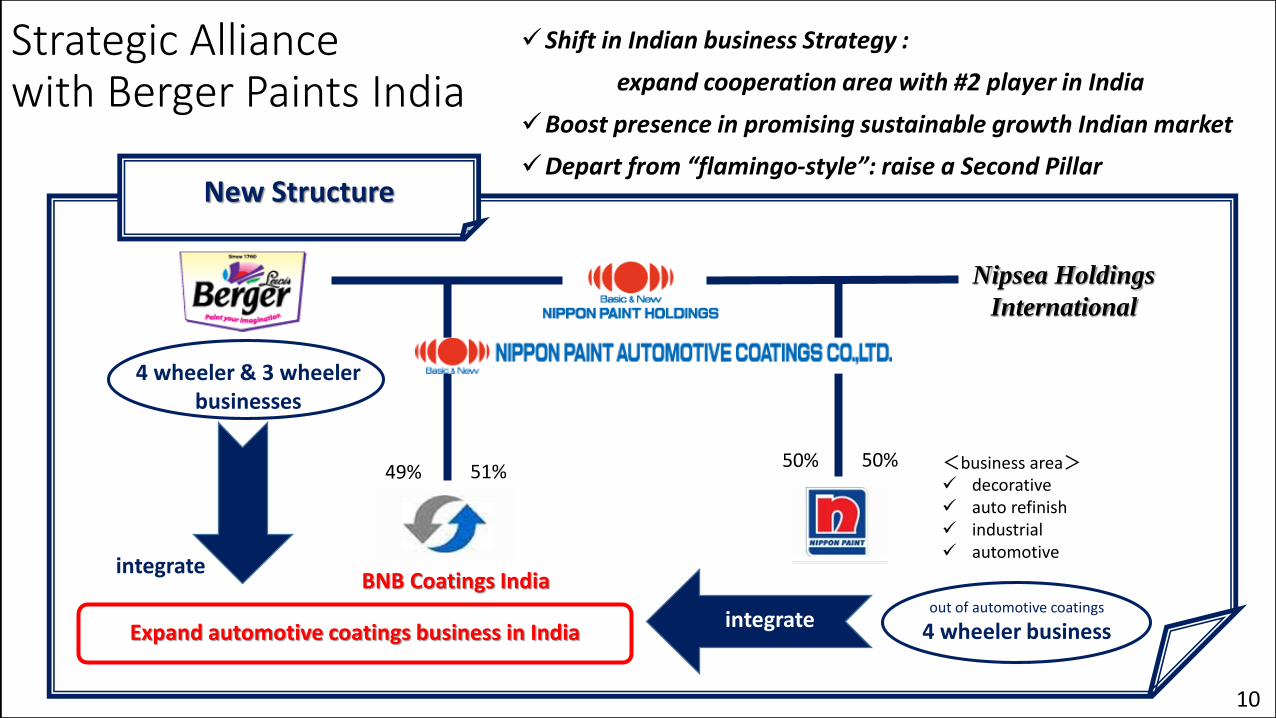
Strategic Alliance with Berger Paints India
Shift in Indian business Strategy :
expand cooperation area with #2 player in India
Boost presence in promising sustainable growth Indian market
Depart from “flamingo-style”: raise a Second Pillar
4 wheeler & 3 wheelerbusinesses
out of automotive coatings
4 wheeler businessExpand automotive coatings business in India
Nipsea Holdings
International
49% 51%50% 50%
integrate
integrate
New Structure
BNB Coatings India
<business area> decorative auto refinish industrial automotive
10
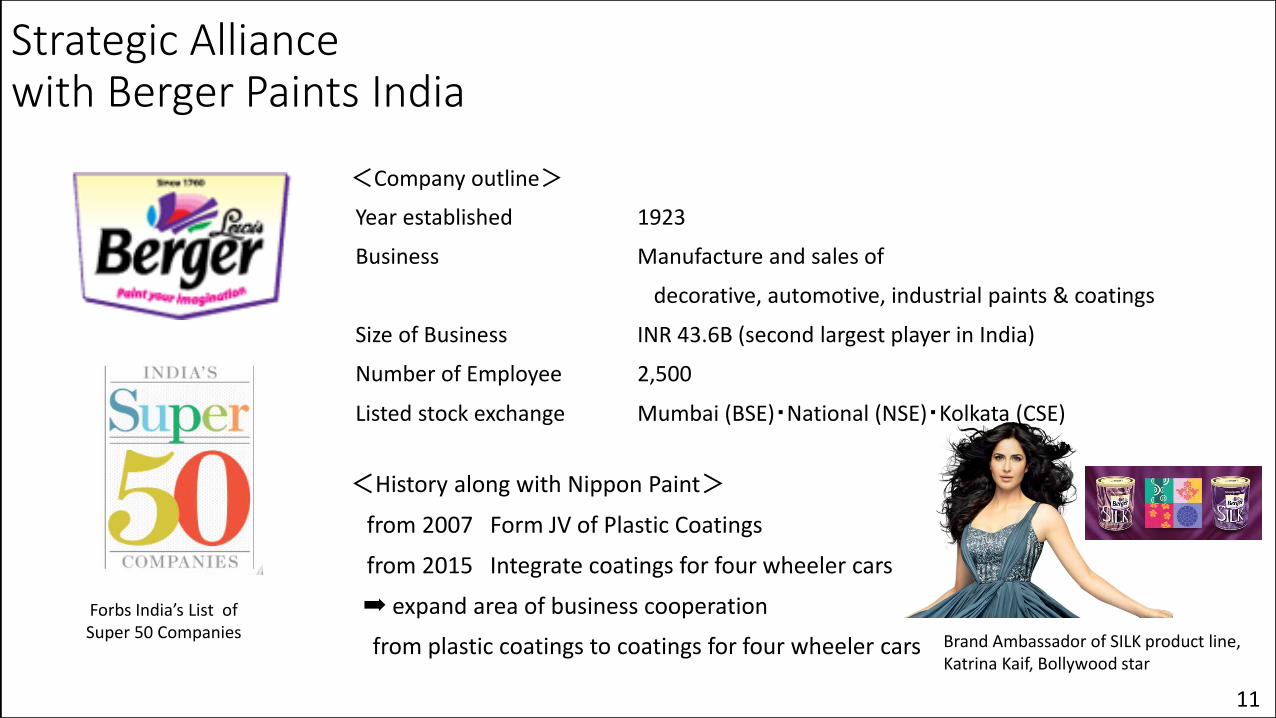
<Company outline>
Year established 1923
Business Manufacture and sales of
decorative, automotive, industrial paints & coatings
Size of Business INR 43.6B (second largest player in India)
Number of Employee 2,500
Listed stock exchange Mumbai (BSE)・National (NSE)・Kolkata (CSE)
<History along with Nippon Paint>
from 2007 Form JV of Plastic Coatings
from 2015 Integrate coatings for four wheeler cars
➡ expand area of business cooperation
from plastic coatings to coatings for four wheeler cars
Forbs India’s List of Super 50 Companies Brand Ambassador of SILK product line,
Katrina Kaif, Bollywood star
Strategic Alliance with Berger Paints India
11
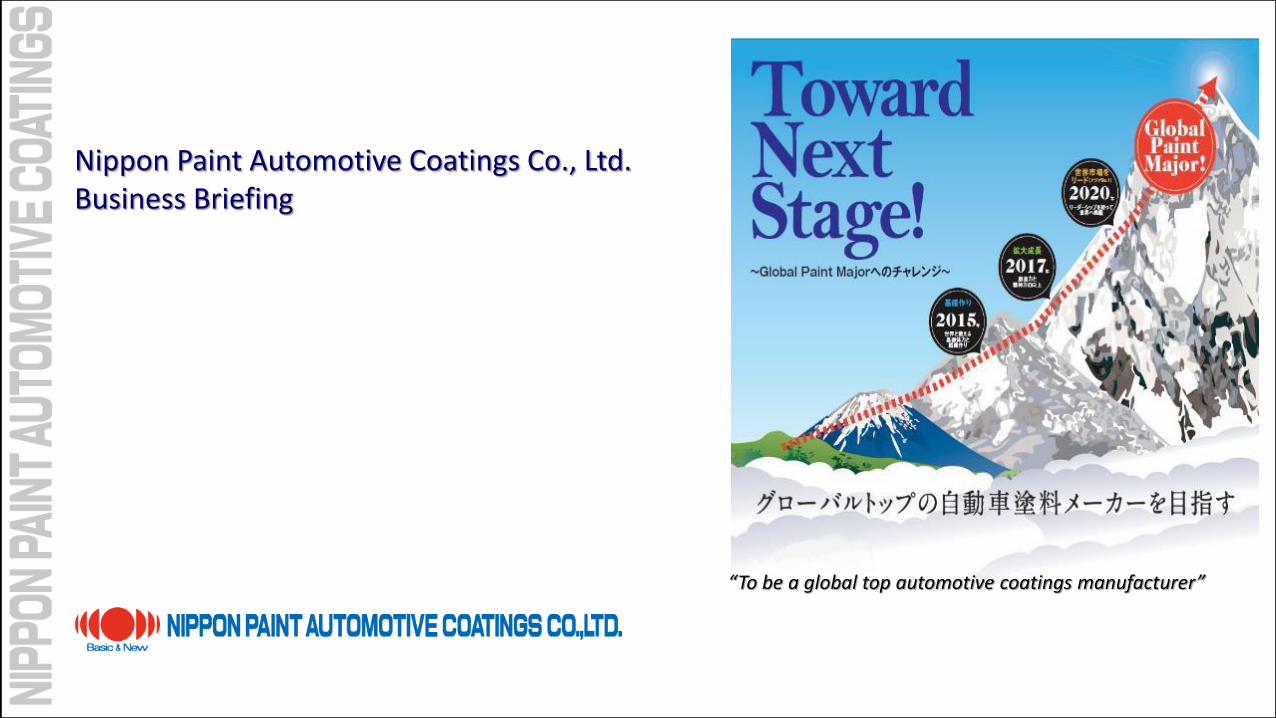
Nippon Paint Automotive Coatings Co., Ltd.Business Briefing
“To be a global top automotive coatings manufacturer”
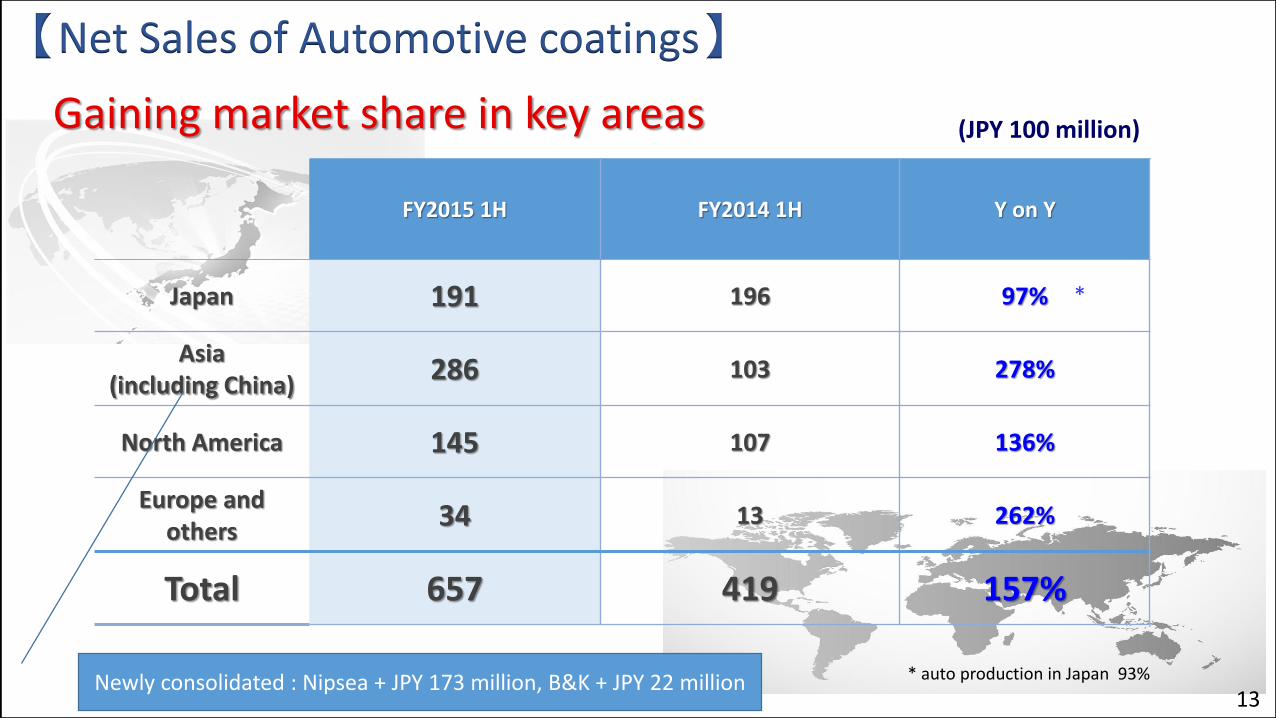
FY2015 1H FY2014 1H Y on Y
Japan 191 196 97%
Asia(including China)
286 103 278%
North America 145 107 136%
Europe and others
34 13 262%
Total 657 419 157%
【Net Sales of Automotive coatings】
(JPY 100 million)
Newly consolidated : Nipsea + JPY 173 million, B&K + JPY 22 million
Gaining market share in key areas
* auto production in Japan 93%
*
13
アメリカ 倉庫拡充
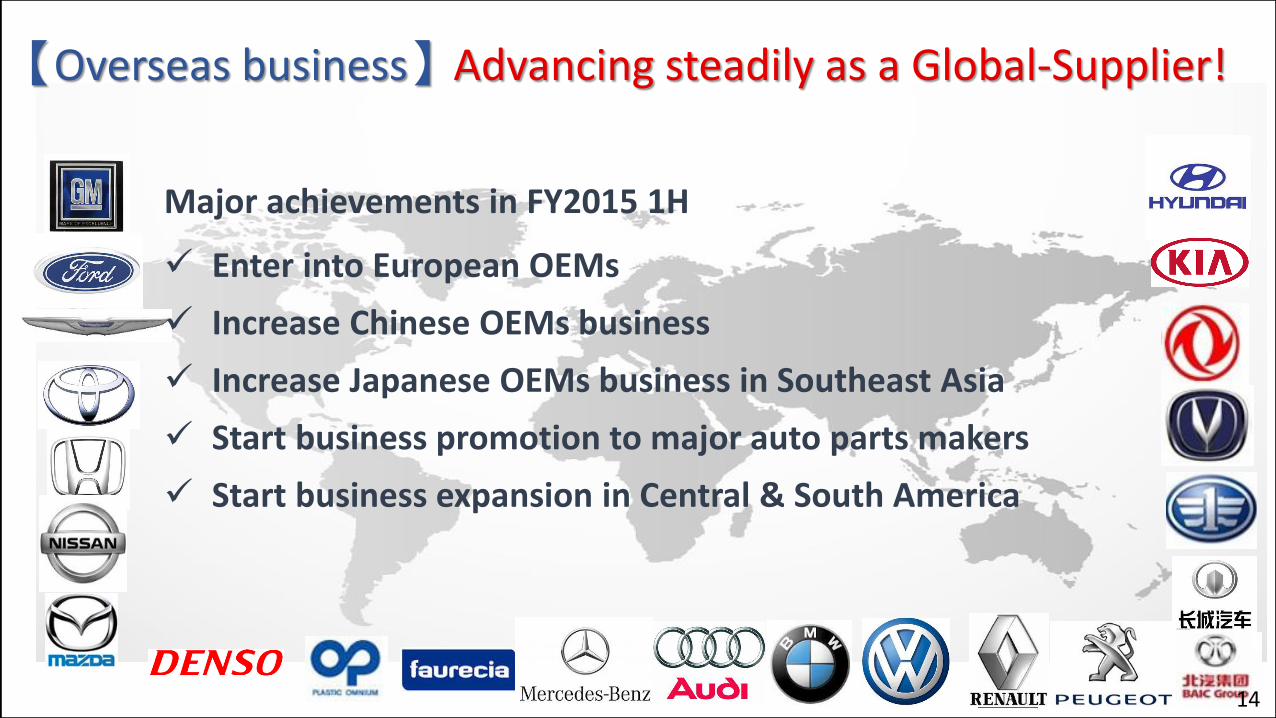
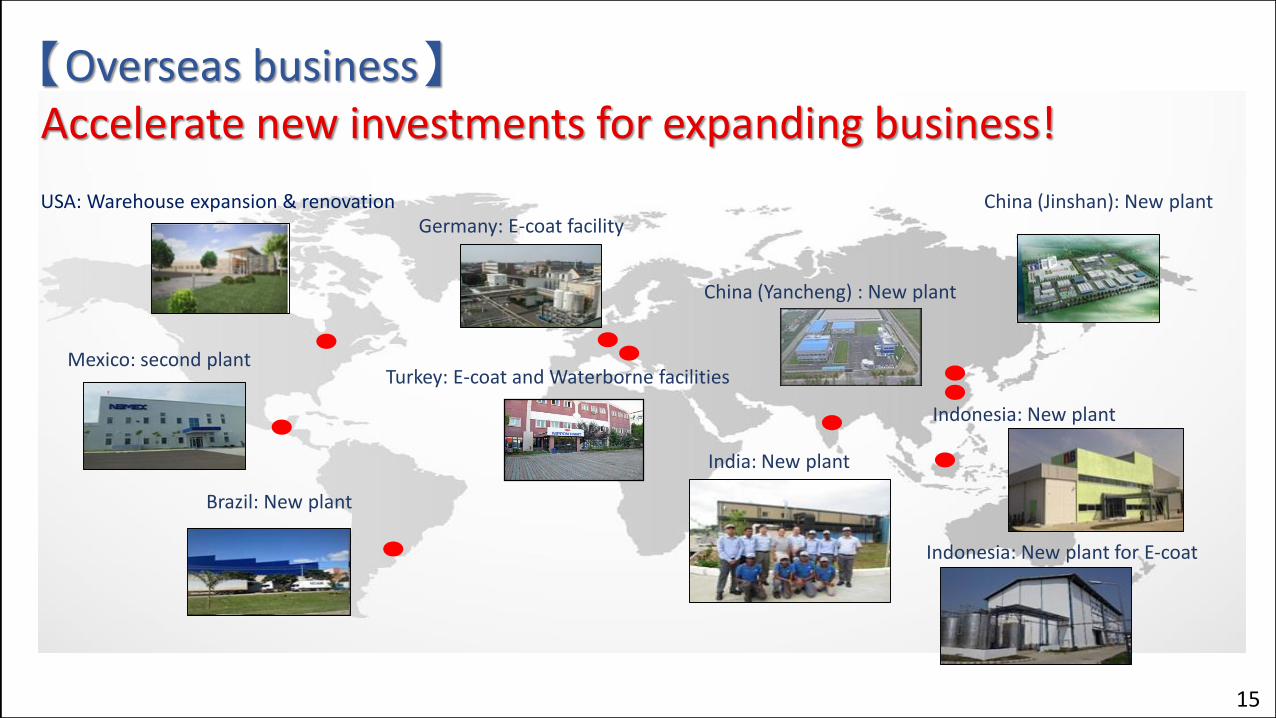
【Overseas business】 Advancing steadily as a Global-Supplier!
Major achievements in FY2015 1H
Enter into European OEMs
Increase Chinese OEMs business
Increase Japanese OEMs business in Southeast Asia
Start business promotion to major auto parts makers
Start business expansion in Central & South America
14
Germany: E-coat facilityChina (Jinshan): New plant
India: New plant
Indonesia: New plant
Indonesia: New plant for E-coat
Brazil: New plant
Mexico: second plant
China (Yancheng) : New plant
【Overseas business】Accelerate new investments for expanding business!
USA: Warehouse expansion & renovation
Turkey: E-coat and Waterborne facilities
15
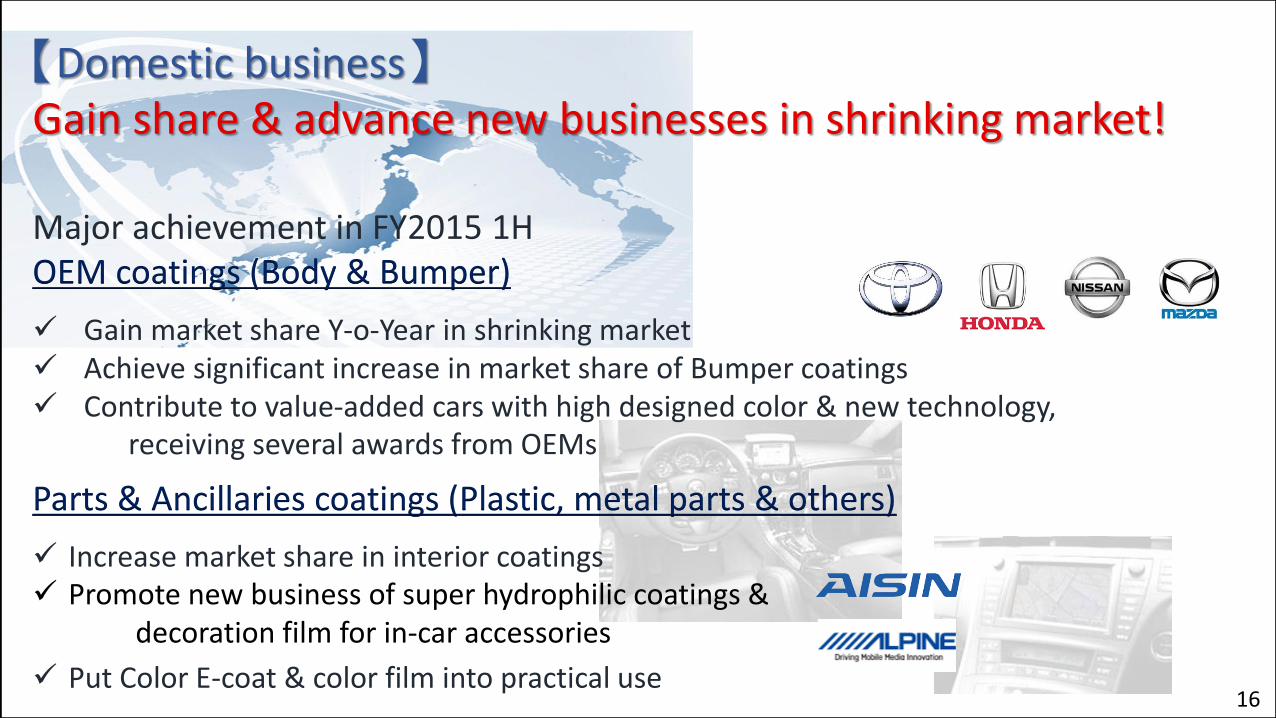
Major achievement in FY2015 1HOEM coatings (Body & Bumper)
Gain market share Y-o-Year in shrinking market Achieve significant increase in market share of Bumper coatings Contribute to value-added cars with high designed color & new technology,
receiving several awards from OEMs
Parts & Ancillaries coatings (Plastic, metal parts & others)
Increase market share in interior coatings Promote new business of super hydrophilic coatings &
decoration film for in-car accessories
Put Color E-coat & color film into practical use
【Domestic business】Gain share & advance new businesses in shrinking market!
16
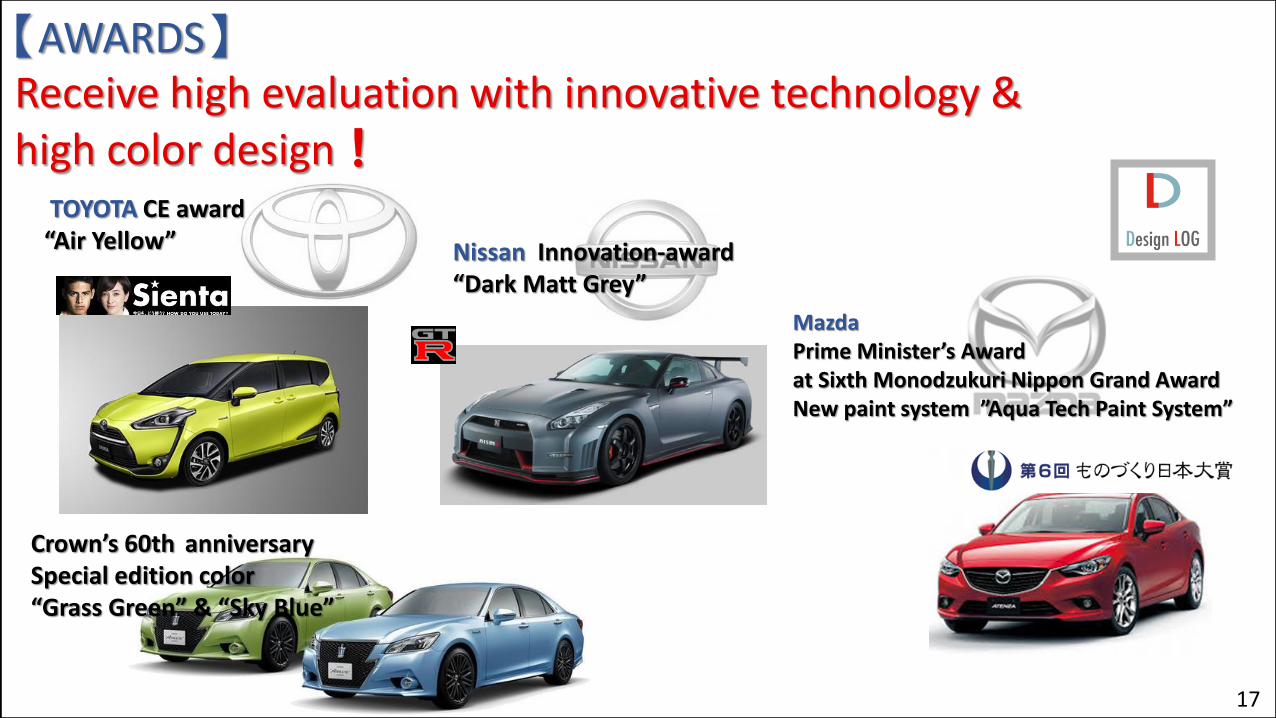
【AWARDS】Receive high evaluation with innovative technology & high color design!
MazdaPrime Minister’s Awardat Sixth Monodzukuri Nippon Grand AwardNew paint system ”Aqua Tech Paint System”
TOYOTA CE award“Air Yellow” Nissan Innovation-award
“Dark Matt Grey”
Crown’s 60th anniversary Special edition color “Grass Green” & “Sky Blue”
17

Nippon Paint Co., Ltd.Decorative Paints Business Briefing
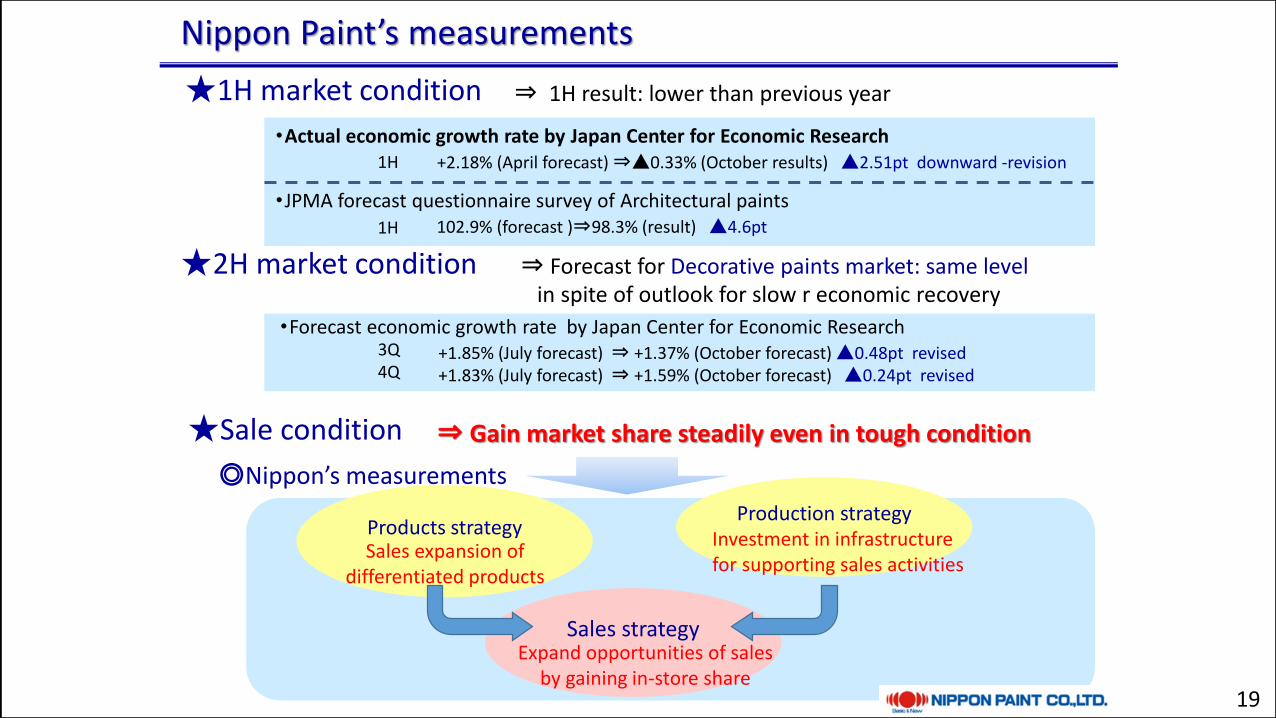
・Actual economic growth rate by Japan Center for Economic Research
・JPMA forecast questionnaire survey of Architectural paints
Nippon Paint’s measurements
⇒ 1H result: lower than previous year
★Sale condition
1H +2.18% (April forecast)⇒▲0.33% (October results) ▲2.51pt downward -revision
1H 102.9% (forecast )⇒98.3% (result) ▲4.6pt
★1H market condition
⇒ Gain market share steadily even in tough condition
◎Nippon’s measurements
★2H market condition ⇒ Forecast for Decorative paints market: same level in spite of outlook for slow r economic recovery
・Forecast economic growth rate by Japan Center for Economic Research3Q4Q
+1.85% (July forecast) ⇒ +1.37% (October forecast) ▲0.48pt revised+1.83% (July forecast) ⇒ +1.59% (October forecast) ▲0.24pt revised
Products strategySales expansion of
differentiated products
Production strategyInvestment in infrastructure for supporting sales activities
Sales strategyExpand opportunities of sales
by gaining in-store share19
0
50
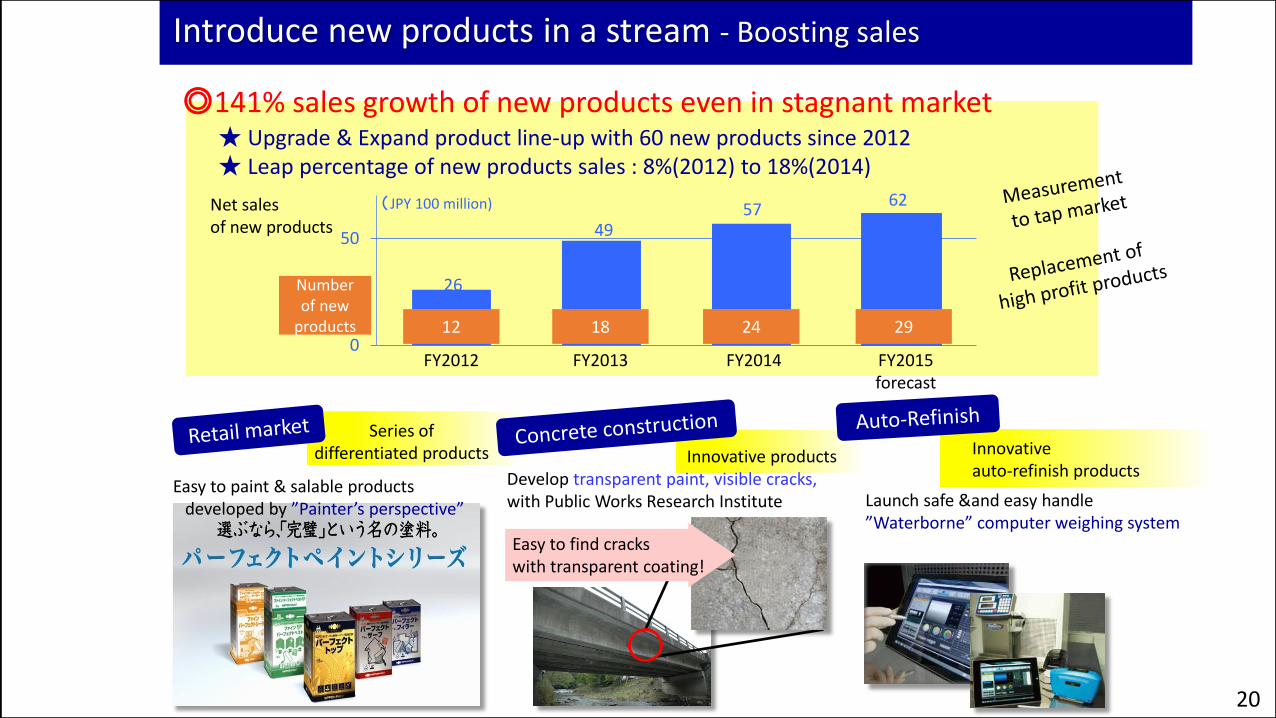
Introduce new products in a stream - Boosting sales
◎141% sales growth of new products even in stagnant market
Easy to paint & salable productsdeveloped by ”Painter’s perspective”
★ Upgrade & Expand product line-up with 60 new products since 2012★ Leap percentage of new products sales : 8%(2012) to 18%(2014)
Develop transparent paint, visible cracks,with Public Works Research Institute Launch safe &and easy handle
”Waterborne” computer weighing system
FY2012 FY2013 FY2014 FY2015forecast
(JPY 100 million)
Series of differentiated products Innovative products Innovative
auto-refinish products
Easy to find cracks with transparent coating!
Number of new
products 12 18 24 29
26
4957
62Net sales of new products
20
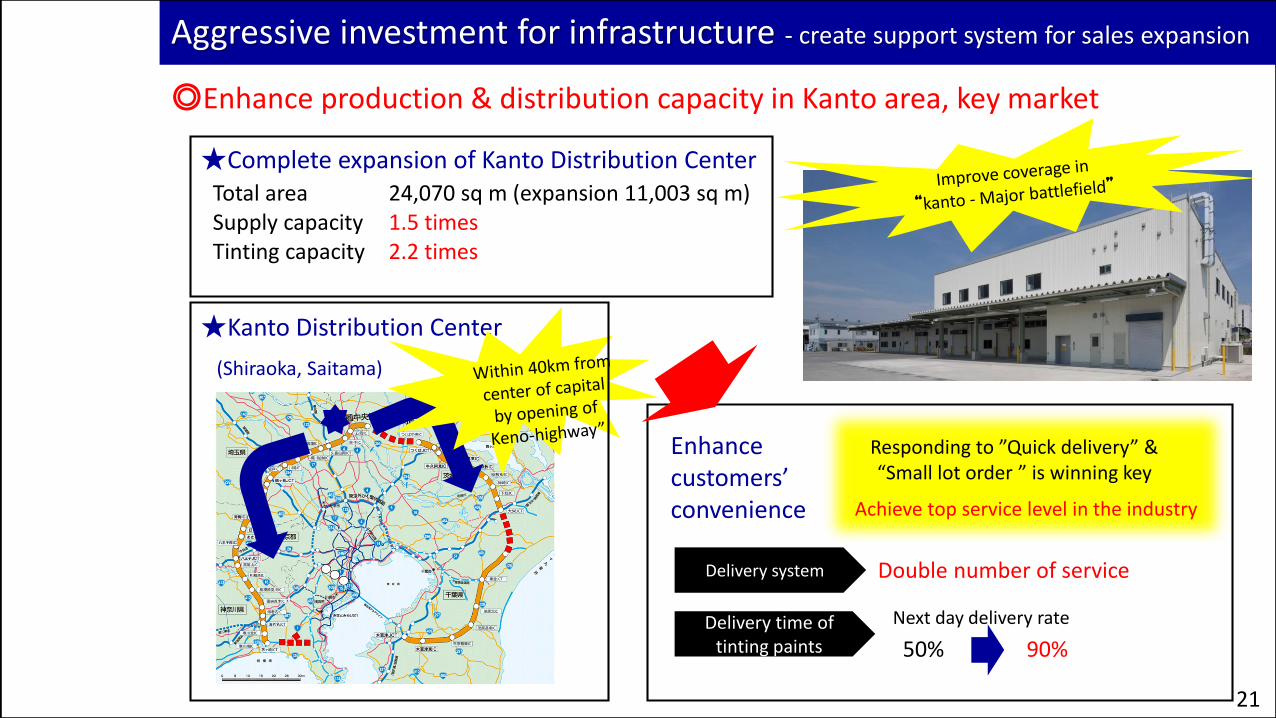
Aggressive investment for infrastructure - create support system for sales expansion
★Complete expansion of Kanto Distribution CenterTotal areaSupply capacityTinting capacity
★Kanto Distribution Center
(Shiraoka, Saitama)
Enhancecustomers’ convenience
Delivery system
Delivery time oftinting paints
Double number of service
Next day delivery rate
50% 90%
Responding to ”Quick delivery” & “Small lot order ” is winning key
24,070 sq m (expansion 11,003 sq m)1.5 times2.2 times
◎Enhance production & distribution capacity in Kanto area, key market
Achieve top service level in the industry
21
※Significant changes in financial results of FY2015 by the acquisition of equity-method affiliates in Asia
<Supplement>
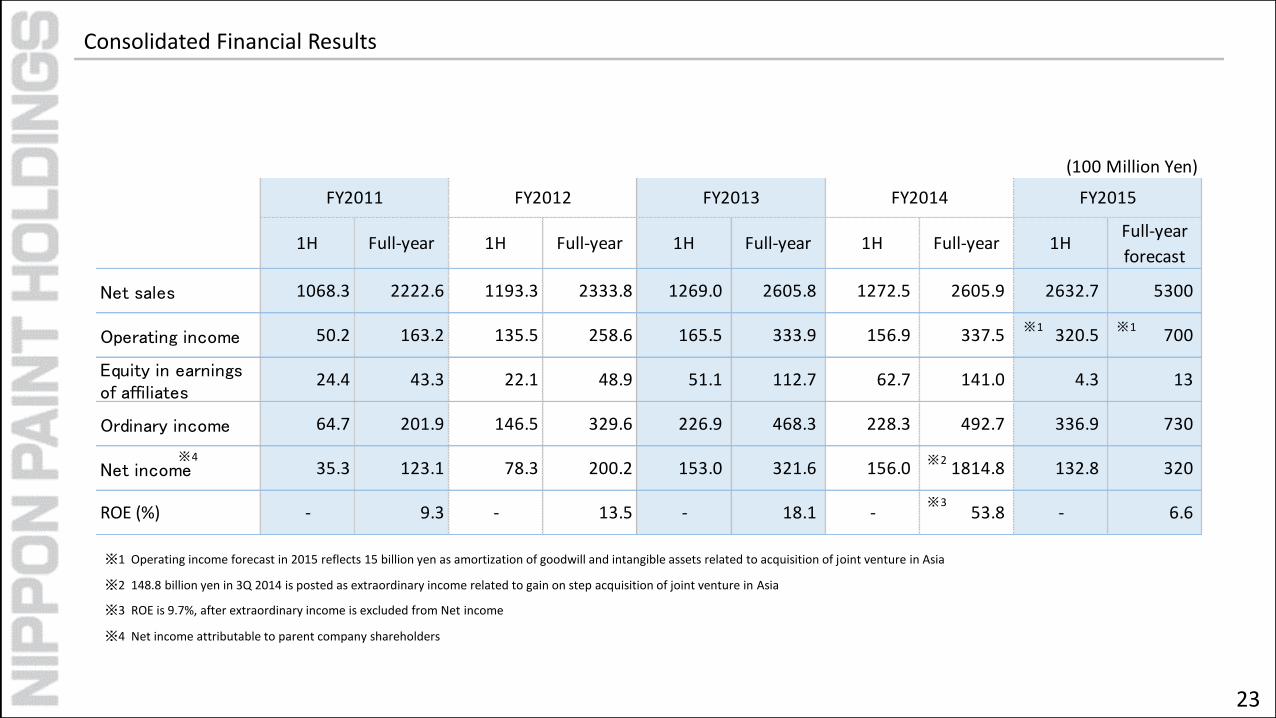
(100 Million Yen)
1H Full-year 1H Full-year 1H Full-year 1H Full-year 1HFull-year
forecast
Net sales 1068.3 2222.6 1193.3 2333.8 1269.0 2605.8 1272.5 2605.9 2632.7 5300
Operating income 50.2 163.2 135.5 258.6 165.5 333.9 156.9 337.5 320.5 700
Equity in earningsof affiliates
24.4 43.3 22.1 48.9 51.1 112.7 62.7 141.0 4.3 13
Ordinary income 64.7 201.9 146.5 329.6 226.9 468.3 228.3 492.7 336.9 730
Net income 35.3 123.1 78.3 200.2 153.0 321.6 156.0 1814.8 132.8 320
ROE (%) - 9.3 - 13.5 - 18.1 - 53.8 - 6.6
FY2011 FY2012 FY2013 FY2014 FY2015
※1
※2
※3
※1
※4
Consolidated Financial Results
※1 Operating income forecast in 2015 reflects 15 billion yen as amortization of goodwill and intangible assets related to acquisition of joint venture in Asia
※2 148.8 billion yen in 3Q 2014 is posted as extraordinary income related to gain on step acquisition of joint venture in Asia
※3 ROE is 9.7%, after extraordinary income is excluded from Net income
※4 Net income attributable to parent company shareholders
23
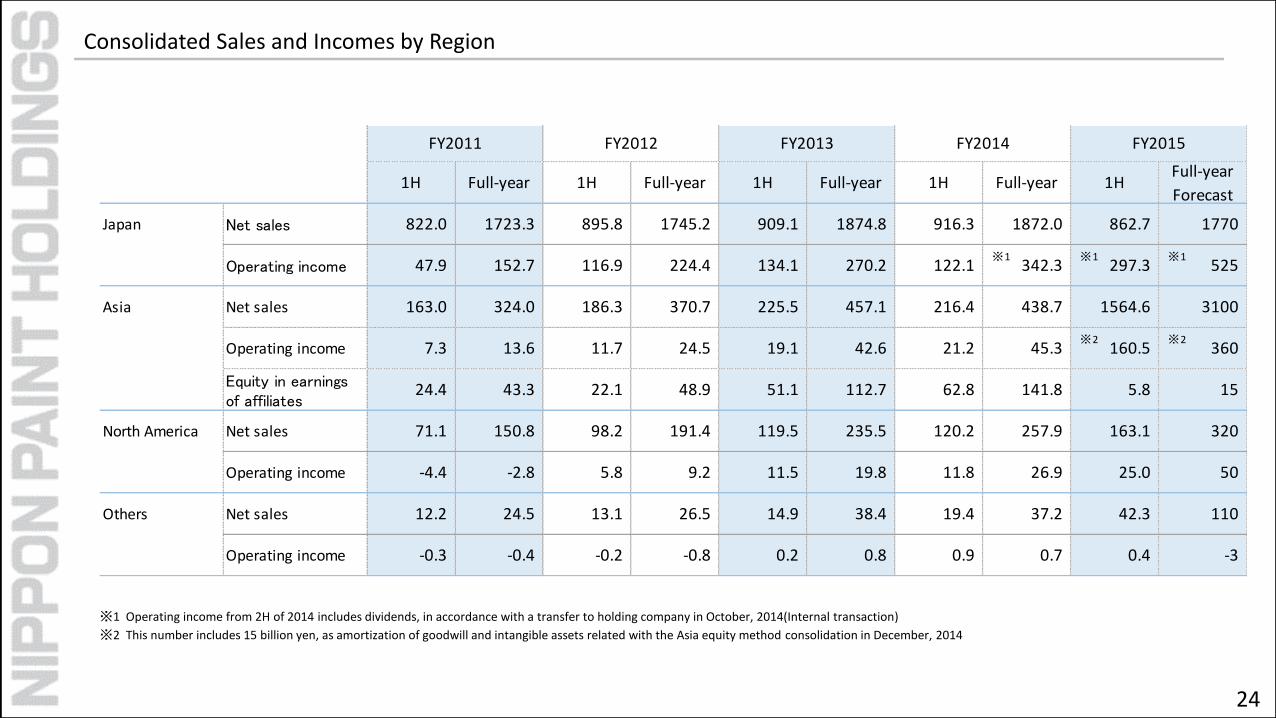
Consolidated Sales and Incomes by Region
※1 Operating income from 2H of 2014 includes dividends, in accordance with a transfer to holding company in October, 2014(Internal transaction)
※2 This number includes 15 billion yen, as amortization of goodwill and intangible assets related with the Asia equity method consolidation in December, 2014
1H Full-year 1H Full-year 1H Full-year 1H Full-year 1HFull-year
Forecast
Japan Net sales 822.0 1723.3 895.8 1745.2 909.1 1874.8 916.3 1872.0 862.7 1770
Operating income 47.9 152.7 116.9 224.4 134.1 270.2 122.1 342.3 297.3 525
Asia Net sales 163.0 324.0 186.3 370.7 225.5 457.1 216.4 438.7 1564.6 3100
Operating income 7.3 13.6 11.7 24.5 19.1 42.6 21.2 45.3 160.5 360
Equity in earningsof affiliates
24.4 43.3 22.1 48.9 51.1 112.7 62.8 141.8 5.8 15
North America Net sales 71.1 150.8 98.2 191.4 119.5 235.5 120.2 257.9 163.1 320
Operating income -4.4 -2.8 5.8 9.2 11.5 19.8 11.8 26.9 25.0 50
Others Net sales 12.2 24.5 13.1 26.5 14.9 38.4 19.4 37.2 42.3 110
Operating income -0.3 -0.4 -0.2 -0.8 0.2 0.8 0.9 0.7 0.4 -3
FY2011 FY2012 FY2013 FY2014 FY2015
※1 ※1 ※1
※2 ※2
24
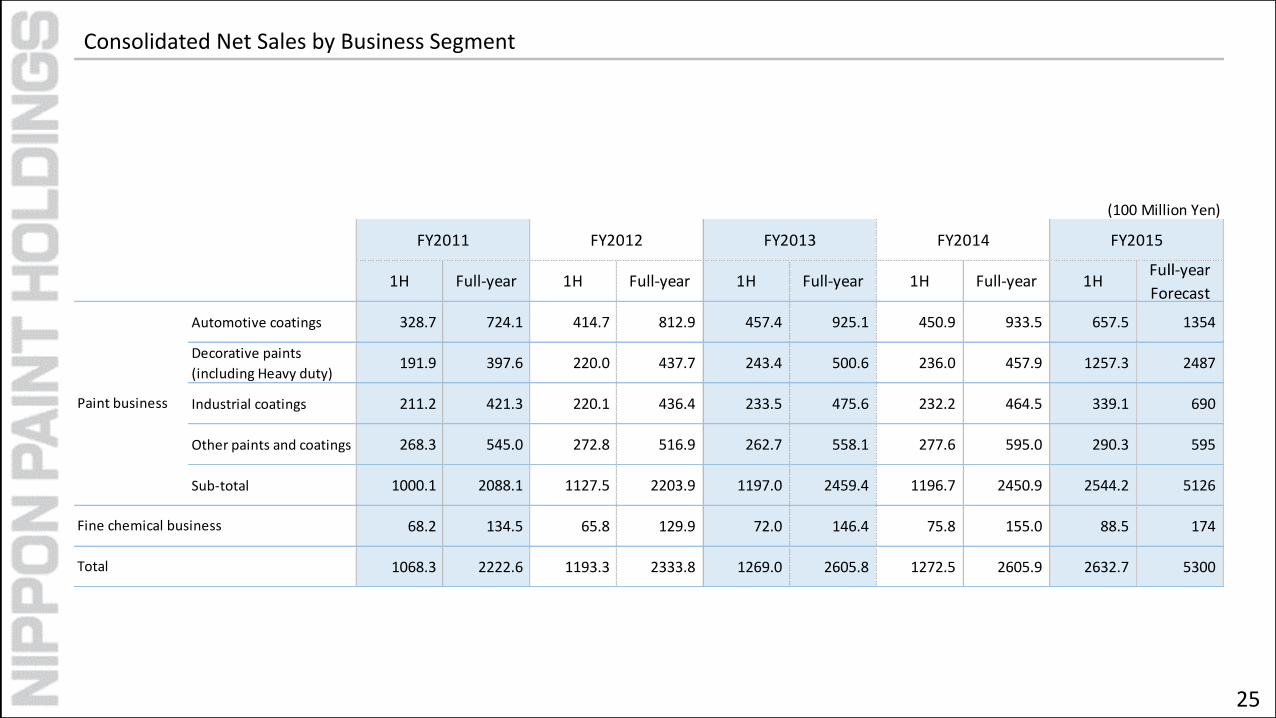
Consolidated Net Sales by Business Segment
(100 Million Yen)
1H Full-year 1H Full-year 1H Full-year 1H Full-year 1HFull-year
Forecast
Automotive coatings 328.7 724.1 414.7 812.9 457.4 925.1 450.9 933.5 657.5 1354
Decorative paints
(including Heavy duty)191.9 397.6 220.0 437.7 243.4 500.6 236.0 457.9 1257.3 2487
Industrial coatings 211.2 421.3 220.1 436.4 233.5 475.6 232.2 464.5 339.1 690
Other paints and coatings 268.3 545.0 272.8 516.9 262.7 558.1 277.6 595.0 290.3 595
Sub-total 1000.1 2088.1 1127.5 2203.9 1197.0 2459.4 1196.7 2450.9 2544.2 5126
68.2 134.5 65.8 129.9 72.0 146.4 75.8 155.0 88.5 174
1068.3 2222.6 1193.3 2333.8 1269.0 2605.8 1272.5 2605.9 2632.7 5300
Paint business
Fine chemical business
Total
FY2011 FY2012 FY2013 FY2014 FY2015
25
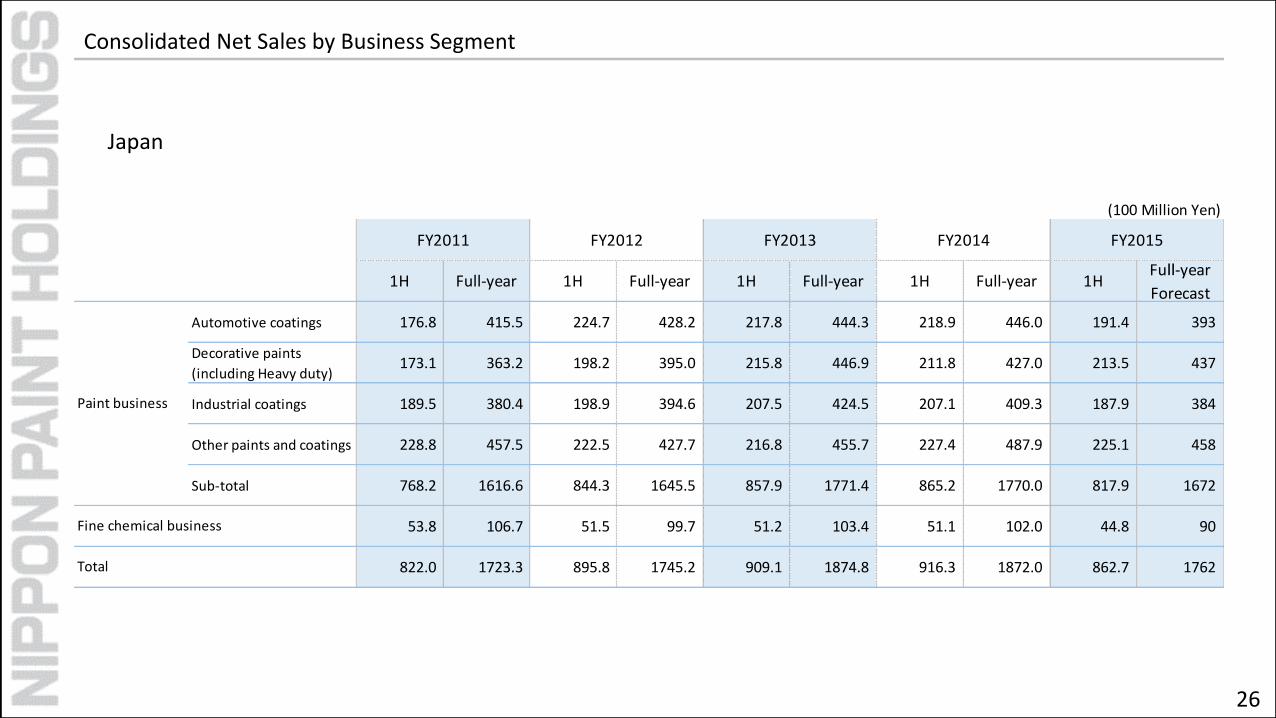
Consolidated Net Sales by Business Segment
Japan
26
(100 Million Yen)
1H Full-year 1H Full-year 1H Full-year 1H Full-year 1HFull-year
Forecast
Automotive coatings 176.8 415.5 224.7 428.2 217.8 444.3 218.9 446.0 191.4 393
Decorative paints
(including Heavy duty)173.1 363.2 198.2 395.0 215.8 446.9 211.8 427.0 213.5 437
Industrial coatings 189.5 380.4 198.9 394.6 207.5 424.5 207.1 409.3 187.9 384
Other paints and coatings 228.8 457.5 222.5 427.7 216.8 455.7 227.4 487.9 225.1 458
Sub-total 768.2 1616.6 844.3 1645.5 857.9 1771.4 865.2 1770.0 817.9 1672
53.8 106.7 51.5 99.7 51.2 103.4 51.1 102.0 44.8 90
822.0 1723.3 895.8 1745.2 909.1 1874.8 916.3 1872.0 862.7 1762
FY2013 FY2014 FY2015
Paint business
Total
Fine chemical business
FY2011 FY2012
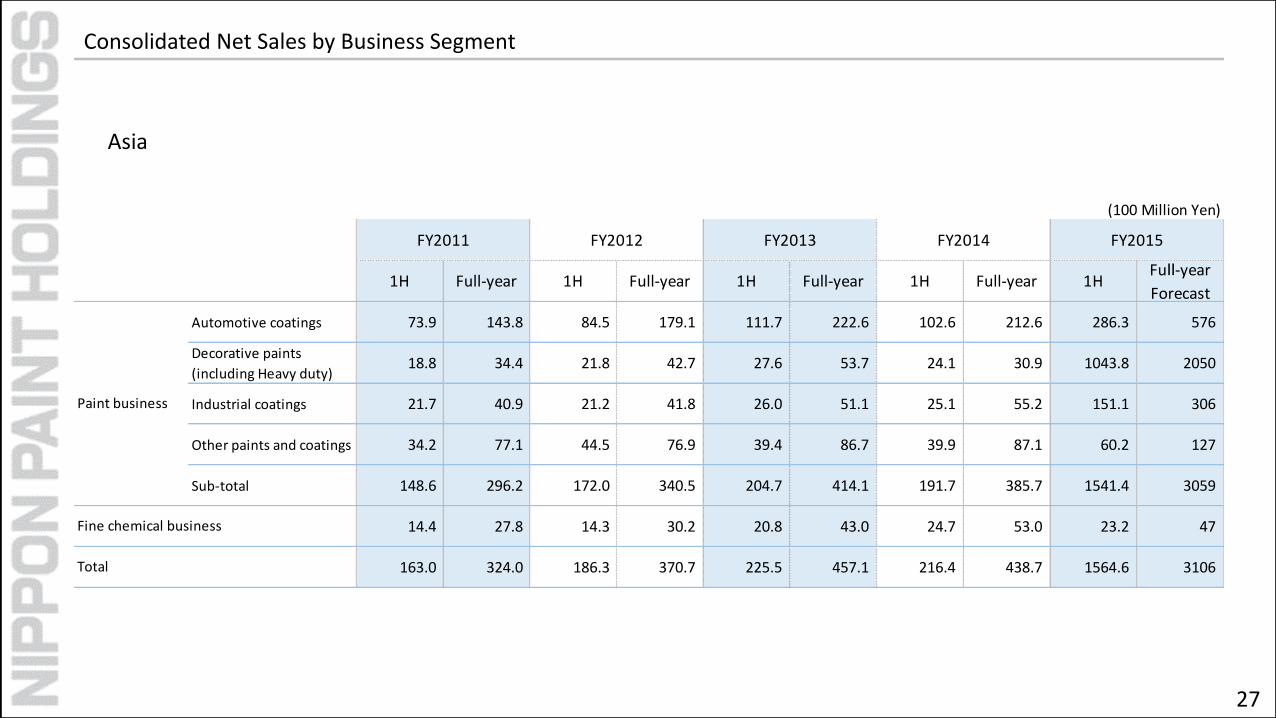
Consolidated Net Sales by Business Segment
Asia
27
(100 Million Yen)
1H Full-year 1H Full-year 1H Full-year 1H Full-year 1HFull-year
Forecast
Automotive coatings 73.9 143.8 84.5 179.1 111.7 222.6 102.6 212.6 286.3 576
Decorative paints
(including Heavy duty)18.8 34.4 21.8 42.7 27.6 53.7 24.1 30.9 1043.8 2050
Industrial coatings 21.7 40.9 21.2 41.8 26.0 51.1 25.1 55.2 151.1 306
Other paints and coatings 34.2 77.1 44.5 76.9 39.4 86.7 39.9 87.1 60.2 127
Sub-total 148.6 296.2 172.0 340.5 204.7 414.1 191.7 385.7 1541.4 3059
14.4 27.8 14.3 30.2 20.8 43.0 24.7 53.0 23.2 47
163.0 324.0 186.3 370.7 225.5 457.1 216.4 438.7 1564.6 3106
Paint business
Total
Fine chemical business
FY2011 FY2012 FY2013 FY2014 FY2015
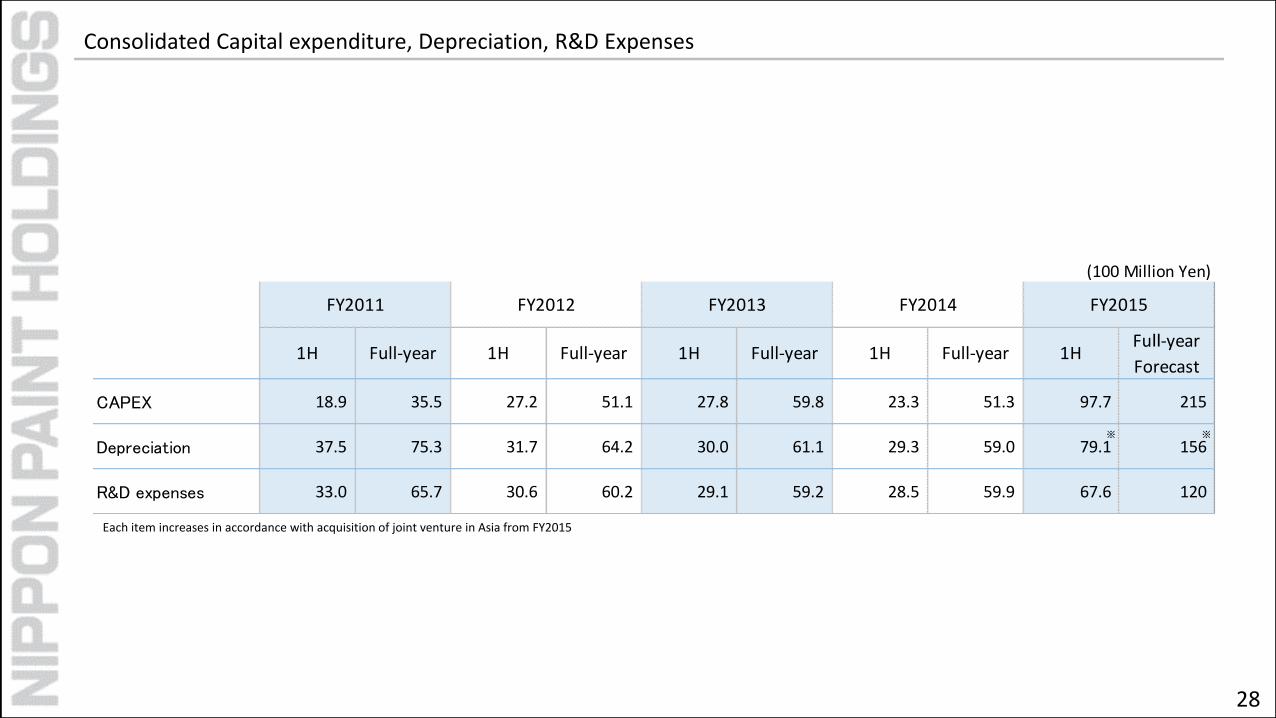
(100 Million Yen)
1H Full-year 1H Full-year 1H Full-year 1H Full-year 1HFull-year
Forecast
CAPEX 18.9 35.5 27.2 51.1 27.8 59.8 23.3 51.3 97.7 215
Depreciation 37.5 75.3 31.7 64.2 30.0 61.1 29.3 59.0 79.1 156
R&D expenses 33.0 65.7 30.6 60.2 29.1 59.2 28.5 59.9 67.6 120
FY2011 FY2012 FY2013 FY2014 FY2015
※ ※
Consolidated Capital expenditure, Depreciation, R&D Expenses
Each item increases in accordance with acquisition of joint venture in Asia from FY2015
28
(100 Million Yen)
FY2015
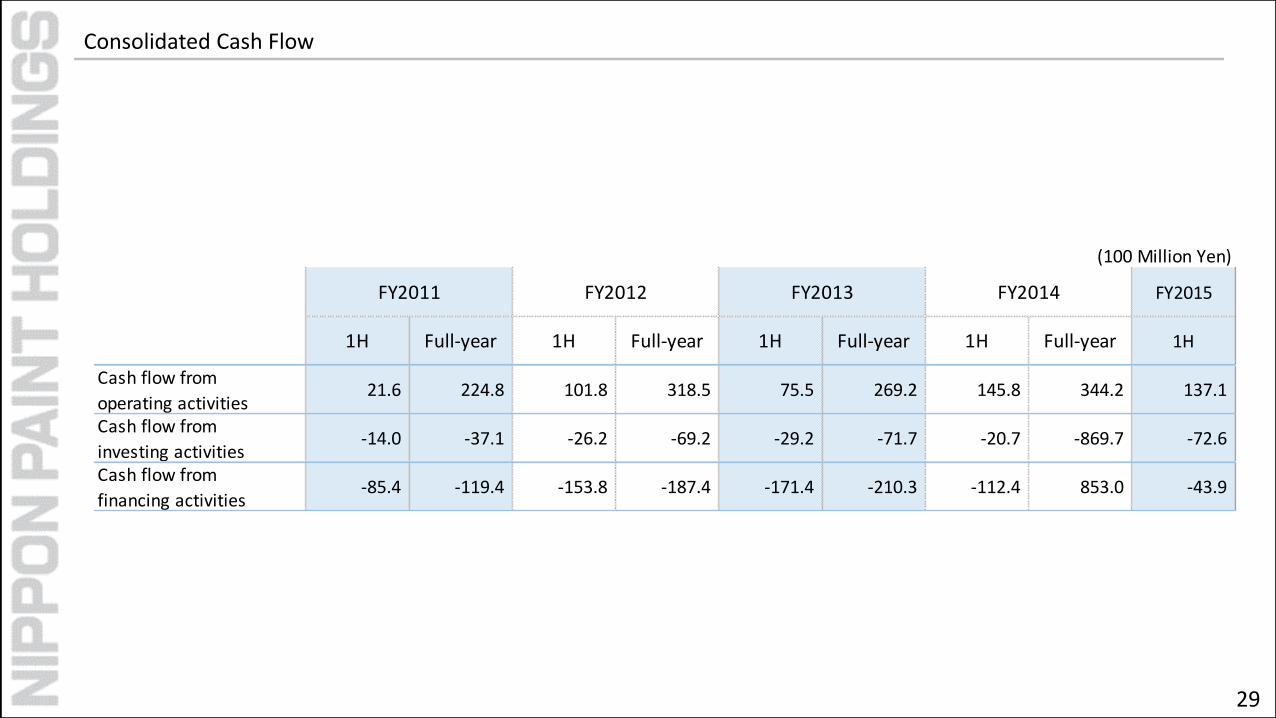
1H Full-year 1H Full-year 1H Full-year 1H Full-year 1H
Cash flow from
operating activities21.6 224.8 101.8 318.5 75.5 269.2 145.8 344.2 137.1
Cash flow from
investing activities-14.0 -37.1 -26.2 -69.2 -29.2 -71.7 -20.7 -869.7 -72.6
Cash flow from
financing activities-85.4 -119.4 -153.8 -187.4 -171.4 -210.3 -112.4 853.0 -43.9
FY2011 FY2012 FY2013 FY2014
Consolidated Cash Flow
29
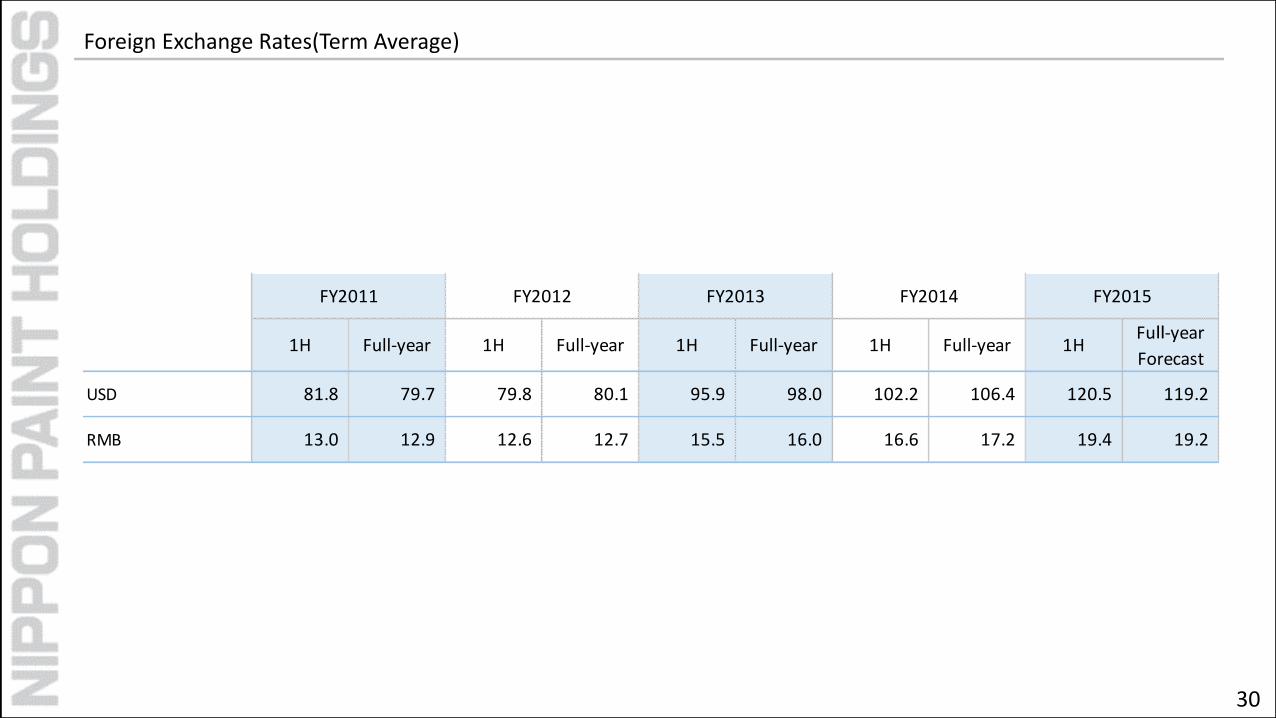
1H Full-year 1H Full-year 1H Full-year 1H Full-year 1HFull-year
Forecast
USD 81.8 79.7 79.8 80.1 95.9 98.0 102.2 106.4 120.5 119.2
RMB 13.0 12.9 12.6 12.7 15.5 16.0 16.6 17.2 19.4 19.2
FY2011 FY2012 FY2013 FY2014 FY2015
Foreign Exchange Rates(Term Average)
30
FY2015
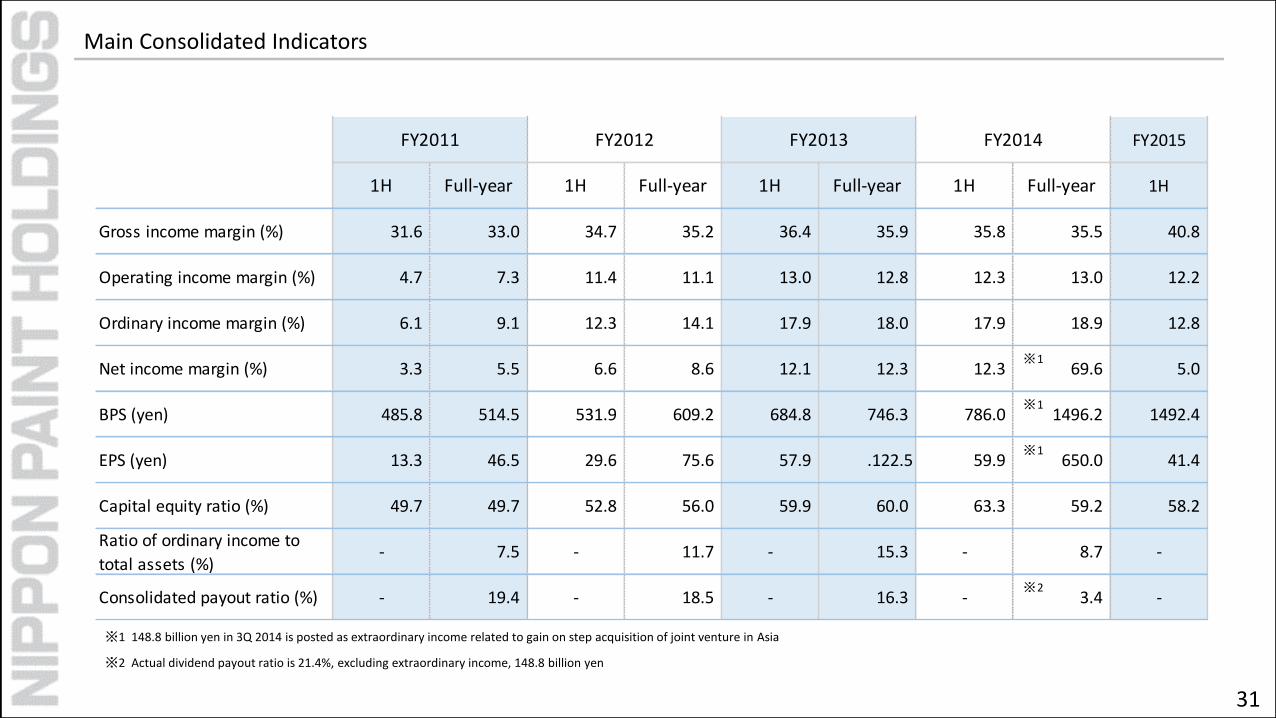
1H Full-year 1H Full-year 1H Full-year 1H Full-year 1H
Gross income margin (%) 31.6 33.0 34.7 35.2 36.4 35.9 35.8 35.5 40.8
Operating income margin (%) 4.7 7.3 11.4 11.1 13.0 12.8 12.3 13.0 12.2
Ordinary income margin (%) 6.1 9.1 12.3 14.1 17.9 18.0 17.9 18.9 12.8
Net income margin (%) 3.3 5.5 6.6 8.6 12.1 12.3 12.3 69.6 5.0
BPS (yen) 485.8 514.5 531.9 609.2 684.8 746.3 786.0 1496.2 1492.4
EPS (yen) 13.3 46.5 29.6 75.6 57.9 .122.5 59.9 650.0 41.4
Capital equity ratio (%) 49.7 49.7 52.8 56.0 59.9 60.0 63.3 59.2 58.2
Ratio of ordinary income to
total assets (%)- 7.5 - 11.7 - 15.3 - 8.7 -
Consolidated payout ratio (%) - 19.4 - 18.5 - 16.3 - 3.4 -
FY2011 FY2012 FY2013 FY2014
※1
※1
※1
※2
※1 148.8 billion yen in 3Q 2014 is posted as extraordinary income related to gain on step acquisition of joint venture in Asia
Main Consolidated Indicators
※2 Actual dividend payout ratio is 21.4%, excluding extraordinary income, 148.8 billion yen
31
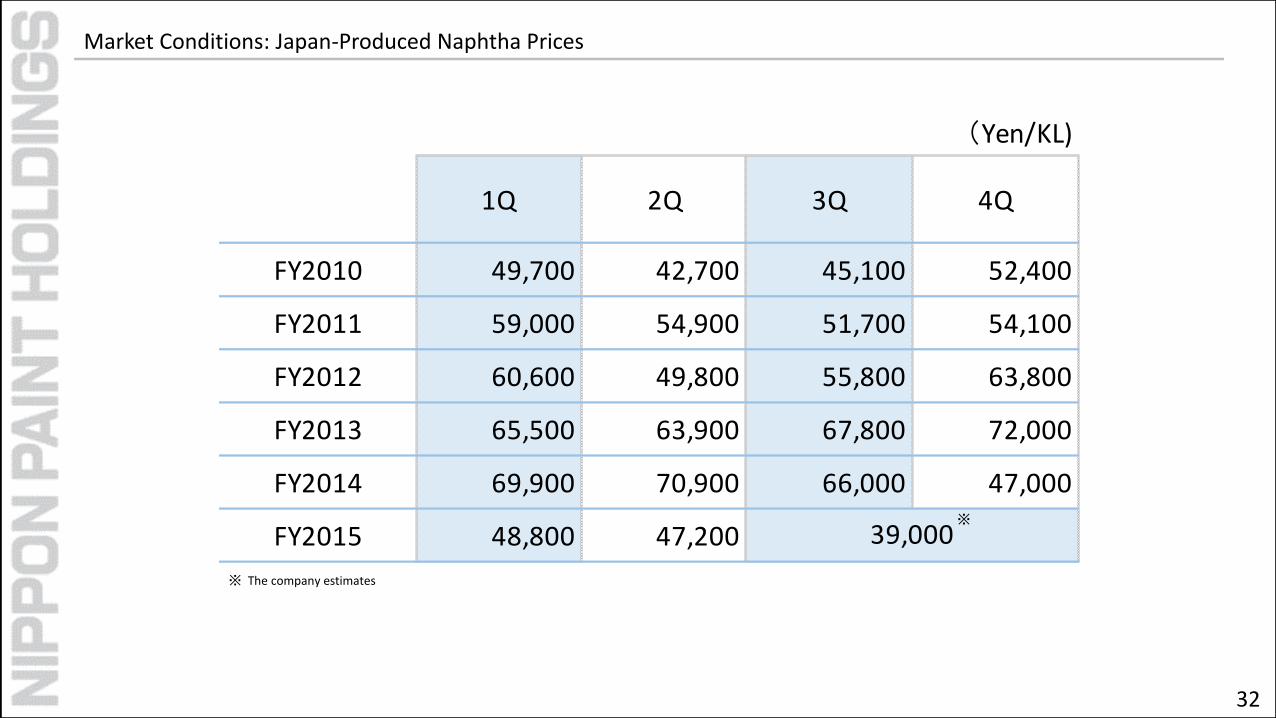
Market Conditions: Japan-Produced Naphtha Prices
(Yen/KL)
1Q 2Q 3Q 4Q
FY2010 49,700 42,700 45,100 52,400
FY2011 59,000 54,900 51,700 54,100
FY2012 60,600 49,800 55,800 63,800
FY2013 65,500 63,900 67,800 72,000
FY2014 69,900 70,900 66,000 47,000
FY2015 48,800 47,200 39,000※
32
※ The company estimates
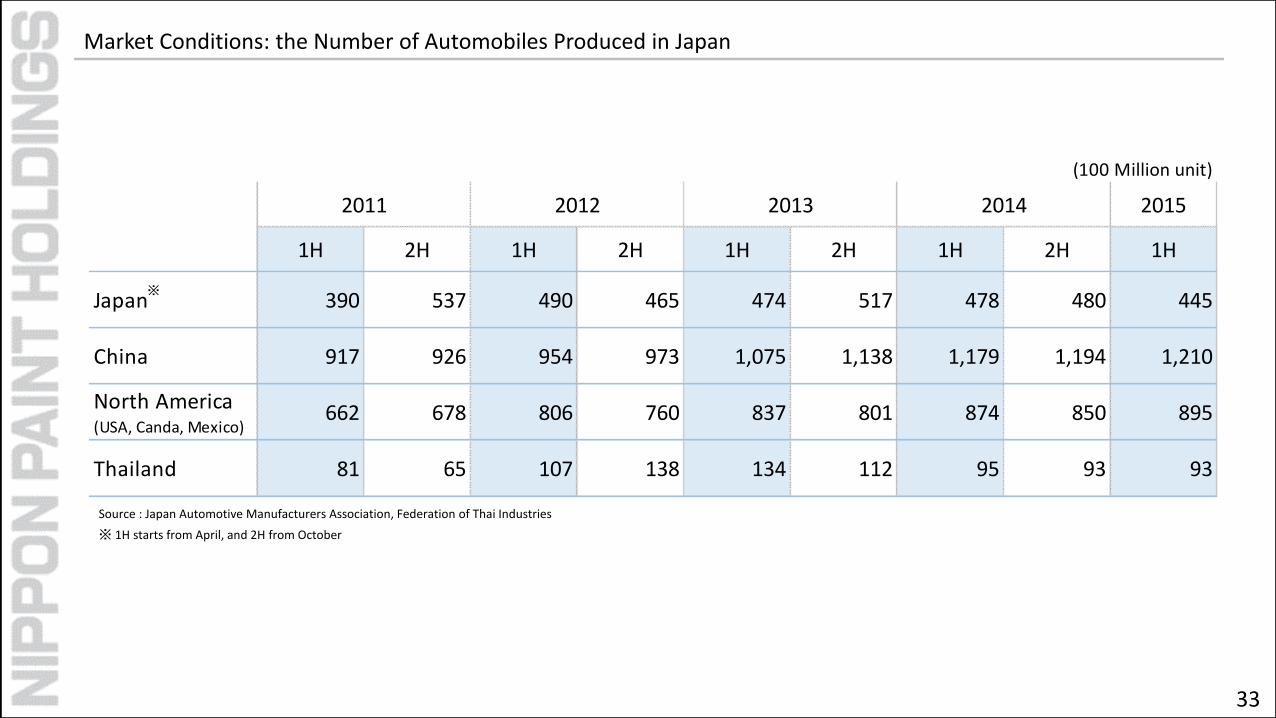
Market Conditions: the Number of Automobiles Produced in Japan
(100 Million unit)
2015
1H 2H 1H 2H 1H 2H 1H 2H 1H
Japan 390 537 490 465 474 517 478 480 445
China 917 926 954 973 1,075 1,138 1,179 1,194 1,210
North America(USA, Canda, Mexico)
662 678 806 760 837 801 874 850 895
Thailand 81 65 107 138 134 112 95 93 93
2011 2012 2013 2014
※
33
Source : Japan Automotive Manufacturers Association, Federation of Thai Industries
※ 1H starts from April, and 2H from October
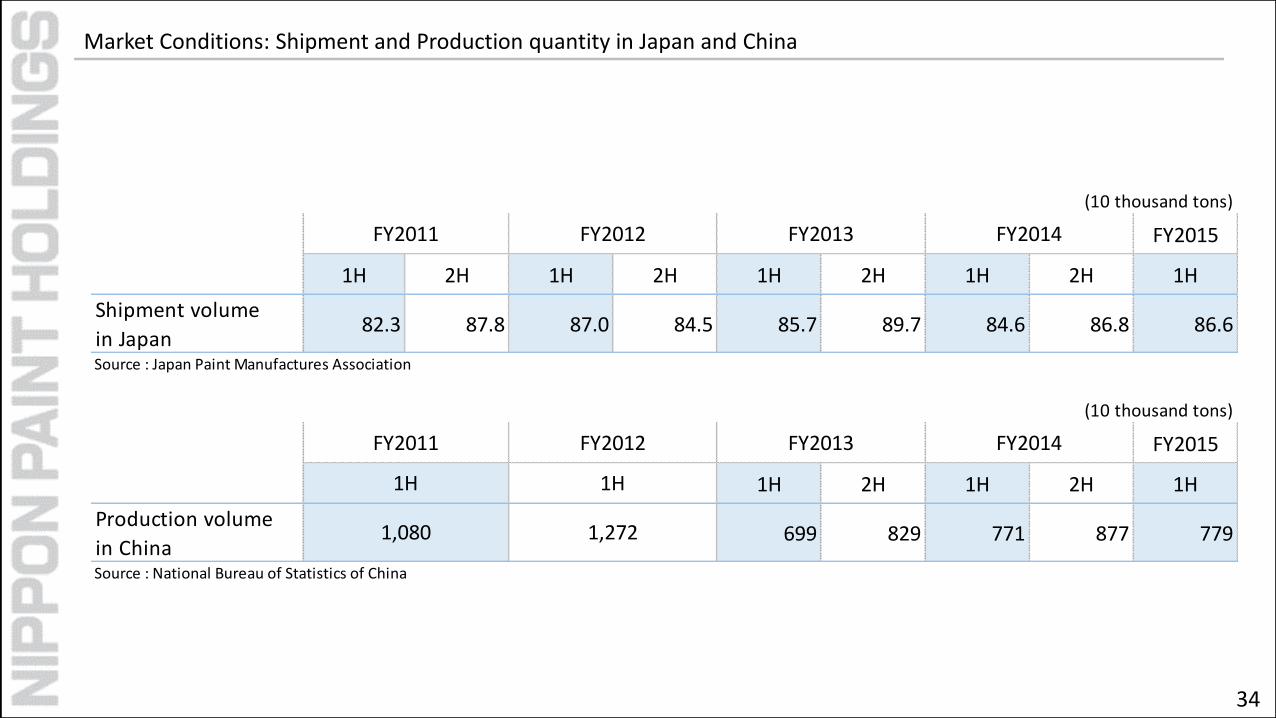
Market Conditions: Shipment and Production quantity in Japan and China
(10 thousand tons)
FY2015
1H 2H 1H 2H 1H 2H 1H 2H 1H
Shipment volume
in Japan82.3 87.8 87.0 84.5 85.7 89.7 84.6 86.8 86.6
Source : Japan Paint Manufactures Association
(10 thousand tons)
FY2015
1H 2H 1H 2H 1H
Production volume
in China699 829 771 877 779
Source : National Bureau of Statistics of China
FY2014FY2011 FY2012
FY2011 FY2012 FY2013 FY2014
1H 1H
1,2721,080
FY2013
34
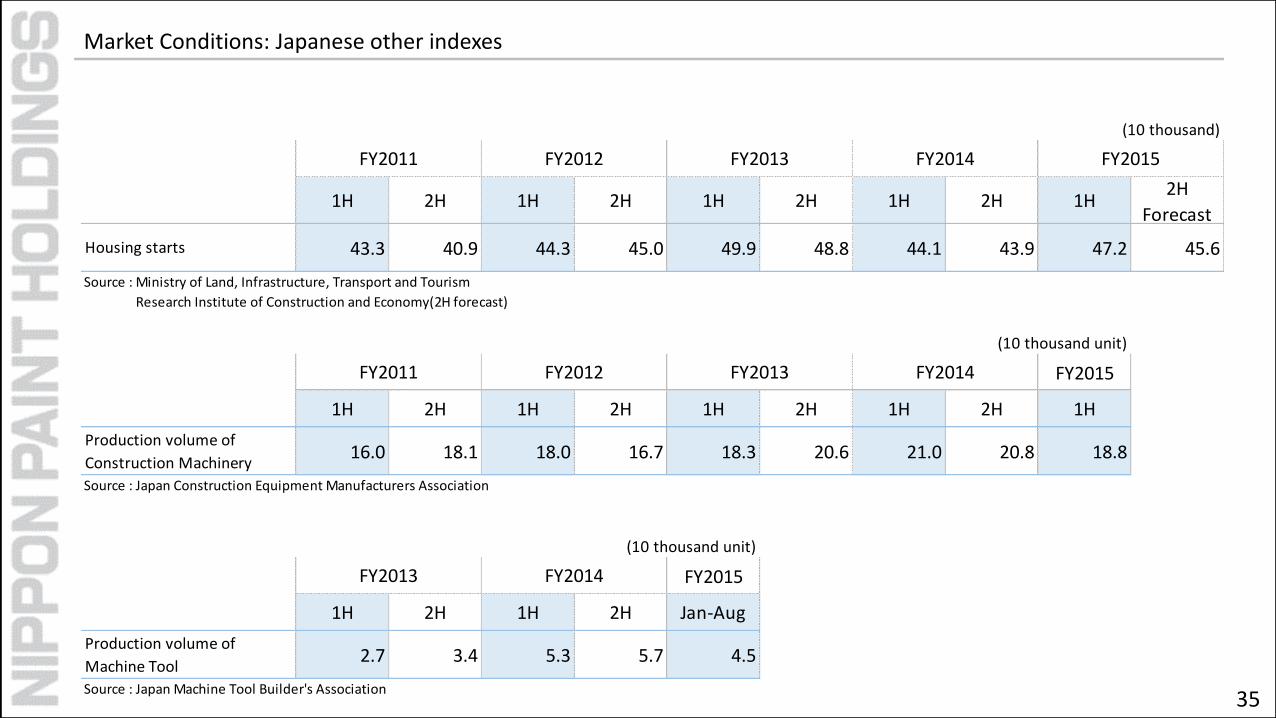
Market Conditions: Japanese other indexes
(10 thousand)
1H 2H 1H 2H 1H 2H 1H 2H 1H2H
Forecast
Housing starts 43.3 40.9 44.3 45.0 49.9 48.8 44.1 43.9 47.2 45.6
Source : Ministry of Land, Infrastructure, Transport and Tourism
Source : Research Institute of Construction and Economy(2H forecast)
(10 thousand unit)
FY2015
1H 2H 1H 2H 1H 2H 1H 2H 1H
Production volume of
Construction Machinery16.0 18.1 18.0 16.7 18.3 20.6 21.0 20.8 18.8
Source : Japan Construction Equipment Manufacturers Association
(10 thousand unit)
FY2015
1H 2H 1H 2H Jan-Aug
Production volume of
Machine Tool2.7 3.4 5.3 5.7 4.5
Source : Japan Machine Tool Builder's Association
FY2011 FY2012 FY2013 FY2014 FY2015
FY2011 FY2012 FY2013 FY2014
FY2013 FY2014
35
The forward-looking statements in this document are based on information available at the time of preparation and involve inherent risks and uncertainties. Accordingly, the actual results and performance of Nippon Paint Holdings Co., Ltd. and the Nippon Paint Holdings Group may be significantly different from the forward-looking statements.
Please be advised that Nippon Paint Holdings Co., Ltd. and information providers shall not be responsible for any damage suffered by any person relying on any information or statements contained herein.


![· 2019-05-28 · IA] PAINT FLEX 100 PU Bitumen Waterproofing Bathroom Balcony SIRIM NIPPON IA] PAINT FLEX zoo Acrylic Waterproofing Balcony Pour the NIPPON LATEX 18 into a pail](https://img.pdfslide.us/doc/110x75/5e3c69bfc0a8453d524e0024/2019-05-28-ia-paint-flex-100-pu-bitumen-waterproofing-bathroom-balcony-sirim.jpg)