Embed Size (px)
Citation preview

FY2015 Annual Report
on Food, Agriculture and Rural Areas
in Japan
Summary
Ministry of Agriculture, Forestry and Fisheries
Japan, 2016

The FY2015 Annual Report on food, agriculture and rural areas in Japan is based on Items
1 and 2 of Article 14 of the Food, Agriculture and Rural Areas Basic Act (Law No. 106 of
1999).

Contents
○FY2015 Annual Report on Food, Agriculture and Rural Areas in Japan
Foreword ··················································································· 1
Special Topic ·············································································· 3
Chapter 1: Efforts for Securing Stable Food Supply ································· 7
Chapter 2: Efforts for Creating Strong, Aggressive Agriculture ·················· 18
Chapter 3: Taking Advantage of Local Resources to Promote and Vitalize
Rural Areas ·············································································· 27
Chapter 4: Restoration/Reconstruction from the Great East Japan Earthquake 34
○Summary of FY2016 Measures for Food, Agriculture and Rural Areas ··· 36
Definitions ········································································ 37
○ Numbers in figures and tables are rounded in principle and may not add up to the total.
○ Maps in this report may not necessarily indicate Japan’s territories comprehensively.

Acronyms and abbreviations
CAA Consumer Affairs Agency
EU European Union
FAO Food and Agriculture Organization of the United Nations
IFAD International Fund for Agricultural Development
MAFF Ministry of Agriculture, Forestry and Fisheries
METI Ministry of Economy, Trade and Industry
MHLW Ministry of Health, Labour and Welfare
MIC Ministry of Internal Affairs and Communications
MOF Ministry of Finance
R&D Research and Development
US The United States
WFP World Food Programme
Symbols ha Hectare
a Are
kg Kilogram

Foreword
The Annual Report on Food, Agriculture and Rural Areas in Japan is a report on food, agriculture
and rural area trends that is annually submitted to the Diet based on the Food, Agriculture and Rural
Areas Basic Act.
The Trans-Pacific Partnership (TPP) negotiations in which Japan participated from July 2013
reached an agreement in principle in October 2015. TPP participating countries signed the
agreement in February 2016. While the TPP has been expected to bring about various benefits for
livelihoods and business operations in Japan, there exists the voice of concerns. Therefore, we must
carefully explain the details of the TPP agreement and implement appropriate policy measures to
keep sustainable production of agricultural, forestry and fisheries products, as well as develop the
agriculture-forestry-fisheries sector into a powerful growth industry.
In this respect, this report starts with a special topic, “TPP agreements and relevant policies,”
describing the background of TPP negotiations, outline of the agreement, impact assessment of TPP,
the comprehensive TPP-related policy outline and other TPP matters.
This report describes trends in food, agriculture and rural areas in three chapters: (1) efforts for
securing stable food supply; (2) efforts for creating strong, proactive agriculture; and (3) utilizing
local resources to promote rural areas. For the first time, each chapter establishes priority themes to
emphasize items that this report should communicate to the public. Specifically, this report takes up
“trend of food self-sufficiency potential,” “promoting the export of agricultural, forestry and
fisheries products, and expanding Japanese food and dietary culture overseas,” “agriculture
structure changes” and “regional revitalization trend.”
Another chapter describes the restoration/reconstruction from the Great East Japan Earthquake,
which struck five years ago.
This report also describes the implementation and effects of major policy measures to contribute to
the steady promotion of measures based on the Basic Plan for Food, Agriculture and Rural Areas as
decided by the Cabinet in March 2015.
While this report covers a wide range of topics, we have tried to introduce not only statistical data
analyses and comments but also specific efforts taken throughout Japan for developing agriculture
into a growth industry as much as possible in a bid to make this report easy to understand
We hope that this report will help people to understand Japan’s food, agriculture and rural areas.
1

Contents
1 Objectives and present situation of Basic Plan for Food, Agriculture and Rural Areas 2 Global food supply and demand, and efforts for establishing food security3 Food consumption trends and promotion of Shokuiku (food and nutrition education) 4 Ensuring food safety and consumer confidence5 Food industry trends6 Exploring new demand for agricultural, forestry and fisheries products and food
1 Farmland consolidation and trend of business farmers2 Developing and conserving agricultural production infrastructure3 Production trends for major farm and livestock products 4 Promoting technological innovation on production/distribution fronts5 Promotion of environmental policy such as responses to climate change6 Agriculture-related organizations supporting agriculture
1 Maintaining and demonstrating multifunctional roles of agriculture and rural areas2 Responding to wildlife damage3 Proactive utilization of local resources4 Exchanges between urban and rural areas through collaboration with various sectors5 Promotion of urban agriculture
1 Earthquake and tsunami damage and restoration/reconstruction efforts2 Impacts of the accident at the Fukushima Daiichi Nuclear Power Plant of the Tokyo
Electric Power Company and restoration/reconstruction efforts
Special Topic
Priority theme 1 Food self-sufficiency potential trends
TPP Agreement and Relevant Policies
1 Background2 Outline of the agreement3 Decision on the comprehensive TPP-related policy principles4 Economic impact analysis
Priority theme 2Export promotion and overseas dissemination of Japanese food and food culture
Priority theme Structural changes in agriculture
Priority theme Regional revitalization movement
Chapter 1Efforts for Securing Stable Food Supply
Chapter 2 Efforts for Creating Strong, Aggressive Agriculture
Chapter 3Taking Advantage of Local Resources to Promote and Vitalize Rural Areas
Chapter 4 Restoration/Reconstruction from the Great East Japan Earthquake
FY2015 Annual Report on Food, Agriculture and Rural Areas in Japan
Summary of FY2016 Measures for Food, Agriculture and Rural Areas
・・・・3・・・・4・・・・5・・・・6
・・・・7
・・9
・・・・11・・・・11・・・・13・・・・14・・・・16・・・・17
・・・・18
・・・・20・・・・21・・・・21・・・・25・・・・26・・・・26
・・・・27
・・・・31・・・・31・・・・32・・・・32・・・・33
・・・・34
・・・・35
・・・・36
2

○ Trans-Pacific Partnership (TPP) negotiations started in March 2010 among eight countries --Singapore, New Zealand, Chile, Brunei, the United States, Australia, Peru and Vietnam. Later, Malaysia, Mexico, Canada and Japan joined the negotiations, bringing the total number of negotiation participants to 12. Those countries’ gross domestic products combined account for as much as about 40% of global GDP.
○ An agreement in principle was reached at a ministerial meeting of TPP negotiations in Atlanta, USA, on October 5, 2015. The agreement was signed in Auckland, New Zealand, on February 4, 2016.
1 Background
Source: IMF, “World Economic Outlook Database April 2015”
TPP participating countries’ shares of global GDP (2013)
TPP agreement and relevant policies
Special Topic
Twelve countries participated in Trans-Pacific Partnership (TPP) negotiations, reaching a agreement in principle in October 2015. The government will carefully explain details of the agreement and expand farm management stabilization measures for agriculture, forestry and fisheries to pursue proactive agriculture, forestry and fisheries, based on the outline of comprehensive TPP-related policy principles as as decided in November 2015.
TPP participating countries
Source: TPP Task Force, Cabinet Secretariat
Vietnam
Canada
U.S.
Mexico
Peru
Chile
New Zealand
Australia
Singapore
Malaysia
BruneiJapan
22.2%
6.5%63.3%
U.S.
Mexico1.7%
Canada2.4%
Malaysia0.4%
Other 6 TPP participating countries
1.5%
Australia2.0%
Japan
Other countries
and regions
3

○ Backed by the resolutions adopted by the Agriculture, Forestry and Fisheries Committees of the Houses of Representatives and Councillors, Japan negotiated tenaciously to prevent any negative impact on domestic agriculture, forestry and fisheries industries, and rural areas. As a result, Japan won the maintenance of the state trading system and existing out-of-quota tariffs, the creation of tariff quotas and safeguards, longer tariff reduction staging and other effective measures mainly for five sensitive products.
○ As for tariffs on Japanese exports, Japan also won the elimination of tariffs on priority products (beef, rice, fisheries products, tea, etc.) for expanding agricultural, forestry and fisheries products and food exports.
2 Outline of the agreement
Details of agreement on 5 sensitive products
Source: MAFF
Product Summary of agreement
Rice
The existing state trading system is maintained along with the existing out-of-quota tariffrate (341 yen per kilogram). In addition to the existing WTO quotas, country specifictariff rate quotas using SBS mechanism (simultaneous buy and sell tender system) areestablished against the United States and Australia.
Wheat and barley
The existing state trading system is maintained along with the existing out-of-quota tariffrate (55 yen per kilogram for wheat). In addition to the existing WTO quotas, countryspecific tariff rate quotas and TPP wide tariff rate quotas using SBS mechanism areestablished. The markup is set to be reduced by 45% by the ninth year.
Sweeteningresource crops
The existing sugar price adjustment system is maintained for raw sugar and refinedsugar. TPP wide tariff rate quotas are set for each sugar preparation. For starch, theexisting sugar price adjustment system is maintained
Beef and pork
A tariff on beef is set to gradually be lowered from 38.5% at present to 9%. Theelimination of the beef tariff is avoided, with a tariff reduction period being as long as 16years. For pork, the existing differential tariff system is maintained and a tariff reductionperiod as long as 10 years is established. Moreover for beef and pork, the safeguardmeasure is established during the tariff reduction periods.
Dairy products
For skimmed milk powder and butter, the existing state trading system is maintained.New import quotas for the TPP participating countries are established. For whey whichis likely to compete with skimmed milk powder, a tariff reduction period as long as 21years is established along with the safeguard measure. Depending on the type of cheese,tariff treatment is different. Some are maintained as is. Some have a long tariffreduction period and the others have a conditional tariff-free quota established.
4

○ TPP negotiations took five and half years to reach an agreement in principle, producing a giant economic bloc covering more than 800 million people in the 12 participating countries. While the TPP is expected to bring about various benefits for livelihood and business operations in Japan, there also have been concerns over the TPP. Therefore, the government must provide careful explanations on details of the TPP agreement and take comprehensive measures for allowing agricultural, forestry and fisheries products to be maintained and for developing strong agriculture, forestry and fisheries into growth industries.
○ To this end, the TPP Task Force at its meeting in November 2015 decided the comprehensive TPP-related policy principles.
○ Funds are earmarked in the FY 2015 supplementary budget for measures required to be urgently implemented.
3 Decision on the comprehensive TPP-related policy principles
・ The economic partnership covers an economic bloc with an unprecedented size accounting for about 40% (3,100 trillion yen)of global GDP, producing a giant market with 800 million people. The TPP is a trump card for Abenomics.
・ These Policy Principles clarify goals of policies necessary to link the effects of the TPP to Japan’s economic and regionalrevitalization as well as policy to sweep away the concerns about the TPP’s impacts among Japanese people.
・ Major policies given in the principles, including existing ones, will be continuously checked and reviewed. Specific details ofstrategies to further develop agriculture, forestry and fisheries into growth industries, and policies to further promote overseasoperations, business expansion and productivity improvement for Japanese industries will be prepared by the autumn of 2016.
・ In conjunction with the principles, the government will try to provide the people with accurate, thorough explanations andinformation and will expend all possible means to sweep away insecurity and concerns about the TPP’s impacts.
New big exporter
<Promotion of the TPP’s utilization>1 Establishing a system to thoroughly
provide information and counseling○Raise awareness and proliferate
information about the TPP○ Establish a counseling system for second-
tier, medium and small-sized companies2 Supporting the development of new
markets and the building of global value chains○Drastically strengthen the mechanism to
provide comprehensive support to second-tier, medium- and small-sized companies to help them develop new markets (“New
big exporter” consortium)○Promote the export of contents, services,
technologies, etc.○Strategically promote the export of
agricultural, forestry and fisheries products, as well as foodstuffs
○Promote the export of infrastructure systems
○ Improve business environments in countries where Japanese companies operate
<Building a “robust economy” through the TPP >1 Measures to ensure that TPP-stimulated
expansion of trade and investment leads to a rejuvenated domestic economy○Ensure higher productivity through
innovation and collaborations between companies or industries
○ Promote foreign investment in Japan 2 Boosting the “earning power” of regions○Spread regional information○ Bring together and brand regional
resources
○Enhance a monitoring and guidance system for food imports, labelling of origin of ingredients
○Take measures required for patents, trademarks and copyrights
○Facilitate the utilization of copyrighted works
Global hub (International core base for trade and investment )
< Food safety, intellectual property>
New agriculture policy age
<Agriculture, forestry and fisheries>1 Develop agriculture, forestry and fisheries into proactive industries (via measures to sharpen competitiveness) ○ Nurture business persons with an excellent business sense
to shoulder the next generation○Promote innovation in internationally competitive
production areas○Promote a comprehensive project to enhance the
profitability of the livestock raising and dairy sector ○Explore demand frontiers for the export of high-
qualityagricultural, forestry and fisheries products ○Enhance the international competitiveness of plywood and
lumber○Switch to sustainable, highly profitable business
arrangements○Enhance cooperation with consumers, reform regulations
and the tax system
2 Make preparations to ensure stable business management and supply (five key products)○Rice (Review government-stockpiled rice)○Wheat (Steadily implement farming income stabilization
measures)○Beef/pork, dairy products (Stabilize and expand the
livestock raising and dairy sector)○Sweetening resources crops (Subject the crops to
adjustment money)
Source: TPP Task Force, Cabinet Secretariat
Comprehensive TPP-related policy principles
5

○ On December 24, 2015, the government released a macroeconomic impact analysis of TPP on Japan. The analysis includes the comprehensive economic efforts of tariff elimination, trade and investment promotion, cost reductions based on non-tariff-related measures, as well as the effect of increased productivity resulting from stimulated trade and investment.
4 Economic impact analysis
Source: TPP Task Force, Cabinet Secretariat
Economic Impact Analysis
GDP change: +2.59% (+13.6 trillion JPY)*Real GDP at 524.7 trillion JPY (FY2014)
Labor supply change: +1.25% (+795,000 workers)*Labor supply: 65.9 million*Number of employees: 63.6 million (FY2014)
Analysis results
While the price decline caused by tariff reduction/elimination will decrease, production andfarming family income will be continuously secured by domestic measures such as enhancementof competitiveness by both cost reduction and quality improvement and farm incomestabilization. As a rusult, domestic production will be maintained.
Agricultural, forestry and fisheries production value decline: about 130–210 billion yen
Impact on the food self-sufficiency rate (base year: FY2014): 39% in calories, 64% in production value ↓ Reflecting the assesment 39% in calories, 64% in production value
Assessment for agriculture, forestry and fisheries
6

The food self-sufficiency potential indicates Japan’s food production potential
Chapter 1 Efforts for Securing Stable Food Supply
Priority theme 1
Food self-sufficiency potential trends
The Basic Plan for Food, Agriculture and Rural Areas decided by the Cabinet in March 2015 came up with the food self-sufficiency potential indicator for the first time. Japan’s food self-sufficiency potential has been declining.
The food self-sufficiency potential indicates the food production potential of Japan’s agriculture, forestry and fisheries sectors. The components of the food self-sufficiency potential for agricultural production are farmlands, farming water and other agricultural resources, agricultural technologies, and people engaged in farming. The components of the food self-sufficiency potential for fisheries production are potential production volume and people engaged in fishery.
Stable food supply and food self-sufficiency potential
Source: MAFF
Concept of the “food self-sufficiency potential indicator”
The food self-sufficiency potential indicator shows the amount of calories that could be supplied through the maximum utilization of production potential in the Japanese agriculture, forestry and fisheries sectors. It is estimated under the premise that mainly rice and potatoes are cultivated on all farmland, including that on which flowers and other non-food farm products are cultivated. Additionally, the estimation is based on some hypothetical premises: (1) the time for crop conversion is not taken into account and (2) the labor force required for agricultural, forestry and fisheries production is ensured.
Source: MAFF
Concept of the “food self-sufficiency potential indicator”
(Premises for estimation)(1) The time for crop conversion is not taken into
account (2) The labor force required for agricultural,
forestry and fisheries production is ensured. (3) Production factors including fertilizers,
agricultural chemicals, fossil fuels, seeds, agricultural water and agricultural machines (excluding feed) are sufficiently secured for domestic agricultural, forestry and fisheries production. Agricultural irrigation facilities and other production infrastructure are adequately conserved, managed and developed, with their functions played sustainably.
Food self-sufficiency potential indicator
Potatoes
Rice/wheat/soybean
Farmland on which flowers and other non-food crops are currently cultivated
Dilapidated farmland (restorable portion)
Ful
l uti
liza
tion
of
farm
land
in
all
land
whe
re d
oubl
e cr
oppi
ng is
pos
sibl
e, e
tc.
Foo
d cr
ops
are
cult
ivat
edC
rops
are
cu
ltiv
ated
aga
in
7

While the food self-sufficiency ratio has stayed level, the food self-sufficiency potential has been on a decline in recent years, raising concerns about the future food supply in Japan.MAFF provides the food self-sufficiency potential indicator to contribute to discussions on food security with a view to promote policy measures securing stable food supply.
Food self-sufficiency potential indicator (FY2014) (estimate)
The food self-sufficiency indicator is estimated for four food production patterns. In the pattern where mainly potatoes are cultivated, the indicator exceeds the estimated required energy amount. In the more realistic pattern where mainly rice, wheat and soybeans are cultivated, the indicator slips far below the estimated required energy amount.
Food self-sufficiency potential indicator trends
Source: MAFF
Source: MAFF
The food self-sufficiency potential indicator has been declining
PatternA
Mainly rice, wheat and soybeans
Consideration given to the nutritional
balance
PatternB
Mainly rice, wheat and soybeans
Pattern D
Mainly potatoes
Pattern C
Mainly potatoes
Consideration given to the nutritional
balance
Actual value for calorie supply from domestic production
(the numerator for calculating the food self-sufficiency ratio,
on a supply basis)
0 1,000 2,000 3,000
947
1,428 50 1,478
1,803 50 1,853
2,361 95 2,456
1032,642 95 2,736
kcal per person per day
Estimated required energy per person
per day (2,146kcal)
Calorie supply per person per day (actual) (2,415kcal)
If cropping in dilapidated farmland that is restorable, as well as in present farmland
Pattern A
Pattern B
Pattern C
Pattern D
(Patterns for the food self-sufficiency potential indicator)
1,942
1,768 1,660
1,507
1,471 1,428
2,108 2,025 1,934
1,841
1,865 1,803
2,839 2,705 2,664
2,580
2,494 2,361
3,047 2,894
2,845 2,799
2,754 2,642
1,528 1,478
1,921 1,853
2,600
2,456
2,859
2,736
49
37
46
4140 40 39 41 40
39
35
40
45
50
55
60
65
70
75
80
1,000
1,200
1,400
1,600
1,800
2,000
2,200
2,400
2,600
2,800
3,000
H元 6 11 16 21 26
Pattern A
Pattern B
Pattern C
Pattern D
Agriculture products are cropped ondilapidated farmlands that are restorable,
as well as present farmlands
kcal per person per day
Total food self-sufficiency ratio on a calorie supply basis
FY1999 FY2004 FY2009 FY2014(estimate)
The food self-sufficiency ratio has stayed level for 18 years.
FY1989 FY1994
8

To realize the target of expanding agricultural, forestry and fisheries products and foods exports to 1 trillion yen in 2020, MAFF has drafted export strategies for each country and product. To steadily implement the strategies, product-by-product export organizations have been established under the Executive Committee for Export Promotion Strategy to promote the export of these products on an “all-Japan” basis. Product-by-product export expansion plans are prepared to annually check and update specific initiatives.
Based on discussions at the Executive Committee for Export Promotion Strategy, MAFF prioritizes and implements initiatives to resolve export challenges including import regulations involving radioactive materials, animal and plant quarantine talks and food safety regulations.
As exports have steadily increased, MAFF will promote initiatives to achieve the 1 trillion yen target ahead of schedule.
Promoting the export of agricultural, forestry and fisheries products and foods
Export promotion and overseas dissemination of Japanese food and food culture
Japan’s agricultural, forestry and fisheries products and food exports totaled 745.1 billion yen, posting a record high for the three consecutive years. At the Expo Milan 2015, the Japanese pavilion showed the attractiveness of Japanese food and food culture to many visitors to the pavilion. Registration under the Geographical Indication protection system has started to certify products utilizing regional characteristics.
Priority theme 2
Trends of agriculture, forestry and fisheries products and foods exports
Source: Prepared by MAFF, based on MOF, “Trade Statistics”
Source: Prepared by MAFF, based on MOF, “Trade Statistics”
(By country/region) (By product)
Breakdown of exports by country/region and product (2015)
2,168 2,359 2,678 2,883 2,637 2,865 2,652 2,680 3,136 3,569 4,431 92 90
104 118 93 106 123 118
152 211
263
1,748 2,040
2,378 2,077 1,724
1,950 1,736 1,698
2,216 2,337
2,757
4,008 4,490
5,160 5,078 4,454
4,920 4,511 4,497
5,505 6,117
7,451
0
1,000
2,000
3,000
4,000
5,000
6,000
7,000
8,000
2005 2006 2007 2008 2009 2010 2011 2012 2013 2014 2015
Agricultural products
Forestry products
Fisheries products
100 million yen
Hong Kong24.1%
Taiwan12.8%
China11.3%
South Korea6.7%
Thailand4.8%
U.S.14.4%
North America15.7%
EU5.4%
Europe6.3%
Asia73.5%
Others 4.6%
Singapore3.0%
Vietnam4.6%
Total at 745.1 billion yen (100%)
Processed foods29.8%
Agricultural products59.5%
Livestock products
6.3%Grains, etc.4.9%
Vegetables, fruits, etc.4.7%
Others13.7%
Total at 745.1
billion yen (100%)
Forestry products
3.5%
Fisheries products
(excluding preparations)
27.7%
Fisheries preparations
9.3%
Fisheries products37.0%
9
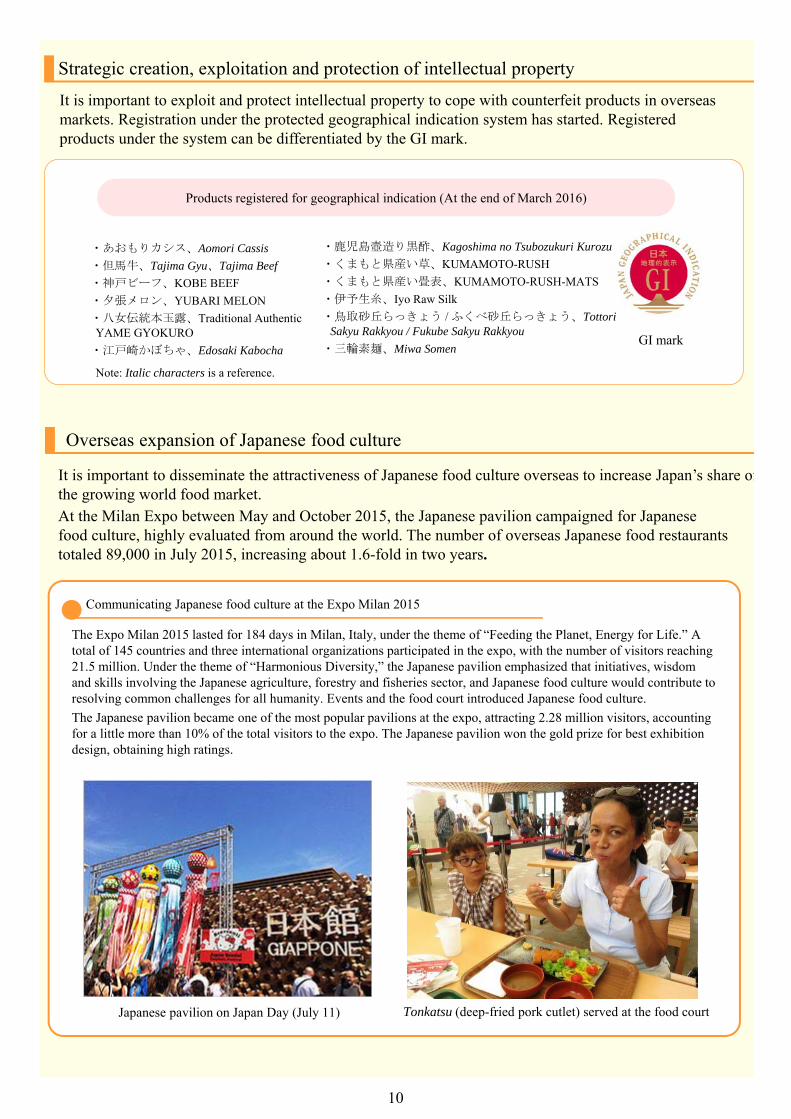
It is important to exploit and protect intellectual property to cope with counterfeit products in overseas markets. Registration under the protected geographical indication system has started. Registered products under the system can be differentiated by the GI mark.
It is important to disseminate the attractiveness of Japanese food culture overseas to increase Japan’s share ofthe growing world food market.
Communicating Japanese food culture at the Expo Milan 2015
Products registered for geographical indication (At the end of March 2016)
The Expo Milan 2015 lasted for 184 days in Milan, Italy, under the theme of “Feeding the Planet, Energy for Life.” A total of 145 countries and three international organizations participated in the expo, with the number of visitors reaching 21.5 million. Under the theme of “Harmonious Diversity,” the Japanese pavilion emphasized that initiatives, wisdom and skills involving the Japanese agriculture, forestry and fisheries sector, and Japanese food culture would contribute to resolving common challenges for all humanity. Events and the food court introduced Japanese food culture.
The Japanese pavilion became one of the most popular pavilions at the expo, attracting 2.28 million visitors, accounting for a little more than 10% of the total visitors to the expo. The Japanese pavilion won the gold prize for best exhibition design, obtaining high ratings.
Overseas expansion of Japanese food culture
GI mark
Japanese pavilion on Japan Day (July 11)
・鹿児島壺造り黒酢、Kagoshima no Tsubozukuri Kurozu
・くまもと県産い草、KUMAMOTO-RUSH
・くまもと県産い畳表、KUMAMOTO-RUSH-MATS
・伊予生糸、Iyo Raw Silk
・鳥取砂丘らっきょう / ふくべ砂丘らっきょう、Tottori Sakyu Rakkyou / Fukube Sakyu Rakkyou
・三輪素麺、Miwa Somen
・あおもりカシス、Aomori Cassis
・但馬牛、Tajima Gyu、Tajima Beef
・神戸ビーフ、KOBE BEEF
・夕張メロン、YUBARI MELON
・八女伝統本玉露、Traditional Authentic YAME GYOKURO
・江戸崎かぼちゃ、Edosaki Kabocha
Tonkatsu (deep-fried pork cutlet) served at the food court
Strategic creation, exploitation and protection of intellectual property
At the Milan Expo between May and October 2015, the Japanese pavilion campaigned for Japanese food culture, highly evaluated from around the world. The number of overseas Japanese food restaurants totaled 89,000 in July 2015, increasing about 1.6-fold in two years.
Note: Italic characters is a reference.
10

23.3
24.7
24.6
0
20
40
60
80
100
8101214161820222426
1970/71 CY 1985/86 2000/01 2015/16
%
ProductionConsumption
Ending stock ratio (right scale)
0
100 million tons
(Unit: %)
FY2013 FY2014FY2025Target
Food self-sufficiency ratio ona calorie supply basis
39 39 45
Food self-sufficiency ratio ona production value basis
65 64 73
Feed self-sufficiency ratio 26 27 40
○ Global grain production in the 2015-16 CY is expected to decline by 40 million tons or 1.4% from the previous year to 2.47 billion tons due to falls in corn and rice output. Meanwhile, consumption is projected to level off at 2.46 billion tons.
○ Global grain and soybean production and consumption are projected to increase in the future. Particularly, Asian soybean consumption is expected to expand, while production in North America and Latin America for soybean supply to Asia is predicted to grow.
2 Global food supply and demand, and efforts for establishing food security
(1) Global food supply/demand trends
Grain production, consumption, ending stock ratio
Source: Prepared by MAFF based on U.S. Department of Agriculture, “PS&D,” “World Agricultural Supply and Demand Estimates” (as of March 2016)
Source: Policy Research Institute, MAFF “Global Food Supply/Demand Outlook for 2024 -- Projection with Global Food Supply/Demand Model”
Global soybean production and consumption trends and outlook
1 Objectives and present situation of Basic Plan for Food, Agriculture and Rural Areas
○ In March 2015, the government decided the Basic Plan for Food, Agriculture and Rural Areas as a guideline for promoting agriculture and rural area policy reforms and national initiatives. The plan set the food self-sufficiency ratio target of 45% on a calorie supply basis and 75% on a production value basis for FY2025.
○ The overall food self-sufficiency ratio on a calorie supply basis in FY2014 remained unchanged from 39% in the previous year. While domestic wheat and soybean output increased, demand for rice, the domestic production of which can fully meet demand, declined after a last-minute rise just before a consumption tax increase, leading rice’s share of total calorie supply to drop.
○ The overall food self-sufficiency ratio on a production value basis in FY2014 dropped by one percentage point to 64% as a decline in prices of domestically produced rice was coupled with a rise in seafood import costs under the yen’s depreciation.
Food self-sufficiency ratio targets
Source: MAFF
78
70
22
2
90
140
26
6
115
182
31
7
0100200
North America
Latin America
Asia
Europe
million tons(Production)
1999-2001
20242011-13
51
52
46
19
50
87
103
18
75
101
130
26
0 100 200(Consumption)
11

Imports in value at 206.2
billion yen
Others2.2%
U.S.68.9%
Canada16.0%
Brazil13.0%
Imports in value at 200.0
billion yenU.S.
50.8%Canada29.9%
Australia16.1%
Others3.2%
Imports in value at 391.6
billion yen
U.S.80.7%
Ukraine2.5%
Brazil15.2%
Others1.6%
Source: FAO, IFAD, WFP, “The State of Food Insecurity in the World 2015” (published September 2015)
Number of people undernourished in developing regions
○ The share of undernourished people in the population (the prevalence of undernourishment) in developing regions, though falling, still stands at about 13% (780 million people). To help accomplish goals and targets (including ending hunger by 2030) in the 2030 Agenda for Sustainable Development as adopted by the United Nations in September 2015, Japan is promoting private sector investment and economic cooperation.
○ In preparation for unforeseeable events including food import disruptions, the government regularly analyzes and assesses the impacts of risks involving a stable food supply. Based on the results of such analysis and assessment, the government considers and implements measures to mitigate the impacts. It also promotes the development of specific procedures for responding to unforeseeable events and shares them with relevant parties.
○ A breakdown of Japan’s major farm products imports in value by country indicates that the top three exporters account for more than 90% of the total for each product. Japan thus depends heavily on a limited number of specific countries for farm imports.
(2) Efforts for establishing food security
Breakdown of Japan’s major farm products imports in value by country (2015)
Source: Prepared by MAFF, based on MOF, “Trade Statistics”
(Corn) (Wheat) (Soybeans)
9.9 9.1 9.3 8.1 7.8
23.3
18.2 17.3
14.112.9
0
5
10
15
20
25
0
5
10
15
1990-92 2000-02 2005-07 2010-12 2014-16
%100 millions Prevalence of undernourishment (right axis)
Number of people undernourished
12

Imports[1.3 trillion yen]
Domestic production9.2 trillion
yen
Agricultural, forestry and fisheries food products
10.5 trillion yen
Final food and drink consumption
76.3 trillion yen
Eating-out25.1 trillion yen
Fresh food products, etc.
12.5 trillion yen
Processed foods
38.7 trillion yen
Food manufacturing
industry33.4 trillion yen
For final consumption
2.9 trillion yen [0.3 trillion yen]
For food manufacturing
industry5.5 trillion yen [0.9 trillion yen]
For eating and drinking
services0.8 trillion yen [0.1 trillion yen]
Imported processed food[5.9 trillion yen]
Food
who
lesa
lers
Food
ret
aile
rs
Eating and drinking services
25.1 trillion yen
Who
lesa
le m
arke
t
Off-market0
500
1,000
1,500
2,000
2,500
3,000
FY1995 FY2000 FY2005 FY2010 FY2014(Estimates)
Rice
kcal
Livestock products
Fatty oils
WheatPotatoes/starch
SugarSeafoodOthers
2,6542,415
2,643 2,5732,447
24 23
5143
3534
0
20
40
60Fresh food1,000 yen Processed
food Eating-out(No. of household members)
(3.59)(3.03)
1994 2014 1994 1994
Multi-member households
Single-member households
(male)
Single-member households
(female)
2014 2014
1,1241,678 1,827 1,846
4,390
5,184 5,305 4,956
0
1,000
2,000
3,000
4,000
5,000
6,000
1995 2010 2020 2035
Single-member households
Couple-only households
Couple-and-child households
Single-parent-and-child households
Other households
(10,000 housholds) Results Estimates
(1) Food consumption trends
○ In 2011, domestic food supply included 10.5 trillion yen in agricultural, forestry and fisheries food products (9.2 trillion yen in domestic production and 1.3 trillion yen in imports) and 5.9 trillion yen in processed food imports. Final food and drink consumption totaled 76.3 trillion yen, continuing a downward trend after peaking in 1995.
○ Japan’s daily per capita calorie supply has followed a downward trend. While livestock products, fatty oils, wheat and potato/starch supply has remained almost unchanged, mainly rice and seafood supply has declined.
Flow of Japan’s agricultural, forestry and fisheries products production, distribution, processing and consumption (2011)
3 Food consumption trends and promotion of Shokuiku (food and nutrition education)
○ The number of households has recently increased, with the rise centering on single-member households. While the total number of households is expected to peak in 2020, single-member households are projected to increase.
○Of per capita food spending, processed food spending for both men and women for single-member households is greater than for multi-member households. As single-member households increases, processed food spending is expected to expand.
Trends of monthly per capita food spending by household type
Source: Prepared by MAFF, based on MIC, “National Survey of Family Income and Expenditure” and “Consumer Price Index”
Trends of households by household type
Daily per capita calorie supply trends
Source: MAFF, “Food Balance Sheet”Source: MAFF, “2011 Input-Output Tables for Agriculture,
Forestry and Fisheries, and Related Industries”Note: Import figures in parentheses
Sources: MIC, “Population Census”; National Institute of Population and Social Security Research, “Household Projections for Japan (nationwide estimates) (January 2013)”
13