Embed Size (px)
Citation preview

FY2014 Consolidated Results & FY2015 Forecast
Convenience
Safety Security
May 13, 2015
www.sanwa-hldgs.co.jp
- 1 -
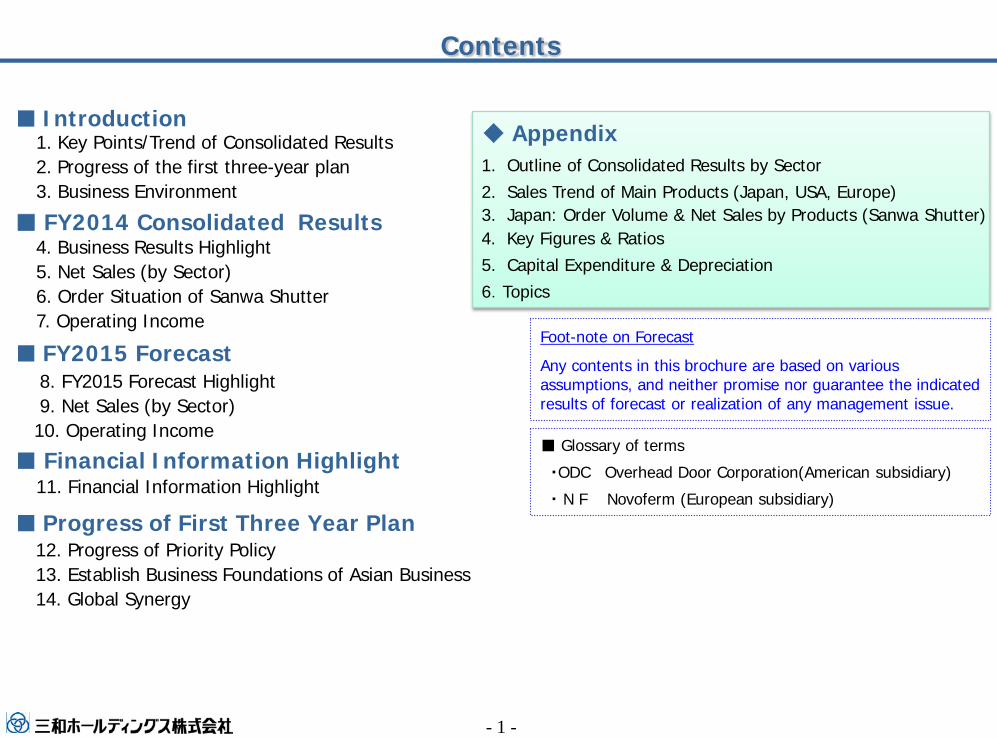
■ Introduction
■ FY2014 Consolidated Results
■ FY2015 Forecast
■ Progress of First Three Year Plan
■ Financial Information Highlight
12. Progress of Priority Policy 13. Establish Business Foundations of Asian Business14. Global Synergy
11. Financial Information Highlight
1. Key Points/Trend of Consolidated Results2. Progress of the first three-year plan3. Business Environment
4. Business Results Highlight5. Net Sales (by Sector)6. Order Situation of Sanwa Shutter 7. Operating Income
8. FY2015 Forecast Highlight9. Net Sales (by Sector)10. Operating Income
Contents
◆ Appendix
Foot-note on Forecast
Any contents in this brochure are based on various assumptions, and neither promise nor guarantee the indicated results of forecast or realization of any management issue.
■ Glossary of terms
・ODC Overhead Door Corporation(American subsidiary)
・ N F Novoferm (European subsidiary)
1. Outline of Consolidated Results by Sector 2. Sales Trend of Main Products (Japan, USA, Europe)3. Japan: Order Volume & Net Sales by Products (Sanwa Shutter) 4. Key Figures & Ratios5. Capital Expenditure & Depreciation 6.Topics
-5,000
0
5,000
10,000
15,000
20,000
25,000
30,000
35,000
40,000
0
50,000
100,000
150,000
200,000
250,000
300,000
350,000
400,000
FY05 FY06 FY07 FY08 FY09 FY10 FY11 FY12 FY13 FY14 FY15(F)
Net SalesMillions of Yen
- 2 -
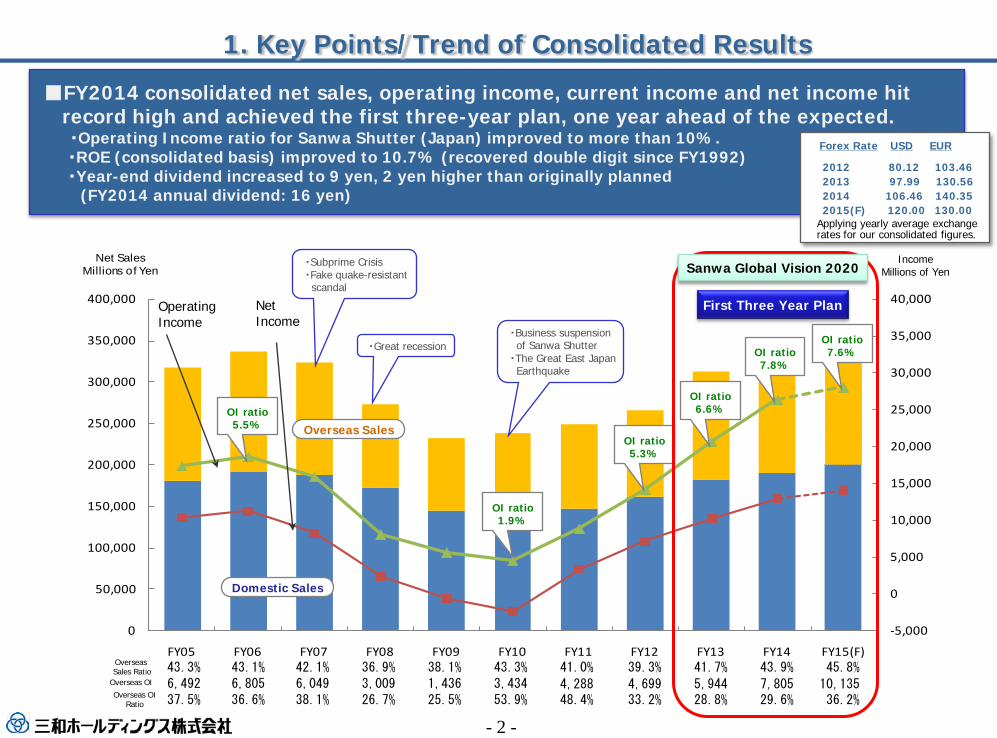
■FY2014 consolidated net sales, operating income, current income and net income hit record high and achieved the first three-year plan, one year ahead of the expected.・Operating Income ratio for Sanwa Shutter (Japan) improved to more than 10%.・ROE (consolidated basis) improved to 10.7% (recovered double digit since FY1992)・Year-end dividend increased to 9 yen, 2 yen higher than originally planned
(FY2014 annual dividend: 16 yen)
43.3% 43.1% 42.1% 36.9% 38.1% 43.3% 41.0% 39.3% 41.7% 43.9% 45.8%6,492 6,805 6,049 3,009 1,436 3,434 4,288 4,699 5,944 7,805 10,13537.5% 36.6% 38.1% 26.7% 25.5% 53.9% 48.4% 33.2% 28.8% 29.6% 36.2%
1. Key Points/Trend of Consolidated Results
Forex Rate USD EUR
2012 80.12 103.46 2013 97.99 130.56 2014 106.46 140.35 2015(F) 120.00 130.00
Applying yearly average exchange rates for our consolidated figures.
Overseas Sales Ratio
Overseas OI
Overseas OIRatio
First Three Year PlanOperatingIncome
NetIncome
・Subprime Crisis・Fake quake-resistant scandal
・Great recession・Business suspensionof Sanwa Shutter
・The Great East JapanEarthquake
OI ratio5.5% Overseas Sales
OI ratio5.3%
Domestic Sales
OI ratio6.6%
OI ratio7.8%
OI ratio7.6%
IncomeMillions of YenSanwa Global Vision 2020
OI ratio1.9%
- 3 -
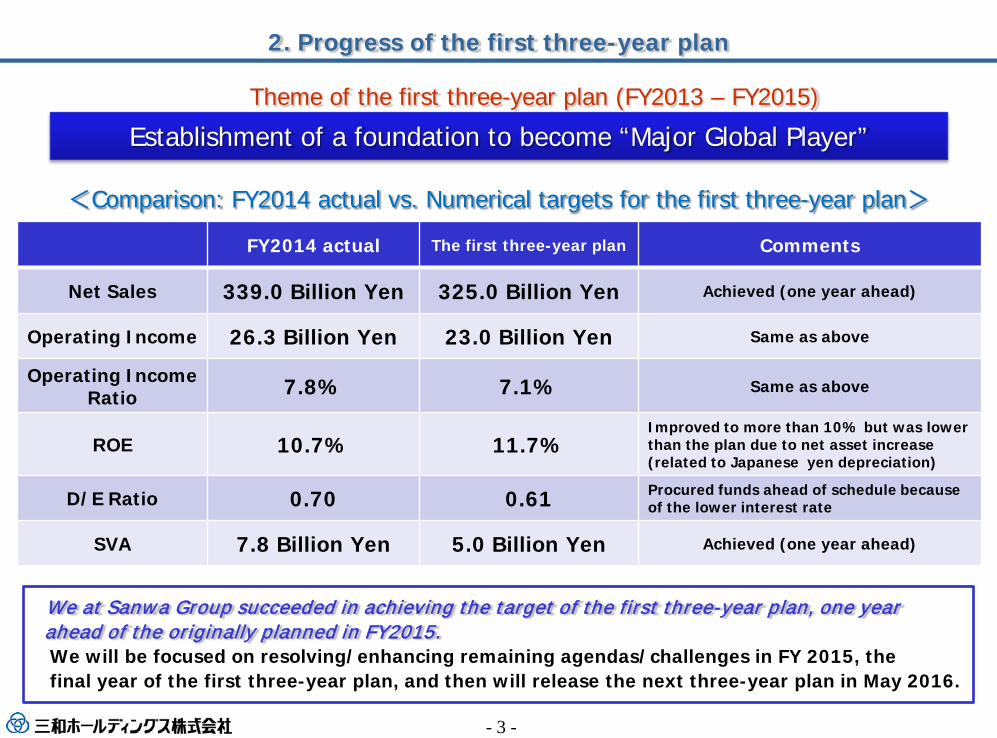
2. Progress of the first three-year plan
Establishment of a foundation to become “Major Global Player”Theme of the first three-year plan (FY2013 – FY2015)
<Comparison: FY2014 actual vs. Numerical targets for the first three-year plan>
FY2014 actual The first three-year plan Comments
Net Sales 339.0 Billion Yen 325.0 Billion Yen Achieved (one year ahead)
Operating Income 26.3 Billion Yen 23.0 Billion Yen Same as above
Operating Income Ratio 7.8% 7.1% Same as above
ROE 10.7% 11.7%Improved to more than 10% but was lower than the plan due to net asset increase (related to Japanese yen depreciation)
D/E Ratio 0.70 0.61 Procured funds ahead of schedule because of the lower interest rate
SVA 7.8 Billion Yen 5.0 Billion Yen Achieved (one year ahead)
We at Sanwa Group succeeded in achieving the target of the first three-year plan, one year ahead of the originally planned in FY2015.We will be focused on resolving/enhancing remaining agendas/challenges in FY 2015, thefinal year of the first three-year plan, and then will release the next three-year plan in May 2016.
- 4 -
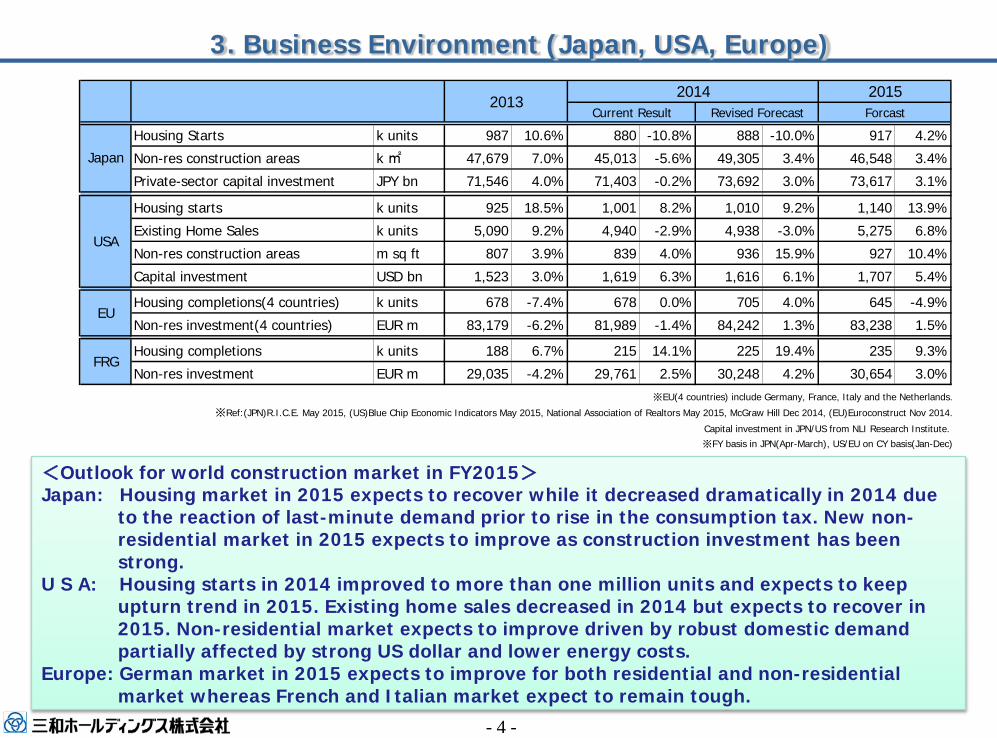
<Outlook for world construction market in FY2015>Japan: Housing market in 2015 expects to recover while it decreased dramatically in 2014 due
to the reaction of last-minute demand prior to rise in the consumption tax. New non-residential market in 2015 expects to improve as construction investment has been strong.
U S A: Housing starts in 2014 improved to more than one million units and expects to keep upturn trend in 2015. Existing home sales decreased in 2014 but expects to recover in 2015. Non-residential market expects to improve driven by robust domestic demand partially affected by strong US dollar and lower energy costs.
Europe: German market in 2015 expects to improve for both residential and non-residential market whereas French and Italian market expect to remain tough.
※EU(4 countries) include Germany, France, Italy and the Netherlands.
※Ref:(JPN)R.I.C.E. May 2015, (US)Blue Chip Economic Indicators May 2015, National Association of Realtors May 2015, McGraw Hill Dec 2014, (EU)Euroconstruct Nov 2014.
Capital investment in JPN/US from NLI Research Institute. ※FY basis in JPN(Apr-March), US/EU on CY basis(Jan-Dec)
3. Business Environment (Japan, USA, Europe)
Housing Starts k units 987 10.6% 880 -10.8% 888 -10.0% 917 4.2%
Non-res construction areas k ㎡ 47,679 7.0% 45,013 -5.6% 49,305 3.4% 46,548 3.4%
Private-sector capital investment JPY bn 71,546 4.0% 71,403 -0.2% 73,692 3.0% 73,617 3.1%
Housing starts k units 925 18.5% 1,001 8.2% 1,010 9.2% 1,140 13.9%
Existing Home Sales k units 5,090 9.2% 4,940 -2.9% 4,938 -3.0% 5,275 6.8%
Non-res construction areas m sq ft 807 3.9% 839 4.0% 936 15.9% 927 10.4%
Capital investment USD bn 1,523 3.0% 1,619 6.3% 1,616 6.1% 1,707 5.4%
Housing completions(4 countries) k units 678 -7.4% 678 0.0% 705 4.0% 645 -4.9%
Non-res investment(4 countries) EUR m 83,179 -6.2% 81,989 -1.4% 84,242 1.3% 83,238 1.5%
Housing completions k units 188 6.7% 215 14.1% 225 19.4% 235 9.3%
Non-res investment EUR m 29,035 -4.2% 29,761 2.5% 30,248 4.2% 30,654 3.0%
2014 2015Current Result Revised Forecast Forcast
Japan
USA
EU
FRG
2013

■ FY2014 Consolidated ResultsApril,2014-March,2015

- 6 -
〈 Summary 〉 Net sales and profits hit all time high record thanks to strong Japanese business, Alpha acquisition as well as Japanese yen depreciation.
Net Sales
Consolidated net sales increased by 8.7% or 27.1 billion yen vs. LY (If using 2013 exchange rate, it would have increased by 15.8 billion yen vs. LY).Japan: Increased by 5.0% or 9.4 billion yen vs. LY. Net sales for Sanwa Shutter increased vs. LY and forecast by 8.9 billion yen and 2.0 billion yen, respectively.Net sales for other Japanese companies (total) increased by 0.5 billion yen vs. LY but unfavorable to forecast by 0.26 billion yen.USA (ODC): (US dollar basis) Increased by 3.9% or $35 million vs. LY but unfavorable to forecast by $1.7 million.Europe (NF): (Euro basis) Increased by 8.5% or 28 million euro vs. LY as well as by 1.2 million euro vs. forecast. Alpha acquisition effect: +36.1 million euro.
OperatingIncome
Consolidated operating income greatly increased by 27.5% or 5.68 billion yen vs. LY (if using 2013 exchange rate, it would have increased by 5.08 billion yen vs. LY).Japan: Increased by 29.8% or 4.41 billion yen vs. LY. Operating income for Sanwa Shutter increased significantly by 30.0% or 4.05 billion yen vs. LY as well as 2.02 billion yen higher than the forecast. Operating income for other Japanese companies (total) increased by 27.1% or 0.36 billion yen vs. LY as well as 0.1 billion yen higher than the forecast.USA (ODC): (US dollar basis) Increased significantly by 19.1% or $9.5 million vs. LY driven by price adjustment realization and cost reduction effect but was unfavorable to the forecast by $0.8 million.Europe (NF): (Euro basis) Increased significantly by 30.0% or 2.5 million euro vs. LY and 0.7 million yen higher than the forecast. Alpha acquisition effect: 3.5 million euro.
CurrentIncome
Consolidated current income increased significantly by 27.9% or 5.66 billion yen vs. LY. Consolidated non-operating loss of 0.36 billion yen was nearly flat vs. LY - Profit on Asian equity method affiliate companies was down by 0.43 billion vs. LY partially offset by financial income improvement.
Net Income Consolidated net income increased substantially by 26.5% or 2.7 billion yen vs. LY One-time loss increased by 0.47 billion yen vs. LY due mainly to impairment loss on fixed asset (land, 2.99 billion yen). FX 2012 2013 2014 2015(F)
1USD 80.12 97.99 106.46 120.001EUR 103.46 130.56 140.35 130.00
4. Business Results Highlight
《Key points of FY2014 Result》
FY2014 Results
Consolidated Results
¥339.0Bln¥146.4Bln¥192.6Bln ¥332.53Bln ¥+6.5Bln ¥312.0Bln ¥+27.1Bln +8.7%[¥327.7Bln] [+2.0%] [¥+15.8Bln] [+5.1%]
¥26.33Bln ¥7.14Bln¥19.19Bln ¥23.50Bln ¥+2.83Bln ¥20.65Bln ¥+5.68Bln +27.5%[¥25.73Bln] [12.0%] [¥+5.08Bln] [+24.5%]
¥25.98Bln ¥6.83Bln¥19.15Bln ¥23.00Bln ¥+2.98Bln ¥20.32Bln ¥+5.66Bln +27.9%[¥25.39Bln] (+13.0%) [¥+5.07Bln] [+25.0%]
¥12.86Bln ¥3.29Bln ¥9.57Bln ¥11.50Bln ¥+1.36Bln ¥10.16Bln ¥+2.70Bln +26.5%[¥12.51Bln] [+11.8%] [¥+2.35] [+23.1%]
Note; [ ] assumed forex rate same as FY13
Net Income
yoy (amt) (%)Forecastas of 2Q
Varianceto 2QF
Result oflast yearFY Result 1H 2H
Net Sales
OperatingIncome CurrentIncome

-6.6 -7.2 -8.0
142.3160.5 169.4
25.828.6 29.1
69.4
87.298.535.0
42.950.0
2012年度 2013年度 2014年度
(+16.7%)
(+12.9%)
(+1.8%)
(+8.7%)
(+5.5%)
Total 339.0
Total 265.9
Total 312.0
328
890
339
867
356 EURm (+8.5%)
(+3.9%)925 USDm
FX in last year327.7Bln (+5.1% )
FY2012Result
FY2013Result
FY2014Result
- 7 -
<Novoferm (Europe)>(vs. FY2013) Increased by 8.5% in local currency(refer to page 30)① Garage door decreased by 5.9% due to sluggish market conditions,
especially in France.② Hinge Door increased slightly by 0.8% driven mainly by winning large
construction project orders.③ Industrial door increased significantly by 41.9% thanks to the Alpha
acquisition effect.
<Overhead Door Corporation (USA)>(vs. FY2013) Increased by 3.9% in local currency (refer to page 29)① Doors increased by 2.9%. Sales for both garage doors and commercial
doors increased vs. LY.② Operators increased by 6.4%. All sales channel increased vs. LY.③ Automatic doors decreased by 4.9% due to new ERP implementation
troubles.④ Truck doors increased significantly by 29.5% thanks to an increase in
order volume from big customers.
<Japanese subsidiaries>(vs. FY2013) Increased by 1.8% ① Sales for all subsidiaries, except Showa Front, increased. Showa Front
sales was down by 3.0% due to a decrease in store construction projects. ② Okinawa Sanwa increased significantly by 12.4% thanks to healthy
construction investment activities in Okinawa market.③ Sanwa Tajima increased by 6.2% driven by realization of stainless steel
sales cooperation with Japanese group companies.
<Sanwa Shutter>(vs. FY2013) Increased by 5.5% (refer to page 28)① Light-duty shutters decreased by 3.2% affected by the reaction of the last
minute demand related to consumption tax hike.② Heavy-duty shutters increased by 3.1% driven by realization of price
adjustment in spite of decreased volume in 2H 2014.③ Commercial building/Condominium doors increased by 7.5% driven by
favorable market condition such as office buildings, health care facilities etc.
④ Maintenance service increased by 3.1% driven by enhancing sales activities for building owners.
⑤ Partitions increased significantly by 19.1% driven mainly by product line expansion such as toilet booths and steel partitions.
5. Net Sales (by Sector)
Net Sales JPYbln・USDm・EURm(ratio of yoy)
NF(EU)
ODC(USA)
Japanese Subsidiaries
Sanwa Shutter
Elimination & Others
※Sanwa Shutter: non-consolidated basis(Elimination & Others include Sanwa Holdings)
FX 2012 2013 2014 2015(F)1USD 80.12 97.99 106.46 120.001EUR 103.46 130.56 140.35 130.00
FY2014 Results
80
90
100
110
120
130
140
150
160
170
8,000
9,000
10,000
11,000
12,000
13,000
14,000
15,000
16,000
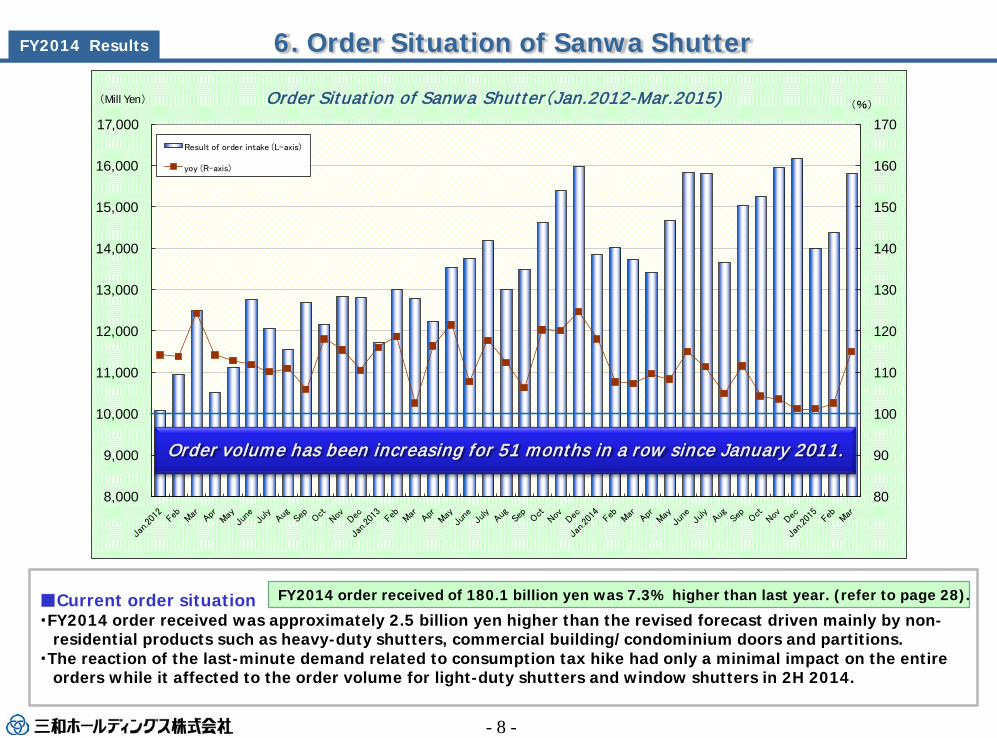
17,000(%)(Mill Yen) Order Situation of Sanwa Shutter(Jan.2012-Mar.2015)
Result of order intake (L-axis)
yoy (R-axis)
- 8 -
■Current order situation・FY2014 order received was approximately 2.5 billion yen higher than the revised forecast driven mainly by non-
residential products such as heavy-duty shutters, commercial building/condominium doors and partitions. ・The reaction of the last-minute demand related to consumption tax hike had only a minimal impact on the entire
orders while it affected to the order volume for light-duty shutters and window shutters in 2H 2014.
FY2014 order received of 180.1 billion yen was 7.3% higher than last year. (refer to page 28).
Order volume has been increasing for 51 months in a row since January 2011.
6. Order Situation of Sanwa Shutter FY2014 Results

- 9 -
■ Comparison vs. 2013: COGs ratio on consolidated basis improved by 0.9%- Sanwa Shutter improved driven mainly by volume increase and decrease in unprofitable projects. - Overhead Door Corporation improved driven by the realization of price adjustment.- Novoferm improved thanks to the Alpha acquisition effect and cost reduction effect despite volume
decreased and sales price dropped due to severe competition - Consolidated operating income increased by 5.68 billion yen driven by gross margin improvement (7.86 billion yen) and currency rate effect partially offset by SG&A costs increase centered on personnel costs for all division (2.78 billion yen total).
yoy(amt)¥ +5.68 Bln
Variance to OFthe 2Q forecast
¥+2.83 Bln
JPYbn< >shows the 2Q forecast
7. Operating Income(Consolidated)
Sanwa Group(consolidated)
FY2014 Results
FY2013 FY2014
20.65
5.81
3.07 -1.47
-0.13
-1.70
26.330.61
<4.08><-1.71>
<-1.34><2.61>
<-0.71><23.5><0.35>-0.49
<-0.43>
SalesVolumeIncrease
MaterialPriceIncrease
SalesPriceIncrease
CostIncrease
ForeignExchangeEffects
OthersGoodwill

- 10 -
Sanwa ShutterJPYbn
< >shows the 2Q forecastJPYbn
< >shows the 2Q forecast
JPYbn< >shows the 2Q forecast
JPYbn< >shows the 2Q forecast
JapaneseSubsidiaries
Forex Rate(USD)2014 JPY 106.462015 JPY 120.00
NovofermODC
Forex Rate(EURO)2014 JPY 140.352015 JPY 130.00
7. Opening Income (by Sector)
0.18
FY2013 FY2014
1.32
0.31 -0.06-0.17 1.680.1<-0.17><0.14><0.26> <-0.11> <1.59><0.15>
SalesVolumeIncrease
MaterialPriceIncrease
SalesPriceIncrease
CostIncrease
Others
FY2014 Results
■ FY2015 Consolidated Forecast
April,2015-March,2016
- 12 -
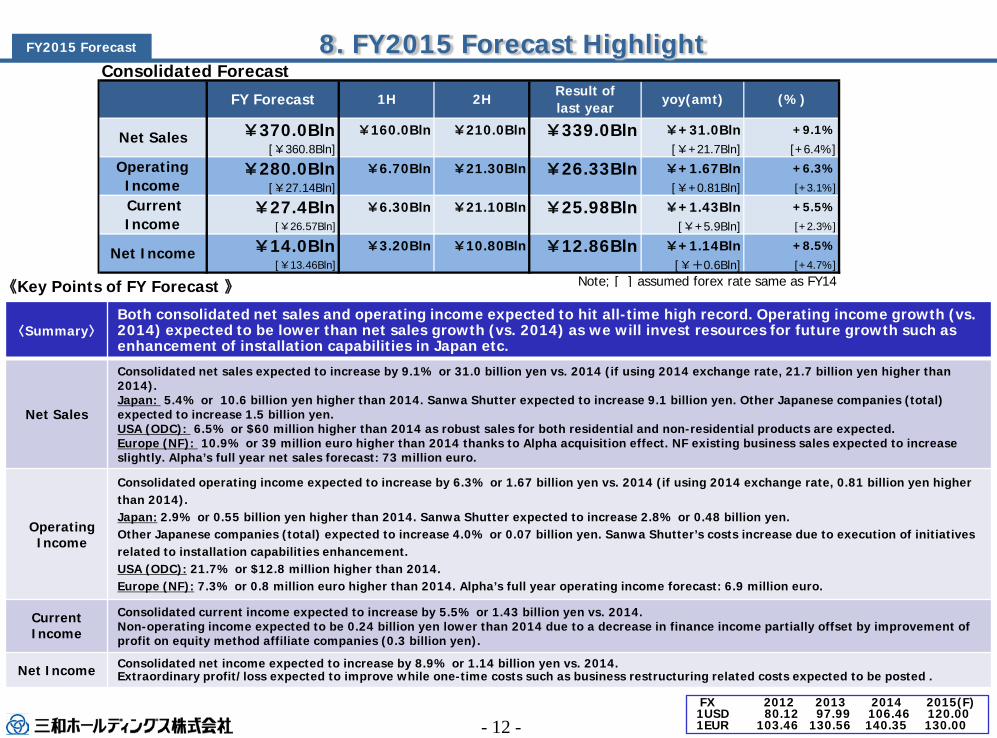
〈Summary〉Both consolidated net sales and operating income expected to hit all-time high record. Operating income growth (vs. 2014) expected to be lower than net sales growth (vs. 2014) as we will invest resources for future growth such as enhancement of installation capabilities in Japan etc.
Net Sales
Consolidated net sales expected to increase by 9.1% or 31.0 billion yen vs. 2014 (if using 2014 exchange rate, 21.7 billion yen higher than 2014).Japan: 5.4% or 10.6 billion yen higher than 2014. Sanwa Shutter expected to increase 9.1 billion yen. Other Japanese companies (total)expected to increase 1.5 billion yen.USA (ODC): 6.5% or $60 million higher than 2014 as robust sales for both residential and non-residential products are expected.Europe (NF): 10.9% or 39 million euro higher than 2014 thanks to Alpha acquisition effect. NF existing business sales expected to increaseslightly. Alpha’s full year net sales forecast: 73 million euro.
OperatingIncome
Consolidated operating income expected to increase by 6.3% or 1.67 billion yen vs. 2014 (if using 2014 exchange rate, 0.81 billion yen higher than 2014).Japan: 2.9% or 0.55 billion yen higher than 2014. Sanwa Shutter expected to increase 2.8% or 0.48 billion yen. Other Japanese companies (total) expected to increase 4.0% or 0.07 billion yen. Sanwa Shutter’s costs increase due to execution of initiatives related to installation capabilities enhancement.USA (ODC): 21.7% or $12.8 million higher than 2014.Europe (NF): 7.3% or 0.8 million euro higher than 2014. Alpha’s full year operating income forecast: 6.9 million euro.
CurrentIncome
Consolidated current income expected to increase by 5.5% or 1.43 billion yen vs. 2014. Non-operating income expected to be 0.24 billion yen lower than 2014 due to a decrease in finance income partially offset by improvement of profit on equity method affiliate companies (0.3 billion yen).
Net Income Consolidated net income expected to increase by 8.9% or 1.14 billion yen vs. 2014.Extraordinary profit/loss expected to improve while one-time costs such as business restructuring related costs expected to be posted .
8. FY2015 Forecast Highlight
《Key Points of FY Forecast 》
FX 2012 2013 2014 2015(F)1USD 80.12 97.99 106.46 120.001EUR 103.46 130.56 140.35 130.00
FY2015 Forecast
Consolidated Forecast
¥370.0Bln ¥160.0Bln ¥210.0Bln ¥339.0Bln ¥+31.0Bln +9.1%
[¥360.8Bln] [¥+21.7Bln] [+6.4%]
¥280.0Bln ¥6.70Bln ¥21.30Bln ¥26.33Bln ¥+1.67Bln +6.3%
[¥27.14Bln] [¥+0.81Bln] [+3.1%]
¥27.4Bln ¥6.30Bln ¥21.10Bln ¥25.98Bln ¥+1.43Bln +5.5%[¥26.57Bln] [¥+5.9Bln] [+2.3%]
¥14.0Bln ¥3.20Bln ¥10.80Bln ¥12.86Bln ¥+1.14Bln +8.5%[¥13.46Bln] [¥+0.6Bln] [+4.7%]
Note; [ ] assumed forex rate same as FY14
yoy(amt)1H
Net Sales
OperatingIncome CurrentIncome
Net Income
(%)Result oflast yearFY Forecast 2H

-7.2 -8.0 -8.8
160.5169.4 178.5
28.6 29.130.7
87.298.5
118.2
42.9
50.0
51.4
2013年度 2014年度 2015年度
(+2.7%)
(+20.0%)
(+5.3%)
(+5.4%)
Total 370.0
Total 312.0
Total 339.0
356
925
328
890
395 EURm (+10.9%)
(+6.5%)985 USDm
(+9.1%)
FX in last year360.8Bln (+6.4% )
FY2013Result
FY2014Result
FY2015Forecast
- 13 -
<Novoferm (Europe)>10.9% higher than 2014 in a local currency (refer to page 30)①Garage door sales to decrease by 1.8% due to sluggish market condition②Hinge door sales to increase by 2.7% driven by enhancing sales activities
for ensuring big construction projects including introduction of newproducts
③Industrial door sales to increase significantly by 32.4% thanks to Alpha acquisition effect
<Overhead Door Corporation (USA)>6.5% higher than 2014 in a local currency (refer to page 29)①Door sales to increase by 5.2% driven by strong sales of both residential
products and non-residential products.②Operator sales expected to increase by 5.5% driven by healthy sales at
each sales channel③Automatic door sales to increase significantly by 26.9% due to the
absence of delay in shipment arisen from new ERP implementation troubles in 2014 as well as some acquisition effect expected to be realized.
④Truck door sales to decrease by 4.6% due to the absence of big orders from large customers.
<Japanese subsidiaries>5.3% higher than 2014①Showa Front sales to increase by 7.0% driven by recovery of store
construction activities.②Okinawa Sanwa sales to increase by 6.0% thanks to continued favorable
market condition③Sanwa Tajima sales to increase by 1.8% driven by increase in commercial
building projects
<Sanwa Shutter>5.4% higher than 2014 (refer to page 28)①Light-duty shutter sales to increase slightly by 0.5%②Heavy-duty shutter sales to increase significantly by 10.6% thanks
to the substantial backlog of orders including warehouses,distribution centers, big retail stores etc.
③Commercial building/Condominium doors sales to increase by 2.1% thanks to the healthy backlog of orders including office buildings, manufacturing facilities etc.
④Maintenance service sales to increase by 5.1% driven by enhancing sales activities for building owners.
⑤Partition sales to increase by 9.2% driven by improvement of multi-product sales activities.
9. Net Sales (by Sector)
Net Sales JPYbln・USDm・EURm(ratio of yoy)
NF(EU)
ODC(USA)
Japanese Subsidiaries
Sanwa Shutter
Elimination & Others
※Sanwa Shutter: non-consolidated basis(Elimination & Others include Sanwa Holdings)
FX 2012 2013 2014 2015(F)1USD 80.12 97.99 106.46 120.001EUR 103.46 130.56 140.35 130.00
FY2015 Forecast

FY2014 FY2015(F)
26.33
3.34
3.73 -0.18
-3.06
28.0
0.86 -0.53-2.49
SalesVolumeIncrease
MaterialPriceIncrease
SalesPriceIncrease
CostIncrease
ForeignExchangeEffects
Others
Goodwill
- 14 -
■ Comparison vs. 20141. Japanese business expects to increase costs due to increase in Sanwa Shutter’s investment especially for
enhancing installation capabilities and responding to legislation for fireproof doors/shutters, partially offset by volume increase and gross margin improvement driven by price adjustment realization of big projects.
2. U.S. business expects to increase driven mainly by volume increase and Japanese yen depreciation effect.3. Euro business expects to decrease slightly due to growing price competition/deteriorating gross margin,
and the rise of yen, partially offset by Alpha acquisition effect and cost reduction effect.
yoy(amt)¥+1.67 Bln
Sanwa Group(consolidated)
JPYbn
10. Operating Income(Consolidated) FY2015 Forecast

- 15 -
JPYbn
JPYbn JPYbn
JPYbn
Forex Rate(USD)2014 JPY 106.462015 JPY 120.00
JapaneseSubsidiaries
Sanwa Shutter
ODC Novoferm
FY2014 FY2015(F)
-0.321.500.15
-0.080.101.500.27
-0.12
SalesVolumeDecrease
MaterialPriceDecrease
SalesPriceDecrease
CostReduction
ForeignExchangeEffects
AlphaOthers
Forex Rate(EURO)2014 JPY 140.352015 JPY 130.00
10. Operating Income(by Sector) FY2015 Forecast

■ Financial Information Highlight

Mill Yen
FY2014 FY2015
Mar.% tototal Mar.
% tototal Y/Y(amt) Y/Y(%)
Current Assets 177,521 63.0% 197,958 61.2% +20,437 111.5%
Cash & Cashables 52,307 18.6% 58,605 18.1% +6,298 112.0%
AR s. & Inventories 114,659 40.7% 125,358 38.8% +10,699 109.3%
Fixed Assets 104,396 37.0% 125,368 38.8% +20,972 120.1%
Financial Investments 11,797 4.2% 17,145 5.3% +5,348 145.3%
Total Assets 281,917 323,327 +41,410 114.7%
Financial Debts 69,153 24.5% 88,483 27.4% +19,330 128.0%
(Debt/Equity Ratio) 0.61 0.70Other Liabilities 98,611 35.0% 108,096 33.4% +9,485 109.6%
Equities 113,956 40.4% 126,748 39.1% +12,792 111.2%
currency exchange adjustment 9,252 16,043 +6,791 173.4%
- 17 -
1. Balance Sheet
Both total assets and net assets increased significantly due to Alpha acquisition, advance fund procurement because of lower interest rate and an increase in foreign currency translation adjustments from yen depreciation.
11. Financial Information Highlight ①
2. Extraordinary gain & loss
Mill Yen
FY2014
ResultRevisedForecast
Fixed asset disposal -30 -425 -100
Fixed asset impairment -2993 0 0
Write-down of securities -88 -200 -100
restructuring expenses of subsidiaries -1300 -2300 -1200
Others -58 -525 -1000
Extraordinary loss (total) -4469 -3450 -2400
Extraordinary gain (total) 673 50 0
Extraordinary gain & loss -3796 -3400 -2400
FY2015Forecast
(%)
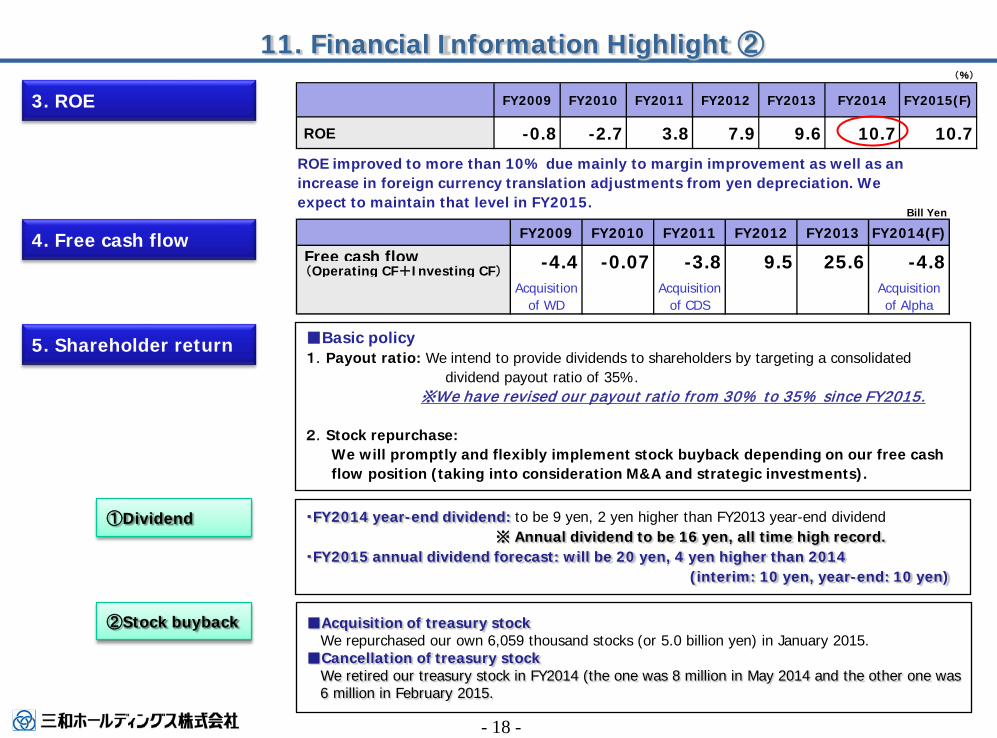
FY2009 FY2010 FY2011 FY2012 FY2013 FY2014 FY2015(F)
ROE -0.8 -2.7 3.8 7.9 9.6 10.7 10.7
- 18 -
5. Shareholder return
■Acquisition of treasury stockWe repurchased our own 6,059 thousand stocks (or 5.0 billion yen) in January 2015.
■Cancellation of treasury stockWe retired our treasury stock in FY2014 (the one was 8 million in May 2014 and the other one was6 million in February 2015.
・FY2014 year-end dividend: to be 9 yen, 2 yen higher than FY2013 year-end dividend※ Annual dividend to be 16 yen, all time high record.
・FY2015 annual dividend forecast: will be 20 yen, 4 yen higher than 2014(interim: 10 yen, year-end: 10 yen)
4. Free cash flow
3. ROE
ROE improved to more than 10% due mainly to margin improvement as well as an increase in foreign currency translation adjustments from yen depreciation. We expect to maintain that level in FY2015.
■Basic policy1.Payout ratio: We intend to provide dividends to shareholders by targeting a consolidated
dividend payout ratio of 35%.※We have revised our payout ratio from 30% to 35% since FY2015.
2.Stock repurchase: We will promptly and flexibly implement stock buyback depending on our free cash flow position (taking into consideration M&A and strategic investments).
①Dividend
②Stock buyback
11. Financial Information Highlight ②
Bill Yen
FY2009 FY2010 FY2011 FY2012 FY2013 FY2014(F)
Free cash flow(Operating CF+Investing CF)
Acquisitionof WD
Acquisitionof CDS
Acquisitionof Alpha
-4.4 -0.07 -3.8 9.5 25.6 -4.8

■ Progress of First Three Year Plan

- 20 -
4. Production Capability
3. Installation capabilityenhancement
2. Strategic products
■ Enhanced production capabilities for partitions and commercial building/ condominium doorsImprove production capabilities at Shizuoka plant, Ota plant, Hiroshima plant and Sanwa Tajima (FY2014 and FY2015).
Venix improved its toilet booth production capability in FY2014.
■ Developed installation technicians for response to legislation of door/shutter inspection and enhancement of installation capabilities
Implemented ongoing initiatives for strengthening installation capabilities to support strong performance① Increasing technicians: Increased to 3,300 technicians (100 people more than LY)
and plan to increase by 10% vs. 2014.② Accommodation: Renovated accommodation facility at Sanwa Shutter’s HR
development improved capacity by 50%.③ Wage increase: Partly revised/increased installation costs and developed installation
training program
■ Partitions: Strengthen product lineups for steel/glass partitions and toilet boothsWaterproof products : Launched waterproof products (shutter and door) named
“Waterguard” in 2014 and currently added universal typed products (sheet and door) to its product lineup.
5. Reconstruction Demand
■The situation of East Japan reconstruction demandFY2014 actual: Order received: 3.8 billion yen, Sales: 3.2 billion yenFY2015 forecast: Order received: 3.4 billion yen, Sales: 3.0 billion yen
1. Comprehensive strength
■ Multi-product sales activities through cooperation among group companiesHave implemented group cooperation activities to win orders for entrance products such as stainless steel products, aluminum entrance system including automatic doors, mailbox, etc.
For our future growth of earnings, we will attempt to improve multi-product sales activities and strengthen installation capabilities.
12. Progress of Priority Policy (Japan) First Three Year Plan

- 21 -
3. New ERP Implementation
2. Forward integration
■The new system has sequentially implemented at TODCO in 2013 and at Horton in 2014 so far and project to be completed in 2016 or beyond. The new system will be implemented at operator division (Genie) in 2015.
Mill $
Net Sales Currency FY’13 FY’14 FY’15 (F) Status
Door Business (CDS) (Can$) 63 69 76 Improved in local currency basis since 2013.
Automatic Door Business (Horton)
(US$) 24 24 37
FY2010: acquired ADE groupFY2012: acquired Door Control and Advanced Door Automation.FY2013: acquired Texas Access Automation.FY2014: acquired Horton Automatics of Ontario.
US business attempted several measures to achieve the long-tern plan target, $1 billion sales and $100 million EBIT
Expand installation/service business that is high profitability and less affected by market environment
Enhance corporate competitiveness such as raw material cost reduction by appropriate inventory control.
1. Business expansion (door & operator)Business growth that is superior to market growth driven by new product development and cost reduction efforts
Door Business ・Strengthened garage door business driven by new product introduction・Increased sales (share) for both commercial doors and operators at Wayne Dalton dealer channel
Operator Business ・Launched OPP operators (jointly developed with Novoferm) and start production at Mexico plant・Well developed cost reduction initiatives such as raw material cost reduction and manufacturing efficiency
12. Progress of Priority Policy (USA) First Three Year Plan

※ July - December
- 22 -
2. Structural Reform
※ FY2014 FY2015(F)
Alpha Net Sales 36.1M€ 73.1M€OperatingIncome 3.5M€ 6.9M€
Continue to conduct EU business restructuring for its future growth
Expected synergy effect Initiatives to be realized
①Sales expansion through the mutual product supply
・Alpha will sell Novoferm’s speed rollers and rolling shutters・Alpha’s sectional doors will be sold through NF sales network
②Optimization of sales and manufacturing organization
・NF will implement a measure to optimize German sales organization in 2015 (Germany is the biggest market in Europe).
③Distribution cost reduction ・Reduction of the number of carrier companies.
Enhance the foundation of Europe (Novoferm) business base throughthe integration with Alpha Deuren International B.V., acquired in 2014
Initiatives FY2015 effect amount
Review of manufacturing structure at each plant in Germany2.4M€
Workforce optimization through reviewing each business process
FY2015 effect amount :1.4M€
1. Industrial Door Business
12. Progress of Priority Policy (Europe) First Three Year Plan
- 23 -
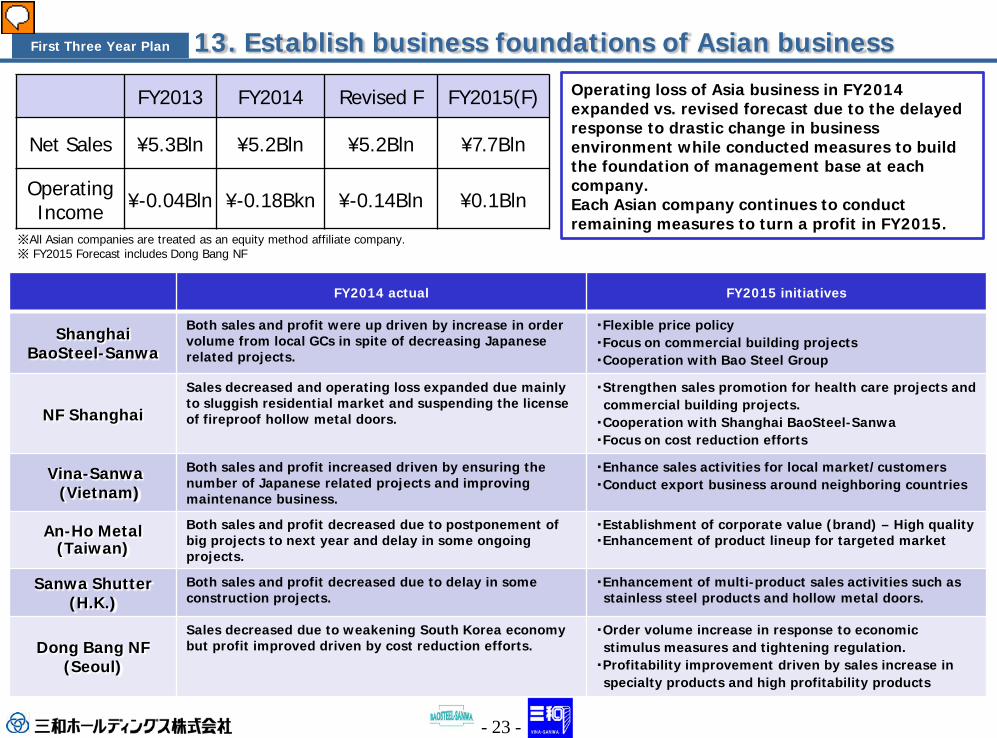
FY2013 FY2014 Revised F FY2015(F)
Net Sales ¥5.3Bln ¥5.2Bln ¥5.2Bln ¥7.7Bln
OperatingIncome ¥-0.04Bln ¥-0.18Bkn ¥-0.14Bln ¥0.1Bln
FY2014 actual FY2015 initiatives
ShanghaiBaoSteel-Sanwa
Both sales and profit were up driven by increase in order volume from local GCs in spite of decreasing Japanese related projects.
・Flexible price policy・Focus on commercial building projects・Cooperation with Bao Steel Group
NF Shanghai
Sales decreased and operating loss expanded due mainly to sluggish residential market and suspending the license of fireproof hollow metal doors.
・Strengthen sales promotion for health care projects and commercial building projects.
・Cooperation with Shanghai BaoSteel-Sanwa・Focus on cost reduction efforts
Vina-Sanwa(Vietnam)
Both sales and profit increased driven by ensuring the number of Japanese related projects and improving maintenance business.
・Enhance sales activities for local market/customers・Conduct export business around neighboring countries
An-Ho Metal(Taiwan)
Both sales and profit decreased due to postponement of big projects to next year and delay in some ongoing projects.
・Establishment of corporate value (brand) – High quality・Enhancement of product lineup for targeted market
Sanwa Shutter(H.K.)
Both sales and profit decreased due to delay in some construction projects.
・Enhancement of multi-product sales activities such as stainless steel products and hollow metal doors.
Dong Bang NF(Seoul)
Sales decreased due to weakening South Korea economy but profit improved driven by cost reduction efforts.
・Order volume increase in response to economic stimulus measures and tightening regulation.
・Profitability improvement driven by sales increase in specialty products and high profitability products
Operating loss of Asia business in FY2014 expanded vs. revised forecast due to the delayed response to drastic change in business environment while conducted measures to build the foundation of management base at each company.Each Asian company continues to conduct remaining measures to turn a profit in FY2015.
13. Establish business foundations of Asian business First Three Year Plan
※All Asian companies are treated as an equity method affiliate company.※ FY2015 Forecast includes Dong Bang NF

- 24 -
14. Global Synergy
1. Launch of strategic products into global market
2. Expansion of procurement from low-cost countries
3. Expansion of mutual complementation of product supply
■ High performance doorODC, by utilizing each group company’s development know-how, has been under development of high performance door and expects to launch in 2016.
■Integration of China procurement officesChina Procurement Center was established as a joint procurement company and was incorporated in May 2015.
■Export Sanwa Shutter’s products for a big project I VietnamThe construction of Noi Bai International Airport in Vietnam used
Sanwa Shutter’s products and was completed in 2014.
Projects
0.2
FY2014 Result
0.68
0.06
0.94total
赞合贸易(上海)有限公司
Sanwa- GPC (Shanghai) Corporation
FY2015 F
0.41
0.82
0.1
1.33
Revised F
0.37
0.77
0.08
1.22
(Bill Yen)
First Three Year Plan
※ Synergy effects are included in Total Cost Reduction of each company
■ Appendix
- 26 -
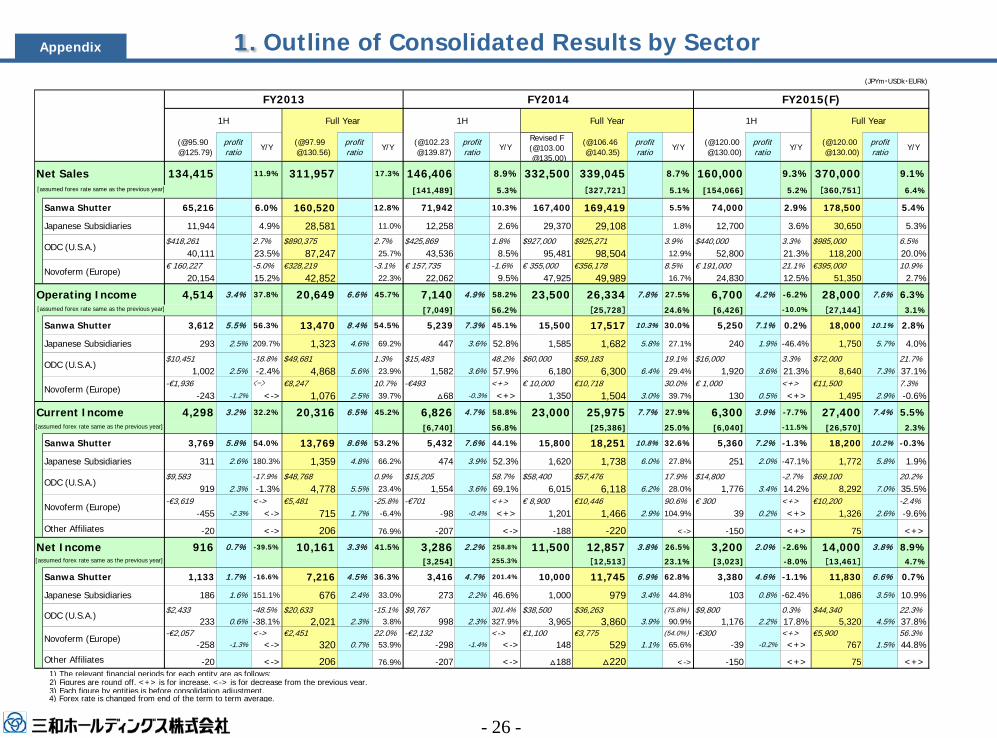
1. Outline of Consolidated Results by SectorAppendix
(JPYm・USDk・EURk)
1H Full Year 1H Full Year 1H Full Year
(@95.90 @125.79)
profitratio Y/Y
(@97.99 @130.56)
profitratio Y/Y
(@102.23 @139.87)
profitratio Y/Y
Revised F(@103.00
@135.00)
(@106.46 @140.35)
profitratio Y/Y
(@120.00 @130.00)
profitratio Y/Y
(@120.00 @130.00)
profitratio Y/Y
Net Sales 134,415 11.9% 311,957 17.3% 146,406 8.9% 332,500 339,045 8.7% 160,000 9.3% 370,000 9.1% [assumed forex rate same as the previous year] [141,489] 5.3% [327,721] 5.1% [154,066] 5.2% [360,751] 6.4%
Sanwa Shutter 65,216 6.0% 160,520 12.8% 71,942 10.3% 167,400 169,419 5.5% 74,000 2.9% 178,500 5.4%
Japanese Subsidiaries 11,944 4.9% 28,581 11.0% 12,258 2.6% 29,370 29,108 1.8% 12,700 3.6% 30,650 5.3%
$418,261 2.7% $890,375 2.7% $425,869 1.8% $927,000 $925,271 3.9% $440,000 3.3% $985,000 6.5%40,111 23.5% 87,247 25.7% 43,536 8.5% 95,481 98,504 12.9% 52,800 21.3% 118,200 20.0%
€ 160,227 -5.0% €328,219 -3.1% € 157,735 -1.6% € 355,000 €356,178 8.5% € 191,000 21.1% €395,000 10.9%20,154 15.2% 42,852 22.3% 22,062 9.5% 47,925 49,989 16.7% 24,830 12.5% 51,350 2.7%
Operating Income 4,514 3.4% 37.8% 20,649 6.6% 45.7% 7,140 4.9% 58.2% 23,500 26,334 7.8% 27.5% 6,700 4.2% -6.2% 28,000 7.6% 6.3% [assumed forex rate same as the previous year] [7,049] 56.2% [25,728] 24.6% [6,426] -10.0% [27,144] 3.1%
Sanwa Shutter 3,612 5.5% 56.3% 13,470 8.4% 54.5% 5,239 7.3% 45.1% 15,500 17,517 10.3% 30.0% 5,250 7.1% 0.2% 18,000 10.1% 2.8%
Japanese Subsidiaries 293 2.5% 209.7% 1,323 4.6% 69.2% 447 3.6% 52.8% 1,585 1,682 5.8% 27.1% 240 1.9% -46.4% 1,750 5.7% 4.0%
$10,451 -18.8% $49,681 1.3% $15,483 48.2% $60,000 $59,183 19.1% $16,000 3.3% $72,000 21.7%1,002 2.5% -2.4% 4,868 5.6% 23.9% 1,582 3.6% 57.9% 6,180 6,300 6.4% 29.4% 1,920 3.6% 21.3% 8,640 7.3% 37.1%
-€1,936 <-> €8,247 10.7% -€493 <+> € 10,000 €10,718 30.0% € 1,000 <+> €11,500 7.3%-243 -1.2% <-> 1,076 2.5% 39.7% △68 -0.3% <+> 1,350 1,504 3.0% 39.7% 130 0.5% <+> 1,495 2.9% -0.6%
Current Income 4,298 3.2% 32.2% 20,316 6.5% 45.2% 6,826 4.7% 58.8% 23,000 25,975 7.7% 27.9% 6,300 3.9% -7.7% 27,400 7.4% 5.5%[assumed forex rate same as the previous year] [6,740] 56.8% [25,386] 25.0% [6,040] -11.5% [26,570] 2.3%
Sanwa Shutter 3,769 5.8% 54.0% 13,769 8.6% 53.2% 5,432 7.6% 44.1% 15,800 18,251 10.8% 32.6% 5,360 7.2% -1.3% 18,200 10.2% -0.3%
Japanese Subsidiaries 311 2.6% 180.3% 1,359 4.8% 66.2% 474 3.9% 52.3% 1,620 1,738 6.0% 27.8% 251 2.0% -47.1% 1,772 5.8% 1.9%
$9,583 -17.9% $48,768 0.9% $15,205 58.7% $58,400 $57,476 17.9% $14,800 -2.7% $69,100 20.2%919 2.3% -1.3% 4,778 5.5% 23.4% 1,554 3.6% 69.1% 6,015 6,118 6.2% 28.0% 1,776 3.4% 14.2% 8,292 7.0% 35.5%
-€3,619 <-> €5,481 -25.8% -€701 <+> € 8,900 €10,446 90.6% € 300 <+> €10,200 -2.4%-455 -2.3% <-> 715 1.7% -6.4% -98 -0.4% <+> 1,201 1,466 2.9% 104.9% 39 0.2% <+> 1,326 2.6% -9.6%
Other Affiliates -20 <-> 206 76.9% -207 <-> -188 -220 <-> -150 <+> 75 <+>
Net Income 916 0.7% -39.5% 10,161 3.3% 41.5% 3,286 2.2% 258.8% 11,500 12,857 3.8% 26.5% 3,200 2.0% -2.6% 14,000 3.8% 8.9%[assumed forex rate same as the previous year] [3,254] 255.3% [12,513] 23.1% [3,023] -8.0% [13,461] 4.7%
Sanwa Shutter 1,133 1.7% -16.6% 7,216 4.5% 36.3% 3,416 4.7% 201.4% 10,000 11,745 6.9% 62.8% 3,380 4.6% -1.1% 11,830 6.6% 0.7%
Japanese Subsidiaries 186 1.6% 151.1% 676 2.4% 33.0% 273 2.2% 46.6% 1,000 979 3.4% 44.8% 103 0.8% -62.4% 1,086 3.5% 10.9%
$2,433 -48.5% $20,633 -15.1% $9,767 301.4% $38,500 $36,263 (75.8%) $9,800 0.3% $44,340 22.3%233 0.6% -38.1% 2,021 2.3% 3.8% 998 2.3% 327.9% 3,965 3,860 3.9% 90.9% 1,176 2.2% 17.8% 5,320 4.5% 37.8%
-€2,057 <-> €2,451 22.0% -€2,132 <-> €1,100 €3,775 (54.0%) -€300 <+> €5,900 56.3%-258 -1.3% <-> 320 0.7% 53.9% -298 -1.4% <-> 148 529 1.1% 65.6% -39 -0.2% <+> 767 1.5% 44.8%
Other Affiliates -20 <-> 206 76.9% -207 <-> △188 △220 <-> -150 <+> 75 <+> 1) The relevant financial periods for each entity are as follows: 2) Figures are round off. <+> is for increase, <-> is for decrease from the previous year. 3) Each figure by entities is before consolidation adjustment. 4) Forex rate is changed from end of the term to term average.
FY2014 FY2015(F)
ODC (U.S.A.)
Novoferm (Europe)
ODC (U.S.A.)
Novoferm (Europe)
ODC (U.S.A.)
Novoferm (Europe)
ODC (U.S.A.)
Novoferm (Europe)
FY2013

0
5,000
10,000
15,000
20,000
25,000
30,000
35,000
2009 2010 2011 2012 2013 2014 2015(F)
(Mill Yen)
60
85
110
135
160
2009 2010 2011 2012 2013 2014 2015(F)
(Mill EURO)
20
30
40
50
60
70
80
90
100
0
100
200
300
400
500
600
700
800
2009 2010 2011 2012 2013 2014 2015(F)
(Mill USD) (Mill USD)
- 27 -
2. Sales Trend of Main Products(Japan,USA,Europe)
Light weightSteel door
Heavy-dutyshutter
Light weight shutter
Maintenance & Repair
AluminumStore- front
Partition
Window shutter
Stainless steel Product
Exterior
Heavy-dutySteel door
Japan
Truck/Trailer door (R-axis)
Automatic door(R-axis)
Overhead door(L-axis)
Operator(L-axis)
Door/door frame
Industrial door
Garage door
USA : ODC
Europe : Novoferm
Appendix

3. Japan: Order Volume of Net Sales by Products (Sanwa Shutter)Appendix
JPYm・%FY2014 FY2015(F)
1H 2H Full Year 1H 2H Full YearOrderIntake
Sales % tototal
OrderIntake
Sales % tototal
OrderIntake
% tototal
Sales % tototal
OrderIntake
Sales % tototal
OrderIntake
Sales % tototal
OrderIntake
% tototal
Sales % tototal
<-0.2> <0.5> <-3.2> <-6.5> <-1.7> <-3.2> <-3.4> <1.0> <0.4> <0.1> <-1.5> <0.5>13,560 13,074 18.2 13,647 13,690 14.0 27,207 15.1 26,765 15.8 13,100 13,200 17.8 13,700 13,700 13.1 26,800 14.3 26,900 15.1
<5.8> <8.5> <14.2> <-0.7> <10.0> <3.1> <4.2> <7.1> <6.2> <13.3> <5.2> <10.6>16,897 13,729 19.1 18,365 18,183 18.7 35,262 19.6 31,913 18.8 17,600 14,700 19.9 19,500 20,600 19.7 37,100 19.8 35,300 19.8
<3.1> <4.5> <6.1> <-3.3> <4.6> <0.1> <0.8> <4.1> <3.7> <7.6> <2.3> <6.0>30,458 26,803 37.3 32,012 31,874 32.7 62,470 34.7 58,678 34.6 30,700 27,900 37.7 33,200 34,300 32.8 63,900 34.2 62,200 34.8
<-1.5> <2.0> <0.5> <-6.7> <-0.5> <-2.9> <2.1> <-3.8> <4.7> <10.0> <3.4> <3.8>2,937 2,701 3.8 3,153 3,271 3.4 6,090 3.4 5,973 3.5 3,000 2,600 3.5 3,300 3,600 3.4 6,300 3.4 6,200 3.5
5,367 4,457 6.2 6,035 6,129 6.3 11,403 6.3 10,586 6.2 5,900 5,000 6.8 7,000 7,300 7.0 12,900 6.9 12,300 6.9<4.1> <5.8> <11.1> <-0.0> <7.7> <2.4> <7.2> <6.2> <12.1> <15.9> <9.8> <11.7>
8,305 7,159 10.0 9,188 9,401 9.6 17,493 <9.7> 16,560 9.8 8,900 7,600 10.3 10,300 10,900 10.4 19,200 10.3 18,500 10.4<12.7> <13.5> <-0.3> <4.3> <5.8> <7.5> <2.6> <-1.8> <7.0> <4.5> <4.8> <2.1>
28,762 20,269 28.2 28,397 33,879 34.8 57,160 31.7 54,148 32.0 29,500 19,900 26.9 30,400 35,400 33.9 59,900 32.0 55,300 31.0<54.4> <54.7> <17.0> <16.8> <32.1> <32.1> <11.3> <11.4> <5.5> <5.5> <8.2> <8.3>
1,617 1,616 2.2 1,800 1,801 1.8 3,418 1.9 3,417 2.0 1,800 1,800 2.4 1,900 1,900 1.8 3,700 2.0 3,700 2.1<14.4> <15.7> <0.6> <4.8> <7.0> <8.7> <3.0> <-0.8> <7.0> <4.5> <5.0> <2.5>
30,380 21,885 30.4 30,198 35,680 36.6 60,578 33.6 57,566 34.0 31,300 21,700 29.3 32,300 37,300 35.7 63,600 34.0 59,000 33.1<13.3> <13.1> <-6.8> <-7.0> <2.3> <2.0> <-1.3> <-0.4> <0.5> <0.1> <-0.4> <-0.2>
4,356 4,318 6.0 4,377 4,394 4.5 8,734 4.8 8,713 5.1 4,300 4,300 5.8 <4,400.0> 4,400 4.2 8,700 4.7 8,700 4.9<19.6> <31.4> <3.0> <2.1> <10.4> <14.0> <1.7> <9.0> <4.7> <5.2> <3.3> <7.0>
1,995 1,861 2.6 2,128 2,119 2.2 4,124 2.3 3,981 2.3 2,030 2,030 2.7 2,230 2,230 2.1 4,260 2.3 4,260 2.4<18.8> <19.8> <10.0> <18.6> <14.2> <19.1> <12.6> <6.0> <11.0> <11.2> <11.8> <9.2>
5,683 3,961 5.5 5,766 6,293 6.5 11,449 6.4 10,254 6.1 6,400 4,200 5.7 6,400 7,000 6.7 12,800 6.8 11,200 6.3<67.4> <42.9> <16.3> <33.4> <38.4> <36.5> <-29.1> <8.9> <-6.8> <13.2> <-18.5> <11.7>
3,666 1,927 2.7 3,326 3,622 3.7 6,992 3.9 5,550 3.3 2,600 2,100 2.8 3,100 4,100 3.9 5,700 3.0 6,200 3.5<-0.7> <-14.1> <54.7> <14.4> <26.7> <1.7> <9.5> <38.7> <-0.1> <17.1> <3.7> <25.2>
456 360 0.5 700 597 0.6 1,157 0.6 958 0.6 500 500 0.7 700 700 0.7 1,200 0.6 1,200 0.7<7.6> <18.7> <3.7> <2.0> <5.5> <9.4>
1,292 1,128 1.6 1,427 1,430 1.5 2,719 1.5 2,559 1.5 1,390 1,340 1.8 1,480 1,460 1.4 2,870 1.5 2,800 1.6
1,918 2,534 3.5 2,495 2,061 2.1 4,413 2.5 4,596 2.7 1,880 2,330 3.1 2,890 2,110 2.0 4,770 2.6 4,440 2.5<22.0> <14.6> <10.3> <15.6> <15.7> <15.2> <-1.9> <5.6> <6.2> <9.7> <2.3> <8.0>
13,016 9,912 13.8 13,715 14,006 14.4 26,732 14.8 23,918 14.1 12,770 10,470 14.1 14,570 15,370 14.7 27,340 14.6 25,840 14.5<10.3> <10.3> <4.5> <2.3> <7.3> <5.5> <1.7> <2.9> <5.9> <7.2> <3.8> <5.4>
88,513 71,942 100.0 91,621 97,477 100.0 180,135 100.0 169,419 100.0 90,000 74,000 100.0 97,000 104,500 100.0 187,000 100.0 178,500 100.0
<13.0> <13.3> <6.7> <4.6> <9.7> <7.8> <2.9> <3.0> <7.2> <9.8> <5.1> <7.1>57,607 41,735 58.0 58,495 64,597 66.3 116,103 64.5 106,332 62.8 59,300 43,000 58.1 62,700 70,900 67.8 122,000 65.2 113,900 63.8
<-1.6> <-0.9> <-1.7> <-7.2> <-1.6> <-4.3> <-4.6> <0.6> <-1.7> <-0.9> <-3.2> <-0.2>10,800 10,243 14.2 11,092 10,993 11.3 21,892 12.2 21,236 12.5 10,300 10,300 13.9 10,900 10,900 10.4 21,200 11.3 21,200 11.9
<19.3> <21.5> <-0.7> <-1.0> <8.2> <8.7> <1.8> <4.0> <3.3> <3.1> <2.6> <3.5>8,348 8,172 11.4 8,712 8,730 9.0 17,060 9.5 16,902 10.0 8,500 8,500 11.5 9,000 9,000 8.6 17,500 9.4 17,500 9.8
<4.9> <4.1> <3.7> <2.3> <4.3> <3.1> <0.7> <5.2> <7.7> <5.1> <4.4> <5.1>10,328 9,889 13.7 11,418 11,703 12.0 21,747 12.1 21,592 12.7 10,400 10,400 14.1 12,300 12,300 11.8 22,700 12.1 22,700 12.7
1,428 1,901 2.6 1,903 1,452 1.5 3,331 1.8 3,354 2.0 1,500 1,800 2.4 2,100 1,400 1.3 3,600 1.9 3,200 1.8
Amount Amount Y/Y Amount Amount Y/Y
76,207 70,115 10,579 86,115 78,615 8,500
18,945 14,851 2,396 22,700 16,500 1,6481) < >=⊿% year on year 2) Outstanding Order Intake = Unordered, unpurchased and work-in-process
RollingShutters
Lightweight
Heavy-duty
Sub Total
Overhead Doors
Others
Sub Total
Shutter-related
Products
Doors
Comm. Bldgs/Condominiums
Residential
Sub Total
Others
Partitions
Stainless-Steel Entrances
Aluminum Fronts
Automatic door oprators
Others
Sub Total
Shop-related Materials
Commercial Building Materials
Exterior Fittings
Window-related Products
Work-in-process
Outstanding Order Intake
Others
Maintenance & Repair
Residential Housing Materials
Total
- 29 -
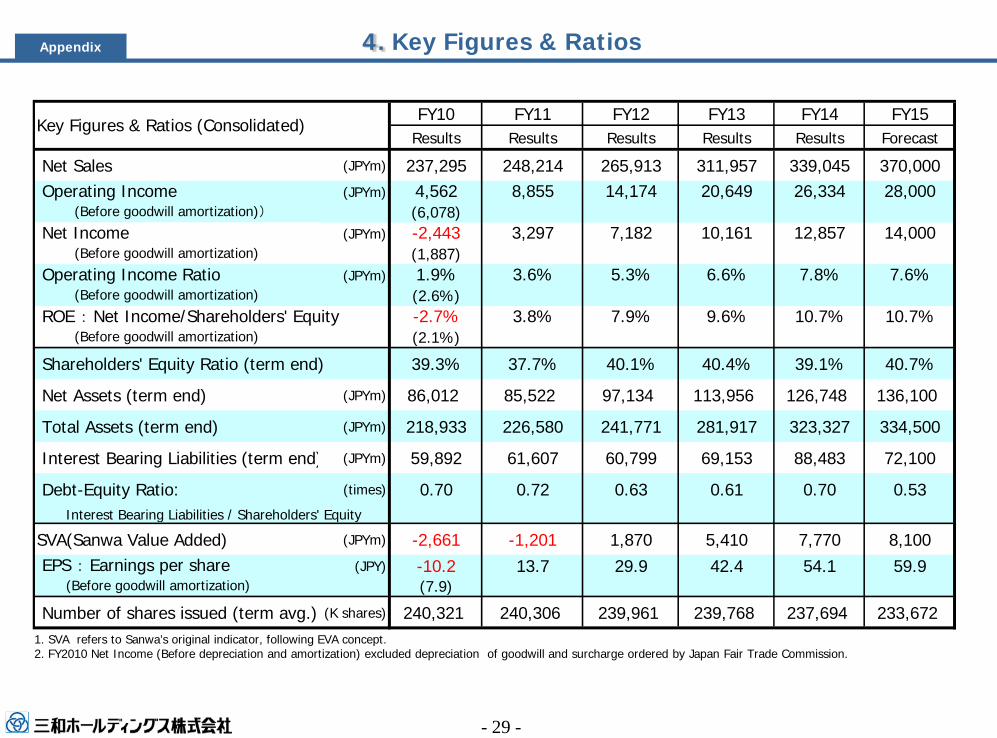
4. Key Figures & Ratios
FY10 FY11 FY12 FY13 FY14 FY15Results Results Results Results Results Forecast
Net Sales (JPYm) 237,295 248,214 265,913 311,957 339,045 370,000 Operating Income (JPYm) 4,562 8,855 14,174 20,649 26,334 28,000 (Before goodwill amortization)) (6,078) Net Income (JPYm) -2,443 3,297 7,182 10,161 12,857 14,000 (Before goodwill amortization) (1,887) Operating Income Ratio (JPYm) 1.9% 3.6% 5.3% 6.6% 7.8% 7.6% (Before goodwill amortization) (2.6%) ROE : Net Income/Shareholders' Equity -2.7% 3.8% 7.9% 9.6% 10.7% 10.7% (Before goodwill amortization) (2.1%)
Shareholders' Equity Ratio (term end) 39.3% 37.7% 40.1% 40.4% 39.1% 40.7%
Net Assets (term end) (JPYm) 86,012 85,522 97,134 113,956 126,748 136,100
Total Assets (term end) (JPYm) 218,933 226,580 241,771 281,917 323,327 334,500
Interest Bearing Liabilities (term end) (JPYm) 59,892 61,607 60,799 69,153 88,483 72,100
Debt-Equity Ratio: (times) 0.70 0.72 0.63 0.61 0.70 0.53 Interest Bearing Liabilities / Shareholders' Equity
SVA(Sanwa Value Added) (JPYm) -2,661 -1,201 1,870 5,410 7,770 8,100 EPS : Earnings per share (JPY) -10.2 13.7 29.9 42.4 54.1 59.9 (Before goodwill amortization) (7.9)
Number of shares issued (term avg.) (K shares) 240,321 240,306 239,961 239,768 237,694 233,672
Key Figures & Ratios (Consolidated)
Appendix
1. SVA refers to Sanwa’s original indicator, following EVA concept.2. FY2010 Net Income (Before depreciation and amortization) excluded depreciation of goodwill and surcharge ordered by Japan Fair Trade Commission.

- 30 -
5. Capital Expenditure & DepreciationAppendix
- 31 -
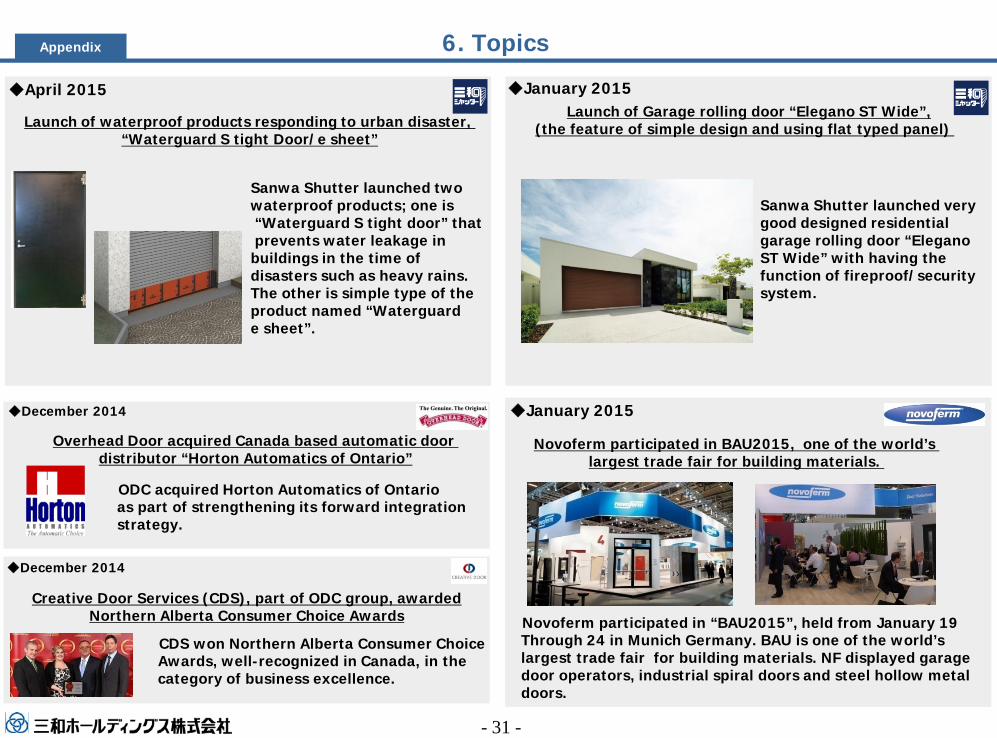
6. Topics
Novoferm participated in BAU2015, one of the world’slargest trade fair for building materials.
Sanwa Shutter launched two waterproof products; one is “Waterguard S tight door” thatprevents water leakage in buildings in the time of disasters such as heavy rains. The other is simple type of the product named “Waterguard e sheet”.
◆January 2015
Launch of waterproof products responding to urban disaster, “Waterguard S tight Door/e sheet”
◆April 2015Launch of Garage rolling door “Elegano ST Wide”,
(the feature of simple design and using flat typed panel)
Novoferm participated in “BAU2015”, held from January 19 Through 24 in Munich Germany. BAU is one of the world’s largest trade fair for building materials. NF displayed garage door operators, industrial spiral doors and steel hollow metal doors.
Sanwa Shutter launched verygood designed residential garage rolling door “Elegano ST Wide” with having the function of fireproof/security system.
◆December 2014
ODC acquired Horton Automatics of Ontarioas part of strengthening its forward integrationstrategy.
Overhead Door acquired Canada based automatic door distributor “Horton Automatics of Ontario”
Creative Door Services (CDS), part of ODC group, awardedNorthern Alberta Consumer Choice Awards
CDS won Northern Alberta Consumer ChoiceAwards, well-recognized in Canada, in the category of business excellence.
Appendix
◆January 2015
◆December 2014


![Presentation on Results for 2nd Quarter of Fiscal 2016...[ 2Q FY2016 Results] Consolidated Income Statements – Changes from 2Q FY2015 7 Unit: billion yen FY2016 FY2015 (Apr.-Sep.2016)](https://img.pdfslide.us/doc/110x75/5fcdfc2550ca5500ae4530a9/presentation-on-results-for-2nd-quarter-of-fiscal-2016-2q-fy2016-results.jpg)