Embed Size (px)
Citation preview
Before-and-After Studies
of New Starts Projects
Report to Congress
December 2013
Prepared by:
Office of Planning and Environment
Federal Transit Administration
U.S. Department of Transportation
Federal Transit Administration Page 2
FOREWORD
This sixth annual report to Congress on Before-and-After Studies summarizes the findings for
six projects that opened to service in 2008 and 2009, reported here in the order of their opening
days:
1. Weber County to Salt Lake Commuter Rail; Salt Lake City, Utah
2. Central Phoenix / East Valley Light Rail; Phoenix, Arizona
3. Wilsonville to Beaverton Commuter Rail; Washington and Multnomah Counties, Oregon
4. Metro Gold Line Eastside Extension; Los Angeles, California
5. Northstar Corridor Rail Project; Minneapolis, Minnesota
6. Central Link Initial Segment and Airport Link; Seattle, Washington
Before-and-After Studies help sponsoring agencies and the Federal Transit Administration
(FTA) to accumulate insights into the actual costs and impacts of major capital investments in
transit and to improve the reliability of the predictions of the costs and impacts of proposed
projects. Each Before-and-After Study documents the actual outcomes of a New Starts or Small
Starts project in five dimensions: physical scope, capital costs, transit service levels, operating
and maintenance costs, and ridership. The study also examines the accuracy of the predictions of
those outcomes prepared to support local and federal decisions at key points in project
development: entry into preliminary engineering (or project development for Small Starts), entry
into final design, and execution of the Full Funding Grant Agreement (FFGA) (or Project
Construction Grant Agreement (PGCA) for Small Starts). Finally, the study also identifies the
sources of differences between predicted and actual outcomes.
As with the projects considered in the five previous reports to Congress on Before-and-After
Studies, the planning and development of the projects reported here were underway before FTA
introduced requirements for: (1) a Before-and-After Study (2001); (2) documentation of capital
costs in FTA-defined standard cost categories (2005); and (3) preservation of the forecasts
needed to support the study (May 2006). Consequently, some details are limited on the transit
service plans, cost estimates, and ridership forecasts prepared for the early milestones.
This report reflects the full extent of information that FTA has obtained from the agency
sponsors of these six projects.
Federal Transit Administration Page 3
Weber County to Salt Lake Commuter Rail Project; Salt Lake City, Utah
The Weber County to Salt Lake Commuter Rail Project, known as FrontRunner North, is a 44-
mile commuter rail line extending north from downtown Salt Lake City through Ogden to the
northern end of Weber County at Pleasant View, Utah. The project was planned, developed, and
built by the Utah Transit Authority (UTA). FrontRunner North is the first commuter rail service
in the Salt Lake City metropolitan area. UTA operates the commuter rail line as part of a region-
wide transit system that includes local and express buses, bus rapid transit, and light rail. In
early 2013, UTA opened FrontRunner South, a 40-mile extension of the commuter rail line
extending south from downtown Salt Lake City to Orem, Utah.
In September 2001, an alternatives analysis identified commuter rail in the north-south corridor
as the preferred alternative for transit improvements in the corridor. The project entered
preliminary engineering (PE) in December 2003, and advanced into final design (FD) in June
2005. UTA and FTA executed a Full Funding Grant Agreement (FFGA) for the project in June
2006. The project opened to service in May 2008.
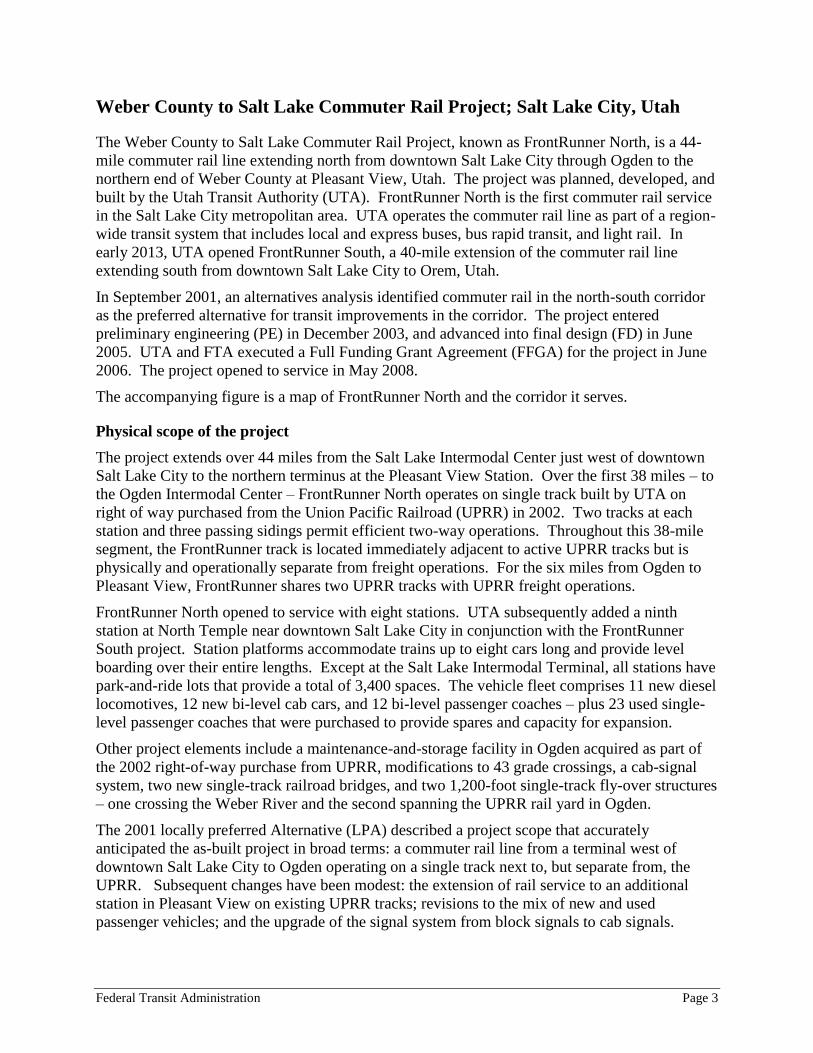
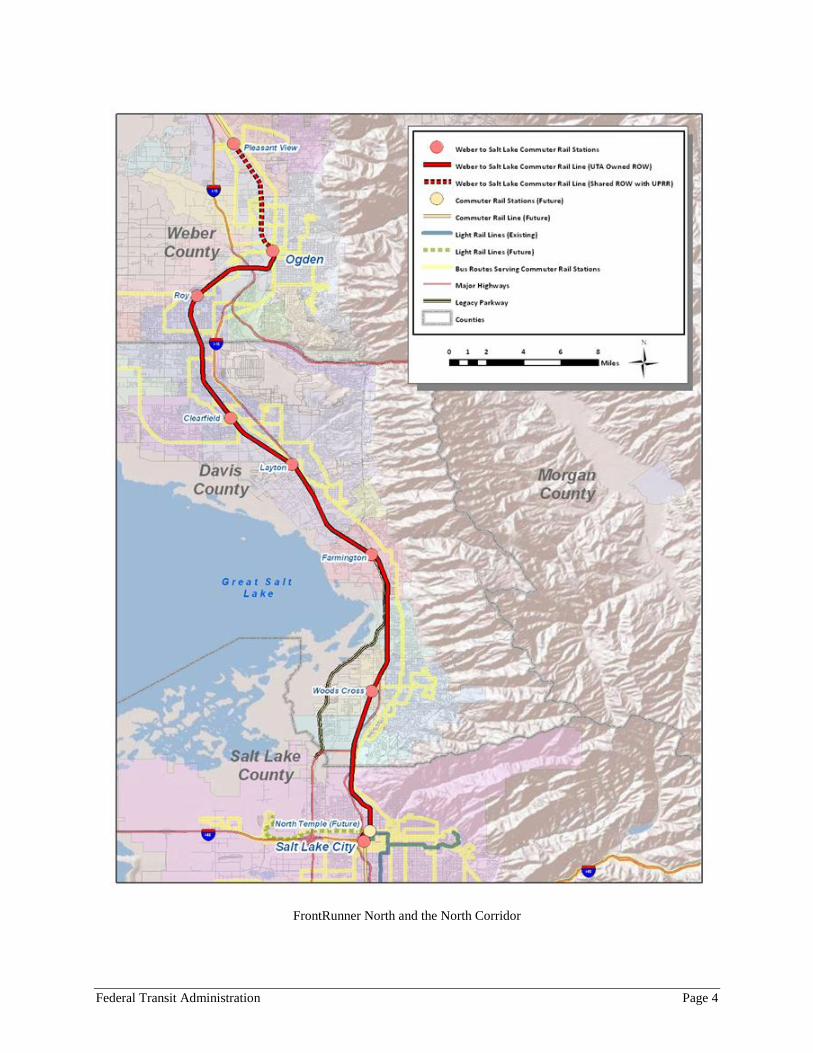
The accompanying figure is a map of FrontRunner North and the corridor it serves.
Physical scope of the project
The project extends over 44 miles from the Salt Lake Intermodal Center just west of downtown
Salt Lake City to the northern terminus at the Pleasant View Station. Over the first 38 miles – to
the Ogden Intermodal Center – FrontRunner North operates on single track built by UTA on
right of way purchased from the Union Pacific Railroad (UPRR) in 2002. Two tracks at each
station and three passing sidings permit efficient two-way operations. Throughout this 38-mile
segment, the FrontRunner track is located immediately adjacent to active UPRR tracks but is
physically and operationally separate from freight operations. For the six miles from Ogden to
Pleasant View, FrontRunner shares two UPRR tracks with UPRR freight operations.
FrontRunner North opened to service with eight stations. UTA subsequently added a ninth
station at North Temple near downtown Salt Lake City in conjunction with the FrontRunner
South project. Station platforms accommodate trains up to eight cars long and provide level
boarding over their entire lengths. Except at the Salt Lake Intermodal Terminal, all stations have
park-and-ride lots that provide a total of 3,400 spaces. The vehicle fleet comprises 11 new diesel
locomotives, 12 new bi-level cab cars, and 12 bi-level passenger coaches – plus 23 used single-
level passenger coaches that were purchased to provide spares and capacity for expansion.
Other project elements include a maintenance-and-storage facility in Ogden acquired as part of
the 2002 right-of-way purchase from UPRR, modifications to 43 grade crossings, a cab-signal
system, two new single-track railroad bridges, and two 1,200-foot single-track fly-over structures
– one crossing the Weber River and the second spanning the UPRR rail yard in Ogden.
The 2001 locally preferred Alternative (LPA) described a project scope that accurately
anticipated the as-built project in broad terms: a commuter rail line from a terminal west of
downtown Salt Lake City to Ogden operating on a single track next to, but separate from, the
UPRR. Subsequent changes have been modest: the extension of rail service to an additional
station in Pleasant View on existing UPRR tracks; revisions to the mix of new and used
passenger vehicles; and the upgrade of the signal system from block signals to cab signals.
Federal Transit Administration Page 4
FrontRunner North and the North Corridor
Federal Transit Administration Page 5
These changes occurred during preliminary engineering and the project scope at entry into final
design was an accurate representation of the as-built project.
A significantly larger set of changes occurred in the complexity of construction of the project.
Throughout project development and into construction, UTA discovered additional complexities
associated with construction of the new commuter rail track immediately adjacent to mainline
UPRR tracks carrying active freight services. These complexities included the realities of
building the new track in right-of-way that had previously been a drainage ditch – leading to the
reconstruction of a large number of drainage structures in the narrow corridor between the
Wasatch Mountains on the east and the Great Salt Lake immediately to the west of the right of
way. Other complexities were the need for temporary track-work to maintain freight service
during construction and reconstruction work and for cabling to upgrade the signal system in the
corridor to permit 79 mph maximum commuter rail speeds. These realities were identified
through negotiations with UPRR, largely in preliminary engineering but also extending into final
design and construction. Together, they represented a substantial change in the work required to
build the project even though the broad scope of the project was largely unchanged.
Capital cost
The actual cost of the project was $614 million in year-of-expenditure (YOE) dollars. Local
governments separately provided $18 million to fund localized improvements. For the 38-mile
segment of the new single-track commuter rail facilities, total capital costs averaged $15 million
per mile including stations, vehicles, and the maintenance-and-storage facility.
The predicted capital cost at entry into preliminary engineering was $408 million in YOE
dollars, an underestimate of $205 million equivalent to 34 percent of the actual cost. The
principal drivers of the underestimate were: (1) the unanticipated complexity of track
construction, site-work, and special conditions ($167 million); (2) the upgraded signal system
($21 million); and (3) the later introduction of financing costs into the project budget ($84
million). These underestimates were partially offset by the $68 million unallocated contingency
included in the predicted costs at entry to preliminary engineering.
At entry into final design, the predicted capital cost was $581 million in YOE dollars, an
underestimate of $33 million equivalent to eight percent of the actual cost. At the FFGA, the
predicted cost was $611.7 million. The difference between these two predictions is attributable
solely to the addition of financing costs to the FFGA project budget. As construction neared
completion and the unallocated contingency reserve in the FFGA remained untapped, the
contingency amount was redirected to the acquisition of a larger fleet of vehicles for capacity
expansion ($24 million) and to fund a larger amount of project financing costs.
Transit service
On weekdays, FrontRunner North provides service from 5:00 am to midnight. Trains depart in
both directions every 30 minutes for three hours in the morning peak and four hours in the
evening peak, and every 60 minutes at all other times. This service pattern is a modification of
the FrontRunner North schedule in place when the line began service in 2008. Under the
original schedule, trains departed every 30 minutes all day until 8:00 pm, when they shifted to 60
minutes between departures. On Saturday, trains depart every 60 minutes from 5:00 am to 1:00
am. FrontRunner does not operate on Sundays. Runtime between Salt Lake City and Ogden is
50 minutes, an improvement over the initial 59-minute runtime that is the result of adjustments to
Federal Transit Administration Page 6
operating speeds and passing locations. FrontRunner fares are distance-based: $2.50 for the first
station plus $0.50 for each additional station. Commuter rail riders transfer for free to/from UTA
bus and light rail routes.
In September 2011, UTA suspended rail service between Ogden and Pleasant View because of
schedule unreliability, low ridership, and operating costs. When FrontRunner North opened to
service in 2008, rail service between the Ogden and Pleasant View stations consisted of two
departures in each direction during the peak periods by a single-car shuttle sharing UPRR tracks
with UPRR freight service. Passengers transferred between the rail shuttle and trains to/from
Salt Lake City at the Ogden station. UTA has replaced that shuttle service with express buses
operating between the Pleasant View and Ogden stations. UTA remains committed to the
provision of a FrontRunner North connection to Pleasant View and continues to examine options
for restoring the service.
At the Salt Lake Intermodal Center just west of downtown, FrontRunner North connects to the
TRAX light rail system and to 15 bus routes providing more than 30 bus departures per hour. At
the Ogden Intermodal Center, FrontRunner North connects to most Ogden-area bus routes
because the bus system uses the Intermodal Center as a service hub. Few bus routes connect to
other FrontRunner North stations.
Other bus services in the corridor include two local routes that continue to provide on-and-off
service for short trips not well served by commuter rail and two express routes that provide direct
service to major activity centers in Salt Lake City – one to the University of Utah and the second
to locations within downtown. These express routes rely primarily on park-and-ride access in
the north corridor, operate wifi-equipped over-the-road coaches with reclining seats, and provide
a one-seat ride to the specific locations that they serve. The university route provides moderately
higher service levels than it did prior to FrontRunner North opening. The downtown route
provides 25 percent of its pre-FrontRunner North service because most riders shifted to the new
commuter rail option.
Predicted transit service levels at the project-development milestones differed from actual
outcomes in four ways. First, FrontRunner North headways were planned at PE-entry to be 20
minutes during peak periods and 40 minutes at all other times of day. At FD-entry and at the
FFGA, headways were to be 20 minutes peak and 60 minutes at other times. When it opened for
service, FrontRunner North headways were 30 minutes all day before changing to 60 minutes
after 8:00pm. UTA subsequently revised the headways to 30 minutes in the peak periods only
and 60 minutes at all other times. Second, the project was planned to provide Pleasant View
service with two through-routed trains during the peak periods operating on shared UPRR tracks.
When FrontRunner North opened, the Pleasant View service consisted of a one-car shuttle
operation providing two trips in each direction during the peak period, connecting at the Ogden
station with trains to/from Salt Lake City. UTA has since temporarily suspended the rail shuttle
and replaced it with bus shuttles. Third, FrontRunner North was planned to have a supporting
network of feeder buses at its stations. With the project’s opening, significant feeder-bus
connections are available only at the intermodal centers in Ogden and Salt Lake City. Fourth,
UTA anticipated the elimination of the two express buses in the corridor. However, rider
resistance to service cuts led to the retention of both express routes – one at marginally higher
service levels and the second at approximately 25 percent of its pre-FrontRunner North levels.
Federal Transit Administration Page 7
Operating and maintenance costs
The 2010 operating expenses for FrontRunner North totaled $15.6 million. Operating costs
included $7.1 million for train operations and fuel, $4.3 million for maintenance the vehicle fleet
and stations, $3.4 million for maintenance of the right-of-way, and $0.9 million for
administration and insurance. To control overhead costs, UTA made FrontRunner North a
second unit of the rail division first established for TRAX light rail.
Predicted operating and maintenance costs during project development marginally overstated the
actual outcome. At PE-entry, the predicted $17.2 million cost included significantly
underestimated costs for train operations and fuel that were more than offset by overestimates of
costs for station and vehicle maintenance and for administration. At FD-entry and the FFGA, the
predicted $16 million cost continued to underestimate fuel costs and overestimate the costs of
maintenance and administration.
Ridership
FrontRunner North ridership averaged 5,300 trips per weekday and 2,500 trips on Saturday in
2011-2012. However, several large swings occurred before ridership reached this relatively
steady level. In FrontRunner’s initial six months of service, ridership climbed from 6,000 per
day to nearly 9,000 per day in October 2008. This period witnessed gasoline price increases to
more than $4.00 per gallon in mid-summer. Ridership then dropped precipitously to fewer than
4,000 per weekday by May 2009. Three events contributed to this drop. First, gasoline prices
plummeted to less than $1.60 per gallon in January 2009, before partially rebounding to $2.50 by
early summer. Second, the severe economic downturn began in the fall of 2008, causing a
substantial rise in unemployment that eroded the demand for commuter-oriented transit services.
Third, the Utah Department of Transportation opened the Legacy Parkway in the north corridor,
adding two, new freeway lanes in each direction and effectively eliminating both the substantial
peak-period congestion on I-15 and much of FrontRunners travel-time competitiveness.
Ridership has grown steadily since then with weekday averages of 4,700 in 2009, 5,000 in 2010,
and 5,300 in 2011-2012.
Ridership on FrontRunner North is substantially concentrated in the peak periods: the 12 peak-
period trains carry nearly half of all weekday trips while the 46 trains during the remainder of the
day carry the other half. Some 70 percent of peak-period ridership is southbound towards Salt
Lake City in the morning and northbound in the afternoon. Much of the “reverse commute”
market comprises students traveling to Weber State University in Ogden. Half of all riders are
traveling to or from work and 20 percent to or from school. Some 75 percent use an automobile
to travel from home to a train station and 85 percent transfer at least once. Fully 75 percent of
riders are from households with three or more vehicles.
Ridership counts and surveys taken before and after the opening of FrontRunner North suggest
that total transit ridership in the corridor has increased by approximately 4,000 average weekday
trips. Express-bus ridership dropped by 1,000 trips and commuter rail attracted 5,300 trips.
These results suggest that a high share of commuter rail ridership – perhaps as much as 75
percent – is new to transit.
Opening year ridership predictions at the project development milestones were 8,400 trips at PE-
entry, 5,650 trips at FD-entry, and 5,900 trips at the FFGA. The latter two milestones compare
well with actual FrontRunner North ridership of 5,300 weekday trips. The details of these
Federal Transit Administration Page 8
ridership predictions no longer exist; so analysis of individual travel markets is not possible. For
the Before-and-After Study, however, UTA recreated the FFGA forecasts employing the same
regional travel model and key assumptions used at the FFGA milestone. In addition to the close
match on total FrontRunner North ridership, the recreated FFGA prediction accurately portrays
the directionality and geographical patterns of FrontRunners riders. This result likely reflects the
substantial local experience gained over the past three decades in ridership forecasting for a
series of new fixed-guideway projects in the Salt Lake City area.
Federal Transit Administration Page 9
Central Phoenix / East Valley Light Rail Project; Phoenix, Arizona
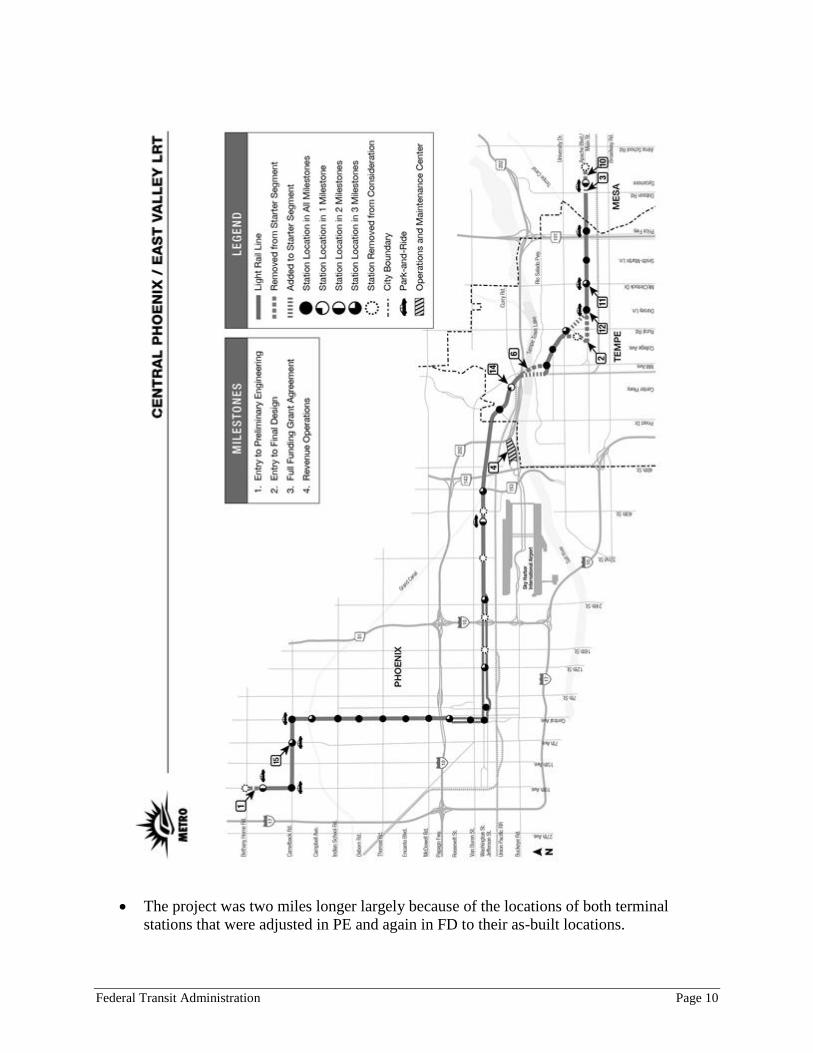
The Central Phoenix / East Valley (CP/EV) project is a 19.7-mile light rail line in metropolitan
Phoenix. It is the first rail line in the Phoenix metropolitan area. The accompanying figure is a
map of the project and its service area. The light rail line follows a predominantly north-south
alignment between the Spectrum Mall and downtown Phoenix and then proceeds along an east-
west alignment serving the airport and the cities of Tempe and Mesa.
The project was planned and developed, and is now operated, by Valley Metro Rail, Inc.
(METRO). The project was 22 miles long when it emerged as the locally preferred alternative
(LPA) from a Major Investment Study in May 1998. A 13-mile section of the LPA entered
preliminary engineering (PE) in September 1998, shortening both the northwestern and eastern
legs of the project. During PE, additions to both ends brought the total project length to 20.3
miles. Subsequent adjustments to the locations of both terminal stations during final design (FD)
shortened the project to its final 19.7-mile length. The project entered final design in July 2003.
The Federal Transit Administration (FTA) and METRO signed a Full Funding Grant Agreement
(FFGA) for the project in January 2005, and the rail line opened for revenue service in December
2008.
To support meaningful comparisons across the project development milestones, the Before-and-
After Study has taken the full-length scope to define the project at entry into preliminary
engineering, ignoring the temporary condition under which only the 13-mile section had
advanced into PE. Consequently, all predictions assigned to the PE-entry milestone are for the
full-length project.
Physical scope of the project
The CP/EV project comprises 19.7 miles of double-tracked rail with overhead electrification. For
17.8 miles, the alignment is at-grade within street rights-of-way with embedded tracks supported on a
concrete slab. Tracks are located in either a reserved lane or a street median adjacent to vehicular
traffic. The in-street alignment passes through 149 signalized intersections. For 1.3 miles, the
alignment operates exclusively within a former railroad right-of-way. Finally, for 0.6 miles, the
alignment is on a new bridge structure. The project includes 36 low-floor light-rail vehicles, 28
passenger stations, park-and-ride facilities at nine stations providing a total of 3,636 spaces, an
Operations and Maintenance Center (OMC) for the rail vehicles, and an operations control
center. Stations can accommodate 3-car trains at platforms that provide level boarding with the
low-floor vehicles over their entire length.
In parallel with the light rail project, the cities of Phoenix, Tempe and Mesa initiated additional
physical improvements that were not funded through the FFGA. These associated improvements were
categorized as Concurrent Non-Project Activities (CNPA) and included various utility improvements,
street improvements, transit interface facilities, airport connection improvements, adjacent land
development projects and traffic signal improvements. Concurrent performance of the CNPA work
and the METRO project eliminated additional costs that would have resulted from separate work
efforts at different times within the same area.
The anticipated scope of the project at the project development milestones differed in several
ways from the as-built project. At PE-entry:
Federal Transit Administration Page 10
The project was two miles longer largely because of the locations of both terminal
stations that were adjusted in PE and again in FD to their as-built locations.
Federal Transit Administration Page 11
The alignment in Tempe went through Arizona State University (ASU) campus and was
relocated during FD, because of ASU concerns, onto an existing freight railroad
alignment adjacent to the campus.
In-street track-work was assumed to be ballasted except at intersections and was specified
during FD to be embedded in pavement.
The project introduced traffic-signal priority for light rail at 94 traffic signals and was
expanded to 135 signals during FD and 149 signals prior to the FFGA.
The utility-free zone along the tracks was 10 feet from centerline and was expanded to
16-feet at the request of the city of Phoenix during PE.
The alignment used the existing Mill Avenue bridge across Tempe Town Lake but was
changed to new bridge in FD.
The line had one fewer station; the city of Tempe added a station at Centre Parkway as
part of the CNPA after the FFGA.
The maintenance facility was planned for the existing UPRR facility just east of
downtown Phoenix and sized for 40 vehicles but was relocated during FD to a 30-acre
site near the airport and sized for 58 vehicles.
The line had fewer park-and-ride spaces than the as-built project; a 300-space structure
was contributed late in FD and an additional lot was added with funds from the American
Rehabilitation and Recovery Act (ARRA) after the project opened.
Capital cost
The actual cost of the CP/EV light rail project was $1.405 billion in year-of-expenditure (YOE)
dollars, including $90 million in financing costs. Parallel improvements funded separately
through the CNPA cost $95.6 million. The average cost per mile was $67 million excluding
finance and CNPA costs. The physical elements of the project comprised 62 percent of total
project costs, with the remaining 38 percent going to ROW purchases, engineering,
administration and construction management, and testing and start-up costs.
Predicted costs at the project development milestones underestimated actual costs by decreasing
amounts. Predicted total costs in YOE dollars were $1.076 billion at PE-entry (a difference of
-23 percent from actual), $1.181 billion at FD-entry (a difference of -16 percent), and $1.412
billion at the FFGA (a difference of +1 percent). Much of the increase between FD-entry and the
FFGA was the inclusion of finance costs for the first time within the scope of the project.
Without finance costs, the predicted cost at the FFGA was $1.253 billion (a difference of -5
percent from actual costs). The project stayed within the FFGA budget by allocating the $71
million contingency reserve as needed and reducing the $159 million budgeted in the FFGA for
finance costs to $90 million.
A comparative analysis of the predicted costs in constant dollars – removing the effects of
inflation – suggests that only 17 percent of the under-prediction at PE-entry, and none of the
under-predictions at FD-entry and the FFGA, was caused by inflation effects. These effects
include the lengthening of the construction schedule (from an opening year of 2006 anticipated at
PE entry to the actual opening in December 2008) and unanticipated annual rates of inflation.
Consequently, nearly all of the underestimates are attributable to the changes documented above
in the physical scope of the project, unforeseen conditions, and understated unit prices for the
Federal Transit Administration Page 12
various project components. For example, contracts for project construction and station finishes
together exceeded the FFGA budget for these items by $99 million. Unforeseen conditions and
utility conflicts added another $34 million above the FFGA budget.
Transit service
The CP/EV light rail project has been implemented in the larger context of rapid expansion of
transit service in metropolitan Phoenix, supported by a series of voter-approved taxes dedicated
to transit. The result is a robust area-wide system of local, express, and Rapid bus service and,
since 2008, the first line of a planned light rail system.
At opening, the light rail line operated on weekdays with 10-minute headways all day and 20-
minute headways in the evening. In July 2010, as part of service reductions necessitated by the
economic recession and its impacts on both transit tax revenues and state transit funding,
weekday headways became 12 minutes all day while remaining at 20 minutes in the evening.
Headways on Saturdays are 15 minutes all day and 20 minutes in the evening. Headways on
Sundays and holidays are 20 minutes at all times. All CP/EV trains operate with 2-car consists.
One-way run-time on the 19.7 mile alignment is approximately 65 minutes including dwell times
at stations – an average operating speed of 18 mph.
Bus service in the Phoenix area is structured as a grid system, reflecting the fundamental
character of the area’s arterial street system. Some 65 percent of bus service was in the CP/EV
corridor prior to the opening of light rail. The 20-mile rail line replaced the Red Line bus route
that operated 2-way service from the Metrocenter Mall northwest of downtown Phoenix, through
downtown, and east to Tempe and Mesa. Segments of the Red Line bus route that are not served
by the 20-mile light rail line are now served by modifications to existing routes or the addition of
new bus routes. Bus service was reduced along the north-south segment of the rail line on
Central Avenue to avoid service redundancies. Bus service was also reduced along the east-west
segment on Washington Street. Some bus routes on streets parallel to both segments of the rail
alignment were re-routed to provide feeder connections.
Compared with METRO’s fiscal year 2008 (that ended in July 2008), the net impact of changes
within the CP/EV corridor by fiscal year 2010 was a 14 percent increase in vehicle-hours of bus
service and, including the new light rail service, a 24 percent increase in total vehicle-hours.
Area-wide, service increased over this 2-year interval by 33 percent. However, service
reductions in METRO’s FY 2011 eliminated much of this expansion: total vehicle-hours of
service dropped to levels that were nine percent above 2008 within the CP/EV corridor and five
percent above 2008 system-wide.
Throughout project development, light rail headways were planned for 10 minutes throughout
the day on weekdays, an accurate prediction of actual service levels during the first 18 months of
light rail operations. Headways were lengthened in July 2010 in response to the economic
recession and its consequences. End-to-end run-times on light rail were projected to be 56
minutes; actual run-times average 65 minutes. Anticipated changes in corridor bus services were
consistent with actual adjustments made to integrate the light rail line into the system. These
changes were governed by a regional bus-rail interface plan developed early in final design by
METRO, working with the cities of Phoenix, Tempe, and Mesa. Planned changes to the bus
system did not anticipate the 2010 roll-back of much of the service expansion accomplished over
the previous years.
Federal Transit Administration Page 13
Operating and maintenance costs
In METRO’s fiscal year 2011, after the small roll-back in light rail service in July 2010, the 20-
mile rail line cost $31.0 million to operate and maintain. Bus O&M costs increased initially after
light rail opening because of the net increase in bus service levels in the CP/EV corridor and in
the region. After service roll-backs early in fiscal year 2011, however, O&M costs for system-
wide fixed-route bus operations were nine percent below 2008 levels. With the addition of light
rail and higher dial-a-ride costs, total O&M costs increased by nine percent over that interval.
During project development, METRO consistently anticipated annual O&M costs for light rail in
the range of $26-27 million in constant 2010 dollars (removing inflation effects to enable
meaningful comparisons). The $4-5 million under-estimate is attributable to under-estimates of
both the vehicle-miles of service actually provided on the line (particularly on weekends and for
special events) and the cost per mile for that service.
Ridership
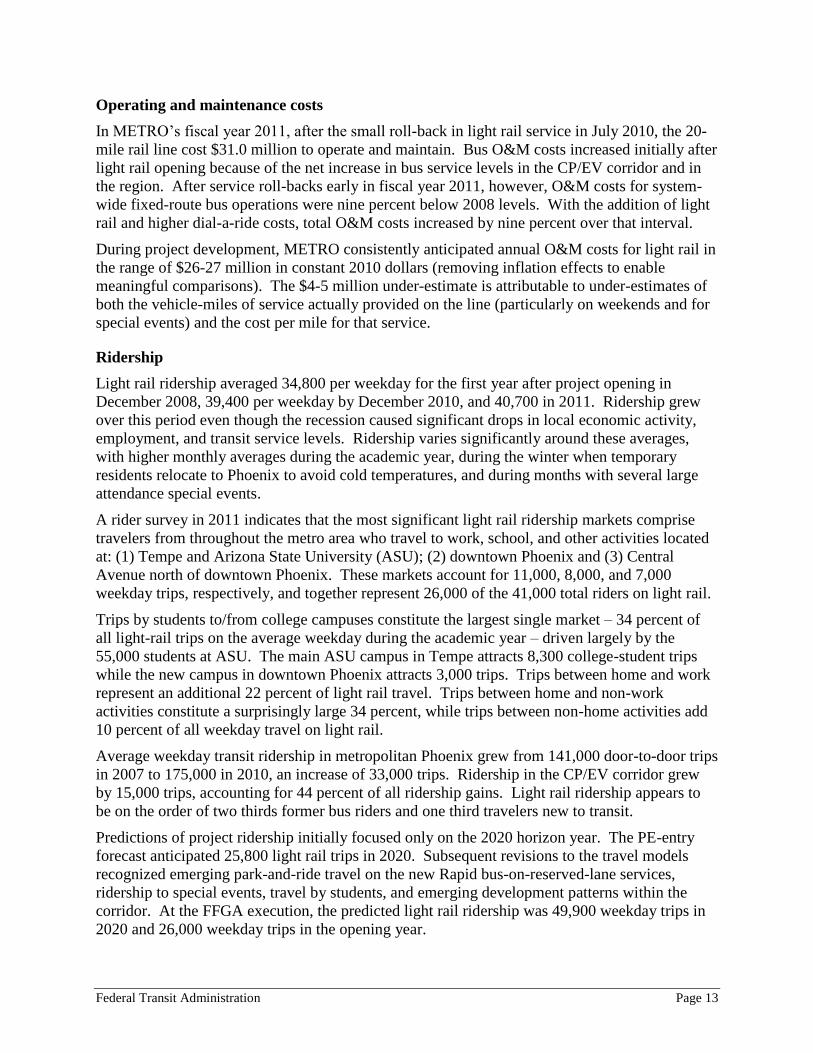
Light rail ridership averaged 34,800 per weekday for the first year after project opening in
December 2008, 39,400 per weekday by December 2010, and 40,700 in 2011. Ridership grew
over this period even though the recession caused significant drops in local economic activity,
employment, and transit service levels. Ridership varies significantly around these averages,
with higher monthly averages during the academic year, during the winter when temporary
residents relocate to Phoenix to avoid cold temperatures, and during months with several large
attendance special events.
A rider survey in 2011 indicates that the most significant light rail ridership markets comprise
travelers from throughout the metro area who travel to work, school, and other activities located
at: (1) Tempe and Arizona State University (ASU); (2) downtown Phoenix and (3) Central
Avenue north of downtown Phoenix. These markets account for 11,000, 8,000, and 7,000
weekday trips, respectively, and together represent 26,000 of the 41,000 total riders on light rail.
Trips by students to/from college campuses constitute the largest single market – 34 percent of
all light-rail trips on the average weekday during the academic year – driven largely by the
55,000 students at ASU. The main ASU campus in Tempe attracts 8,300 college-student trips
while the new campus in downtown Phoenix attracts 3,000 trips. Trips between home and work
represent an additional 22 percent of light rail travel. Trips between home and non-work
activities constitute a surprisingly large 34 percent, while trips between non-home activities add
10 percent of all weekday travel on light rail.
Average weekday transit ridership in metropolitan Phoenix grew from 141,000 door-to-door trips
in 2007 to 175,000 in 2010, an increase of 33,000 trips. Ridership in the CP/EV corridor grew
by 15,000 trips, accounting for 44 percent of all ridership gains. Light rail ridership appears to
be on the order of two thirds former bus riders and one third travelers new to transit.
Predictions of project ridership initially focused only on the 2020 horizon year. The PE-entry
forecast anticipated 25,800 light rail trips in 2020. Subsequent revisions to the travel models
recognized emerging park-and-ride travel on the new Rapid bus-on-reserved-lane services,
ridership to special events, travel by students, and emerging development patterns within the
corridor. At the FFGA execution, the predicted light rail ridership was 49,900 weekday trips in
2020 and 26,000 weekday trips in the opening year.
Federal Transit Administration Page 14
The FFGA prediction of 26,000 trips opening-year trips on light rail is lower than actual 2011
ridership by 15,200 trips, or 37 percent. The FFGA prediction is also lower than actual 2011
ridership on the entire transit system by 56,300 trips, or 32 percent.
Careful analysis by METRO indicates that both under-predictions result largely from two
problems in the underlying demographic forecasts used to make the FFGA predictions. First, the
demographic forecasts did not anticipate the rapid growth in college-student enrollment,
particularly at the ASU Tempe campus and the new ASU downtown campus. As a result, the
FFGA opening-year forecast underestimated weekday college-student travel on light rail by
9,000 trips and on the entire transit system by 26,500 trips. Second, the demographic forecasts
did not anticipate the rapid growth in the number of carless households and low-paid temporary
workers associated with the boom in the construction labor market in metropolitan Phoenix from
the 1990s through 2005. As a result, the FFGA opening-year forecast underestimated travel by
members of carless households by 3,800 weekday trips on light rail, and 25,000 weekday trips on
the entire transit system.
One component of the underestimates appears to be specific to rail. The FFGA prediction
included only 1,300 weekday lightrail trips between non-home activities (like lunchtime trips
from work to restaurants and retail stores) while actual ridership includes 4,000 weekday light
rail trips. A second rail-specific difference in ridership patterns appears in the characteristics of
riders traveling between home and various non-work activities. Light rail riders making these
trips are much more likely than bus riders to come from car-owning households with higher
incomes who often drive and park at a rail station to begin their trips. This difference suggests
that travelers with choices are making discretionary trips on light rail – to restaurants, cultural
centers, and sporting events – that do not appear in significant numbers in the bus system.
Federal Transit Administration Page 15
Wilsonville to Beaverton Commuter Rail Project; Washington and
Multnomah Counties, Oregon
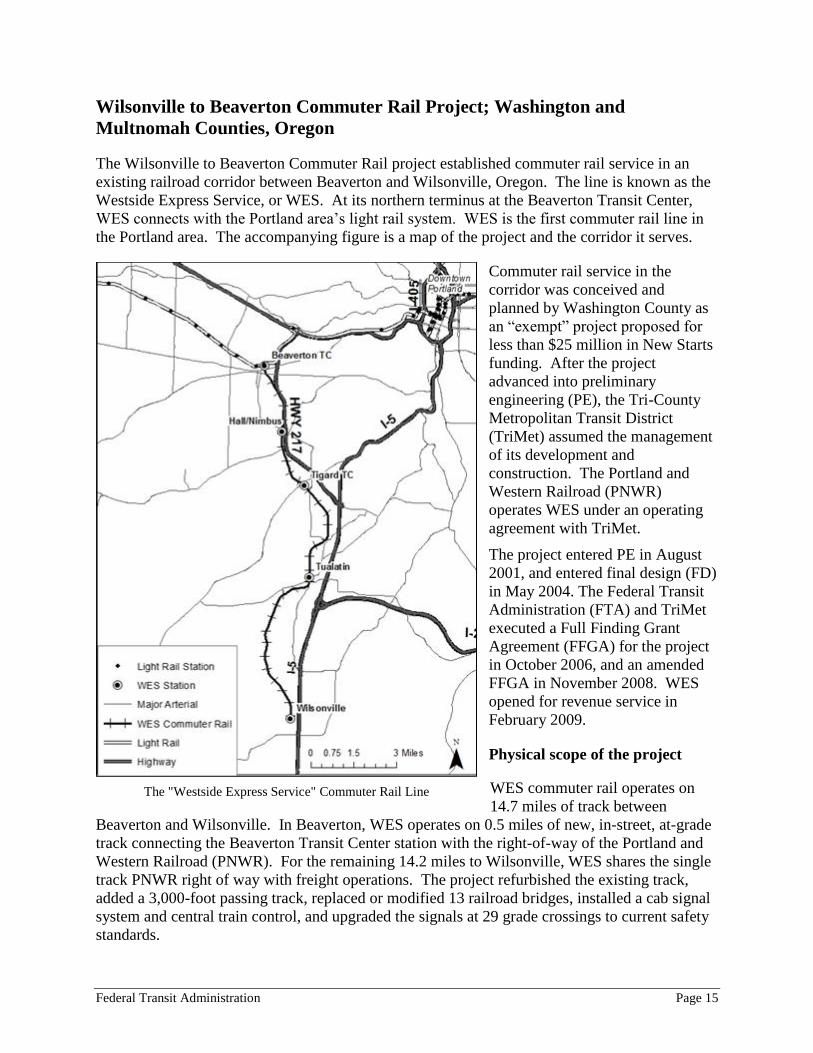
The Wilsonville to Beaverton Commuter Rail project established commuter rail service in an
existing railroad corridor between Beaverton and Wilsonville, Oregon. The line is known as the
Westside Express Service, or WES. At its northern terminus at the Beaverton Transit Center,
WES connects with the Portland area’s light rail system. WES is the first commuter rail line in
the Portland area. The accompanying figure is a map of the project and the corridor it serves.
The "Westside Express Service" Commuter Rail Line
Commuter rail service in the
corridor was conceived and
planned by Washington County as
an “exempt” project proposed for
less than $25 million in New Starts
funding. After the project
advanced into preliminary
engineering (PE), the Tri-County
Metropolitan Transit District
(TriMet) assumed the management
of its development and
construction. The Portland and
Western Railroad (PNWR)
operates WES under an operating
agreement with TriMet.
The project entered PE in August
2001, and entered final design (FD)
in May 2004. The Federal Transit
Administration (FTA) and TriMet
executed a Full Finding Grant
Agreement (FFGA) for the project
in October 2006, and an amended
FFGA in November 2008. WES
opened for revenue service in
February 2009.
Physical scope of the project
WES commuter rail operates on
14.7 miles of track between
Beaverton and Wilsonville. In Beaverton, WES operates on 0.5 miles of new, in-street, at-grade
track connecting the Beaverton Transit Center station with the right-of-way of the Portland and
Western Railroad (PNWR). For the remaining 14.2 miles to Wilsonville, WES shares the single
track PNWR right of way with freight operations. The project refurbished the existing track,
added a 3,000-foot passing track, replaced or modified 13 railroad bridges, installed a cab signal
system and central train control, and upgraded the signals at 29 grade crossings to current safety
standards.
Federal Transit Administration Page 16
The project built five passenger stations, four with park-and-ride lots with a total of 700 spaces,
and purchased a vehicle fleet of three diesel multiple units (DMUs) and one unpowered
passenger car. (TriMet subsequently used local funds to purchase two additional self-powered
vehicles needed as spares for WES operations.) Stations accommodate 2-car trains with high
platforms that provide level boarding for their full lengths. The project also funded an
agreement with PNWR for shared use of its track, the realignment of the 0.5-mile street segment
in Beaverton, and acquisition of property for the street realignment and construction of the park-
and-ride lots. The new maintenance and storage facility near the Wilsonville station supports the
current 6-vehicle fleet and has sufficient capacity for two additional vehicles.
The anticipated scope of the project through planning and project development was quite
consistent with the as-built project in terms of its alignment, number of stations, and termini.
Adjustments occurred in the planned vehicle fleet (reduced from six to four vehicles during
preliminary engineering in order to reduce costs) and the location of the Washington Square
station (moved 0.6 miles during final design to a location that permitted the addition of a park-
and-ride lot but provided less direct pedestrian access to adjacent commercial areas).
More significant changes occurred in the scope of work to upgrade the existing PNWR track.
Initial plans called only for basic repair, including the welding and surfacing of existing tracks
and replacement of deteriorated railroad ties only (estimated at about one-third of all railroad
ties). The negotiated shared-use agreement with PNWR and subsequent amendments required
the full re-construction of the roadbed, improvements to an operating rail dispatch center in
Albany, Oregon, installation of on-board cab signals on all existing freight locomotives that may
operate in the corridor, and installation of new rail over the 14.2 miles of shared track.
Scope modifications continued after the FFGA, including roadway traffic-flow and safety
improvements at crossings and stations, fencing and pedestrian crossings, enhancements to the
0.5-mile street-running segment in Beaverton, and utility relocation throughout the alignment.
Capital cost
The actual cost of the project was $162.0 million in year-of-expenditure (YOE) dollars. Some
68 percent of total costs were incurred for physical facilities (guideway, structures, and stations –
41 percent; vehicles – 13 percent; systems – 10 percent, and the maintenance facility – 3
percent). An additional 24 percent of total costs were for engineering and design. The average
cost per mile was $11.0 million including all costs.
The YOE predictions of capital costs at the project development milestones consistently
underestimated actual costs. The predicted cost at PE-entry was $84.8 million (-48 percent); at
FD-entry $103.5 million (-36 percent); and at the FFGA $117.3 (-28 percent). The principal
cause of these underestimates was the continuing evolution of negotiated requirements to
upgrade the freight rail line to permit shared use by commuter rail trains. The PE-entry
prediction assumed only modest upgrades. The initial agreement with PNWR, signed late in
preliminary engineering, informed the cost predictions at FD-entry and the FFGA but continued
to evolve throughout final design and after the FFGA execution. The largest unanticipated costs
were for retrofitting PNWR fleet of locomotives for the updated train control system, track bed
rehabilitation for the entire corridor, and unanticipated property acquisition costs associated with
park-and-ride access and access closures. The complex nature of property acquisitions, freight
Federal Transit Administration Page 17
railroad negotiations, and intergovernmental coordination resulted in higher than expected
project management and legal services.
Comparisons in constant dollar terms that remove the effects of inflation suggest that
unanticipated inflation caused 25 percent of the YOE-dollar underestimates at PE-entry and FD-
entry, and 18 percent of the YOE-dollar underestimate at the FFGA. Consequently,
unanticipated scope items and the added complexity of upgrading the freight railroad corridor
contributed the other 75 to 82 percent. Unanticipated inflation effects arise with lengthening
schedules for project development and construction and with higher than expected annual rates
of inflation. The cost predictions for WES experienced both causes. At PE-entry in August
2001, the schedule anticipated project opening in September 2004; by FD-entry in May 2004, the
anticipated opening had moved to September 2007; and by the FFGA in October 2006, it was
November 2008. Much of this slippage was caused by the increasing complexity of the project
scope. Part was caused by the project’s increasing costs and the need to seek a larger amount of
FTA capital funding. This larger funding request meant the project could no longer be “exempt”
from FTA’s rating and evaluation process for major capital grants. The evaluation process
required additional time for FTA reviews of cost estimates and ridership forecasts as well as
adjustments by TriMet to the project scope to control costs and to meet FTA cost-effectiveness
requirements. Difficulties with the vehicle manufacturer added several months at the end of the
schedule – not affecting construction costs but causing FTA and TriMet to execute an amended
FFGA solely to reflect the delay in project opening.
Annual rates of inflation in construction costs were higher than expected both nationally and in
the Portland area during this period as steel, concrete, and labor prices were driven by the global
economy and weather events in the United States. Between FD-entry in 2004 and the FFGA in
2007, for example, inflation in construction prices was 23 percent, well above the inflation
projected by TriMet and other project sponsors during that interval.
Transit service
On weekdays, WES trains depart every 30 minutes in each direction between 5:30 am and 9:30
am, and again between 3:00 pm and 7:00 pm. The service does not operate at other times of the
day or on weekends. End-to-end runtime is 27 minutes (33 mph), including dwell times at
stations and the 10 mph street-running segment in Beaverton. On-time performance has
averaged 98 percent since service began. This performance reflects a provision in the operating
agreement between PNWR and TriMet that gives PNWR a financial incentive to maintain
monthly average on-time performance of 98 percent or better. In FY 2011, incentive payments
totaled $265,000. PNWR has largely shifted freight operations in the corridor to times outside of
the peak-period-only WES operations.
At the Beaverton Transit Center, WES has a cross-platform connection to the MAX light rail
system that provides service every six minutes to points east, including downtown Portland, and
every 10 minutes to points west. Eleven connecting bus routes provide 30 departures per hour.
Bus connections are available at all other WES stations: Hall/Nimbus (two routes with four
departures per hour); Tigard Transit center (five routes, 14 departures per hour); Tualatin (one
route, two departures per hour); and Wilsonville (seven routes, 14 departures per hour). Bus
services in the Wilsonville area were reconfigured with the opening of WES so that all bus routes
stop at the Wilsonville station. Soon after WES opening, the national economic recession caused
a downturn in payroll-tax revenues that support TriMet operations – leading to modest
Federal Transit Administration Page 18
reductions in bus services in the corridor. These reductions largely focused on off-peak periods
and therefore have not affected connections with the peak-period-only WES schedule.
Service plans prepared during project development accurately anticipated actual WES service
levels. The only significant difference was that the plans included no significant changes to bus
services in the corridor, while the actual outcome included a restructuring of bus service in the
Wilsonville area to connect all routes to the Wilsonville WES station.
Operating and maintenance costs
WES commuter rail service operates under an agreement between TriMet and PNWR. TriMet
maintains vehicles and facilities, including stations and park-and-ride lots. PNWR operates the
commuter rail trains, provides dispatch functions, carries the operating insurance, and maintains
the right-of-way. Commuter rail services cost approximately $5.9 million to provide in FY 2011
– approximately $3.9 million in PNWR provided services and just over $1.9 million in TriMet
services, materials, and supplies. Commuter rail service represented two percent of all TriMet
O&M costs in FY 2011. The opening of WES had no significant impacts on bus O&M costs in
the corridor.
Predictions of WES O&M costs at the project development milestones underestimate the actual
outcome. Predictions of costs for PNWR cost centers understated actual costs by $1.3 to $1.4
million, primarily because of underestimates of costs for train operations and, to a smaller
degree, insurance. Predictions of costs for TriMet cost centers overstated actual costs by $0.4 to
$0.5 million, yielding underestimates of total annual O&M costs for WES of roughly $1 million.
Ridership
Over the first two years of operation, WES ridership grew from 1,200 trips to 1,600 trips.
Ridership continues to grow, reaching 1,700 trips per day in 2012, all over a period when
financially driven reductions in TriMet services led to no growth in system-wide ridership.
Three-quarters of WES riders are traveling between home and work. Some 45 percent of riders
report that they have no car available for the trip. Only 21 percent of riders parked at a WES
park-and-ride station while another 10 percent parked on other transit routes (primarily at MAX
light rail stations) and transferred to/from WES. Aggregate usage of the four WES park-and-ride
lots averages 45 percent with no lot exceeding 75 percent of capacity; some of the parking
utilization is by cars parked by riders boarding buses at WES stations. Among all WES riders,
52 percent make one transfer and 32 percent make two or more transfers to complete their trips;
only 16 percent require no transfer.
Nearly half (48 percent) of all WES riders travel from residences in and near the WES corridor
to destinations within the corridor. Another 32 percent travel from those same residential areas
to other destinations on the Westside including 16 percent to Westside areas east of the corridor,
13 percent to areas west of Beaverton extending to Hillsboro, and 4 percent to outlying areas.
Only 12 percent of WES trips are to downtown Portland and 7 percent are to areas east of
downtown and the Willamette River. The small market to downtown Portland and the Eastside
reflect the substantial TriMet express-bus service from the southern parts of the corridor directly
to downtown. This service captures most of the travel market to downtown and the Eastside.
Consequently, WES primarily serves north-south travel between parts of the Westside. It
competes effectively in this generally suburban market where it provides a transit alternative
Federal Transit Administration Page 19
with travel-times competitive with travel on Highway 217, which is heavily congested
throughout the peak periods.
Overall transit ridership in the WES corridor increased by approximately 1,000 trips per day
suggesting that roughly 60 percent of WES riders are new to transit while 40 percent have shifted
from buses to WES.
Ridership predictions during project development focused on the horizon-year forecasts used in
FTA evaluations of proposed projects. Predictions of opening-year ridership were interpolated
from the horizon-year forecasts. Opening-year predictions were 2,400 at PE-entry, 2000 at FD-
entry, and 1,600 at the FFGA. The latter two predictions reflected a “likelihood analysis”
required by FTA that reduced the number of predicted WES rider in travel markets where the
generation of commuter rail trips appeared to be less likely. These markets included travelers
from households with a car for each adult worker whose WES trips would involve both park-
and-ride access and two or more transfers to reach their destination. The net effect of the
likelihood analysis was to reduce total opening-year WES ridership by 20 percent. The
interpolated opening-year predictions at all three milestones are reasonable representations of the
actual 1,600 riders two years after project opening; the FFGA prediction matches the actual
ridership outcome exactly.
Federal Transit Administration Page 20
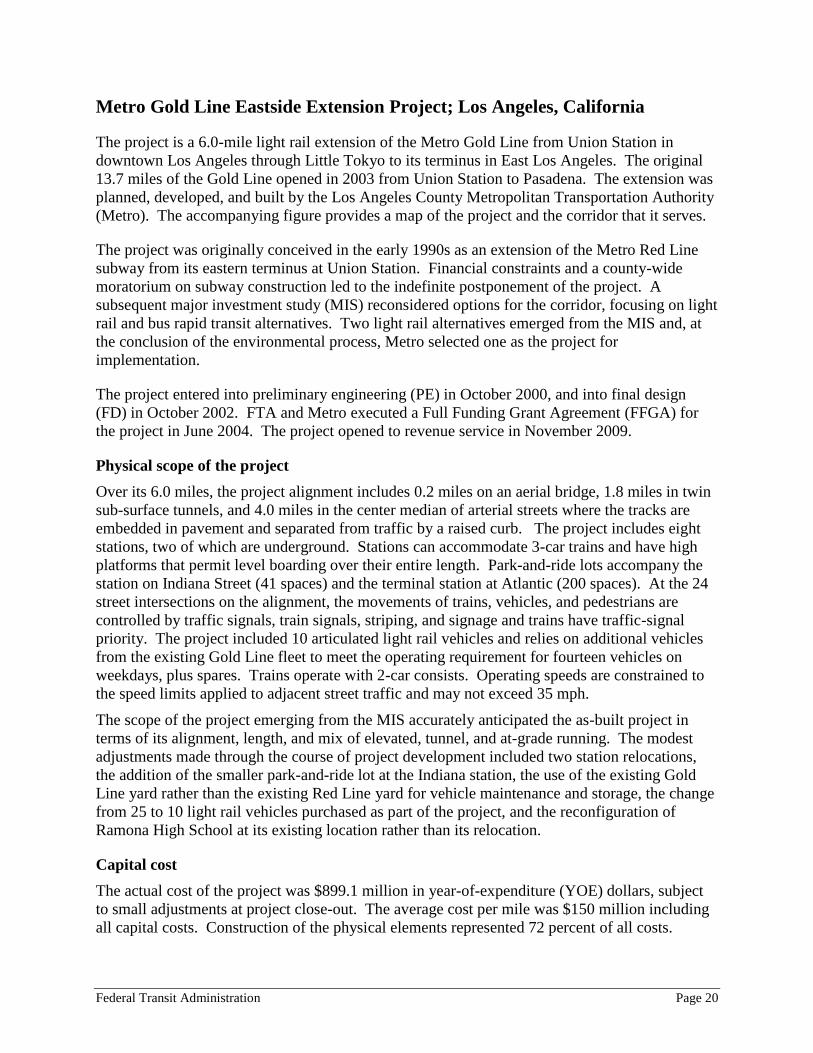
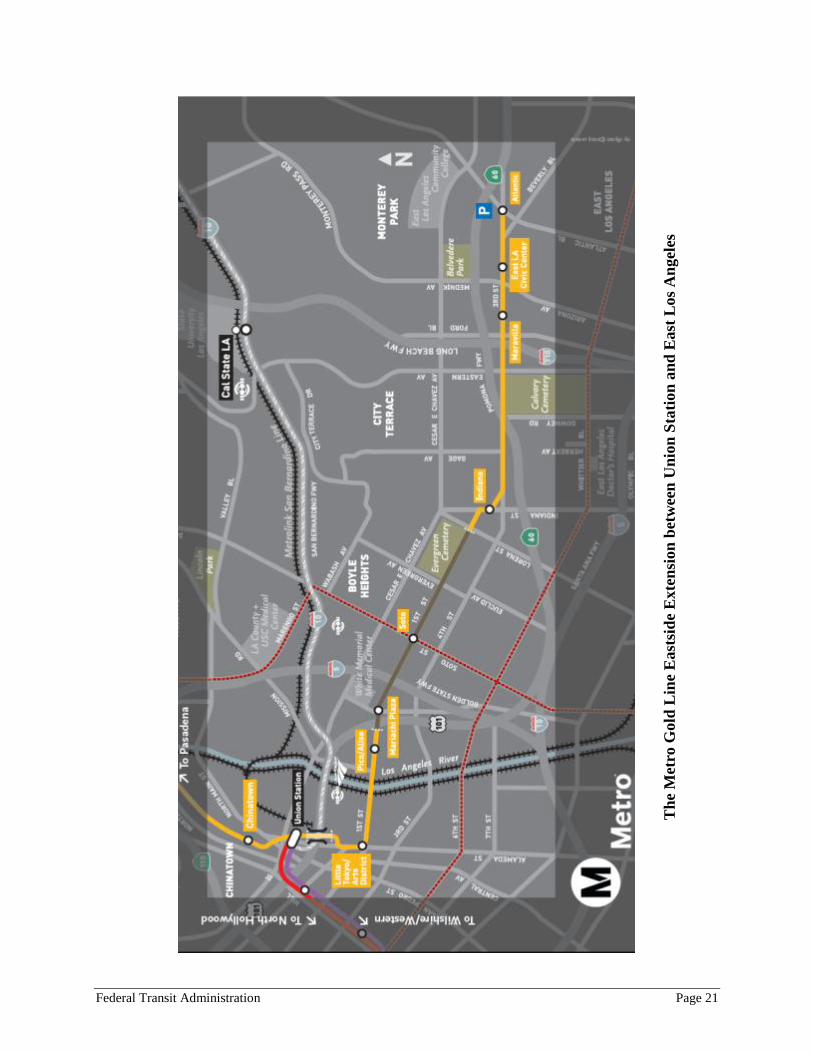
Metro Gold Line Eastside Extension Project; Los Angeles, California
The project is a 6.0-mile light rail extension of the Metro Gold Line from Union Station in
downtown Los Angeles through Little Tokyo to its terminus in East Los Angeles. The original
13.7 miles of the Gold Line opened in 2003 from Union Station to Pasadena. The extension was
planned, developed, and built by the Los Angeles County Metropolitan Transportation Authority
(Metro). The accompanying figure provides a map of the project and the corridor that it serves.
The project was originally conceived in the early 1990s as an extension of the Metro Red Line
subway from its eastern terminus at Union Station. Financial constraints and a county-wide
moratorium on subway construction led to the indefinite postponement of the project. A
subsequent major investment study (MIS) reconsidered options for the corridor, focusing on light
rail and bus rapid transit alternatives. Two light rail alternatives emerged from the MIS and, at
the conclusion of the environmental process, Metro selected one as the project for
implementation.
The project entered into preliminary engineering (PE) in October 2000, and into final design
(FD) in October 2002. FTA and Metro executed a Full Funding Grant Agreement (FFGA) for
the project in June 2004. The project opened to revenue service in November 2009.
Physical scope of the project
Over its 6.0 miles, the project alignment includes 0.2 miles on an aerial bridge, 1.8 miles in twin
sub-surface tunnels, and 4.0 miles in the center median of arterial streets where the tracks are
embedded in pavement and separated from traffic by a raised curb. The project includes eight
stations, two of which are underground. Stations can accommodate 3-car trains and have high
platforms that permit level boarding over their entire length. Park-and-ride lots accompany the
station on Indiana Street (41 spaces) and the terminal station at Atlantic (200 spaces). At the 24
street intersections on the alignment, the movements of trains, vehicles, and pedestrians are
controlled by traffic signals, train signals, striping, and signage and trains have traffic-signal
priority. The project included 10 articulated light rail vehicles and relies on additional vehicles
from the existing Gold Line fleet to meet the operating requirement for fourteen vehicles on
weekdays, plus spares. Trains operate with 2-car consists. Operating speeds are constrained to
the speed limits applied to adjacent street traffic and may not exceed 35 mph.
The scope of the project emerging from the MIS accurately anticipated the as-built project in
terms of its alignment, length, and mix of elevated, tunnel, and at-grade running. The modest
adjustments made through the course of project development included two station relocations,
the addition of the smaller park-and-ride lot at the Indiana station, the use of the existing Gold
Line yard rather than the existing Red Line yard for vehicle maintenance and storage, the change
from 25 to 10 light rail vehicles purchased as part of the project, and the reconfiguration of
Ramona High School at its existing location rather than its relocation.
Capital cost
The actual cost of the project was $899.1 million in year-of-expenditure (YOE) dollars, subject
to small adjustments at project close-out. The average cost per mile was $150 million including
all capital costs. Construction of the physical elements represented 72 percent of all costs.
Federal Transit Administration Page 21
le
sge
ast
Los
An
Ed
an
ion
tat
Son
Un
inee
twe b
sion
next
Eeast
sid
Eein
Ld
o G
ol
tre Me
hT
Federal Transit Administration Page 22
In YOE dollars, the predicted capital cost at PE-entry was $759.5 million (-17 percent compared
to the actual YOE cost), at FD-entry $817.9 million (-9 percent), and at the FFGA $898.8 million
(+1 percent). The under-estimate at PE-entry was caused primarily by underestimates for
construction and special conditions associated, in particular, with the 2-mile tunnel segment, and
professional services including design and construction management. The under-estimate at FD-
entry was again caused primarily by underestimates for construction and special conditions; a
substantially higher estimate for professional services brought that item into alignment with its
actual cost outcome. The underestimates of costs for construction and special conditions
continued at the FFGA but were offset by the unallocated contingency reserve of 10 percent in
the FFGA – leaving a surplus of approximate $10 million.
Transit service
On weekdays, the entire Gold Line operates 6-minute headways during the peak periods, 12-
minute headways during mid-day and 20-minute headways in the evening. Peak-period
headways were tightened with the opening of the Eastside Extension from the 10-minute service
provided on the initial Gold Line segment to 7.5 minutes on the entire line, and then tightened
again to the current 6-minute-headway service. Running time on the 6.0-mile extension is 24
minutes including dwell times at stations – an average speed of 15.0 mph.
Metro made only limited changes to bus services in conjunction with the Eastside Extension
project. Service on one bus route was dropped east of the Indiana Street station but later
restored, through the rerouting of a second route, in response to a petition from riders. Metro
adjusted a third route, a neighborhood circulator, to provide connections with the Eastside
Extension at its terminal station at Atlantic.
For much of project development, Metro anticipated 5-minute headways in the peak-periods, 12
minutes during mid-day, and 20 minutes in the evenings in the 2020 horizon year – service levels
that match closely the actual service just two years after project opening. The FFGA specified
less service in the peak periods – 10-12 minute headways – a policy that was never implemented.
At the early milestones, runtimes were assumed to be 16 minutes from Union Station to the
terminus at Atlantic. More detailed analysis during FD added dwell times at stations and delays
caused by at-grade intersections, producing the 22-minute runtime anticipated in the FFGA –
reasonably close to the actual 24-minute actual runtime. Throughout project development, Metro
anticipated limited changes to the bus system consistent with the actual outcome.
Operating and maintenance costs
In constant dollars that remove general inflation effects from the comparisons, the costs of Gold
Line operations and maintenance increase from $38.9 million before the Eastside Extension to
$58.6 million after the extension and subsequent tightening of peak-period headways. Of this
$19.7 million increase, $17.8 million is attributable to operations and maintenance of the
extension.
During project development, Metro projected the O&M cost of the extension (in 2020, but with
anticipated service levels that closely match current service on the project) at $15-16 million –
within 15 percent of the actual outcome.
Federal Transit Administration Page 23
Ridership
Two years after opening, ridership on the project was 13,000 trips per average weekday.
During project development, predicted ridership on the project for the 2020 horizon year was
18,000 trips at PE-entry, 15,200 trips at FD-entry, and 16,300 trips at the FFGA. No opening-
year predictions were prepared. The pace of ridership growth on the project suggests that it is
on track to meet, and perhaps exceed, the 2020 horizon-year predictions.
Federal Transit Administration Page 24
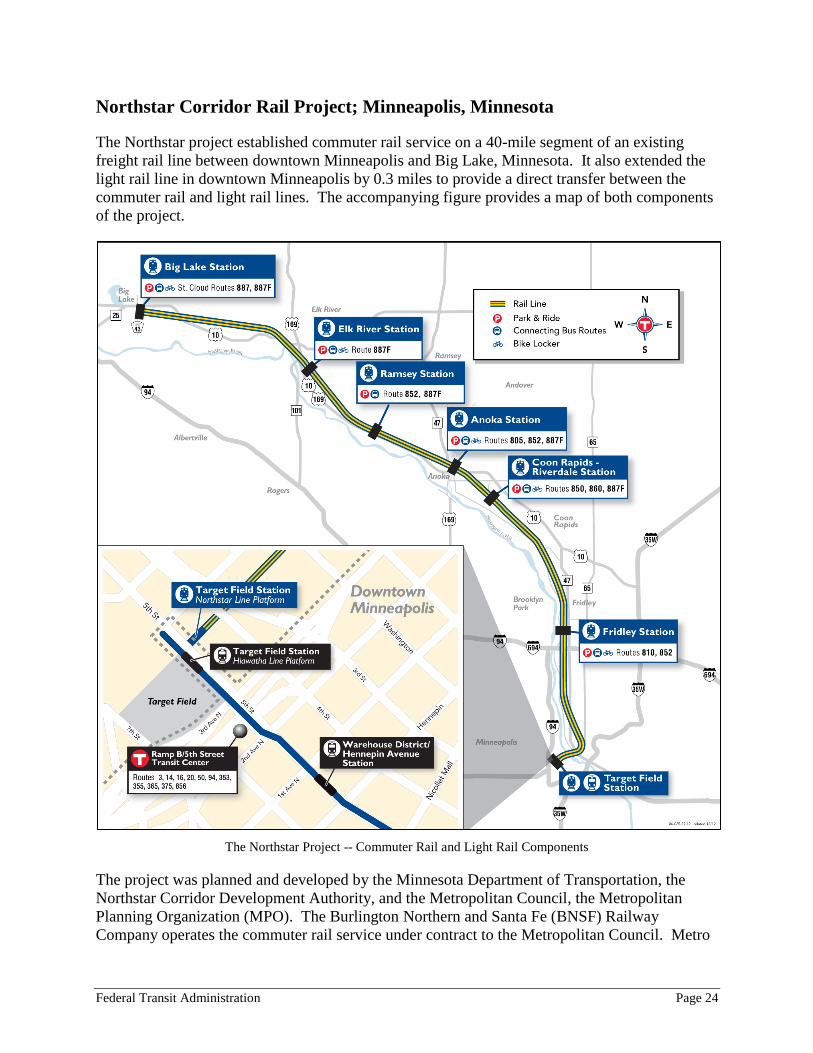
Northstar Corridor Rail Project; Minneapolis, Minnesota
The Northstar project established commuter rail service on a 40-mile segment of an existing
freight rail line between downtown Minneapolis and Big Lake, Minnesota. It also extended the
light rail line in downtown Minneapolis by 0.3 miles to provide a direct transfer between the
commuter rail and light rail lines. The accompanying figure provides a map of both components
of the project.
The Northstar Project -- Commuter Rail and Light Rail Components
The project was planned and developed by the Minnesota Department of Transportation, the
Northstar Corridor Development Authority, and the Metropolitan Council, the Metropolitan
Planning Organization (MPO). The Burlington Northern and Santa Fe (BNSF) Railway
Company operates the commuter rail service under contract to the Metropolitan Council. Metro
Federal Transit Administration Page 25
Transit, a division of the Metropolitan Council, operates the light rail line and bus services in the
Minneapolis/St. Paul metropolitan area.
A 1988 major investment study (MIS) identified commuter rail as the preferred alternative for
the corridor. The line was to extend from downtown Minneapolis to the metropolitan area of St.
Cloud, Minnesota, a distance of approximately 80 miles. Preliminary engineering (PE) of that
project began in June 2000, and the environmental process concluded in December 2002, with
issuance of a National Environmental Policy Act (NEPA) Record of Decision by the Federal
Transit Administration (FTA).
Project development stalled shortly thereafter as state financial support for the project was in
question and difficulties became apparent in the ability of the project to meet FTA’s revised cost-
effectiveness criterion.
In 2005, project sponsors initiated a “PE validation” study to resolve questions on cost-
effectiveness. That study concluded in September 2005, with an initial segment of 40 miles that
would meet the cost-effectiveness criterion. After resolution of state financial support, the
shorter project entered final design (FD) in September 2006, received a Full Funding Grant
Agreement (FFGA) in December 2007, and opened to service ahead of the FFGA schedule in
November 2009.
Physical scope of the project
The Northstar Corridor rail line extends along 40 miles of the active BNSF double-tracked
mainline freight railroad between Minneapolis and Big Lake. Because commuter service is
mixed with freight operations, passenger cars are compliant with safety regulations of the
Federal Railroad Administration for mixed operations.
Northstar Corridor rail relies on operating easements purchased from BNSF. Consequently, the
project included very little track construction for the commuter rail line – only 0.7 miles for track
primarily at the terminal stations. The operating easement agreement provided that
modifications to signal and communication systems necessary to accommodate commuter rail
would be made by BNSF.
Current features of the commuter rail line include seven stations (two funded outside the FFGA:
Fridley and Ramsey), six locomotives, 18 passenger cars, and a new vehicle maintenance facility
at the Big Lake terminus. One of the six locomotives was added to the fleet shortly after the start
of revenue service. The station at Ramsey was added three years after revenue service began.
The six commuter rail stations outside of downtown Minneapolis each have a park-and-ride lot
and provisions for kiss-and-ride and bus access. The six park-and-ride lots have a total of 2,800
spaces. Each station platform is 425 feet long and has a mini-high platform that provides level
boarding using a bridge plate for one car on each train.
The Northstar terminal station in Minneapolis is located at the new Target Field home of the
Minnesota Twins baseball club. The ballpark incorporates the vertical circulation elements of
the pedestrian connection between the Northstar station and the new light rail station. These
elements were designed, funded, and built as part of the ballpark’s construction outside of the
FFGA.
The 18 passenger cars include six cab and 12 standard coaches. All are double-decked with two
low-platform doors and an average seating capacity for 140 passengers. All cars are equipped
Federal Transit Administration Page 26
with wheelchair lifts, although ADA access is typically provided using the mini-high platforms
located at each station.
The new maintenance facility at the Big Lake terminus includes a 50,000 square-foot
maintenance building equipped to support daily maintenance operations and administrative
offices. A train-wash facility is adjacent to the maintenance building and a train yard provides
overnight storage for the entire Northstar fleet of rolling stock.
The light rail component of the project is a one-station extension of the Hiawatha light rail line
on 5th
Street North in downtown Minneapolis. Elements include a new light rail station built on
a bridge structure at Target Field, 0.6 miles (including a tail-track beyond the terminal station) of
new 2-track line with overhead electrification, and two additional light rail vehicles needed to
maintain headways on the now-longer Hiawatha line.
The conclusion of the “PE validation” study identified the shorter segment of the commuter rail
line, and the anticipated scope of the project matched the actual outcome quite closely. Most
basic elements of the predicted scope were in place at the start of revenue service: a 40-mile
commuter rail line operating on BNSF tracks between Big Lake and downtown Minneapolis
serving six stations (five with park-and-ride lots), connecting to an extended light rail line in
downtown, and using five locomotives and 18 passenger cars. One significant change in scope
was the assignment of responsibility to BNSF to improve BNSF track facilities, signals, and
systems to accommodate commuter rail. This assignment occurred as part of the operating
easement agreement. The “PE validation” study anticipated that these improvements to BNSF
infrastructure would be made by the project sponsors, but negotiations prior to entering final
design resolved the issue, and subsequent milestones accurately anticipated the actual approach.
One noteworthy improvement anticipated at “PE validation” but not ultimately implemented by
BNSF, was construction of a third mainline track for six miles in the vicinity of the locally-
funded Fridley station.
Capital cost
The cost of the as-built project at the start of revenue service was $308.5 million in year-of-
expenditure (YOE) dollars. This total includes $303.3 million for project scope identified in the
FFGA; $2.6 million for the eighteenth passenger car, which was purchased with contingency
funds before commencement of revenue service; and $2.6 million for the vertical circulation
elements designed, funded, and built by the Minnesota Twins outside the FFGA. It does not
include the cost of the locally funded stations at Fridley or Ramsey or the sixth locomotive,
which was purchased with contingency funds after commencement of revenue service.
The aggregate unit cost of the as-built project, excluding the contribution of the Minnesota
Twins, was $7.7 million per mile – $6.1 million per mile without the vehicles. The low per-mile
cost is a direct reflection of the use of existing tracks and avoidance of any substantial guideway
construction elements.
The predicted capital cost developed during “PE validation” was $265.1 million in YOE dollars,
an underestimate of 14 percent. This cost estimate was based on project scope and schedule
assumptions that were quite accurate, with the exception of still-unknown outcome of
negotiations with BNSF. This uncertainty was the principal source of the under-prediction. The
negotiations changed the premise carried through “PE validation” – that Northstar would provide
upgrades to the existing BNSF rail infrastructure needed to accommodate commuter rail service
Federal Transit Administration Page 27
– to an agreement that Northstar would pay BNSF $107.5 million for operating easements and
BNSF would make the infrastructure improvements. This new agreement shifted costs from
track and systems work to right-of-way acquisitions and increased the predicted total cost for
these three categories by $38.5 million between “PE validation” and entry to final design.
At entry to final design, predicted YOE costs were $307.2 million – within 1 percent of actual
costs. However, between entry to final design and execution of the FFGA, FTA required project
partners to perform a risk assessment, partly due to a concern that value engineering and other
cost saving efforts of the project sponsors may have been too aggressive. The risk assessment
led to the addition of $10 million to the project budget – most of which was assigned to
unallocated contingency.
At execution of the FFGA, predicted YOE costs were $317.4 million (plus $2.6 million provided
by the Twins outside of the FFGA). This prediction was higher than actual costs by less than 4
percent. The accuracy of this forecast reflects the settled negotiations with BNSF, the resulting
certainty of the price for operating easements versus the risks in actually doing the work, and the
subsequent adherence to the construction schedule.
As the project developed, it became clear that a sixth locomotive and eighteenth cab-car – scope
items removed during value engineering – would be needed to ensure reliable operation. The
partial draw-down of contingency funds was primarily for these elements. The eighteenth cab
car was acquired shortly before revenue service began, and the sixth locomotive was acquired
shortly after.
Transit service
Northstar provides five peak-direction trains on approximately 30-minute headways during
weekday mornings and afternoons, plus one train in the reverse direction, and no service at other
times of day. Northstar operates three trains in each direction on Saturdays and Sundays.
Special-events trains serve riders attending baseball games, football games, and other events.
End-to-end run time is 49 minutes – with an average speed of 48 miles per hour. Track speeds
range between 79 mph on the western segments to 25 mph near the downtown Minneapolis area.
Light rail service headways are unchanged from pre-Northstar levels at 7 to 10 minutes in peak
periods and 15 to 30 minutes at other times of day.
Two bus routes provide connecting service to Northstar Corridor rail. One route operates in the
peak period on 30-minute headways to connect a park-and-ride lot in St. Cloud to the Big Lake
terminal station – a distance of 40 miles. The other operates in downtown Minneapolis to
connect the terminal station to southern parts of the central business district not conveniently
accessed via the light rail connection.
Other coordinated bus services were launched as part of the Northstar opening but have since
been terminated because of low ridership. These services included (1) a mid-day express-bus
trip from downtown Minneapolis to the Anoka and Coon Rapids stations for rail riders needing a
mid-day return home, (2) a local feeder service between the Anoka and Coon Rapids
communities and the Coon Rapids station, and (3) a last chance evening express-bus trip from
downtown Minneapolis to the Anoka and Coon Rapids stations.
Two express-bus routes were eliminated with the introduction of Northstar commuter rail service
in 2009. Both routes were eliminated because Northstar rail stations were built at the park-and-
Federal Transit Administration Page 28
ride locations served by the express buses. Runtime on these express buses from Coon Rapids to
downtown Minneapolis was 35 minutes compared to 36 minutes on Northstar (including 21
minutes on commuter rail and 15 minutes for the connection via light rail from the Target Field
station into downtown).
Overall, Northstar replaced 35 weekday express bus trips with 12 commuter rail trips.
Other bus routes near the Northstar Corridor include six express routes and two local routes.
These routes continue to operate serving different markets in which the Northstar train service is
no not time competitive.
Operating and maintenance costs
Operation and maintenance costs for the Northstar commuter rail line were $15.8 million in
calendar 2011. Connecting bus services from St. Cloud and within downtown Minneapolis cost
an additional $0.5 million. Light rail O&M increased by approximately $2 million per year to
provide service on the extended line. The largest cost centers for commuter rail are contracted
services (BNSF operation crews, ROW maintenance and dispatch), labor, and insurance.
Adjustments to bus services in the corridor decreased bus O&M costs by $1.6 million. Overall,
O&M costs for all services (including bus connections, LRT and Commuter Rail) in the corridor
increased by $16.7 million.
The 2002 Final Environmental Impact Statement (FEIS) anticipated commuter rail O&M costs
of $9.7 million for the project, estimates increased to $11 million in the 2007 Northstar Corridor
Project Financial Plan. The primary sources of differences between predicted costs in 2007 and
actual costs in 2011 are higher than anticipated BNSF operating costs (that are passed through to
Northstar) and rapid increases in the cost of liability insurance that occurred after a major
accident on a commuter rail line elsewhere in the country.
Ridership
In March 2011, Northstar rail carried an average of 2,200 weekday rides. Saturday and Sunday
ridership averaged 560 and 343 respectively. In all of 2011, nearly 90 special events were
served including all Minnesota Twins baseball and Vikings football games. For these events,
Northstar carried an average of more than 1,500 rides in addition to regular commute ridership.
Overall weekday transit ridership in the corridor grew from a base of 3,800 weekday rides in
March 2009 to 5,000 in March 2011. The March 2009 total includes 1,200 weekday rides on
two express-bus routes that were replaced by Northstar. Consequently, the 2,200 weekday
Northstar riders appears to comprise 1,200 trips shifted from former express bus services and
1,000 trips entirely new to transit.
Northstar customers in 2011 were primarily Caucasian (93%), between the ages of 35-54,
commuting to work, and earning $50,000-$150,000 per year. The majority of Northstar riders
drove alone to the station from their homes and 45 percent rode light rail to their destination
from Northstar while 37 percent walked, and 11 percent rode the bus.
Weekday ridership on the project has continued to increase since 2011 and in April 2013
averaged 2,800 weekday trips.
Federal Transit Administration Page 29
At the FFGA milestone, opening year ridership forecasts anticipated 4,100 weekday commuter
rail rides. Metro Transit subsequently finalized the planned fare policy, setting fares at higher
levels than anticipated at the FFGA. A revised ridership estimate of 3,400 weekday trips was
prepared to reflect this change in fares.
Analysis of the differences between actual and predicted ridership suggests several causes of the
differences. The FFGA ridership forecast anticipated a travel time of 43 minutes from Big Lake
to Target Field, compared to the actual 51 scheduled minutes in 2011. The FFGA forecast
assumed a reduction in Route 850 express bus service which serves Foley park-and-ride lot about
five miles south of Coon Rapids Station; this reduction did not occur. Anticipated increases in
population, employment, and highway congestion did not happen, at least in part because of the
significant economic downturn that began in 2008. Finally, actual fares were slightly higher in
2011 than were assumed in the forecast.
Federal Transit Administration Page 30
Central Link Initial Segment and Airport Link Project; Seattle, Washington
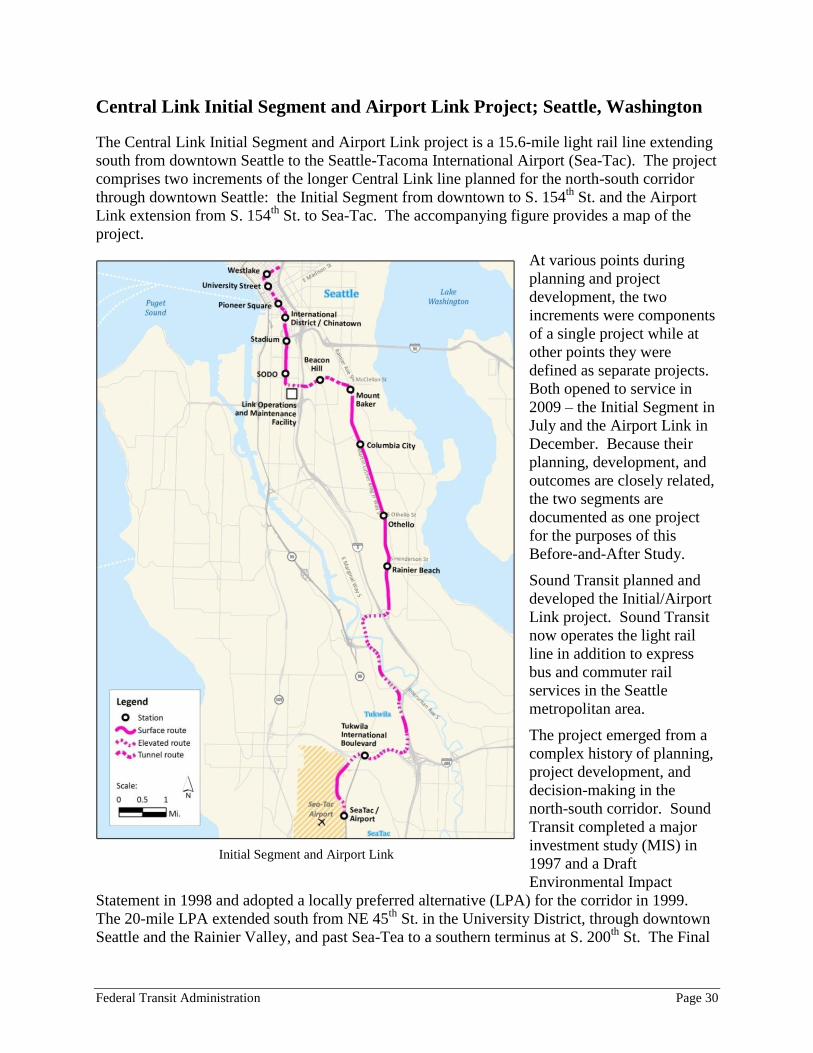
The Central Link Initial Segment and Airport Link project is a 15.6-mile light rail line extending
south from downtown Seattle to the Seattle-Tacoma International Airport (Sea-Tac). The project
comprises two increments of the longer Central Link line planned for the north-south corridor
through downtown Seattle: the Initial Segment from downtown to S. 154th
St. and the Airport
Link extension from S. 154th
St. to Sea-Tac. The accompanying figure provides a map of the
project.
At various points during
planning and project
development, the two
increments were components
of a single project while at
other points they were
defined as separate projects.
Both opened to service in
2009 – the Initial Segment in
July and the Airport Link in
December. Because their
planning, development, and
outcomes are closely related,
the two segments are
documented as one project
for the purposes of this
Before-and-After Study.
Sound Transit planned and
developed the Initial/Airport
Link project. Sound Transit
now operates the light rail
line in addition to express
bus and commuter rail
services in the Seattle
metropolitan area.
The project emerged from a
complex history of planning,
project development, and
decision-making in the
north-south corridor. Sound
Transit completed a major
investment study (MIS) in
1997 and a Draft
Environmental Impact
Statement in 1998 and adopted a locally preferred alternative (LPA) for the corridor in 1999.
The 20-mile LPA extended south from NE 45th
St. in the University District, through downtown
Seattle and the Rainier Valley, and past Sea-Tea to a southern terminus at S. 200th
St. The Final
Initial Segment and Airport Link
Federal Transit Administration Page 31
Environment Impact Statement in late 1999 and the Record of Decision (ROD) issued by the
Federal Transit Administration (FTA) in early 2000 completed the environmental process for the
LPA with only minor modifications to the project.
Later in 2000, FTA approved entry into final design of both the LPA and a 7-mile minimum
operable segment (MOS-1) extending from the LPA’s northern terminus to an interim terminus
just south of downtown Seattle. Initial work in final design identified engineering and cost
difficulties, including unstable soils, higher right-of-way costs, and higher construction costs. In
response, Sound Transit increased the project budget and schedule. These changes were
included in the Full Funding Grant Agreement (FFGA) for MOS-1 that was executed by FTA
and Sound Transit in January 2001.
In April 2001, a review of the project by the Inspector General of the U.S. Department of
Transportation concluded with recommendations that: FTA defer funding until Sound Transit
had identified all issues that could affect the project’s scope, cost, and schedule; FTA and its
project management oversight contractor (PMOC) validate the project’s estimated cost to
complete; and FTA and its financial management oversight (FMO) Contractor validate the
sufficiency of local funding sources to complete the project.
In response to the Inspector General’s recommendations, Sound Transit reexamined the project
and decided not to proceed with MOS-1. In November 2001, Sound Transit instead identified
the Initial Segment project as the priority for construction. An Environmental Assessment (EA)
(February 2002) and FTA’s Amended Record of Decision (May 2002) concluded the
environmental review of the Initial Segment project. In October 2003, FTA and Sound Transit
executed an FFGA providing $500 million in New Starts funding for the project.
Sound Transit continued development of the Airport Link extension, completing an EA for the
project in May 2005 leading to FTA issuance of a ROD in September 2005. As construction of
the Initial Segment project neared completion, it became clear that the project would be
completed under budget. FTA and Sound Transit agreed that remaining New Starts funds would
be used to help fund the Airport Link extension. The two agencies signed an amended FFGA in
2008 to add the Airport Link to the scope of the FFGA while keeping the New Starts funding at
$500 million. The Initial Segment opened to service in July, 2009, and the Airport Link
extension opened in December, 2009.
This complex history poses a challenge for the predicted-versus-actual comparisons in the
Before-and-After Study. While the project actually built extends from downtown Seattle to Sea-
Tac airport, the LPA at various milestones in project development anticipated a project that
extended three miles further north and one mile further south. To make the comparisons
meaningful, the analysis Sound Transit extracted from the LPA at each milestone the component
that most closely matches the project. Consequently, all predicted-versus-actual comparisons are
between the as-built project and the portion of the LPA at each milestone that best corresponds to
the as-built project.
Physical scope of the project
The project is a 15.6-mile, double-tracked light rail line that extends from downtown Seattle to
the Seattle-Tacoma Airport. The north end of the line is located in the 1.3-mile Downtown
Seattle Transit Tunnel (DSTT) where it serves four stations. Project construction included a
substantial retrofit of the tunnel to accommodate the light rail line and convert it from bus-only
Federal Transit Administration Page 32
to mixed bus/train operations. South of downtown, the line runs at grade through an industrial
area and then enters a 1-mile tunnel bored through Beacon Hill to the Rainier Valley. The
Beacon Hill tunnel includes one underground station. The line is located at grade in the Rainier
Valley with four stations. Further south, the line is largely elevated to traverse difficult terrain
and then climb the hill to the airport. Over its 15.6 miles and 13 stations, the line is at grade for
6.3 miles with five stations, elevated for 7.0 miles with three stations, and in tunnel for 2.3 miles
with five stations. The stations accommodate 4-car trains and have low platforms that provide
level boarding with the low-floor vehicles. The project includes 35 light rail vehicles, 95 feet
long and double-articulated as well as a 25-acre operations and maintenance facility located in
the industrial area just south of downtown Seattle. The single park-and-ride lot is located at the
Tukwila station with 600 parking spaces. All stations have adjacent bus-loading zone, mostly
on-street.
The facility was expanded in 2008 to accommodate up to 104 vehicles as part of the University
Link extension schedule to open in 2016.
The anticipated scope of the project during planning and project development was largely
consistent with the actual outcome on the physical scope of the project. At PE-entry, the
anticipated scope had five differences from the as-built scope:
The DSTT was planned to operate with light rail trains only instead of the joint bus and
light rail operation of the as-built project; the joint-operations plan was adopted during
PE.
South of downtown Seattle, the planned alignment was at-grade and slightly shorter than
the elevated alignment of the as-built project; the as-built alignment was adopted during
PE.
The alignment through Tukwila was in the median of Tukwila International Blvd. and
was 1.1 miles shorter than the Tukwila Freeway alignment of the as-built project; the as-
built alignment was adopted during PE.
The scope of the project included two stations – Boeing Access Road and South 144th
Street – that were not built; these stations were dropped during PE.
The planned scope did not include the Beacon Hill station; this station was added to the
project scope at the Amended FFGA.
Changes made during PE to the anticipated project scope brought it into close agreement with
the as-built scope by the FD-entry milestone. The only significant differences at FD-entry were
the continued absence of the Beacon Hill station and the now-deferred Stadium station. No
significant scope characteristics changed during FD; so the anticipated scope continued to match
the as-built scope quite closely. The addition of the Beacon Hill and Stadium stations at the
Amended FFGA brought the planned scope into full agreement with the actual outcome.
Capital cost
The actual cost of the combined Central Link Initial Segment and Airport Link project was
$2.558 billion in year-of-expenditure (YOE) dollars. Physical elements accounted for 60 percent
of the cost, including the guideway and track-work (27 percent), systems (12 percent), stations
and ventilation (7 percent), utilities and roadway (7 percent), vehicles (6 percent) and other
specialty items (1 percent). Costs of services and administration were 20 percent of the total
Federal Transit Administration Page 33
cost. Right-of-way acquisition required nine percent and financing costs represented seven
percent. Miscellaneous other capital expenditures made up the remaining four percent. The
average per-mile cost was $164 million including all capital costs.
In YOE dollars, predicted capital costs for the combined project were low by $700 million (27
percent) at entry into PE and then high by $90-130 million (four to five percent) at FD-entry, the
FFGA, and the Amended FFGA. (While the Airport Link extension was not advanced into PE or
FD along with the Initial Segment, or included within the FFGA scope, its separately estimated
cost is included at these milestones to permit meaningful comparisons with the actual capital cost
of the combined project.) In constant-dollar terms that remove inflation effects from the
comparisons, predicted costs were low by $560 million (21 percent) at PE-entry and then high by
$410-460 million (15 to 17 percent) at FD-entry, the FFGA, and the Amended FFGA.
The significant underestimate at the PE-entry milestone is attributable to: (1) later changes to an
elevated alignment south of downtown Seattle and a longer alignment through Tukwila; (2) later
additions to the signaling and communication systems in the DSTT to permit mixed bus and rail
operations; (3) some $400 million in project contingency reserve, financing costs, and DSTT
debt service – cost categories not included in the predicted cost at PE-entry; (4) an expected
opening year for the project in 2006 rather than the actual 2009 opening, leading to three
additional years of inflation in construction costs; and (5) higher than expected annual rates of
inflation over the course of project development and construction; actual inflation in construction
costs from the entry into PE in 1999 to the opening year totaled 40 percent as the expanding
national and world economies, plus weather events in the United States, contributed to rapidly
rising prices for steel, concrete, and construction labor.
The overestimates at the later milestones are attributable to: (1) overestimated right-of-way costs
because of higher than actual expectations increases in real estate prices; (2) a conservative
approach to cost estimation as Sound Transit worked with FTA staff and FTA’s project
management oversight contractors in the wake of the cost estimating problems encountered for
the earlier MOS-1 project; (3) FTA concerns on possible risks associated with the Beacon Hill
tunnel; and (4) the $130 million project reserve required by FTA of which only $35 million was
used. In constant-dollar terms, these differences led to overestimates of actual costs in the range
of 15 to 17 percent; in YOE dollar terms, higher than expected inflation reduced the
overestimates to four to five percent. The differences between the constant-dollar and YOE-
dollar comparisons indicate that, without the high rates of inflation in the mid-2000s that were
not anticipated by any project sponsor or by FTA, the cost of the combined project would have
come in substantially under the cautiously prepared estimates. In the outcome, the unexpectedly
high actual rates of inflation, to a large degree, moderated the extent of the overestimates.
Transit service
The Central Link Initial Segment and Airport Link light rail line provides twenty hours of
service on weekdays and Saturdays from 5 a.m. to 1 a.m., and eighteen hours of service on
Sundays and holidays from 6 a.m. to midnight. On weekdays, trains run every 7.5 minutes in the
peak periods, every 10 minutes during midday and evening hours, and every 15 minutes during
early morning and late night hours. On weekends trains run every 10 minutes except during
early morning and late night when they run every 15 minutes. The line operates two-car trains at
all times. The one-way running time from Westlake Station to SeaTac/Airport Station is 38
minutes including dwell times at stations, an average speed of 24 mph.
Federal Transit Administration Page 34
Integration of the rail line into the transit system has been guided by a general philosophy that
bus service hours saved because of rail would be reinvested in the corridor. Two years after
project opening, bus service hours on weekdays and weekends were three percent higher than
before opening. This outcome reflects the modest nature and extent of bus changes. The Beacon
Hill and Rainier Valley areas of Southeast Seattle have diverse populations of generally lower
and lower-middle income families that are served by several of Sound Transit’s most frequent
and most productive bus routes. These bus routes were largely unaffected by the introduction of
rail service – with limited deviations to rail stations, truncations at stations, and adjustments to
other routes to replace truncated services. Other bus services were upgraded. In areas further
south, Sound Transit eliminated some long routes to downtown Seattle, including the airport-
downtown express and introduced new services to light rail stations.
During project development, Sound Transit accurately anticipated the actual service levels on the
light rail line in terms of daily hours of service, headways, train length, and end-to-end running
time. The only difference is that, throughout project development, Sound Transit planned to
operate with 6-minute, peak-period headway on weekdays. Subsequent tests of joint bus-rail
operations in the DSTT indicated that the actual 7.5-minute headway would be preferable. In
general, adjustments to bus services planned during project development accurately anticipated
actual adjustment. Sound Transit established early in project development the governing
philosophy of reinvesting bus service hours saved with the introduction of rail service, thereby
maintaining consistent aggregate service levels throughout project development. Some planned
changes in bus services have not occurred: the planned elimination of direct bus connections
between the Rainier Valley and downtown Seattle has not happened, although some reductions
have been made in service levels. Sound Transit is gradually completing the planned
adjustments to bus service in the corridor, a process slowed to some degree by resistance on the
part of current bus riders, particularly in the Rainier Valley.
Operating and maintenance costs
In 2011, the operating and maintenance (O&M) cost of the combined Central Link Initial
Segment and Airport Link rail line was $47.7 million. Labor costs for train operations and
maintenance of vehicles and facilities accounted for 44 percent of the total cost. Contracted
services, including contracts for maintenance and security with third-party vendors and
governmental agencies, represented 24 percent of the total cost. In 2011 dollars, O&M costs for
bus service in the corridor remained unchanged from pre-light-rail expenditures.
At the project development milestones, predicted annual O&M costs for light rail in 2011 dollars
under-estimated actual costs by $6-9 million (12 to 19 percent low). At the amended FFGA, the
predicted O&M costs were low by $3 million, or seven percent. The two causes of these
underestimates are (1) an unexpected annual charge for Sound Transit’s contribution to O&M
and debt-service costs of the DSTT and (2) an unexpected increase in security requirements.
The DSTT charge ($5.6 million in 2011) reflects an unanticipated change in Sound Transit
accounting procedures that assigns to light rail the payment made annually by Sound Transit to
King County, the owner of the DSTT. The increase in security needs reflects new requirements
by the U. S. Department of Homeland Security and local police and fire departments after the
attacks of 9/11/2001.
Federal Transit Administration Page 35
Ridership
In the fall of 2011, the combined Central Link Initial Segment and Airport Link project carried
23,400 trips on the average weekday and 7.8 million total trips in calendar year 2011. Rail
ridership is somewhat higher than the average during summer months when more sporting and
community events occur in downtown Seattle. The tourist and cruise-ship seasons also add to
ridership between the airport and downtown Seattle. This seasonality is different from the
seasonal character of the bus system where ridership is highest in the fall months when
universities and colleges are in session.
Compared to the bus system, light rail riders come from households with significantly higher
incomes and marginally higher auto-ownership, and are somewhat more likely to drive and park
at their boarding location (even though the project includes only one park-and-ride lot).
Between 2008 and 2011, overall transit ridership in the corridor appears to have increased on
weekdays by approximately 7,000 origin-to-destination trips, suggesting that the 23,400 trips on
rail are roughly one-third new transit trips and two-thirds former bus riders.
Throughout project development, forecasts for opening-year ridership on light rail consistently
overestimated actual ridership. Predicted weekday ridership ranged from 34,900 (high by 11,500
or 49 percent) at PE-entry to 37,800 (high by 14,400 or 62 percent) at FD-entry, the FFGA, and
the amended FFGA. Because actual weekend ridership is higher than anticipated in the opening-
year forecasts, however, differences are smaller in annual terms: 7.8 million annual light rail
trips in 2011 compared to opening year forecasts of 10.6 million (high by 36 percent) at PE-entry
and 11.5 million (high by 47 percent) at the later milestones.
These overestimates are caused largely by a problematic forecast of employment in downtown
Seattle that was developed by the regional planning agency in 2001 and used by Sound Transit in
subsequent ridership forecasts for the project. The employment forecast anticipated rapid growth
that located 80,000 more jobs in downtown than were actually there in 2011. This difference by
itself accounts for 11,000 light rail trips – 76 percent of the overestimates at the later milestones.
Some of the over-prediction of downtown employment is attributable to optimism about
downtown growth by the planning agency and the city of Seattle. Some is attributable to the
effects of the severe recession starting in 2008 on employment throughout the Seattle
metropolitan area. Higher unemployment also reduced economic activity through the area, and
with it, ridership on transit, including light rail.
Other contributors include Sound Transits adoption of a distance-based light-rail fare not
anticipated in the ridership predictions; light rail fares average $1.53 per trip compared to the
$1.08 assumed in the predictions. Further, light rail trips made within the DSTT must pay a fare
while DSTT bus trips are free, in contrast to the assumption made in the ridership predictions
that all DSTT services would be free-fare. Mixed bus and rail operations in the tunnel cause
some schedule-adherence difficulties and light rail headways are 7.5 minutes rather than the
planned 6.0 minutes. Finally, Sound Transit is making planned changes to bus services
gradually and shifts of bus riders to light rail are consequently happening more slowly than
expected.