Embed Size (px)
Citation preview

FY20 Q4 Earnings Presentation
June 30, 2020

Today’s Presenters
Brian KearneyInvestor Relations
Sean ConnollyPresident and Chief Executive Officer
Dave MarbergerExecutive Vice President and Chief Financial Officer

Legal Disclosure
Note on Forward-looking Statements
This document contains forward-looking statements within the meaning of the federal securities laws. These forward-looking statements are based on management's current expectations
and are subject to uncertainty and changes in circumstances. Readers of this document should understand that these statements are not guarantees of performance or results. Many
factors could affect our actual financial results and cause them to vary materially from the expectations contained in the forward-looking statements, including those set forth in this
document. These risks, uncertainties, and factors include, among other things: the risk that the cost savings and any other synergies from the acquisition of Pinnacle Foods Inc. (the
"Pinnacle acquisition") may not be fully realized or may take longer to realize than expected; the risk that the Pinnacle acquisition may not be accretive within the expected timeframe or to
the extent anticipated; the risks that the Pinnacle acquisition and related integration will create disruption to the Company and its management and impede the achievement of business
plans; the risk that the Pinnacle acquisition will negatively impact the ability to retain and hire key personnel and maintain relationships with customers, suppliers, and other third parties;
risks related to our ability to successfully address Pinnacle's business challenges; risks related to our ability to achieve the intended benefits of other recent acquisitions and divestitures;
risks associated with general economic and industry conditions; risks associated with our ability to successfully execute our long-term value creation strategies, including those in place for
specific brands at Pinnacle before the Pinnacle acquisition; risks related to our ability to deleverage on currently anticipated timelines, and to continue to access capital on acceptable
terms or at all; risks related to our ability to execute operating and restructuring plans and achieve targeted operating efficiencies from cost-saving initiatives, related to the Pinnacle
acquisition and otherwise, and to benefit from trade optimization programs, related to the Pinnacle acquisition and otherwise; risks related to the effectiveness of our hedging activities and
ability to respond to volatility in commodities; risks related to the Company's competitive environment and related market conditions; risks related to our ability to respond to changing
consumer preferences and the success of its innovation and marketing investments; risks related to the ultimate impact of any product recalls and litigation, including litigation related to
the lead paint and pigment matters, as well as any securities litigation, including securities class action lawsuits; risk associated with actions of governments and regulatory bodies that
affect our businesses, including the ultimate impact of new or revised regulations or interpretations; risks related to the impact of the recent coronavirus (COVID-19) outbreak on our
business, suppliers, consumers, customers and employees; risks related to the availability and prices of raw materials, including any negative effects caused by inflation, weather
conditions or health pandemics; disruptions or inefficiencies in our supply chain and/or operations, including from the recent COVID-19 outbreak; risks and uncertainties associated with
intangible assets, including any future goodwill or intangible assets impairment charges, related to the Pinnacle acquisition or otherwise; the costs, disruption, and diversion of
management's attention due to the integration of the Pinnacle acquisition; and other risks described in our reports filed from time to time with the Securities and Exchange Commission (the
"SEC"). We caution readers not to place undue reliance on any forward-looking statements included in this report, which speak only as of the date of this report. We undertake no
responsibility to update these statements, except as required by law.
Note on Non-GAAP Financial Measures
This document includes certain non-GAAP financial measures, including adjusted EPS, organic net sales, adjusted gross profit, adjusted operating profit, adjusted SG&A, adjusted
corporate expenses, adjusted gross margin, adjusted operating margin, adjusted effective tax rate, adjusted net income, adjusted pension and post-retirement non-service income,
adjusted net interest expense, net leverage ratio, free cash flow, net debt, adjusted equity method investment earnings, and adjusted EBITDA. Management considers GAAP financial
measures as well as such non-GAAP financial information in its evaluation of the Company’s financial statements and believes these non-GAAP measures provide useful supplemental
information to assess the Company’s operating performance and financial position. These measures should be viewed in addition to, and not in lieu of, the Company’s diluted earnings per
share, operating performance and financial measures as calculated in accordance with GAAP.
Certain of these non-GAAP measures, such as organic net sales, adjusted operating margin, adjusted effective tax rate, adjusted net interest expense, adjusted EPS, net debt, net
leverage ratio, and free cash flow, are forward-looking. Historically, the Company has excluded the impact of certain items impacting comparability, such as, but not limited to, restructuring
expenses, the impact of the extinguishment of debt, the impact of foreign exchange, the impact of acquisitions and divestitures, hedging gains and losses, impairment charges, the impact
of legacy legal contingencies, and the impact of unusual tax items, from the non-GAAP financial measures it presents. Reconciliations of these forward-looking non-GAAP financial
measures to the most directly comparable GAAP financial measures are not provided because the Company is unable to provide such reconciliations without unreasonable effort, due to
the uncertainty and inherent difficulty of predicting the occurrence and the financial impact of such items impacting comparability and the periods in which such items may be recognized.
For the same reasons, the Company is unable to address the probable significance of the unavailable information, which could be material to future results.
Hedge gains and losses are generally aggregated, and net amounts are reclassified from unallocated corporate expense to the operating segments when the underlying commodity or
foreign currency being hedged is expensed in segment cost of goods sold. The Company identifies these amounts as items that impact comparability within the discussion of unallocated
Corporate results.3

Sean Connolly
President and Chief Executive Officer

Key Messages
• We have made 5 years of consistent progress executing the Conagra Way• Became a pure play
• Established repeatable and scalable processes
• Improved food and packaging
• Modernized brands
• Strengthened culture
• In fiscal 2020 we further strengthened the business, including getting Legacy Pinnacle back on-track
• In Q4 our broad, modernized portfolio was well-positioned to capture unprecedented retail demand driven by COVID-19, partially offset by foodservice headwinds
• Elevated demand is likely to continue, but the timing and degree of changes to this demand is uncertain; we are investing to ensure physical availability of our products to capture opportunities
• Remain on-track to deliver fiscal 2022 algorithm and remain committed to achieving leverage target of 3.5x to 3.6x by the end of fiscal 2021
5

Agenda
Business Update
We Are Well-Positioned For Behavioral Shifts
Looking Ahead

7
Thank You to Our Operations Teams, Who Have Risen to an Unprecedented Challenge
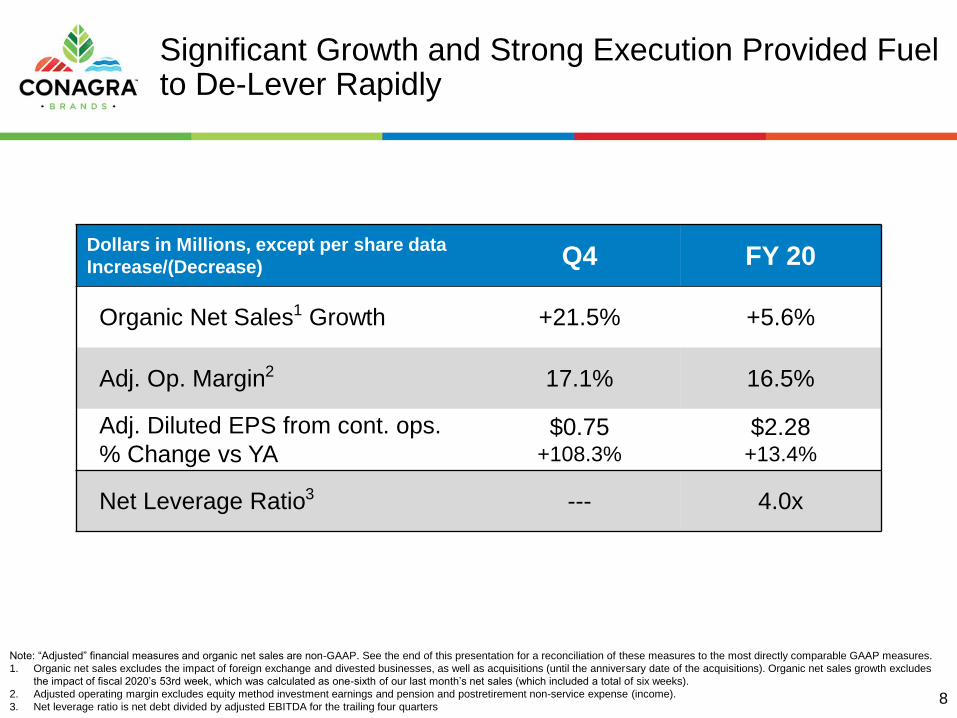
Significant Growth and Strong Execution Provided Fuel to De-Lever Rapidly
Note: “Adjusted” financial measures and organic net sales are non-GAAP. See the end of this presentation for a reconciliation of these measures to the most directly comparable GAAP measures.
1. Organic net sales excludes the impact of foreign exchange and divested businesses, as well as acquisitions (until the anniversary date of the acquisitions). Organic net sales growth excludes
the impact of fiscal 2020’s 53rd week, which was calculated as one-sixth of our last month’s net sales (which included a total of six weeks).
2. Adjusted operating margin excludes equity method investment earnings and pension and postretirement non-service expense (income).
3. Net leverage ratio is net debt divided by adjusted EBITDA for the trailing four quarters
Dollars in Millions, except per share data
Increase/(Decrease) Q4 FY 20
Organic Net Sales1 Growth +21.5% +5.6%
Adj. Op. Margin2 17.1% 16.5%
Adj. Diluted EPS from cont. ops.
% Change vs YA$0.75
+108.3%
$2.28+13.4%
Net Leverage Ratio3 --- 4.0x
8

Strong Growth Across the Portfolio
Q4 Retail Sales
(% Change vs. YA)
Source (Snacks): IRI Syndicated Market Advantage, Total US MULO+C, 14 weeks ended May 31, 2020
Source (All Others): IRI Custom Market Advantage, Total US MULO+C, 14 weeks ended May 31, 2020, Staples = Grocery + Refrigerated
32.6%
46.3%
26.2%
20.1%
Staples Frozen Snacks
9

eCommerce Business Continued to Accelerate
Conagra eCommerce Dollar Sales
(% Change vs. YA)
Note: Latest weeks subject to change due to data stability
Source (Left Chart): IRI eMarket Insights data ended May 31, 2020. Instacart 1st party data added through May 31, 2020
Source (Right Chart): IRI eMarket Insights, data ended May 31, 2020. Instacart 1st party data added through May 31, 2020
Conagra eCommerce
as a % of Total Retail Sales
(Rolling 13 Weeks)
3.3%3.6%
4.0%
4.7%
5.2%
6.6%
Q3 FY19 Q4 FY19 Q1 FY20 Q2 FY20 Q3 FY20 Q4 FY20
10
51.6%
60.5%
89.7%
FY18 FY19 FY20

Innovation Continued to Perform Well
Conagra Innovation Comparison
(FY19 vs. FY20 Dollar Sales)
FY19 Innovation in FY19 FY20 Innovation in FY20
Source (Left Chart): IRI Custom Market Advantage, Total US MULO+C, Dollar Sales, 52 weeks ended May 31, 2020 vs. 52 weeks ended May 26, 2019
Source (Right Chart): IRI Syndicated Market Advantage, MULO + C, Conagra Brands Fiscal Year 2015, 2016, 2019, 2020
9%
12%
17% 17%
FY15 FY16 FY19 FY20
% of Annual Retail Sales from Innovation
(Rolling 3 Years’ Launches)
11

Strong Growth Across The Frozen Portfolio
Conagra Q4 Frozen Retail Sales
(% Change vs. YA)
Source: IRI Custom Market Advantage, MULO+C, 14 weeks ended May 31, 2020, sorted by total dollar sales12
26.2%
21.7%
26.5%
31.1%
52.1%
Total Frozen FrozenSingle Serve Meals
FrozenVegetables
FrozenMulti Serve Meals
Plant Based MeatAlternatives

Strong Share Growth Continued in Frozen Meals
Total Conagra Frozen Meals
Retail Distribution Share
(Share Point Change vs. YA)
Total Conagra Frozen Meals
Retail Sales Share
(Share Point Change vs. YA)
+0.3 pts
+1.3 pts
+1.7 pts
+2.2 pts
Q1 FY20 Q2 FY20 Q3 FY20 Q4 FY20
+0.6 pts
+1.1 pts
+1.3 pts
+1.8 pts+1.7 pts
Q4 FY19 Q1 FY20 Q2 FY20 Q3 FY20 Q4 FY20
Source: IRI Custom Market Advantage, Total US MULO+C, Share Point Change vs. YA, Fiscal Quarters, Total Conagra Brands Single Serve + Multi-Serve Meals, Straight Share13
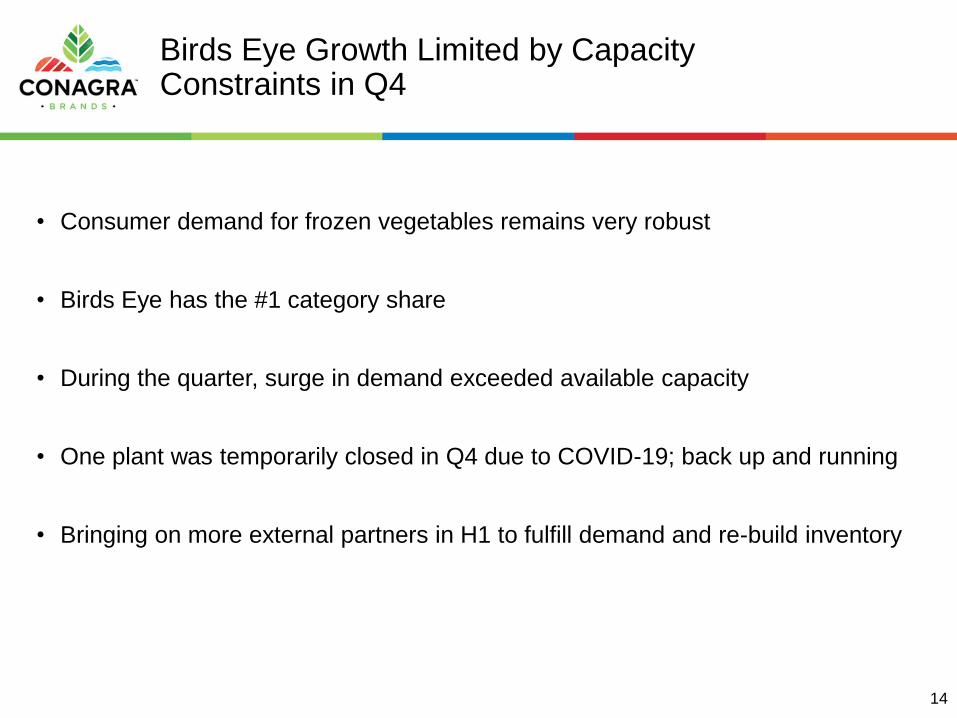
Birds Eye Growth Limited by Capacity Constraints in Q4
• Consumer demand for frozen vegetables remains very robust
• Birds Eye has the #1 category share
• During the quarter, surge in demand exceeded available capacity
• One plant was temporarily closed in Q4 due to COVID-19; back up and running
• Bringing on more external partners in H1 to fulfill demand and re-build inventory
14

Strong Snacks Growth
Total Conagra Snacks Retail Sales
(% Change vs. YA)
Popcorn
+42.2%
Sweet Treats
+39.7%
Seeds
(13.7)%
Meat Snacks
+12.4%+5.2%
+7.0%
+4.9%
+3.0%
+20.1%
+9.2%
+26.4%
Q4 FY19 Q1 FY20 Q2 FY20 Q3 FY20 Q4 FY20
% Change vs. YA 2-Year Growth
Source (Left Chart): IRI Syndicated Market Advantage, Total US MULO+C, Conagra Fiscal Quarters
Source (Right Chart): IRI Custom Market Advantage, Total US MULO+C, 14-weeks ended May 31, 202015

Staples Relevance at an All-Time High
Conagra Q4 Staples Retail Sales
(% Change vs. YA)
Source: IRI Custom Market Advantage, MULO+C, 14 weeks ended May 31, 2020, sorted by total dollar sales16
46.3%
59.5%62.4%
25.7%
48.7%52.0%
39.4%
Total Staples Hunt's Chef Boyardee Vlasic Armour PAM HebrewNational

Agenda
Business Update
We Are Well-Positioned For Behavioral Shifts
Looking Ahead

18
Re-Discovery Discovery
Consumers Shifted Their Behavior Rapidly in Response to COVID-19
Baking as Activity
Value-Minded Meals
Cooking Together…
and It Can Be Fun
Their Kitchens,
Pantries & Freezers
Eating Together, More
Shared Meals
At-Home
Entertainment
Learning New SkillsHome Delivery, Click &
Collect Convenience
Recreating
Restaurant Favorites
Quality & Value of
Frozen Food
Virtual CelebrationsSpicing Up The
Meal Routine

Our Broad Portfolio Was Well-Positioned For These Shifts
19
Recreating Restaurant
Favorites at Home
Cooking Together, Learning
New SkillsValue-Minded Meals
+63%+62%+30% +92% +52% +79%+59%
+52% +65% +50%
At-Home Entertainment,
Movie NightsBaking as a Family Activity
Eating Together, More Shared
Meals
+14% +39%
Source: IRI POS, Total US MULO+C, 14 weeks ended May 31, 2020, Figures reflect total brand franchise sales unless otherwise noted, Birds Eye Voila = Frozen Multi-Serve Meals, Hebrew National = Hot Dogs, PF
Chang’s = Frozen Multi-Serve Meals, Hunt’s = Canned Tomatoes, Marie Callender’s (Virtual Celebrations) = FZ Desserts, Reddi Wip = Refrigerated Whipped Topping, Birds Eye = Frozen Vegetables; Home Delivery / Click & Collect: IRI eMarket Insights, Total eCommerce RMA, + Instacart ePOS Data, 14 weeks ended May 31, 2020. Latest weeks subject to change due to data stability.
Quality & Value of
Frozen FoodHome Delivery, Click & Collect
Convenience
+24% +27%+19% +27%Home Delivery Click & Collect
Virtual Celebrations
+24% +22% +389% +114%
+52%

Household Penetration Gains Have Been Broad-Based
Conagra Pillar Household Penetration
(Point Change vs. YA)
Source: IRI Custom Panel, Total US All Outlets, 14 weeks ended May 31, 2020, Staples = Grocery + Refrigerated20
+7.7 pts
+6.9 pts
+6.1 pts
Staples Snacks Frozen

New Buyers Over-Index to Younger Millennial Consumers
Total Conagra New Buyer Demographic
(% of Buyers)
Source (CAG Buyers): IRI Custom Panel, Total US All Outlets, New Buyer = Purchased in 14 weeks ended May 31, 2020 and not 52 weeks ended February 23, 2020
Source (U.S. Population): IRI CSIA, 14 weeks ended May 31, 2020, Total Store, Total Panel Distribution; U.S. Population is the breakdown of the IRI panel used.
IRI attempts to recruit and match U.S. census, but some difference may occur. Gen Z and younger are too small to register greater than 1% of the population on the panel.21
25%39%
29%
29%
33%
25%
12% 6%
U.S. Population CAG Buyers
Millennials Gen X Boomers Seniors
1.6x Index
1.0x Index
0.8x Index
0.5x Index

Repeat Rates Are Increasing
Total Conagra New Trier Repeat Rates for
Consumers Whose First Trial Was in March
(% of New Buyers Who Repeat Purchased)
Source : IRI Custom Panel, Total US All Outlets, New March Buyers = bought 4 weeks ended March 22, 2020 and not 52 weeks ended February 23, 202022
28%
37% 38%
4 weeks endedMarch 22, 2020
4 weeks endedApril 19, 2020
4 weeks endedMay 17, 2020

136 132
120 119 118 117 117 115 113 110105
Broadly Across the Portfolio, New Triers Are Repurchasing Our Brands Again More Than Last Year…
Total Repeat Buyer Index
(% New Buyers Who Purchased Again Index vs YA)
Source : IRI Custom Panel, Total US All Outlets, New Buyer Index = New Buyers Who Repeat Purchased 14 weeks ended May 31, 2020 vs. 14 weeks ended June 2, 2019.
Note: Duncan Hines is Baking Mixes; Gardein is Meat Alternatives; Hunt’s is Canned Tomatoes; Orville Redenbacher’s is Microwave Popcorn; Birds Eye is Frozen Vegetables;
Banquet, Marie Callender’s, and Healthy Choice are Frozen Single Serve Meals23

… And Depth of Repeat is Improving
Source : IRI Custom Panel, Total US All Outlets, Repeat in 14 weeks ended May 31, 2020, Total Buyers
Total Conagra % of Buyers Repeating Purchases(Current and Year Ago)
16% 12%
26%25%
58% 64%
Year Ago Current
24
Repurchased
2+ times
Repurchased
Once
Bought Once, Did
Not Repurchase

We Are Attracting More New Buyers to Our Brands in Frozen Single-Serve Meals vs. Competitors
Frozen Single-Serve Meals New Brand Buyers
(Top 5 Brands; % of Total Buyers)
Source : IRI Custom Panel, Total US All Outlets, New Buyers = bought 14 weeks ended May 31, 2020 and not 52 weeks ended February 23, 202025
47% 46%
41%39%
33%
BQ HC MC Peer 1 Peer 2

New Frozen Buyers Over-Index to Millennial and Gen X Consumers
Conagra Frozen New Buyer Demographic
(% of Buyers)
Source (CAG Frozen Buyers): IRI Custom Panel, Total US All Outlets, New Buyer = Purchased in 14 weeks ended May 31, 2020 and not 52 weeks ended February 23, 2020
Source (U.S. Population): IRI CSIA, 14 weeks ended May 31, 2020, Total Store, Total Panel Distribution; U.S. Population is the breakdown of the IRI panel used.
IRI attempts to recruit and match U.S. census, but some difference may occur. Gen Z and younger are too small to register greater than 1% of the population on the panel.26
25% 29%
29%31%
33%31%
12% 9%
U.S. Population CAG Frozen Buyers
Millennials Gen X Boomer Seniors
1.2x Index
1.1x Index
0.9x Index
0.7x Index

Our New Frozen Buyers Are Also Repeating at a Higher Rate Than the Competition
Frozen Single-Serve Meals
% of New Brand Buyers Who Repurchased
(Top 5 Brands; % of New Buyers)
Source : IRI Custom Panel, Total US All Outlets, New Buyers = bought 14 weeks ended May 31, 2020 and not 52 weeks ended February 23, 2020. Repurchase = buying more than once
during 14 weeks ended May 31, 202027
49%
43% 43% 41%
28%
BQ HC Peer 1 MC Peer 2

11.8%
9.9%
8.1%
BE Peer 1 Peer 2
48%
41% 42%
BE Peer 1 Peer 2
Birds Eye Consumer Pull Outperforming Peers
Source : IRI Custom Panel, Total US All Outlets, New Buyers = bought 14 weeks ended May 31, 2020 and not 52 weeks ended February 23, 2020. Repurchase = buying more than once
during 14 weeks ended May 31, 2020
Frozen Vegetables
% of US Households
New to the Brand
Frozen Vegetables
% of New Brand Buyers
Who Repeat Purchased
28

Agenda
Business Update
We Are Well-Positioned For Behavioral Shifts
Looking Ahead

FY21 Objective: Maintain Momentum With Consumers to Maximize Long-Term Value Creation
• Ensure physical availability to supply elevated demand• Capacity (internal and external)
• Innovation
• Inventory
• eCommerce
• PPE / Safety / Sanitation
• Continue to infuse new innovations across the portfolio
• Build brand health for long-term value creation
30

FY21 Innovation Slate Started Launching in Q4
31Note: Packaging under development, subject to change. Lucky Charms and associated words and designs are trademarks of General Mills, used under license. © General Mills.

Metric Fiscal 2021 Q1 Guidance1
Organic Net Sales Growth3 +10% to +13%
Adj. Operating Margin4 17.0% to 17.5%
Adj. Diluted EPS from cont. ops. $0.54 to $0.59
1. The inability to predict the amount and timing of the impacts of future items makes a detailed reconciliation of these forward-looking financial measures impracticable.
2. “Adjusted” financial measures and organic net sales are non-GAAP financial measures.
3. Organic net sales growth excludes the impact of foreign exchange and divested businesses, acquisitions (until the anniversary date of the acquisitions), as well as the
impact of any 53rd week.
4. Adjusted operating margin excludes equity method investment earnings and pension and postretirement non-service expense (income).
Outlook1,2
32
Remain confident in ability to achieve leverage ratio target of
3.5x to 3.6x by the end of fiscal 2021
Metric Fiscal 2022 Target1
Organic Net Sales Growth3
(3 YR CAGR ending FY22)
+1% to +2%(no change)
Adj. Operating Margin4 18% to 19%(no change)
Adj. Diluted EPS from cont. ops.$2.66 to $2.76
(no change)
Free Cash Flow Conversion(% of Adj. Net Income; 3 YR avg. ending FY22)
95%+(no change)

Dave Marberger
Executive Vice President and Chief Financial Officer

Performance Summary
Note: “Adjusted” financial measures and organic net sales are non-GAAP. See the end of this presentation for a reconciliation of these measures to the most directly comparable GAAP measures.
1. Organic net sales excludes the impact of foreign exchange and divested businesses, as well as acquisitions (until the anniversary date of the acquisitions). Organic net sales growth excludes
the impact of fiscal 2020’s 53rd week, which was calculated as one-sixth of our last month’s net sales (which included a total of six weeks).
2. Adjusted operating profit and adjusted operating margin exclude equity method investment earnings and pension and postretirement non-service expense (income).
3. Adjusted EBITDA includes equity method investment earnings and pension and postretirement non-service income.
Dollars in Millions, except per share data
Increase/(Decrease) Q4 vs. YA FY vs. YA
Reported Net Sales $3,288 25.8% $11,054 15.9%
Organic Net Sales1 3,095 21.5% 9,680 5.6%
Adj. Gross Profit 929 31.1% 3,108 14.3%
Adj. Gross Margin 28.3% 113 bps 28.1% (39) bps
A&P 59 (20.0)% 231 (9.0)%
A&P as % of NS 1.8% (103) bps 2.1% (57) bps
Adj. SG&A 308 5.7% 1,056 6.1%
Adj. SG&A as % of NS 9.4% (178) bps 9.6% (88) bps
Adj. Op. Profit2 562 63.5% 1,821 23.9%
Adj. Op. Margin2 17.1% 394 bps 16.5% 107 bps
Adj. Net Income 368 110.6% 1,115 24.7%
Adj. EBITDA3 690 50.5% 2,297 21.6%
Adj. Diluted EPS from cont. ops. $0.75 108.3% $2.28 13.4%
34

+21.0%
+0.5% (3.1)% (0.7)%
+8.1%
+25.8%
Volume Price/Mix(incl. RetailerInvestments)
Divestitures Foreign Exchange
53rd Week TotalConagraBrands
Net Sales Bridge vs. Year Ago
Organic Net Sales1: +21.5%Q4 Drivers of Net Sales Change
(% Change vs. YA)
+5.2%
+0.4%
+8.3%
(0.2)%+2.2%
+15.9%
Volume Price/Mix(incl. RetailerInvestments)
Acq's, Div's & Trenton Sale
Foreign Exchange
53rd Week TotalConagraBrands
Organic Net Sales1: +5.6%
Note: Organic net sales growth is non-GAAP. See the end of this presentation for a reconciliation of this measure to the most directly comparable GAAP measure. Numbers may not
add due to rounding. Percentage points may include rounding to bridge the change in reported net sales to the change in organic net sales.
1. Organic net sales growth excludes the impact of foreign exchange and divested businesses, as well as acquisitions (until the anniversary date of the acquisitions). Organic net
sales growth excludes the impact of fiscal 2020’s 53rd week, which was calculated as one-sixth of our last month’s net sales (which included a total of six weeks).35
FY20 Drivers of Net Sales Change
(% Change vs. YA)
Price/Mix
(incl. Retailer
Investments)
Acquisitions &
Divestitures
Total
Conagra
Brands

Net Sales Summary by Segment
Note: Organic net sales growth is non-GAAP. See the end of this presentation for a reconciliation of this measure to the most directly comparable GAAP measure; Numbers may
not add due to rounding.
1. Organic net sales growth excludes the impact of foreign exchange and divested businesses, as well as acquisitions (until the anniversary date of the acquisitions). Organic
net sales growth excludes the impact of fiscal 2020’s 53rd week, which was calculated as one-sixth of our last month’s net sales (which included a total of six weeks).
1 1
Dollars in Millions
Increase/(Decrease) Net Sales
Q4Reported
vs. YA
Organic
vs. YA1 FYReported
vs. YA
Organic
vs. YA1
Grocery & Snacks $1,474 +44.1% +40.4% $4,617 +17.7% +9.2%
Refrigerated & Frozen 1,355 +23.3% +17.6% 4,560 +22.1% +6.1%
International 266 +18.6% +19.8% 925 +7.0% +4.5%
Foodservice 193 (27.9)% (31.5)% 952 (6.2)% (9.7)%
Total Conagra Brands $3,288 +25.8% +21.5% $11,054 +15.9% +5.6%
36

Operating Margin Bridge
Q4 Adj. Operating Margin1
(% Change vs. YA)
Note: “Adjusted” financial measures are non-GAAP. See the end of this presentation for a reconciliation of these measures to the most directly comparable GAAP measures;
Numbers may not add due to rounding.
1. Adjusted operating margin excludes equity method investment earnings and pension and postretirement non-service expense (income).
Gross Margin: +113 bps vs YA
37

Segment Adjusted Operating Profit & Margin Summary
1 1
Dollars in Millions
Increase/(Decrease) Adj. Op. Profit1 Adj. Op. Margin1
Q4 vs. YA Q4 vs. YA
Grocery & Snacks $353 +91.2% 23.9% +589 bps
Refrigerated & Frozen 267 +45.7% 19.7% +302 bps
International 36 +47.2% 13.4% +260 bps
Foodservice 1 (97.1)% 0.5% (1,277) bps
Adjusted Corporate Expense (94) +12.6% - -
Total Conagra Brands $562 +63.5% 17.1% +394 bps
Note: “Adjusted” financial measures are non-GAAP. See the end of this presentation for a reconciliation of these measures to the most directly comparable GAAP measures;
Numbers may not add due to rounding.
1. Adjusted operating profit and adjusted operating margin exclude equity method investment earnings and pension and postretirement non-service expense (income).38

Adjusted EPS Bridge
Drivers of Q4 Adjusted Diluted EPS from Continuing Operations vs. YA
Note: “Adjusted” financial measures are non-GAAP. See the end of this presentation for a reconciliation of these measures to the most directly comparable GAAP measures;
Numbers may not add due to rounding.
1. Adjusted operating profit excludes equity method investment earnings and pension and postretirement non-service expense (income).39
1

Synergy Capture Remains On Track
$145
$184 $39
Synergies capturedfrom Pinnacle close
through end ofQ3 FY20
Incremental synergiescaptured inQ4 FY20
Total cumulativesynergies captured
through end ofQ4 FY20
Synergies Captured
Note: Numbers may not add due to rounding. The inability to predict the amount and timing of the impacts of future items makes a detailed reconciliation of these forward-
looking financial measures impracticable.
$305
Targetedcumulative synergies
by end of FY22
Total Synergy Targets
Reinvested
$20mm
40
Reinvested
$20mm
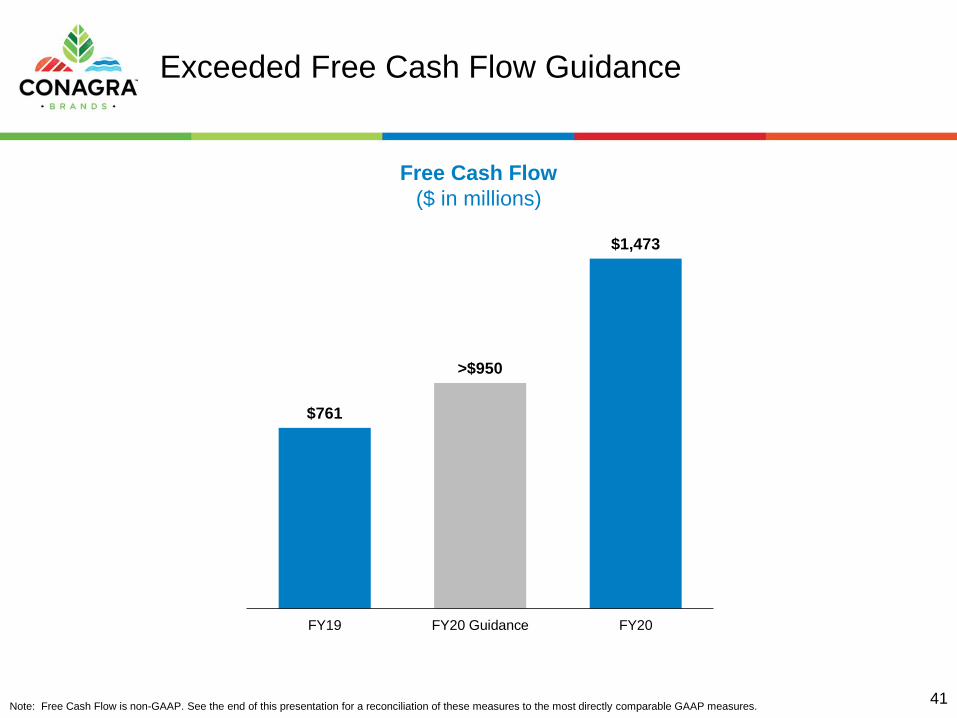
Exceeded Free Cash Flow Guidance
Free Cash Flow
($ in millions)
$761
>$950
$1,473
FY19 FY20 Guidance FY20
Note: Free Cash Flow is non-GAAP. See the end of this presentation for a reconciliation of these measures to the most directly comparable GAAP measures. 41
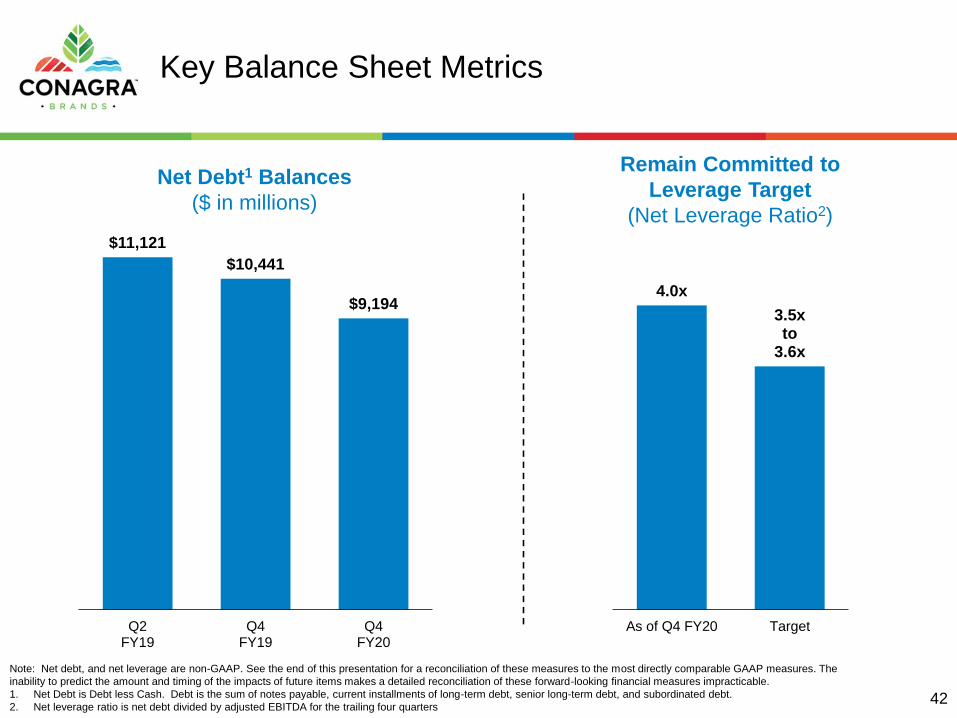
Key Balance Sheet Metrics
Note: Net debt, and net leverage are non-GAAP. See the end of this presentation for a reconciliation of these measures to the most directly comparable GAAP measures. The
inability to predict the amount and timing of the impacts of future items makes a detailed reconciliation of these forward-looking financial measures impracticable.
1. Net Debt is Debt less Cash. Debt is the sum of notes payable, current installments of long-term debt, senior long-term debt, and subordinated debt.
2. Net leverage ratio is net debt divided by adjusted EBITDA for the trailing four quarters
Net Debt1 Balances
($ in millions)
Remain Committed to
Leverage Target
(Net Leverage Ratio2)
$11,121
$10,441
$9,194
Q2FY19
Q4FY19
Q4FY20
4.0x
3.5x to
3.6x
As of Q4 FY20 Target
42

Continued Deleveraging Actions
• Pre-paid remaining $275 million outstanding under senior floating rate notes due in October 2020
• Obtained a currently undrawn $600 million senior 3-year unsecured term loan, drawable in-full or in-part through October 2020
• Allows for flexibility in repaying debt maturities in fiscal 2021
• Positions Conagra to refinance fiscal 2021 debt maturities at attractive rates with pre-payable debt
• Remain confident in ability to achieve leverage ratio target of 3.5x to 3.6x by the end of fiscal 2021
• Committed to maintaining solid investment grade credit ratings
43

Metric Fiscal 2021 Q1 Guidance1
Organic Net Sales Growth3 +10% to +13%
Adj. Operating Margin4 17.0% to 17.5%
Adj. Diluted EPS from cont. ops. $0.54 to $0.59
1. The inability to predict the amount and timing of the impacts of future items makes a detailed reconciliation of these forward-looking financial measures impracticable.
2. “Adjusted” financial measures and organic net sales are non-GAAP financial measures.
3. Organic net sales growth excludes the impact of foreign exchange and divested businesses, acquisitions (until the anniversary date of the acquisitions), as well as the
impact of any 53rd week.
4. Adjusted operating margin excludes equity method investment earnings and pension and postretirement non-service expense (income).
Outlook1,2
44
Remain confident in ability to achieve leverage ratio target of
3.5x to 3.6x by the end of fiscal 2021
Metric Fiscal 2022 Target1
Organic Net Sales Growth3
(3 YR CAGR ending FY22)
+1% to +2%(no change)
Adj. Operating Margin4 18% to 19%(no change)
Adj. Diluted EPS from cont. ops.$2.66 to $2.76
(no change)
Free Cash Flow Conversion(% of Adj. Net Income; 3 YR avg. ending FY22)
95%+(no change)

Q&A

Appendix

Reconciliation of Non-GAAP Financial Measures to Reported Financial Measures (in millions)
47
1. A portion of our Net Sales from divested businesses relates to our private label peanut butter business, which we exited in Q3 FY20. This exit occurred in waves, and therefore
produced net sales through the end of fiscal 2020.
2. Organic net sales growth excludes the impact of fiscal 2020’s 53rd week, which was calculated as one-sixth of our last month’s net sales (which included a total of six weeks).
3. Percentage points may include rounding to bridge the change in reported net sales to the change in organic net sales.
Q4 FY20
Grocery &
Snacks
Refrigerated
& Frozen International Foodservice
Total Conagra
Brands
Net Sales $ 1,474.1 $ 1,355.4 $ 265.7 $ 192.7 $ 3,287.9
Impact of foreign exchange — — 18.8 — 18.8
Impact of 53rd week 2 (91.6 ) (91.0 ) (16.1 ) (13.1 ) (211.8 )
Net sales from divested businesses 1 (0.3 ) — — — (0.3 )
Organic Net Sales $ 1,382.2 $ 1,264.4 $ 268.4 $ 179.6 $ 3,094.6
Year-over-year change - Net Sales 44.1 % 23.3 % 18.6 % (27.9 )% 25.8 %
Impact of foreign exchange (pp) — — 8.4 — 0.7
Impact of 53rd week (pp) (9.0 ) (8.3 ) (7.2 ) (4.9 ) (8.1 )
Net sales from divested businesses (pp) 3 5.3 2.6 — 1.3 3.1
Organic Net Sales 40.4 % 17.6 % 19.8 % (31.5 )% 21.5 %
Volume (Organic) 38.0 % 17.8 % 18.0 % (34.2 )% 21.0 %
Price/Mix 2.4 % (0.2 )% 1.8 % 2.7 % 0.5 %
Q4 FY19
Grocery &
Snacks
Refrigerated
& Frozen International Foodservice
Total Conagra
Brands
Net Sales $ 1,022.6 $ 1,099.2 $ 224.0 $ 267.4 $ 2,613.2
Net sales from divested businesses 1 (37.9 ) (23.4 ) — (5.1 ) (66.4 )
Organic Net Sales $ 984.7 $ 1,075.8 $ 224.0 $ 262.3 $ 2,546.8

Reconciliation of Non-GAAP Financial Measures to Reported Financial Measures (in millions)
1. A portion of our Net Sales from divested businesses relates to our private label peanut butter business, which we exited in Q3 FY20. This exit occurred in waves, and therefore
produced net sales through the end of fiscal 2020.
2. Organic net sales growth excludes the impact of fiscal 2020’s 53rd week, which was calculated as one-sixth of our last month’s net sales (which included a total of six weeks).
3. Percentage points may include rounding to bridge the change in reported net sales to the change in organic net sales. 48
FY20
Grocery &
Snacks
Refrigerated
& Frozen International Foodservice
Total Conagra
Brands
Net Sales $ 4,617.1 $ 4,559.6 $ 925.3 $ 952.4 $ 11,054.4
Impact of foreign exchange — — 18.2 — 18.2
Impact of 53rd week 2 (91.6 ) (91.0 ) (16.1 ) (13.1 ) (211.8 )
Net sales from acquired businesses (406.3 ) (567.6 ) (46.0 ) (57.7 ) (1,077.6 )
Net sales from divested businesses 1 (69.2 ) (23.2 ) — (11.2 ) (103.6 )
Organic Net Sales $ 4,050.0 $ 3,877.8 $ 881.4 $ 870.4 $ 9,679.6
Year-over-year change - Net Sales 17.7 % 22.1 % 7.0 % (6.2 )% 15.9 %
Impact of foreign exchange (pp) — — 2.1 — 0.2
Impact of 53rd week (pp) (2.3 ) (2.4 ) (1.9 ) (1.3 ) (2.2 )
Net sales from acquired businesses (pp) 3 (9.9 ) (15.1 ) (5.1 ) (6.1 ) (11.1 )
Net sales from divested businesses (pp) 3.7 1.5 2.4 3.7 2.8
Net sales from sold Trenton plant (pp) — — — 0.2 —
Organic Net Sales 9.2 % 6.1 % 4.5 % (9.7 )% 5.6 %
Volume (Organic) 9.8 % 5.0 % 3.9 % (12.6 )% 5.2 %
Price/Mix (0.6 )% 1.1 % 0.6 % 2.9 % 0.4 %
FY19
Grocery &
Snacks
Refrigerated
& Frozen International Foodservice
Total Conagra
Brands
Net Sales $ 3,923.6 $ 3,735.4 $ 864.4 $ 1,015.0 $ 9,538.4
Net sales from divested businesses 1 (215.0 ) (80.7 ) (21.2 ) (49.2 ) (366.1 )
Net sales from sold Trenton plant — — — (2.0 ) (2.0 )
Organic Net Sales $ 3,708.6 $ 3,654.7 $ 843.2 $ 963.8 $ 9,170.3

Reconciliation of Non-GAAP Financial Measures to Reported Financial Measures (in millions)
Q4 FY20
Grocery &
Snacks
Refrigerated
& Frozen International Foodservice
Corporate
Expense
Total
Conagra
Brands
Operating Profit $ 300.4 $ 168.5 $ 27.1 $ 1.0 $ (106.2 ) $ 390.8
Restructuring plans 9.2 3.5 0.2 — 9.5 22.4
Acquisitions and divestitures — — — — 1.7 1.7
Intangible impairment charges 42.9 95.0 8.3 — — 146.2
Legal matters — — — — 5.0 5.0
Corporate hedging derivative losses (gains) — — — — (3.7 ) (3.7 )
Adjusted Operating Profit $ 352.5 $ 267.0 $ 35.6 $ 1.0 $ (93.7 ) $ 562.4
Operating Profit Margin 20.4 % 12.4 % 10.2 % 0.5 % 11.9 %
Adjusted Operating Profit Margin 23.9 % 19.7 % 13.4 % 0.5 % 17.1 %
Year-over-year % change - Operating Profit 115.4 % (17.2 )% 168.5 % (97.1 )% 40.8 % 24.8 %
Year-over year % change - Adjusted Operating Profit 91.2 % 45.7 % 47.2 % (97.1 )% 12.6 % 63.5 %
Year-over-year bps change - Adjusted Operating Profit 589 bps 302 bps 260 bps (1,277 ) bps 394 bps
Q4 FY19
Grocery &
Snacks
Refrigerated
& Frozen International Foodservice
Corporate
Expense
Total
Conagra
Brands
Operating Profit $ 139.4 $ 203.7 $ 10.1 $ 35.5 $ (75.4 ) $ 313.3
Restructuring plans 0.9 0.7 1.0 — 28.3 30.9
Intangible impairment charges 76.5 — 13.1 — — 89.6
Acquisitions and divestitures — 0.7 — — 1.6 2.3
Inventory fair value mark-up rollout 0.5 1.2 — — — 1.7
Legal matters — — — — (39.1 ) (39.1 )
Gain on divestiture of businesses (33.1 ) (23.1 ) — — — (56.2 )
Fair value adjustment of cash settleable equity awards issued
in connection with Pinnacle acquisition — — — — 3.5 3.5
Corporate hedging derivative losses (gains) — — — — (2.0 ) (2.0 )
Adjusted Operating Profit $ 184.2 $ 183.2 $ 24.2 $ 35.5 $ (83.1 ) $ 344.0
Operating Profit Margin 13.6 % 18.5 % 4.5 % 13.3 % 12.0 %
Adjusted Operating Profit Margin 18.0 % 16.7 % 10.8 % 13.3 % 13.2 %
49

Reconciliation of Non-GAAP Financial Measures to Reported Financial Measures (in millions)
FY20
Grocery &
Snacks
Refrigerated
& Frozen International Foodservice
Corporate
Expense
Total
Conagra
Brands
Operating Profit $ 915.2 $ 702.2 $ 100.6 $ 97.6 $ (368.5 ) $ 1,447.1
Restructuring plans 58.4 15.8 1.6 — 63.1 138.9
Acquisitions and divestitures 3.0 — — — 2.3 5.3
Impairment of businesses held for sale 31.4 27.6 — — — 59.0
Intangible impairment charges 46.4 110.8 8.3 — — 165.5
Loss on divestiture of businesses 1.5 0.2 — — — 1.7
Contract settlement gain (11.9 ) — — — — (11.9 )
Legal matters — — — — 3.5 3.5
Environmental matters — — — — 6.6 6.6
Corporate hedging derivative losses (gains) — — — — 5.5 5.5
Adjusted Operating Profit $ 1,044.0 $ 856.6 $ 110.5 $ 97.6 $ (287.5 ) $ 1,821.2
Operating Profit Margin 19.8 % 15.4 % 10.9 % 10.3 % 13.1 %
Adjusted Operating Profit Margin 22.6 % 18.8 % 11.9 % 10.3 % 16.5 %
Year-over-year % change - Operating Profit 20.0 % 8.9 % 0.8 % (27.3 )% (20.3 )% 22.7 %
Year-over year % change - Adjusted Operating Profit 23.8 % 32.3 % 2.0 % (27.3 )% 8.8 % 23.9 %
Year-over-year bps change - Adjusted Operating Profit 111 bps 145 bps (59) bps (298) bps 107 bps
FY19
Grocery &
Snacks
Refrigerated
& Frozen International Foodservice
Corporate
Expense
Total
Conagra
Brands
Operating Profit $ 762.6 $ 645.1 $ 99.8 $ 134.3 $ (462.2 ) $ 1,179.6
Restructuring plans 6.1 2.9 4.9 — 167.5 181.4
Intangible impairment charges 76.5 — 13.1 — — 89.6
Gain on divestiture of businesses (33.1 ) (23.1 ) (13.2 ) — — (69.4 )
Acquisitions and divestitures 1.0 0.7 2.9 — 101.6 106.2
Integration costs — — — — 8.9 8.9
Inventory fair value mark-up rollout 30.2 21.9 0.9 — — 53.0
Novation of a legacy guarantee — — — — (27.3 ) (27.3 )
Legal matters — — — — (39.1 ) (39.1 )
Fair value adjustment of cash settleable equity awards issued in connection with Pinnacle acquisition — — — — (15.1 ) (15.1 )
Corporate hedging derivative losses (gains) — — — — 1.8 1.8
Adjusted Operating Profit $ 843.3 $ 647.5 $ 108.4 $ 134.3 $ (263.9 ) $ 1,469.6
Operating Profit Margin 19.4 % 17.3 % 11.5 % 13.2 % 12.4 %
Adjusted Operating Profit Margin 21.5 % 17.3 % 12.5 % 13.2 % 15.4 %
50

Reconciliation of Non-GAAP Financial Measures to Reported Financial Measures (in millions)
1. Operating profit is derived from taking Income from continuing operations before income taxes and equity method investment earnings, adding back Interest expense, net
and removing Pension and postretirement non-service expense (income).
2. Advertising and promotion expense (A&P) has been removed from adjusted selling, general and administrative expense because this metric is used in reporting to
management, and management believes this adjusted measure provides useful supplemental information to assess the Company’s operating performance. Please note
that A&P is not removed from adjusted profit measures.
3. Includes charges related to consolidated joint ventures. These charges are recorded at 100% for all line items before Net income attributable to Conagra Brands, Inc. Net
income attributable to Conagra Brands, Inc. excludes Net income (loss) attributable to noncontrolling interests.
Q4 FY20 Gross profit
Selling,
general and administrative
expenses Operating
profit 1
Income before
income taxes and
equity method
investment earnings
Income tax
expense
Income
tax rate
Net income
attributable to
Conagra
Brands, Inc.
Diluted EPS from
income attributable
to Conagra
Brands, Inc common
stockholders
Reported $ 922.8 $ 532.0 $ 390.8 $ 238.2 $ 59.8 22.9 % $ 201.4 $ 0.41
% of Net Sales 28.1 % 16.2 % 11.9 %
Restructuring plans 10.2 12.2 22.4 22.4 5.6 16.8 0.03
Acquisitions and divestitures — 1.7 1.7 1.7 0.4 1.3 —
Corporate hedging derivative losses (gains) (3.7 ) — (3.7 ) (3.7 ) (0.9 ) (2.8 ) (0.01 )
Advertising and promotion expenses 2 — 59.2 — — — — —
Pension valuation adjustment — — — 44.8 11.2 33.6 0.07
Adjustment to gain on Ardent JV asset sale — — — — — 0.1 —
Intangible impairment charges — 146.2 146.2 146.2 34.0 112.2 0.23
Legal matters — 5.0 5.0 5.0 1.3 3.7 0.01
Unusual tax items — — — — (1.3 ) 1.3 —
Rounding — — — — — — 0.01
Adjusted $ 929.3 $ 307.7 $ 562.4 $ 454.6 $ 110.1 23.0 % $ 367.6 $ 0.75
% of Net Sales 28.3 % 9.4 % 17.1 %
Year-over-year % of net sales change - reported 97 bps 107 bps (10) bps
Year-over-year % of net sales change - adjusted 113 bps (178) bps 394 bps
Year-over-year change - reported 30.3 % 34.8 % 24.8 % 26.8 % (16.7 )% 59.2 % 57.7 %
Year-over-year change - adjusted 31.1 % 5.7 % 63.5 % 103.9 % 93.6 % 110.6 % 108.3 %
51

Reconciliation of Non-GAAP Financial Measures to Reported Financial Measures (in millions)
1. Operating profit is derived from taking Income from continuing operations before income taxes and equity method investment earnings, adding back Interest expense, net
and removing Pension and postretirement non-service expense (income).
2. Advertising and promotion expense (A&P) has been removed from adjusted selling, general and administrative expense because this metric is used in reporting to
management, and management believes this adjusted measure provides useful supplemental information to assess the Company’s operating performance. Please note
that A&P is not removed from adjusted profit measures.
3. Includes charges related to consolidated joint ventures. These charges are recorded at 100% for all line items before Net income attributable to Conagra Brands, Inc. Net
income attributable to Conagra Brands, Inc. excludes Net income (loss) attributable to noncontrolling interests.
Q4 FY19 Gross profit
Selling,
general and administrative
expenses Operating
profit 1
Income before
income taxes and
equity method
investment earnings
Income tax
expense
Income
tax rate
Net income
attributable to
Conagra
Brands, Inc.
Diluted EPS from
income attributable
to Conagra
Brands, Inc common
stockholders
Reported $ 708.0 $ 394.7 $ 313.3 $ 187.8 $ 71.8 36.5 % $ 126.5 $ 0.26
% of Net Sales 27.1 % 15.1 % 12.0 %
Restructuring plans 1.3 29.6 30.9 30.9 7.7 23.2 0.05
Acquisitions and divestitures — 2.3 2.3 2.3 0.4 1.9 —
Intangible impairment charges 3 — 89.6 89.6 89.6 20.8 66.9 0.14
Corporate hedging derivative losses (gains) (2.0 ) — (2.0 ) (2.0 ) (0.5 ) (1.5 ) —
Advertising and promotion expenses 2 — 73.9 — — — — —
Inventory fair value mark-up rollout 1.7 — 1.7 1.7 0.4 1.3 —
Legal matters — (39.1 ) (39.1 ) (39.1 ) (10.0 ) (29.1 ) (0.06 )
Fair value adjustment of cash settleable equity
awards issued in connection with Pinnacle
acquisition — 3.5 3.5 3.5 (1.8 ) 5.3 0.01
Gain on divestiture of businesses — (56.2 ) (56.2 ) (56.2 ) (30.7 ) (25.5 ) (0.05 )
Pension valuation adjustment — — — 4.3 1.1 3.2 0.01
Capital loss valuation allowance adjustment — — — — 8.1 (8.1 ) (0.02 )
Unusual tax items — — — — (10.5 ) 10.5 0.02
Adjusted $ 709.0 $ 291.1 $ 344.0 $ 222.8 $ 56.8 24.5 % $ 174.6 $ 0.36
% of Net Sales 27.1 % 11.1 % 13.2 %
52

Reconciliation of Non-GAAP Financial Measures to Reported Financial Measures (in millions)
1. Operating profit is derived from taking Income from continuing operations before income taxes and equity method investment earnings, adding back Interest expense, net
and removing Pension and postretirement non-service expense (income).
2. Advertising and promotion expense (A&P) has been removed from adjusted selling, general and administrative expense because this metric is used in reporting to
management, and management believes this adjusted measure provides useful supplemental information to assess the Company’s operating performance. Please note
that A&P is not removed from adjusted profit measures.
3. Includes charges related to consolidated joint ventures. These charges are recorded at 100% for all line items before Net income attributable to Conagra Brands, Inc. Net
income attributable to Conagra Brands, Inc. excludes Net income (loss) attributable to noncontrolling interests.
FY20 Gross profit
Selling,
general and administrative
expenses Operating
profit 1
Income before
income taxes and
equity method
investment earnings
Income tax
expense
Income
tax rate
Net income
attributable to
Conagra
Brands, Inc.
Diluted EPS from
income attributable
to Conagra
Brands, Inc common
stockholders
Reported $ 3,069.6 $ 1,622.5 $ 1,447.1 $ 969.9 $ 201.3 19.3 % $ 840.1 $ 1.72
% of Net Sales 27.8 % 14.7 % 13.1 %
Restructuring plans 33.2 105.7 138.9 139.5 32.7 106.8 0.22
Acquisitions and divestitures — 5.3 5.3 5.3 1.4 3.9 0.01
Corporate hedging derivative losses (gains) 5.5 — 5.5 5.5 1.4 4.1 0.01
Advertising and promotion expenses 2 — 230.7 — — — — —
Pension settlement and valuation adjustment — — — 42.9 10.8 32.1 0.07
Gain on Ardent JV asset sale — — — — (1.0 ) (3.1 ) (0.01 )
Impairment of businesses held for sale — 59.0 59.0 59.0 4.0 55.0 0.11
Contract settlement gain — (11.9 ) (11.9 ) (11.9 ) (3.0 ) (8.9 ) (0.02 )
Intangible impairment charges — 165.5 165.5 165.5 38.5 127.0 0.26
Legal matters — 3.5 3.5 3.5 0.9 2.6 0.01
Environmental matters — 6.6 6.6 6.6 1.6 5.0 0.01
Loss on divestiture of businesses — 1.7 1.7 1.7 (0.2 ) 1.9 —
Unusual tax items — — — — 51.2 (51.2 ) (0.10 )
Rounding — — — — — — (0.01 )
Adjusted $ 3,108.3 $ 1,056.4 $ 1,821.2 $ 1,387.5 $ 339.6 23.2 % $ 1,115.3 $ 2.28
% of Net Sales 28.1 % 9.6 % 16.5 %
Year-over-year % of net sales change - reported (5) bps (77) bps 73 bps
Year-over-year % of net sales change - adjusted (39) bps (88) bps 107 bps
Year-over-year change - reported 15.7 % 10.1 % 22.7 % 17.8 % (8.0 )% 23.8 % 12.4 %
Year-over-year change - adjusted 14.3 % 6.1 % 23.9 % 22.9 % 15.7 % 24.7 % 13.4 %
53

Reconciliation of Non-GAAP Financial Measures to Reported Financial Measures (in millions)
1. Operating profit is derived from taking Income from continuing operations before income taxes and equity method investment earnings, adding back Interest expense, net
and removing Pension and postretirement non-service expense (income).
2. Advertising and promotion expense (A&P) has been removed from adjusted selling, general and administrative expense because this metric is used in reporting to
management, and management believes this adjusted measure provides useful supplemental information to assess the Company’s operating performance. Please note
that A&P is not removed from adjusted profit measures.
3. Includes charges related to consolidated joint ventures. These charges are recorded at 100% for all line items before Net income attributable to Conagra Brands, Inc. Net
income attributable to Conagra Brands, Inc. excludes Net income (loss) attributable to noncontrolling interests.
FY19 Gross profit
Selling,
general and administrative
expenses Operating
profit 1
Income from
continuing
operations before
income taxes and
equity method
investment earnings
Income tax
expense
Income
tax rate
Net income
attributable to
Conagra
Brands, Inc.
Diluted EPS from
income
from continuing
operations
attributable
to Conagra
Brands, Inc common
stockholders
Reported $ 2,653.0 $ 1,473.4 $ 1,179.6 $ 823.3 $ 218.8 24.3 % $ 678.3 $ 1.53
% of Net Sales 27.8 % 15.4 % 12.4 %
Restructuring plans 11.1 170.3 181.4 180.8 41.9 138.9 0.31
Acquisitions and divestitures — 106.2 106.2 118.1 23.3 94.8 0.21
Integration costs — 8.9 8.9 8.9 2.3 6.6 0.01
Corporate hedging derivative losses (gains) 1.8 — 1.8 1.8 0.4 1.4 —
Advertising and promotion expenses 2 — 253.4 — — — — —
Legal matters — (39.1 ) (39.1 ) (39.1 ) (10.0 ) (29.1 ) (0.07 )
Inventory fair value mark-up rollout 53.0 — 53.0 53.0 13.5 39.5 0.09
Novation of a legacy guarantee — (27.3 ) (27.3 ) (27.3 ) — (27.3 ) (0.06 )
Fair value adjustment of cash settleable equity
awards issued in connection with Pinnacle
acquisition
— (15.1 ) (15.1 ) (15.1 ) (2.9 ) (12.2 ) (0.03 )
Gain on divestiture of businesses — (69.4 ) (69.4 ) (69.4 ) (34.3 ) (35.1 ) (0.08 )
Intangible impairment charges 3 — 89.6 89.6 89.6 20.8 66.9 0.15
Pension valuation adjustment — — — 4.3 1.1 3.2 0.01
Gain on Ardent JV asset sale — — — — (3.5 ) (11.6 ) (0.03 )
Capital loss valuation allowance adjustment — — — — 32.4 (32.4 ) (0.07 )
Unusual tax items — — — — (10.4 ) 10.4 0.02
Loss from discontinued operations, net of
noncontrolling interests — — — — — 1.9 —
Rounding — — — — — — 0.02
Adjusted $ 2,718.9 $ 995.9 $ 1,469.6 $ 1,128.9 $ 293.4 24.7 % $ 894.2 $ 2.01
% of Net Sales 28.5 % 10.4 % 15.4 %
54

Reconciliation of Non-GAAP Financial Measures to Reported Financial Measures (in millions)
1. Excludes comparability items related to depreciation.
2. Excludes comparability items attributable to noncontrolling interests.
Q4 FY20 Q4 FY19 % Change
Net income attributable to Conagra Brands, Inc. $ 201.4 $ 126.5 59.2 %
Add Back: Income tax expense 59.8 71.8
Income tax expense attributable to noncontrolling interests (0.6 ) 0.8
Interest expense, net 125.3 130.9
Depreciation 81.5 85.3
Amortization 14.9 15.1
Earnings before interest, taxes, depreciation, and amortization $ 482.3 $ 430.4 12.1 %
Restructuring plans 1 13.6 27.0
Acquisitions and divestitures 1.7 2.3
Corporate hedging derivative losses (gains) (3.7 ) (2.0 )
Pension valuation adjustment 44.8 4.3
Intangible impairment charges 2 146.2 86.5
Inventory fair value mark-up rollout — 1.7
Gain on divestiture of businesses — (56.2 )
Legal matters 5.0 (39.1 )
Fair value adjustment of cash settleable equity awards issued in connection
with Pinnacle acquisition — 3.5
Adjustment to gain on Ardent JV asset sale 0.1 —
Adjusted Earnings before interest, taxes, depreciation, and amortization $ 690.0 $ 458.4 50.5 %
55

Reconciliation of Non-GAAP Financial Measures to Reported Financial Measures (in millions)
1. Excludes comparability items related to depreciation.
2. Excludes comparability items related to interest expense.
3. Excludes comparability items attributable to noncontrolling interests.
FY20 FY19 % Change
Net income attributable to Conagra Brands, Inc. $ 840.1 $ 678.3 23.8 %
Less: Loss from discontinued operations, net of tax — (1.9 )
Add Back: Income tax expense 201.3 218.8
Income tax expense attributable to noncontrolling interests (0.9 ) (0.1 )
Interest expense, net 487.1 391.4
Depreciation 329.1 283.9
Amortization 59.8 49.1
Earnings before interest, taxes, depreciation, and amortization $ 1,916.5 $ 1,623.3 18.1 %
Restructuring plans 1 106.5 171.2
Acquisitions and divestitures 2 5.3 106.2
Integration costs — 8.9
Corporate hedging derivative losses (gains) 5.5 1.8
Pension settlement and valuation adjustment 42.9 4.3
Impairment of businesses held for sale 59.0 —
Inventory fair value mark-up rollout — 53.0
Loss (gain) on divestiture of businesses 1.7 (69.4 )
Novation of a legacy guarantee — (27.3 )
Fair value adjustment of cash settleable equity awards issued in connection
with Pinnacle acquisition — (15.1 )
Legal matters 3.5 (39.1 )
Environmental matters 6.6 —
Contract settlement gain (11.9 ) —
Intangible impairment charges 3 165.5 86.5
Gain on Ardent JV asset sale (4.1 ) (15.1 )
Adjusted Earnings before interest, taxes, depreciation, and amortization $ 2,297.0 $ 1,889.2 21.6 %
56

Reconciliation of Non-GAAP Financial Measures to Reported Financial Measures (in millions)
FY20 FY19 % Change
Interest expense, net $ 487.1 $ 391.4 24.5 %
Acquisitions and divestitures — (11.9 )
Adjusted interest expense, net $ 487.1 $ 379.5 28.4 %
Q4 FY20 Q4 FY19 % Change
Equity method investment earnings $ 22.9 $ 9.2 148.8 %
Adjustment to gain on Ardent JV asset sale 0.1 —
Adjusted equity method investment earnings $ 23.0 $ 9.2 150.6 %
FY20 FY19 % Change
Equity method investment earnings $ 73.2 $ 75.8 (3.4 )%
Gain on Ardent JV asset sale (4.1 ) (15.1 )
Adjusted equity method investment earnings $ 69.1 $ 60.7 14.0 %
Q4 FY20 Q4 FY19 % Change
Pension and postretirement non-service expense (income) $ 27.3 $ (5.4 ) N/A
Pension valuation adjustment (44.8 ) (4.3 )
Adjusted pension and postretirement non-service income $ (17.5 ) $ (9.7 ) 79.3 %
FY20 FY19 % Change
Pension and postretirement non-service income $ (9.9 ) $ (35.1 ) (71.9 )%
Restructuring plans (0.6 ) 0.6
Pension settlement and valuation adjustment (42.9 ) (4.3 )
Adjusted pension and postretirement non-service income $ (53.4 ) $ (38.8 ) 37.3 %
57
May 31, 2020 May 26, 2019
Net cash flows from operating activities - continuing operations $ 1,842.6 $ 1,114.3
Additions to property, plant and equipment (369.5 ) (353.1 )
Free cash flow $ 1,473.1 $ 761.2

Reconciliation of Non-GAAP Financial Measures to Reported Financial Measures (in millions)
Q2 FY19 Q3 FY19 Q4 FY19 Q1 FY20 Q2 FY20 Q3 FY20 Q4 FY20
Notes payable $ 0.9 $ — $ 1.0 $ 56.0 $ 0.5 $ 0.8 $ 1.1
Current installments of long-term debt 17.2 19.9 20.6 150.1 1,173.8 923.8 845.5
Senior long-term debt, excluding current
installments 11,349.5 10,911.8 10,459.8 10,127.5 9,100.0 8,897.8 8,900.8
Subordinated debt 195.9 195.9 195.9 195.9 195.9 195.9 —
Total Debt $ 11,563.5 $ 11,127.6 $ 10,677.3 $ 10,529.5 $ 10,470.2 $ 10,018.3 $ 9,747.4
Less: Cash 442.3 282.2 236.6 64.7 192.0 99.0 553.3
Net Debt $ 11,121.2 $ 10,845.4 $ 10,440.7 $ 10,464.8 $ 10,278.2 $ 9,919.3 $ 9,194.1
58

Reconciliation of Non-GAAP Financial Measures to Reported Financial Measures (in millions)
1. Excludes comparability items related to depreciation.
FY20
Net Debt $ 9,194.1
Net income attributable to Conagra Brands, Inc. $ 840.1
Add Back: Income tax expense 201.3
Income tax expense attributable to noncontrolling interests (0.9 )
Interest expense, net 487.1
Depreciation 329.1
Amortization 59.8
Earnings before interest, taxes, depreciation, and amortization (EBITDA) $ 1,916.5
Restructuring plans 1 106.5
Acquisitions and divestitures 5.3
Corporate hedging derivative losses 5.5
Pension settlement and valuation adjustment 42.9
Impairment of businesses held for sale 59.0
Loss on divestiture of businesses 1.7
Legal matters 3.5
Environmental matters 6.6
Contract settlement gain (11.9 )
Intangible impairment charges 165.5
Gain on Ardent JV asset sale (4.1 )
Adjusted EBITDA $ 2,297.0
Net Debt to Adjusted EBITDA 4.0
59

Reconciliation of Non-GAAP Financial Measures to Reported Financial Measures (in millions)
1. Excludes comparability items related to depreciation.
2. Excludes comparability items attributable to noncontrolling interests.
3. Last twelve months
Q3 FY20 LTM3
Net Debt $ 9,919.3
Net income attributable to Conagra Brands, Inc. $ 765.2
Add Back: Income tax expense 213.3
Income tax expense attributable to noncontrolling interests 0.5
Interest expense, net 492.7
Depreciation 332.9
Amortization 60.0
Earnings before interest, taxes, depreciation, and amortization (EBITDA) $ 1,864.6
Restructuring plans 1 119.9
Acquisitions and divestitures 5.9
Corporate hedging losses 7.2
Pension settlement and valuation adjustment 2.4
Impairment of businesses held for sale 59.0
Inventory fair value mark-up rollout 1.7
Gain on divestiture of businesses (54.5 )
Fair value adjustment of cash settleable equity awards issued in connection with Pinnacle
acquisition 3.5
Legal matters (40.6 )
Environmental matters 6.6
Contract settlement gain (11.9 )
Intangible impairment charges 2 105.8
Gain on Ardent JV asset sale (4.2 )
Adjusted EBITDA $ 2,065.4
Net Debt to Adjusted LTM EBITDA 4.8
60