Embed Size (px)
Citation preview

FY18/19 Earnings Announcement
2019 Lenovo Internal. All rights reserved.
May 23, 2019 – Hong Kong
Forward Looking Statement
This presentation contains “forward-looking statements” which are statements that refer to expectations and plans for the future and include, without limitation, statements regarding Lenovo’s future results of operations, financial condition or business prospects as well as other statements based on projections, estimates and assumptions. In some cases, these statements can be identified by terms such as "expect," "intend," "plan," "believe," "estimate," "may," "will," "should" and comparable words (including the negative of such words). These forward-looking statements, reflect the current expectations and plans of the directors and management of Lenovo, which may not materialize or may change. Many risks, uncertainties and other factors, some of which are unpredictable and beyond Lenovo’s control, could affect the matters discussed in these forward-looking statements. These factors include, without limitation, economic and business conditions globally and in the countries where we operate, Lenovo’s ability to predict and respond quickly to market developments, consumer demand, pricing trends and competition; changes in applicable laws and regulations (including applicable tax and tariff rates). Any variance from the expectations or plans on which these forward-looking statements are based could cause Lenovo’s actual results or actions to differ materially from those expressed or implied in these statements. These forward-looking statements are not guarantees of future performance and you are cautioned not to place undue reliance on these statements. Lenovo undertakes no obligation to update any forward-looking statements in this presentation, whether as a result of new information or any subsequent change, development or event. All forward-looking statements in this presentation are qualified by reference to this paragraph.
2019 Lenovo Internal. All rights reserved. 2
Yuanqing YangChairman & CEO
2019 Lenovo Internal. All rights reserved.
May 23, 2019 – Hong Kong
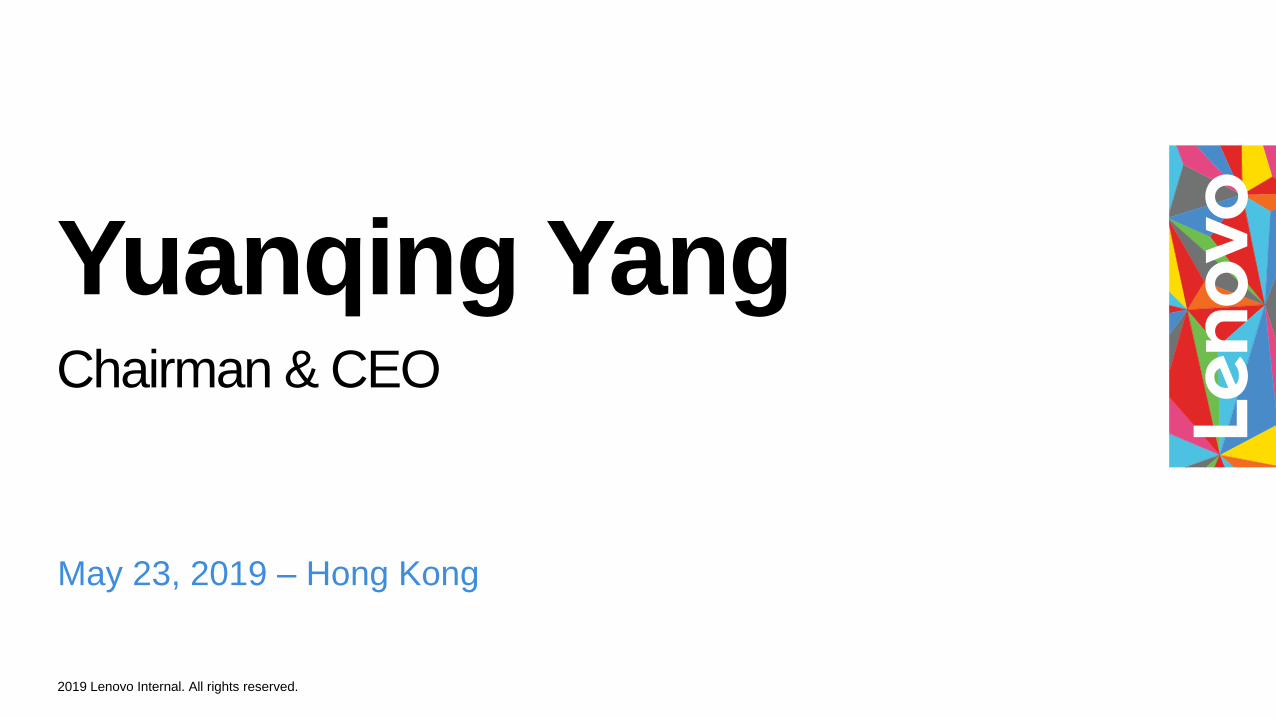
Strong Q4 Performance• Revenue and profit improved across all businesses
• Group revenue reached $11.7B, up 10.1% YOY
• Pre-tax Income: $180M, up 389% YOY.
• Net income: $118M, up 261% YOY
Revenue ($B)
Source: Internal Data
37
180
Q4 1718 Q4 1819
+389%
PTI ($M) Net Income ($M)
33
118
Q4 1718 Q4 1819
+261%
4
Q4 1718 Q41819
+10.1%
10.64
11.7
2019 Lenovo Internal. All rights reserved.
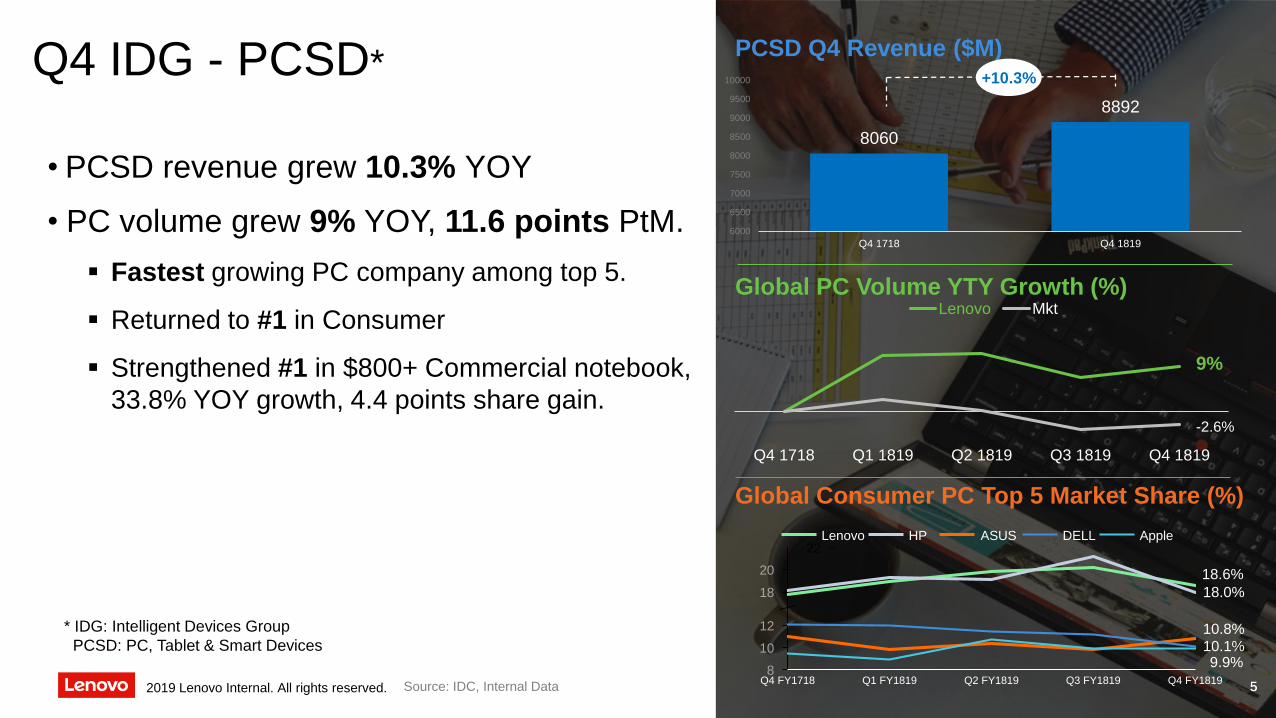
Q4 IDG - PCSD*
• PCSD revenue grew 10.3% YOY
• PC volume grew 9% YOY, 11.6 points PtM.
Fastest growing PC company among top 5.
Returned to #1 in Consumer
Strengthened #1 in $800+ Commercial notebook,
33.8% YOY growth, 4.4 points share gain.
5Source: IDC, Internal Data
Global PC Volume YTY Growth (%)
8060
8892
6000
6500
7000
7500
8000
8500
9000
9500
10000
Q4 1718 Q4 1819
PCSD Q4 Revenue ($M)
Global Consumer PC Top 5 Market Share (%)
+10.3%
* IDG: Intelligent Devices Group
PCSD: PC, Tablet & Smart Devices
Q4 1718 Q1 1819 Q2 1819 Q3 1819 Q4 1819
Lenovo Mkt
9%
-2.6%
5
8
18
20
10
22
12
Q2 FY1819Q4 FY1718 Q1 FY1819 Q3 FY1819
18.6%
18.0%
10.8%
Q4 FY1819
10.1%9.9%
Lenovo HP DELLASUS Apple
2019 Lenovo Internal. All rights reserved.

Q4 IDG - Mobile
• Profitable for second straight quarter
• Pre-tax income up $146M YOY
• Revenue resumed growth after 5 quarters, at
15.1% YOY, outgrew market by 26.8 points
Latin America grew 17 points PtM
North America grew 57.3 points PtM;
Europe grew 230.7points PtM;
China grew 604.6 points PtM
• World’s first 5G mobile product now in stores
Mobile Q4 Revenue ($M)
1342
1545
1000
1100
1200
1300
1400
1500
1600
1700
1800
Q4 1718 Q4 1819
+15.1%
Mobile Q4 Revenue Growth YOY by Geo (%)
Source: IDC, Internal Data 6
Latin America North America
-7.2%
9.8%
Market Lenovo
Europe
-12.6%
44.7%
Market Lenovo
-11.9%
592.8%
Market Lenovo
+57.3 pts
China
+604.6 pts
+17.0 pts
-5.6%
225.0%
Market Lenovo
+230.7pts
2019 Lenovo Internal. All rights reserved.
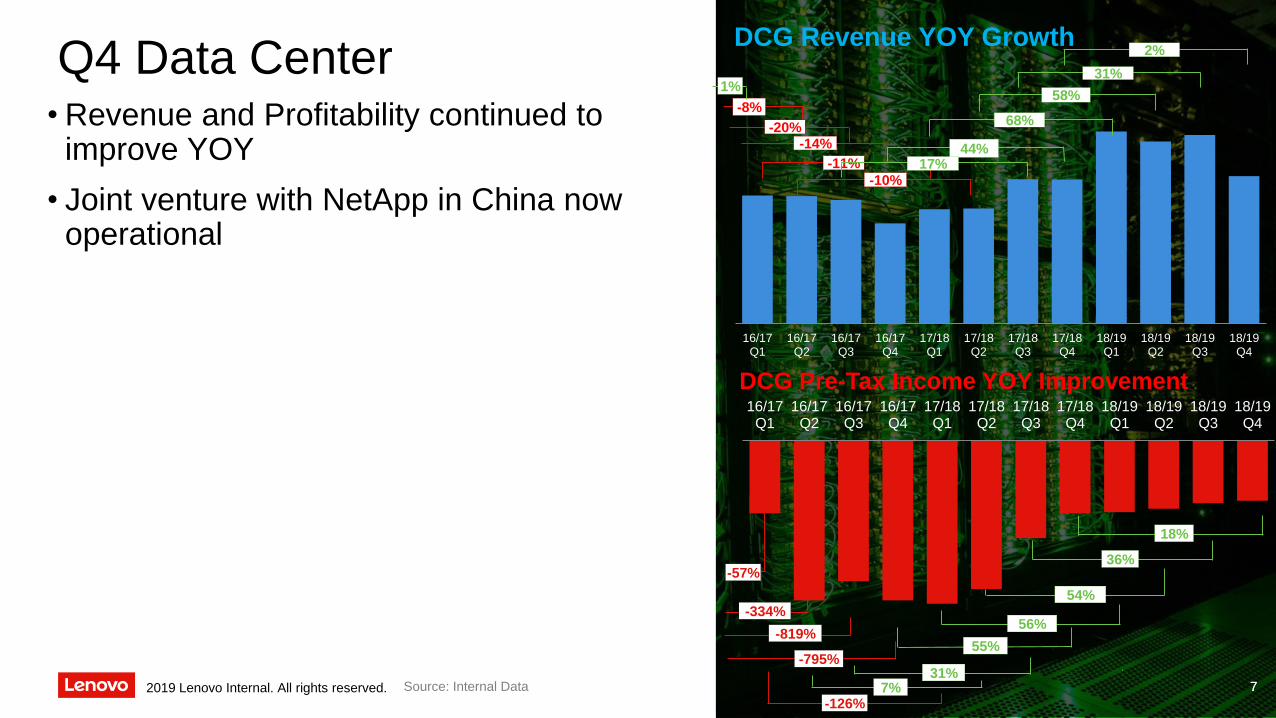
Q4 Data Center• Revenue and Profitability continued to
improve YOY
• Joint venture with NetApp in China now operational
7Source: Internal Data 7
DCG Revenue YOY Growth
16/17Q1
16/17Q2
16/17Q3
16/17Q4
17/18Q1
17/18Q2
17/18Q3
17/18Q4
18/19Q1
18/19Q2
18/19Q3
18/19Q4
55%
7%
-819%
-795%
-126%
54%
18%
56%-334%
-57%
31%
36%
16/17Q1
16/17Q2
16/17Q3
16/17Q4
17/18Q1
17/18Q2
17/18Q3
17/18Q4
18/19Q1
18/19Q2
18/19Q3
18/19Q4
-14%
68%
44%-11%
-10%
-8%
-20%
17%
1%58%
31%
2%
DCG Pre-Tax Income YOY Improvement
2019 Lenovo Internal. All rights reserved.
Lenovo Vantage
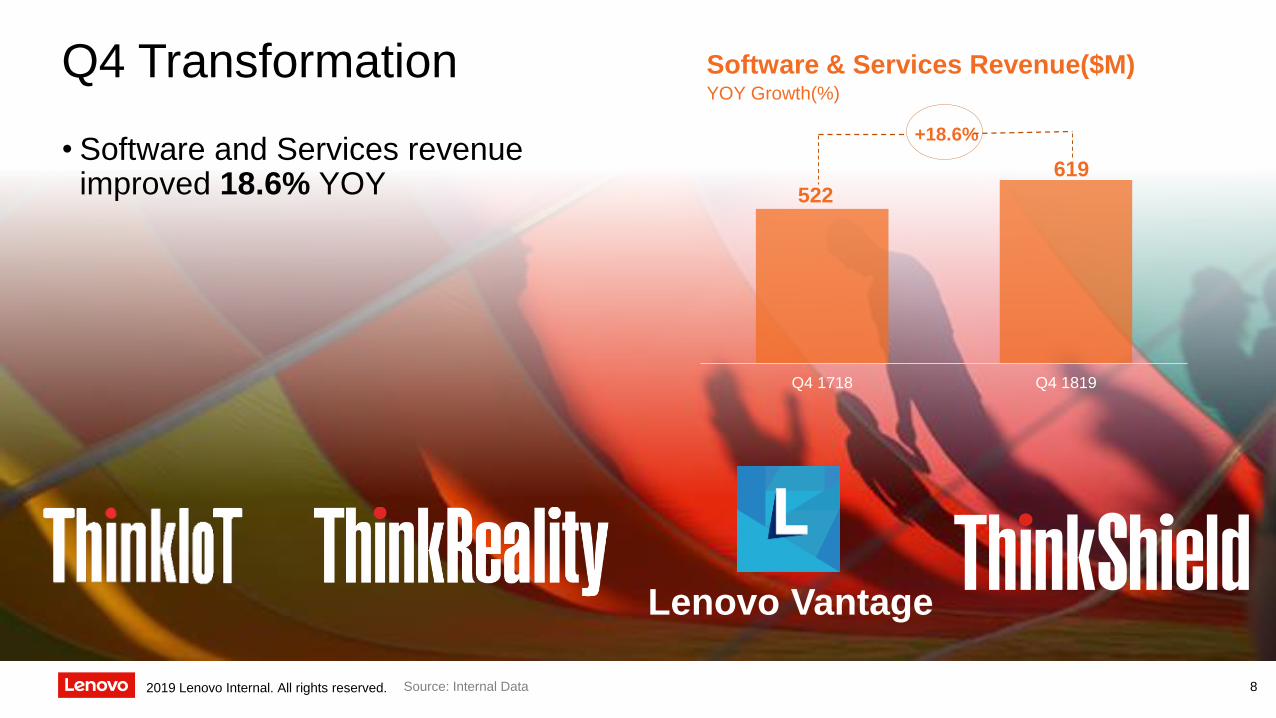
Software & Services Revenue($M) YOY Growth(%)
Source: Internal Data
Q4 Transformation
• Software and Services revenue improved 18.6% YOY 522
619
Q4 1718 Q4 1819
+18.6%
82019 Lenovo Internal. All rights reserved.
FY 14/15 FY 15/16 FY 16/17 FY 17/18 FY 18/19
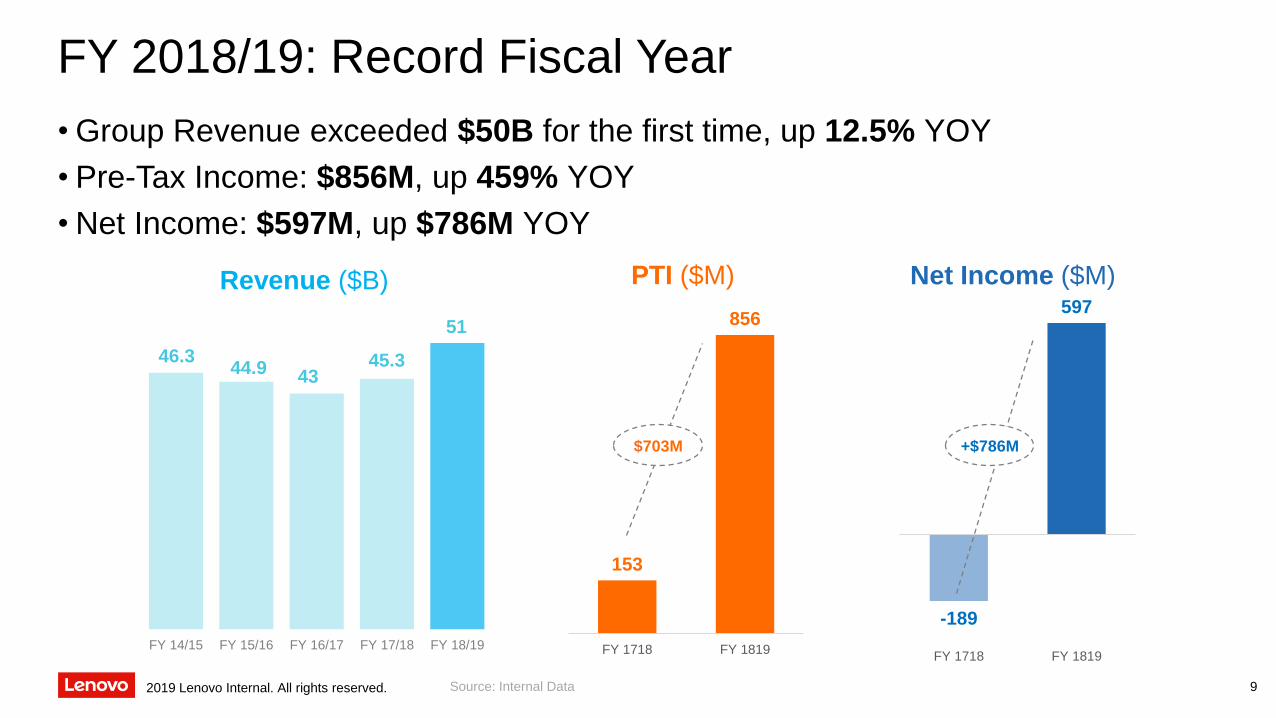
FY 2018/19: Record Fiscal Year
• Group Revenue exceeded $50B for the first time, up 12.5% YOY
• Pre-Tax Income: $856M, up 459% YOY
• Net Income: $597M, up $786M YOY
Revenue ($B)
Source: Internal Data
153
856
FY 1718 FY 1819
$703M
PTI ($M) Net Income ($M)
-189
597
FY 1718 FY 1819
+$786M
46.3
51
44.9 4345.3
92019 Lenovo Internal. All rights reserved.
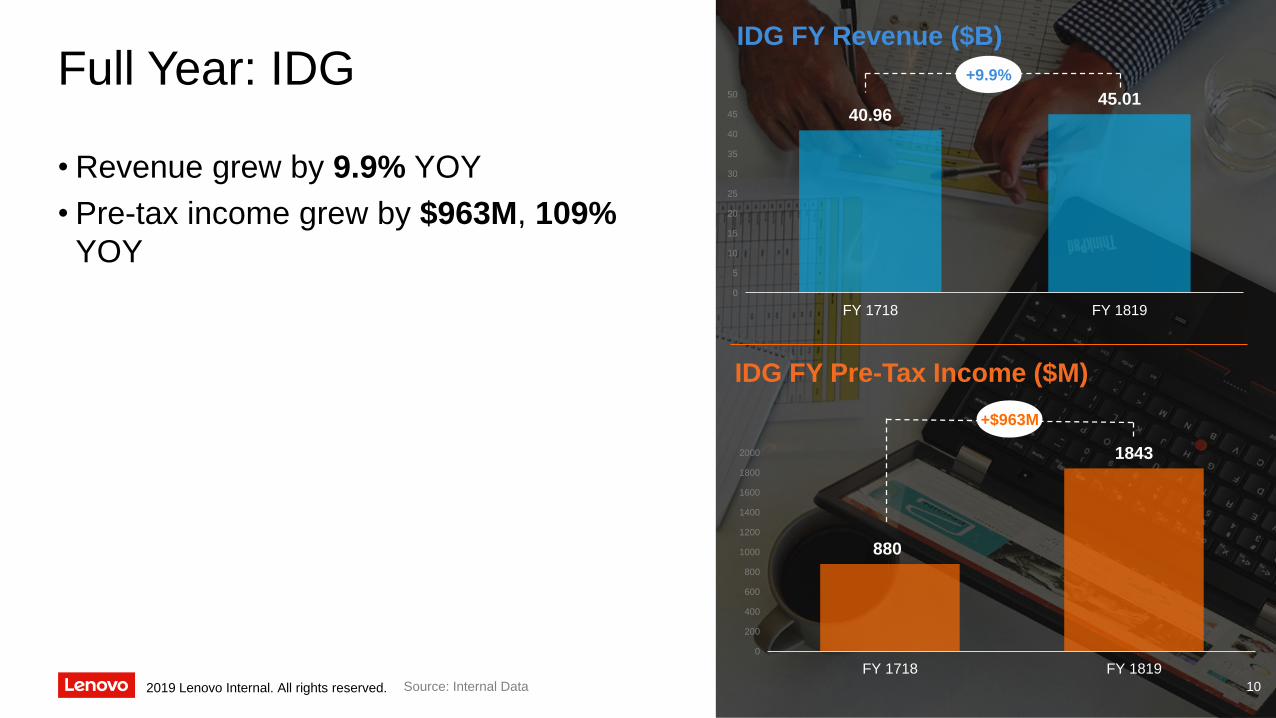
Full Year: IDG
• Revenue grew by 9.9% YOY
• Pre-tax income grew by $963M, 109%
YOY
10
IDG FY Pre-Tax Income ($M)
IDG FY Revenue ($B)
880
1843
0
200
400
600
800
1000
1200
1400
1600
1800
2000
FY 1718 FY 1819
+$963M
40.9645.01
0
5
10
15
20
25
30
35
40
45
50
FY 1718 FY 1819
+9.9%
Source: Internal Data2019 Lenovo Internal. All rights reserved.

Full Year: IDG - PCSD
• Record PCSD revenue $38.5B and pre-
tax income $1.98B,
• PC returned to #1 with record share
23.4%;
• Fastest growing PC vendor out of Top 5
11
Source: IDC, Internal Data
Global PC FY Top 3 Market Share (% YOY)
Global PC FY Top 5 Growth (% YOY)
FY 1415 FY 1516 FY 1617 FY 1718 FY 1819
Lenovo HP Dell
23.4%
23.3%
17.3%
9.5%Lenovo
HP
Dell
Apple
Acer
0.9%
4.5%
-5.2%
36.232.0 31.3
33.7
38.5
1.601.43 1.52 1.48
1.98
FY 1415 FY 1516 FY 1617 FY 1718 FY 1819
Revenue PTI
-1.7%
PCSD FY Revenue, Pre-Tax Income ($B)
RecordHigh
2019 Lenovo Internal. All rights reserved.
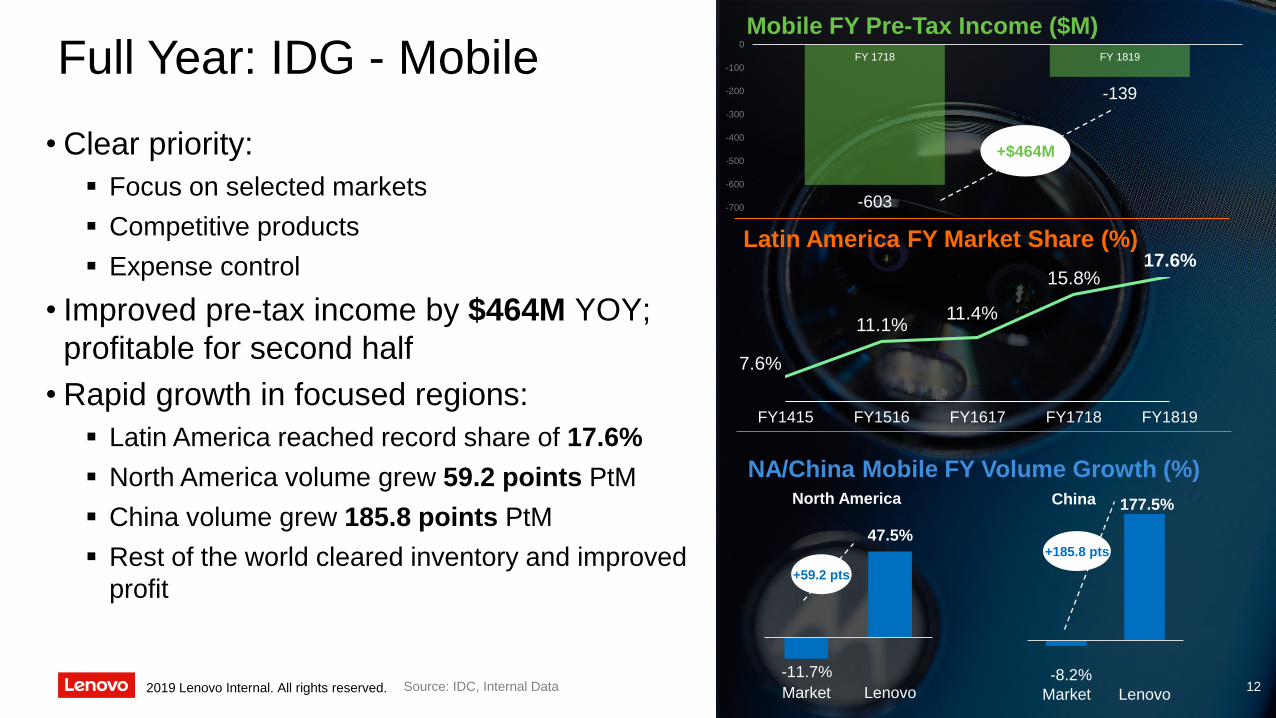
Full Year: IDG - Mobile
• Clear priority:
Focus on selected markets
Competitive products
Expense control
• Improved pre-tax income by $464M YOY;
profitable for second half
• Rapid growth in focused regions:
Latin America reached record share of 17.6%
North America volume grew 59.2 points PtM
China volume grew 185.8 points PtM
Rest of the world cleared inventory and improved
profit
Source: IDC, Internal Data
Latin America FY Market Share (%)
Mobile FY Pre-Tax Income ($M)
NA/China Mobile FY Volume Growth (%)
-603
-139
-700
-600
-500
-400
-300
-200
-100
0
FY 1718 FY 1819
+$464M
FY1516
7.6%
FY1415
11.1%
15.8%
11.4%
FY1718FY1617
17.6%
FY1819
12-11.7%
47.5%
Market Lenovo-8.2%
177.5%
Market Lenovo
+59.2 pts
+185.8 pts
ChinaNorth America
2019 Lenovo Internal. All rights reserved.
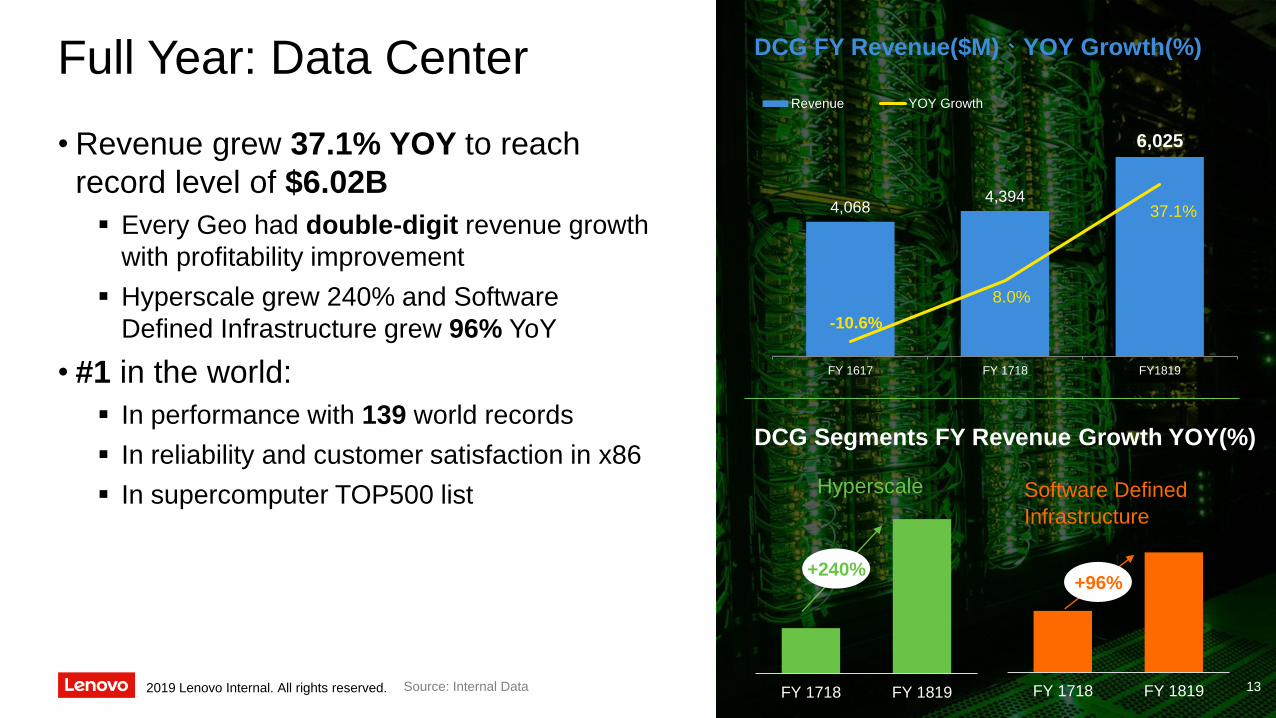
Full Year: Data Center
• Revenue grew 37.1% YOY to reach
record level of $6.02B
Every Geo had double-digit revenue growth
with profitability improvement
Hyperscale grew 240% and Software
Defined Infrastructure grew 96% YoY
• #1 in the world:
In performance with 139 world records
In reliability and customer satisfaction in x86
In supercomputer TOP500 list
Source: Internal Data
DCG FY Revenue($M)、YOY Growth(%)
4,0684,394
6,025
-10.6%
8.0%
37.1%
FY 1617 FY 1718 FY1819
Revenue YOY Growth
DCG Segments FY Revenue Growth YOY(%)
FY 1718 FY 1819 FY 1718 FY 1819
Hyperscale Software Defined
Infrastructure
+96%+240%
132019 Lenovo Internal. All rights reserved.
Source: Internal Data 14
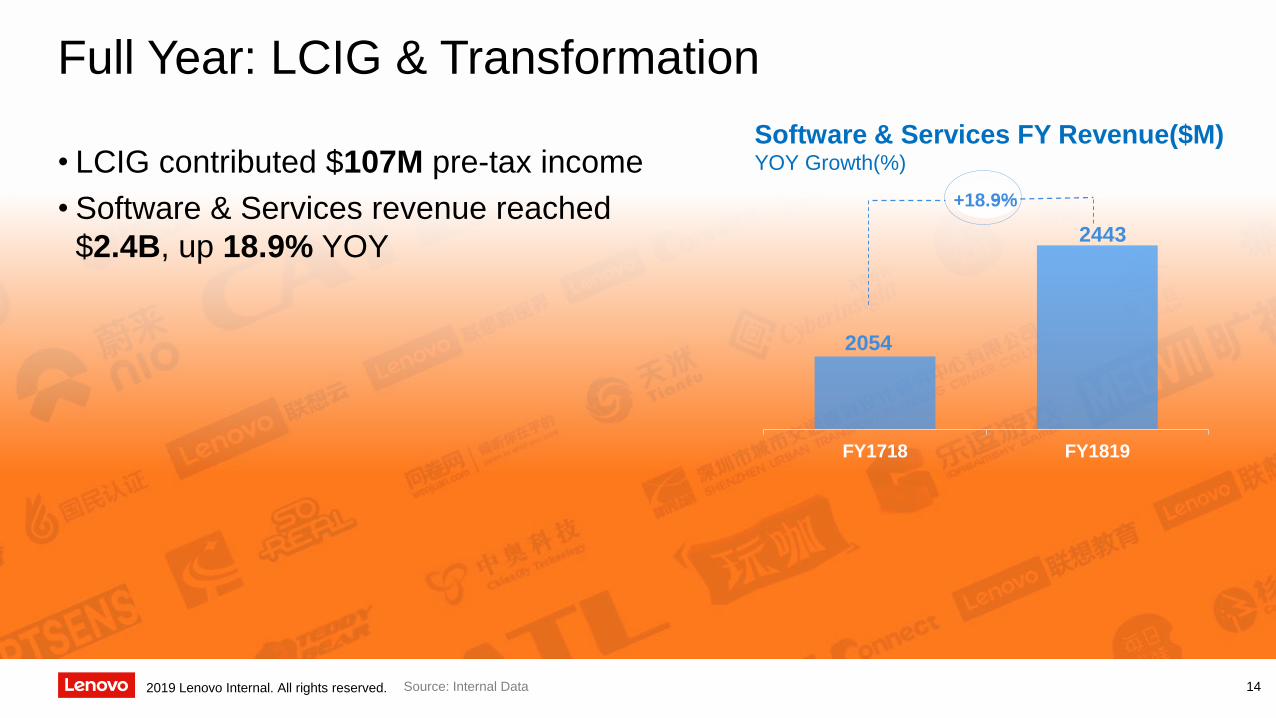
Full Year: LCIG & Transformation
• LCIG contributed $107M pre-tax income
• Software & Services revenue reached
$2.4B, up 18.9% YOY
Software & Services FY Revenue($M)YOY Growth(%)
2054
2443
FY1718 FY1819
+18.9%
2019 Lenovo Internal. All rights reserved.
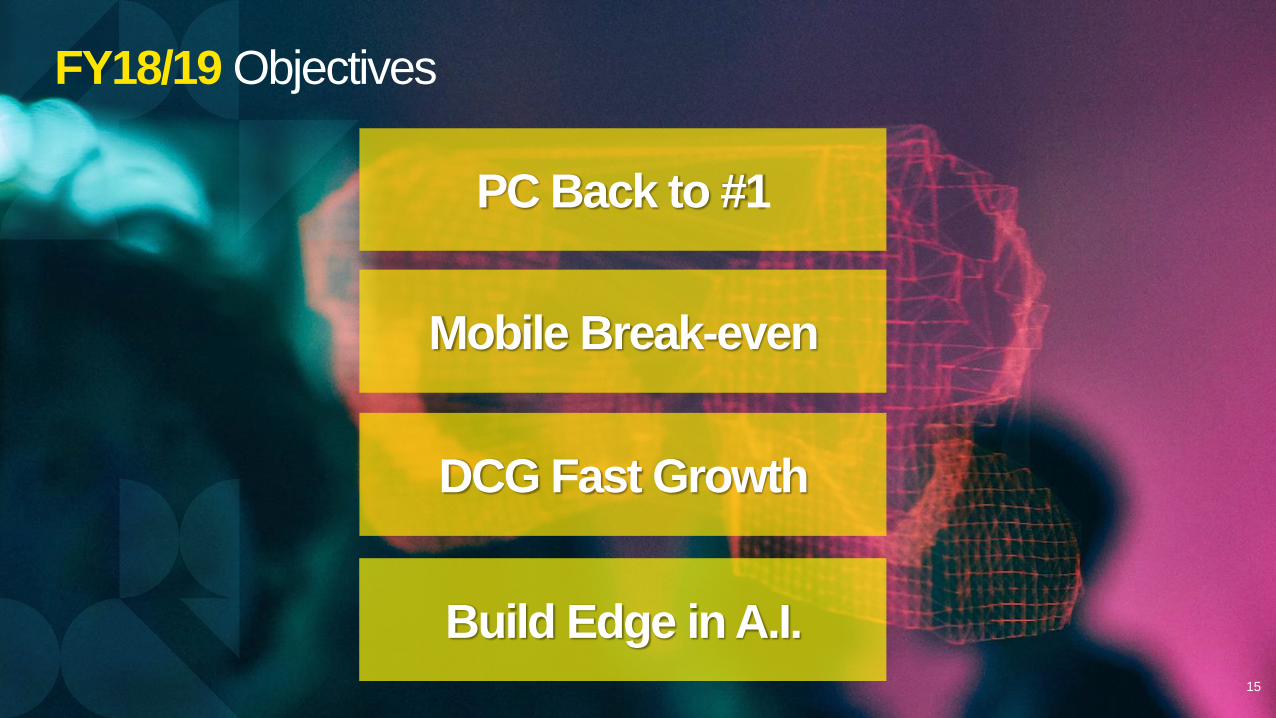
PC Back to #1
Mobile Break-even
DCG Fast Growth
Build Edge in A.I.
FY18/19 Objectives
15
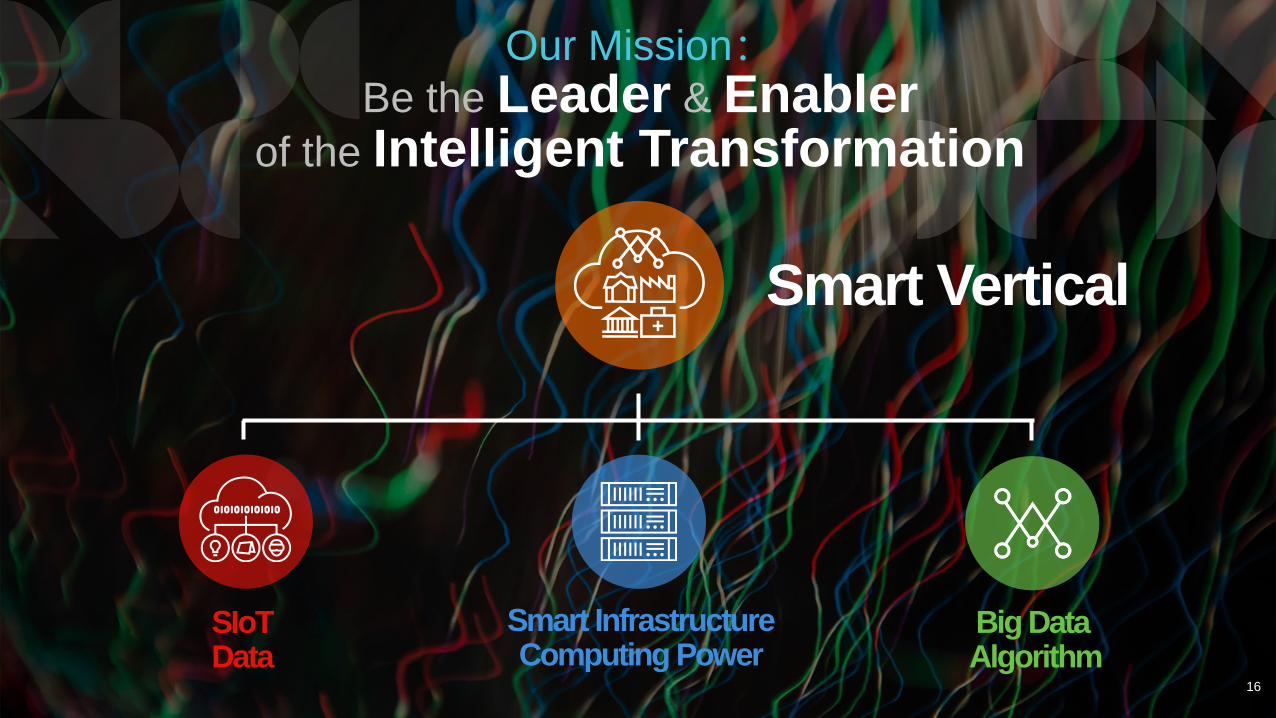
SIoTData
Big DataAlgorithm
Smart InfrastructureComputing Power
Smart Vertical
Our Mission:Be the Leader & Enabler
of the Intelligent Transformation
16
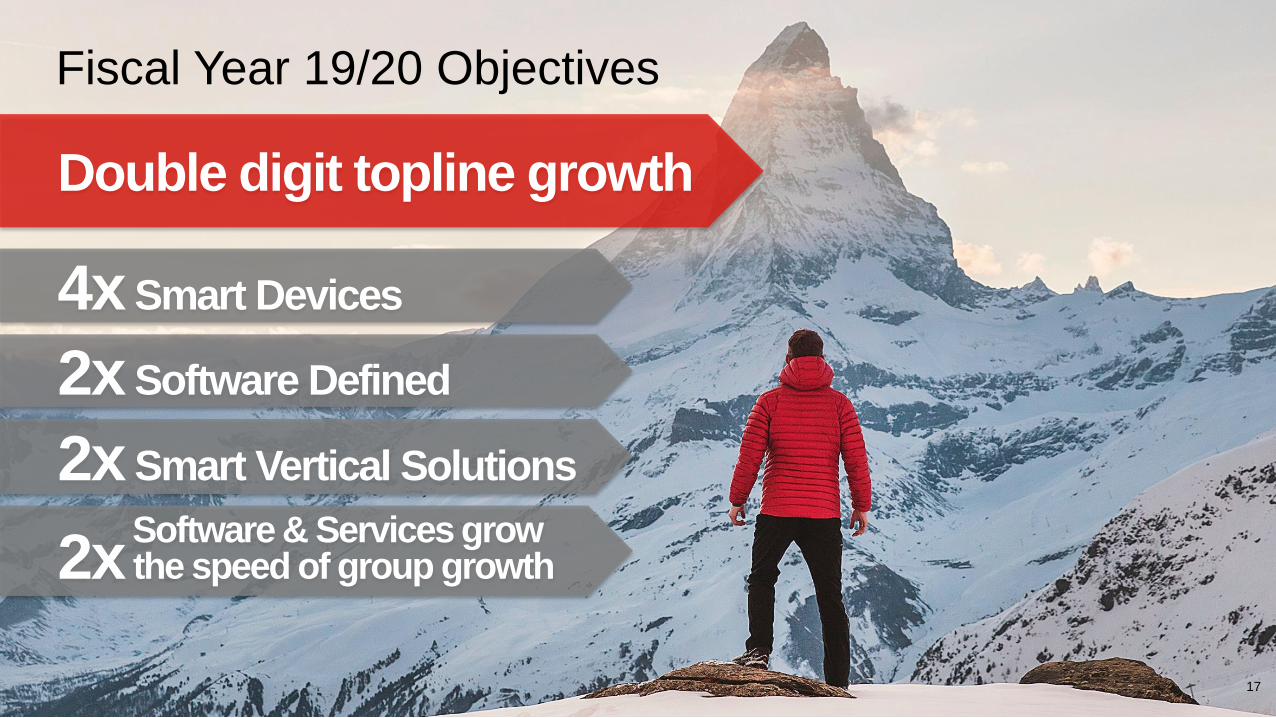
4x Smart Devices
2x Software Defined
2x Smart Vertical Solutions
Fiscal Year 19/20 Objectives
Double digit topline growth
Software & Services grow 2x the speed of group growth
17

Wong Wai MingChief Financial Officer
2019 Lenovo Internal. All rights reserved.
May 23, 2019 – Hong Kong
37
113
213
350
180
0
50
100
150
200
250
300
350
400
Q4FY2017/18
Q1FY2018/19
Q2FY2018/19
Q3FY2018/19
Q4FY2018/19
Pre-Tax Income
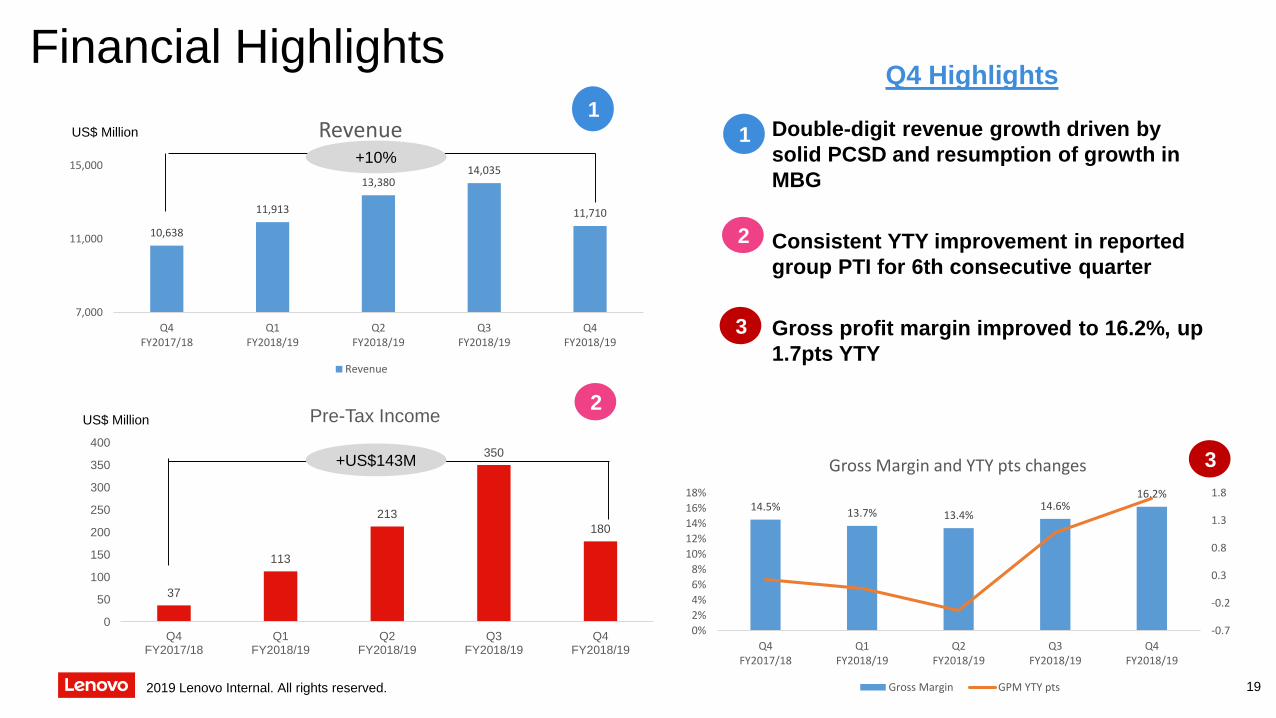
Financial Highlights
19
Q4 Highlights
Double-digit revenue growth driven by
solid PCSD and resumption of growth in
MBG
Consistent YTY improvement in reported
group PTI for 6th consecutive quarter
Gross profit margin improved to 16.2%, up
1.7pts YTY
2
1
US$ Million
3
1
2
3
2019 Lenovo Internal. All rights reserved.
10,638
11,913
13,38014,035
11,710
7,000
11,000
15,000
Q4FY2017/18
Q1FY2018/19
Q2FY2018/19
Q3FY2018/19
Q4FY2018/19
Revenue
Revenue
US$ Million
+US$143M
14.5%13.7% 13.4%
14.6%16.2%
-0.7
-0.2
0.3
0.8
1.3
1.8
0%
2%
4%
6%
8%
10%
12%
14%
16%
18%
Q4FY2017/18
Q1FY2018/19
Q2FY2018/19
Q3FY2018/19
Q4FY2018/19
Gross Margin and YTY pts changes
Gross Margin GPM YTY pts
+10%

971
-277
490
153
856
-400
-200
0
200
400
600
800
1000
1200
FY2014/15 FY2015/16 FY2016/17 FY2017/18 FY2018/19
Pre-Tax Income
Financial Highlights
20
FY19 Highlights
Group revenue surpassed $50B for the first
time, setting a new record at $51B (up 13%
YTY)
PTI improved 459% YTY thanks to record
level of PCSD PTI while losses narrowed
significantly at MBG and DCG
Gross profit margin improved to 14.4%, up
0.6pts YTY
2
1
US$ Million
3
1
2
3
2019 Lenovo Internal. All rights reserved.
46,29644,912
43,035
45,350
51,038
36,000
40,000
44,000
48,000
52,000
FY2014/15 FY2015/16 FY2016/17 FY2017/18 FY2018/19
Revenue
Revenue
US$ Million
14.4%
14.7%
14.2%
13.8%
14.4%
-1.0
-0.5
0.0
0.5
1.0
1.5
13%
14%
14%
15%
15%
FY2014/15 FY2015/16 FY2016/17 FY2017/18 FY2018/19
Gross Margin and YTY pts changes
Gross Margin GPM YTY pts
+13%
21
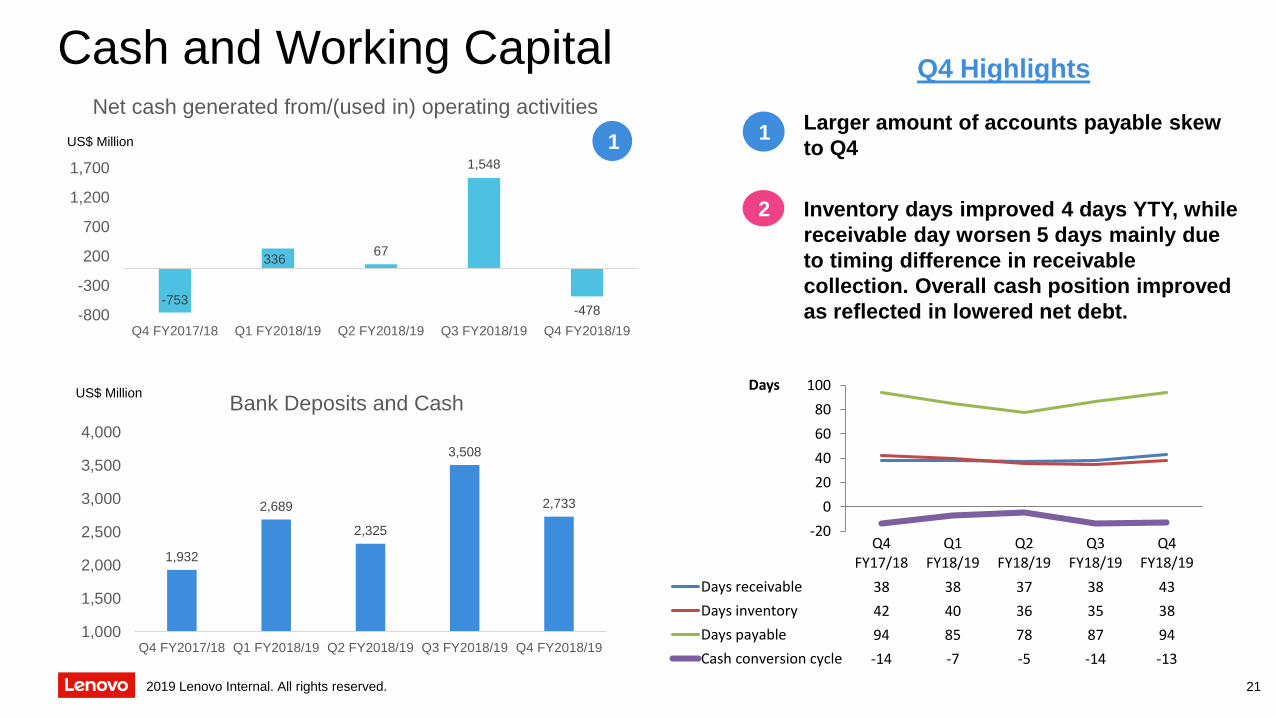
Cash and Working Capital
-753
33667
1,548
-478-800
-300
200
700
1,200
1,700
Q4 FY2017/18 Q1 FY2018/19 Q2 FY2018/19 Q3 FY2018/19 Q4 FY2018/19
Net cash generated from/(used in) operating activities
1
2019 Lenovo Internal. All rights reserved.
1,932
2,689
2,325
3,508
2,733
1,000
1,500
2,000
2,500
3,000
3,500
4,000
Q4 FY2017/18 Q1 FY2018/19 Q2 FY2018/19 Q3 FY2018/19 Q4 FY2018/19
Bank Deposits and Cash
US$ Million
Q4 Highlights
Larger amount of accounts payable skew
to Q4
Inventory days improved 4 days YTY, while
receivable day worsen 5 days mainly due
to timing difference in receivable
collection. Overall cash position improved
as reflected in lowered net debt.
2
1
US$ Million
-20
0
20
40
60
80
100
Q4FY17/18
Q1FY18/19
Q2FY18/19
Q3FY18/19
Q4FY18/19
Days receivable 38 38 37 38 43
Days inventory 42 40 36 35 38
Days payable 94 85 78 87 94
Cash conversion cycle -14 -7 -5 -14 -13
Days
22
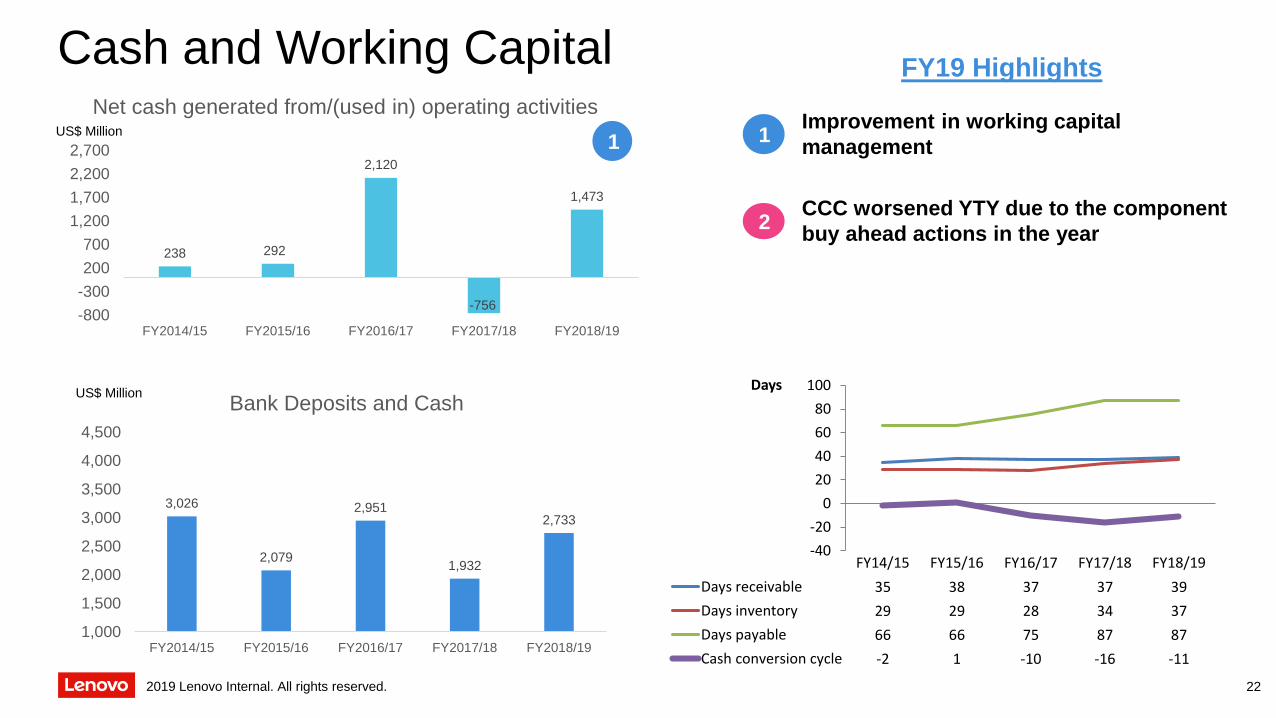
Cash and Working Capital
238 292
2,120
-756
1,473
-800
-300
200
700
1,200
1,700
2,200
2,700
FY2014/15 FY2015/16 FY2016/17 FY2017/18 FY2018/19
Net cash generated from/(used in) operating activities
1
2019 Lenovo Internal. All rights reserved.
3,026
2,079
2,951
1,932
2,733
1,000
1,500
2,000
2,500
3,000
3,500
4,000
4,500
FY2014/15 FY2015/16 FY2016/17 FY2017/18 FY2018/19
Bank Deposits and Cash
US$ Million
FY19 Highlights
Improvement in working capital
management
CCC worsened YTY due to the component
buy ahead actions in the year2
1
US$ Million
-40
-20
0
20
40
60
80
100
FY14/15 FY15/16 FY16/17 FY17/18 FY18/19
Days receivable 35 38 37 37 39
Days inventory 29 29 28 34 37
Days payable 66 66 75 87 87
Cash conversion cycle -2 1 -10 -16 -11
Days
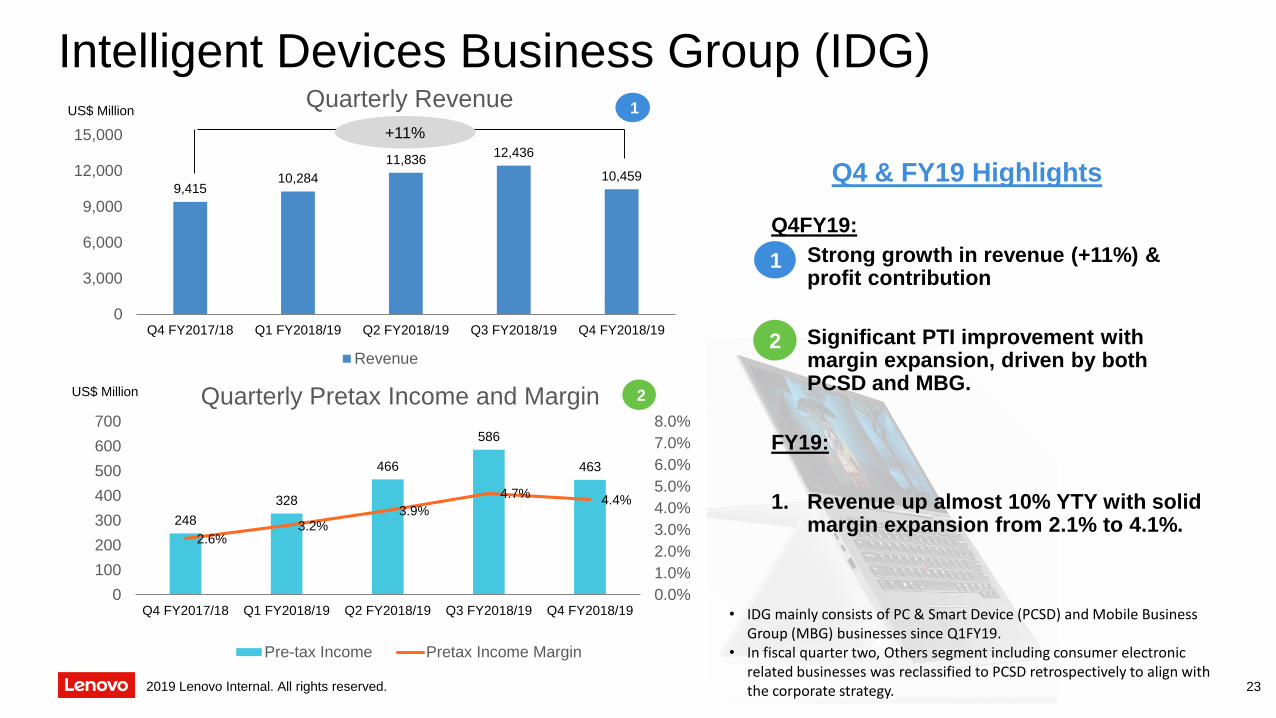
9,41510,284
11,83612,436
10,459
0
3,000
6,000
9,000
12,000
15,000
Q4 FY2017/18 Q1 FY2018/19 Q2 FY2018/19 Q3 FY2018/19 Q4 FY2018/19
Quarterly Revenue
Revenue
Intelligent Devices Business Group (IDG)
Q4 & FY19 Highlights
Q4FY19:
1. Strong growth in revenue (+11%) & profit contribution
2. Significant PTI improvement with margin expansion, driven by both PCSD and MBG.
FY19:
1. Revenue up almost 10% YTY with solid margin expansion from 2.1% to 4.1%.
2019 Lenovo Internal. All rights reserved.
248
328
466
586
463
2.6%3.2%
3.9%
4.7%4.4%
0.0%
1.0%
2.0%
3.0%
4.0%
5.0%
6.0%
7.0%
8.0%
0
100
200
300
400
500
600
700
Q4 FY2017/18 Q1 FY2018/19 Q2 FY2018/19 Q3 FY2018/19 Q4 FY2018/19
Quarterly Pretax Income and Margin
Pre-tax Income Pretax Income Margin
US$ Million
US$ Million
23
1
2
1
2
• IDG mainly consists of PC & Smart Device (PCSD) and Mobile Business Group (MBG) businesses since Q1FY19.
• In fiscal quarter two, Others segment including consumer electronic related businesses was reclassified to PCSD retrospectively to align with the corporate strategy.
+11%

8,0608,619
10,23510,729
8,892
0
2,000
4,000
6,000
8,000
10,000
12,000
Q4 FY2017/18 Q1 FY2018/19 Q2 FY2018/19 Q3 FY2018/19 Q4 FY2018/19
Revenue
Revenue
+10%
IDG - PC & Smart Device Business Group (PCSD)
Q4 Highlights
1. Strong revenue growth, reinforced market leadership in premium & high-growth segments
1. Double-digit revenue growth for 5th
consecutive quarter; 13 pts premium to market revenue growth YTY; Double-digit revenue growth in workstation, thin-and-light, and visual.
2. PTI margin expanded to 5.2%, boosted by favorable product mix and higher services attach rate
2019 Lenovo Internal. All rights reserved.
389425
515
584
458
4.8%4.9%
5.0%5.4% 5.2%
3.0%
4.0%
5.0%
6.0%
7.0%
8.0%
-50
50
150
250
350
450
550
650
Q4FY2017/18
Q1FY2018/19
Q2FY2018/19
Q3FY2018/19
Q4FY2018/19
Pretax Income and Margin
Pre-tax Income Pretax Income Margin
US$ Million
US$ Million
24
2
1
3
2
3
In fiscal quarter two, Others segment like those consumer electronic related businesses was reclassified to PCSD retrospectively to align with the corporate strategy.

36,160
32,045 31,28433,655
38,475
0
10,000
20,000
30,000
40,000
50,000
FY2014/15 FY2015/16 FY2016/17 FY2017/18 FY2018/19
Revenue
Revenue
1+14%
IDG - PC & Smart Device Business Group (PCSD)
FY19 Highlights
1. Record-breaking revenue and PTI; Record high shipments in PC
2. Fastest growing PC OEM in global top-5
1. PTI increased 34% YTY with margin expanded to 5.2%, boosted by favorable mix shift towards high-growth/premium segments
2. Became the top player in the $800+ price segment in commercial notebook PCs for 3 consecutive quarters.
2019 Lenovo Internal. All rights reserved.
1,6001,428 1,516 1,483
1,982
4.4% 4.5%4.8%
4.4%
5.2%
3.0%
4.0%
5.0%
6.0%
7.0%
8.0%
0
500
1,000
1,500
2,000
2,500
FY2014/15 FY2015/16 FY2016/17 FY2017/18 FY2018/19
Pretax Income and Margin
Pre-tax Income Pretax Income Margin
US$ Million
US$ Million
25
2
1
3
3
4
2019 Lenovo Internal. All rights reserved.
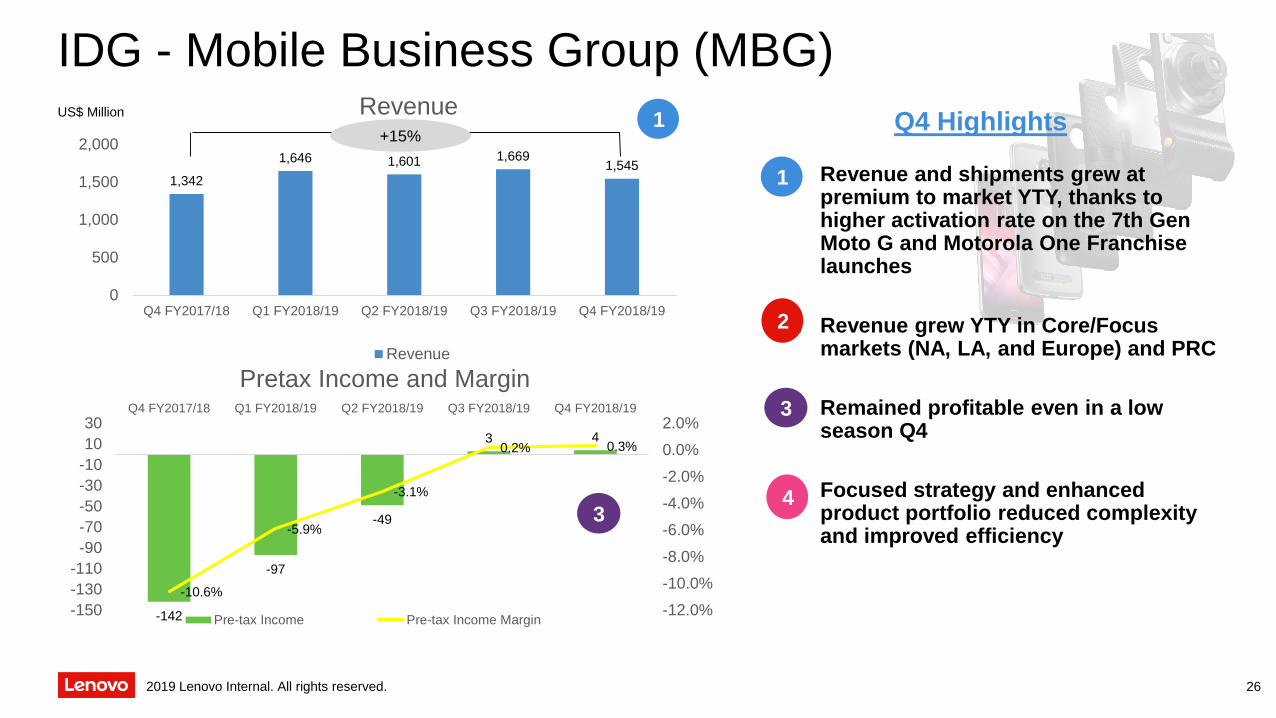
IDG - Mobile Business Group (MBG)
Q4 Highlights
1. Revenue and shipments grew at premium to market YTY, thanks to higher activation rate on the 7th Gen Moto G and Motorola One Franchise launches
2. Revenue grew YTY in Core/Focus markets (NA, LA, and Europe) and PRC
1. Remained profitable even in a low season Q4
1. Focused strategy and enhanced product portfolio reduced complexity and improved efficiency
1,342
1,646 1,601 1,6691,545
0
500
1,000
1,500
2,000
Q4 FY2017/18 Q1 FY2018/19 Q2 FY2018/19 Q3 FY2018/19 Q4 FY2018/19
Revenue
Revenue
+15%1
US$ Million
26
2
1
3
43
-142
-97
-49
3 4
-10.6%
-5.9%
-3.1%
0.2% 0.3%
-12.0%
-10.0%
-8.0%
-6.0%
-4.0%
-2.0%
0.0%
2.0%
-150
-130
-110
-90
-70
-50
-30
-10
10
30Q4 FY2017/18 Q1 FY2018/19 Q2 FY2018/19 Q3 FY2018/19 Q4 FY2018/19
Pretax Income and Margin
Pre-tax Income Pre-tax Income Margin
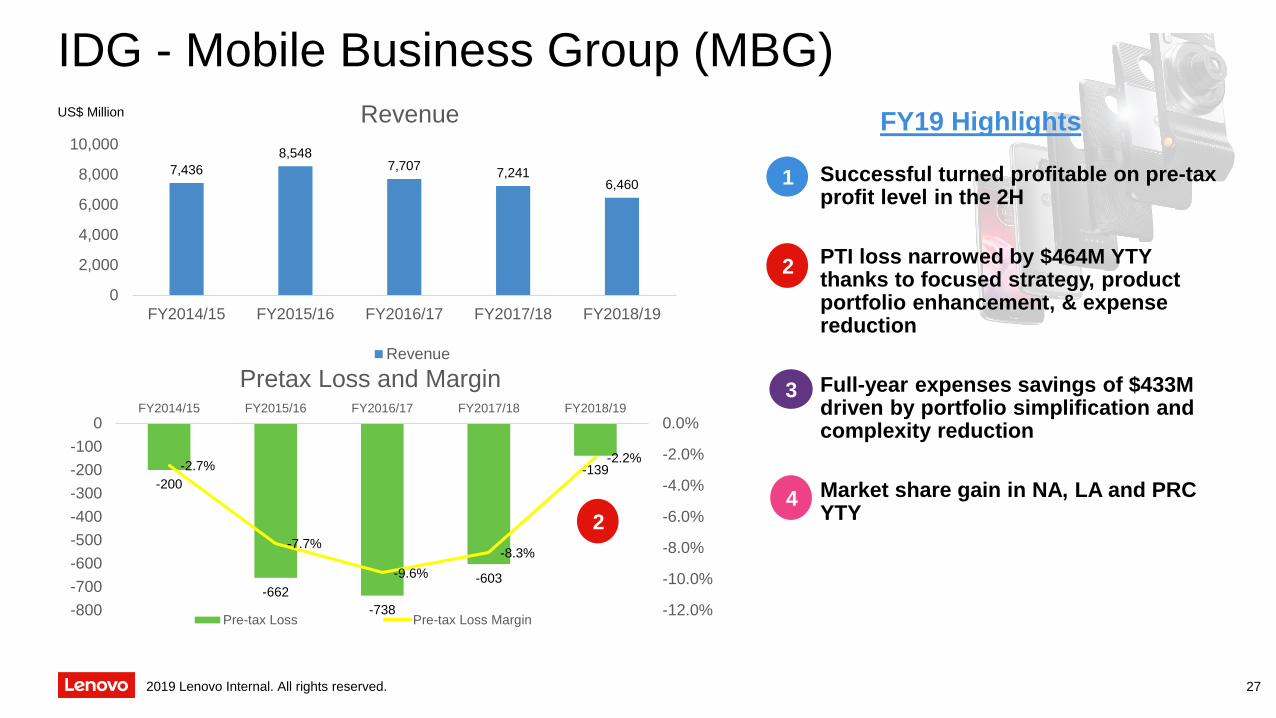
-200
-662
-738
-603
-139-2.7%
-7.7%
-9.6%
-8.3%
-2.2%
-12.0%
-10.0%
-8.0%
-6.0%
-4.0%
-2.0%
0.0%
-800
-700
-600
-500
-400
-300
-200
-100
0FY2014/15 FY2015/16 FY2016/17 FY2017/18 FY2018/19
Pretax Loss and Margin
Pre-tax Loss Pre-tax Loss Margin
2019 Lenovo Internal. All rights reserved.
IDG - Mobile Business Group (MBG)
FY19 Highlights
1. Successful turned profitable on pre-tax profit level in the 2H
1. PTI loss narrowed by $464M YTY thanks to focused strategy, product portfolio enhancement, & expense reduction
1. Full-year expenses savings of $433M driven by portfolio simplification and complexity reduction
2. Market share gain in NA, LA and PRCYTY
7,436
8,5487,707
7,2416,460
0
2,000
4,000
6,000
8,000
10,000
FY2014/15 FY2015/16 FY2016/17 FY2017/18 FY2018/19
Revenue
Revenue
US$ Million
27
2
1
3
42

Q4 Highlights
1. Continued margin expansion YTY for 1 pts
2. Mild topline growth as customers await release of new x86 Intel platform
3. Strong growth in fast-growing segments:
Double-digit revenue growth in Hyperscale, Software Defined Infrastructure
2019 Lenovo Internal. All rights reserved.
Data Center Business Group (DCG)
-64 -63 -60-55 -53
-5.2%
-3.9% -3.9%
-3.4%
-4.2%
-6.0%
-5.0%
-4.0%
-3.0%
-2.0%
-1.0%
0.0%
-100
-80
-60
-40
-20
0Q4 FY2017/18 Q1 FY2018/19 Q2 FY2018/19 Q3 FY2018/19 Q4 FY2018/19
Pretax Loss and Margin
Pre-tax Loss Pre-tax Loss Margin
1,223
1,6291,544 1,600
1,251
0
500
1,000
1,500
Q4 FY2017/18 Q1 FY2018/19 Q2 FY2018/19 Q3 FY2018/19 Q4 FY2018/19
Revenue
Revenue
US$ Million
US$ Million
28
2
1
3
1
2
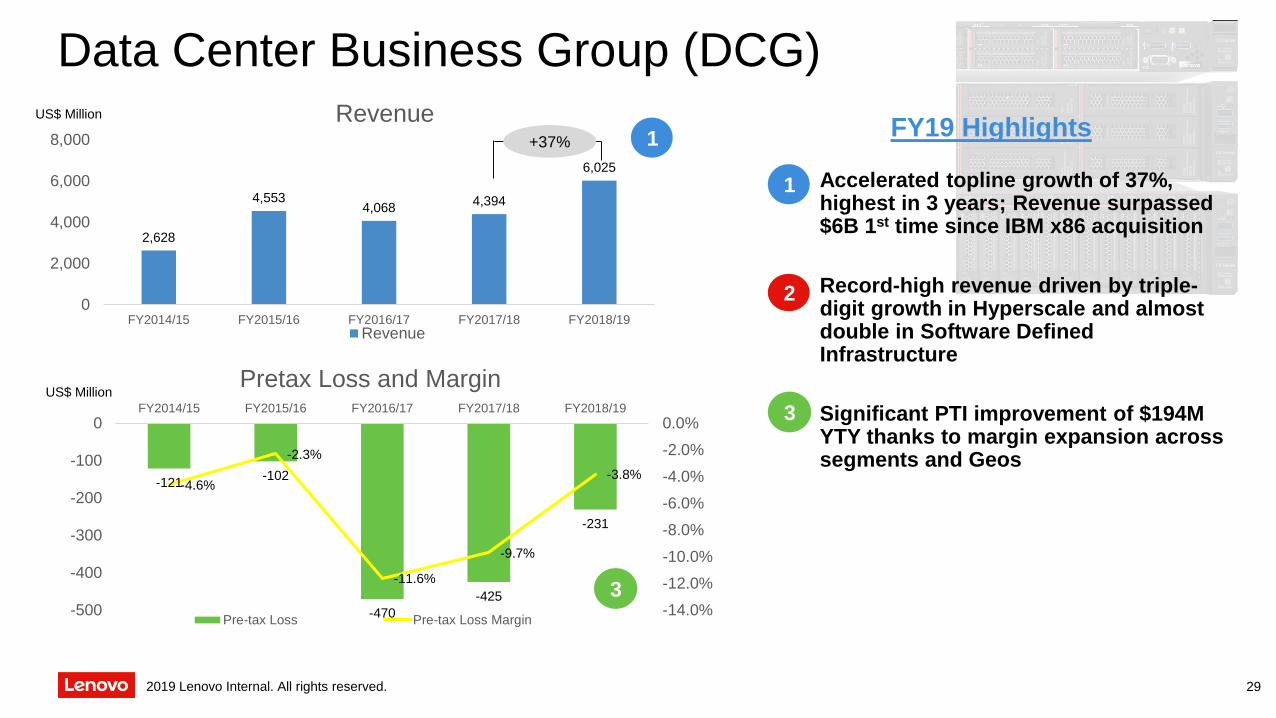
FY19 Highlights
1. Accelerated topline growth of 37%, highest in 3 years; Revenue surpassed $6B 1st time since IBM x86 acquisition
2. Record-high revenue driven by triple-digit growth in Hyperscale and almost double in Software Defined Infrastructure
3. Significant PTI improvement of $194M YTY thanks to margin expansion across segments and Geos
2019 Lenovo Internal. All rights reserved.
Data Center Business Group (DCG)
-121-102
-470
-425
-231
-4.6%
-2.3%
-11.6%
-9.7%
-3.8%
-14.0%
-12.0%
-10.0%
-8.0%
-6.0%
-4.0%
-2.0%
0.0%
-500
-400
-300
-200
-100
0FY2014/15 FY2015/16 FY2016/17 FY2017/18 FY2018/19
Pretax Loss and Margin
Pre-tax Loss Pre-tax Loss Margin
3
2,628
4,5534,068
4,394
6,025
0
2,000
4,000
6,000
8,000
FY2014/15 FY2015/16 FY2016/17 FY2017/18 FY2018/19
Revenue
Revenue
1
US$ Million
US$ Million
29
2
1
3
+37%
Outlook Statement
Group Mission:
To become the leader and enabler in the Intelligent Transformation era while driving customer
centricity and leveraging Smart IoT/Smart Infrastructure/Smart Vertical to bring Lenovo to a new
height
IDG: Deliver premium-to-market growth with strong profitability; build smart device capabilities
PCSD: maintain premium to market growth with industry-leading profitability; drive further penetration in high-growth
segments; continue to grow revenue faster than shipments
Mobile: drive growth in selected markets while improving profitability; sustain profitable growth globally
Enable intelligent features on Smart PC products; build new Smart Devices & Embedded IOTs
DCG: Drive double the market growth while improving profitability
Strengthen in-house design and manufacturing capabilities; build a profitable business model for Hyperscale
Enhance capabilities on professional services and solution based expertise; solidify and operationalize Strategic Partnerships
Market anticipates next generation Intel platform led to softness in enterprise and hyperscale markets, expects to
recover in 2HFY20; Lenovo will continue to grow even if market does not; continue to accelerate market share gain in high-
growth segments – Hyperscale, SDI, AI/HPC, and IoT solutions
2019 Lenovo Internal. All rights reserved. 30

3S strategy:
Accelerate Intelligent Transformation by bringing Smarter technology to all in the connected world; continue to drive growth in Smart IoT, Smart Infrastructure and Smart Vertical while leading customer centric transformation
Smart IoT: Accelerate growth and drive intelligence in our PC and Smart Devices
Improve profitability by driving higher average user selling price in high growth and premium categories (Workstation, Gaming PC, Thin & Light, Visuals)
Drive intelligence in our Smart PC products, build new Smart Devices and Embedded IOTs
Mobile biz will continue to execute selected regions strategy, enhance product portfolio and invest in technology
Smart Infrastructure: Strengthen capabilities in solutions and professional services
Smart Vertical: Accelerate growth in Software, Services, verticals and solutions businesses
Build capabilities and leverage our building blocks to capture opportunities in focused industry verticals
Outlook Statement
2019 Lenovo Internal. All rights reserved. 31

Appendix
322019 Lenovo Internal. All rights reserved.
- Financial Summary
- Condensed Consolidated Income Statement- Condensed Consolidated Balance Sheet- Condensed Consolidated Cash Flow Statement
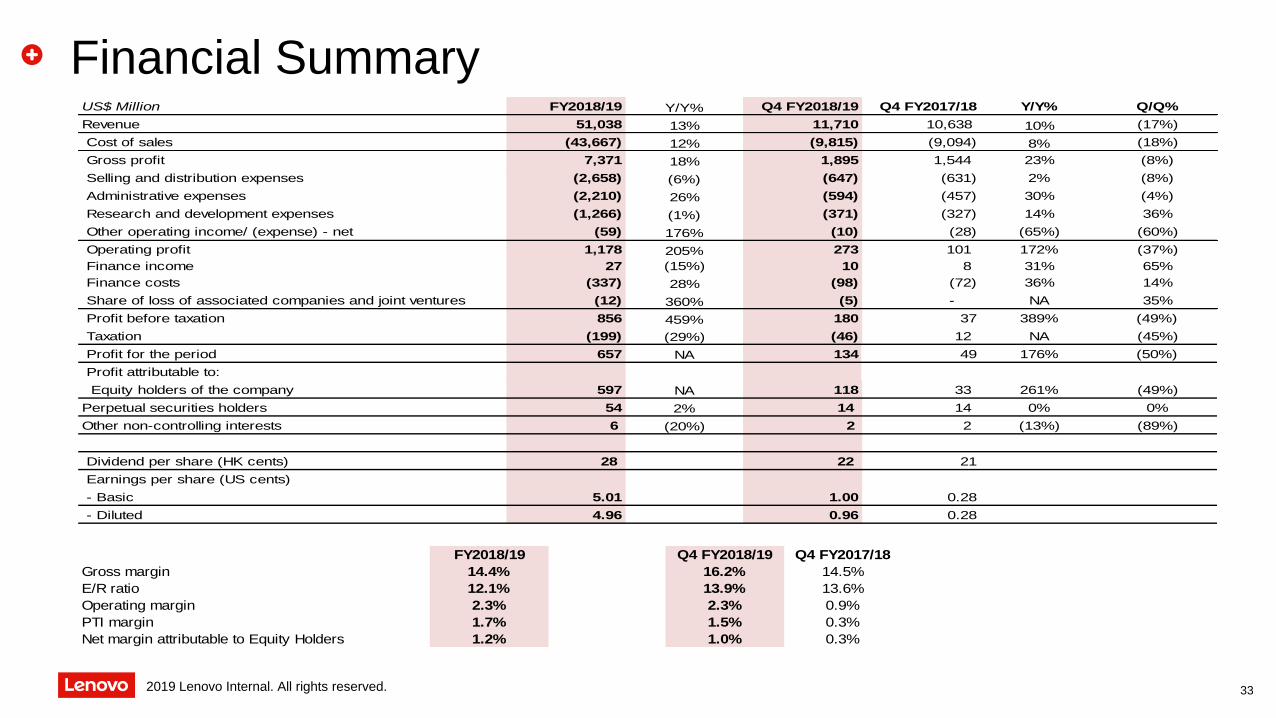
Financial SummaryUS$ Million FY2018/19 Y/Y% Q4 FY2018/19 Q4 FY2017/18 Y/Y% Q/Q%
Revenue 51,038 13% 11,710 10,638 10% (17%)
Cost of sales (43,667) 12% (9,815) (9,094) 8% (18%)
Gross profit 7,371 18% 1,895 1,544 23% (8%)
Selling and distribution expenses (2,658) (6%) (647) (631) 2% (8%)
Administrative expenses (2,210) 26% (594) (457) 30% (4%)
Research and development expenses (1,266) (1%) (371) (327) 14% 36%
Other operating income/ (expense) - net (59) 176% (10) (28) (65%) (60%)
Operating profit 1,178 205% 273 101 172% (37%)
Finance income 27 (15%) 10 8 31% 65%
Finance costs (337) 28% (98) (72) 36% 14%
Share of loss of associated companies and joint ventures (12) 360% (5) - NA 35%
Profit before taxation 856 459% 180 37 389% (49%)
Taxation (199) (29%) (46) 12 NA (45%)
Profit for the period 657 NA 134 49 176% (50%)
Profit attributable to:
Equity holders of the company 597 NA 118 33 261% (49%)
Perpetual securities holders 54 2% 14 14 0% 0%
Other non-controlling interests 6 (20%) 2 2 (13%) (89%)
Dividend per share (HK cents) 28 22 21
Earnings per share (US cents)
- Basic 5.01 1.00 0.28
- Diluted 4.96 0.96 0.28
FY2018/19 Q4 FY2018/19 Q4 FY2017/18
Gross margin 14.4% 16.2% 14.5%
E/R ratio 12.1% 13.9% 13.6%
Operating margin 2.3% 2.3% 0.9%
PTI margin 1.7% 1.5% 0.3%
Net margin attributable to Equity Holders 1.2% 1.0% 0.3%
2019 Lenovo Internal. All rights reserved. 33
2019 Lenovo Internal. All rights reserved. 34
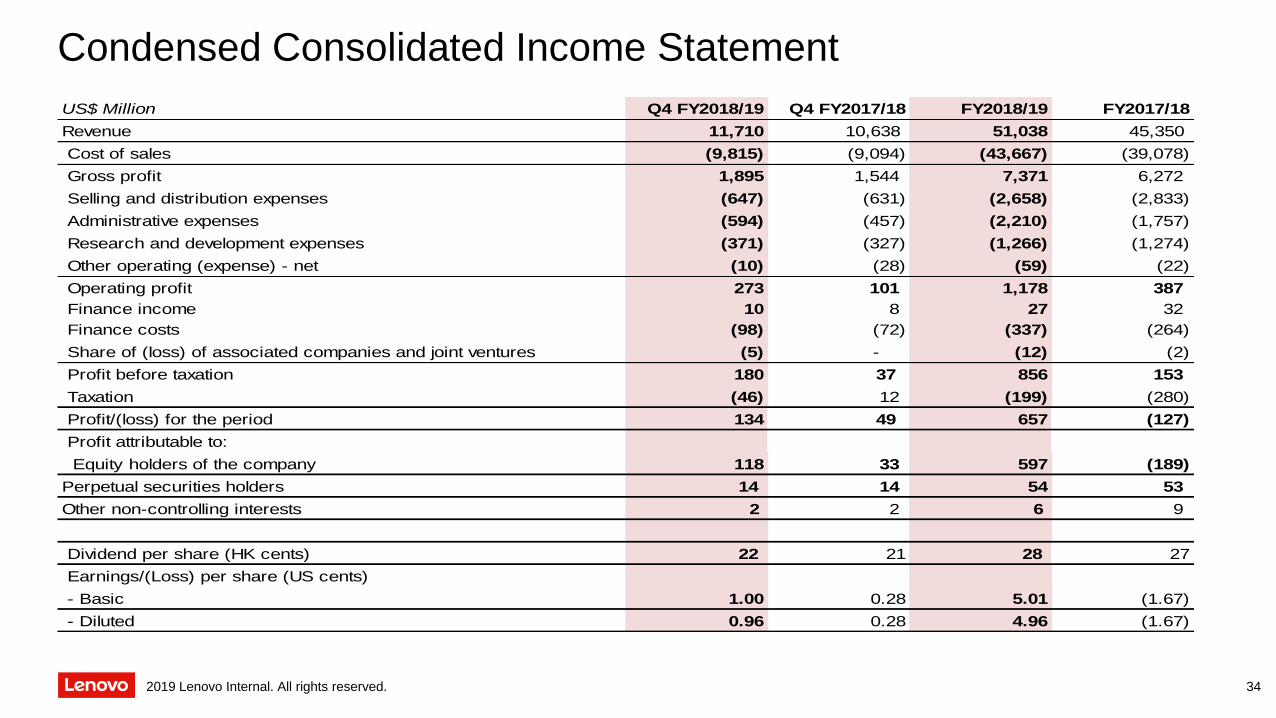
Condensed Consolidated Income Statement
US$ Million Q4 FY2018/19 Q4 FY2017/18 FY2018/19 FY2017/18
Revenue 11,710 10,638 51,038 45,350
Cost of sales (9,815) (9,094) (43,667) (39,078)
Gross profit 1,895 1,544 7,371 6,272
Selling and distribution expenses (647) (631) (2,658) (2,833)
Administrative expenses (594) (457) (2,210) (1,757)
Research and development expenses (371) (327) (1,266) (1,274)
Other operating (expense) - net (10) (28) (59) (22)
Operating profit 273 101 1,178 387
Finance income 10 8 27 32
Finance costs (98) (72) (337) (264)
Share of (loss) of associated companies and joint ventures (5) - (12) (2)
Profit before taxation 180 37 856 153
Taxation (46) 12 (199) (280)
Profit/(loss) for the period 134 49 657 (127)
Profit attributable to:
Equity holders of the company 118 33 597 (189)
Perpetual securities holders 14 14 54 53
Other non-controlling interests 2 2 6 9
Dividend per share (HK cents) 22 21 28 27
Earnings/(Loss) per share (US cents)
- Basic 1.00 0.28 5.01 (1.67)
- Diluted 0.96 0.28 4.96 (1.67)
2019 Lenovo Internal. All rights reserved. 35
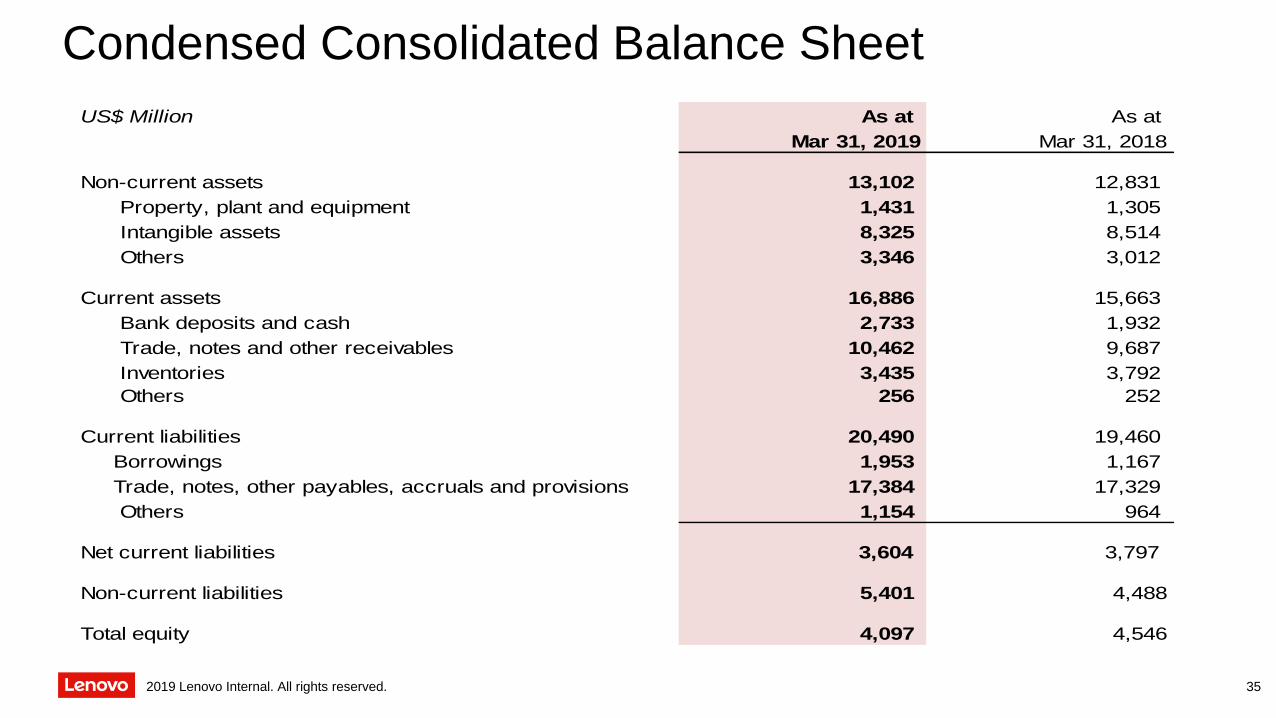
Condensed Consolidated Balance Sheet
US$ Million As at As at
Mar 31, 2019 Mar 31, 2018
Non-current assets 13,102 12,831
Property, plant and equipment 1,431 1,305
Intangible assets 8,325 8,514
Others 3,346 3,012
Current assets 16,886 15,663
Bank deposits and cash 2,733 1,932
Trade, notes and other receivables 10,462 9,687
Inventories 3,435 3,792
Others 256 252
Current liabilities 20,490 19,460
Borrowings 1,953 1,167
Trade, notes, other payables, accruals and provisions 17,384 17,329
Others 1,154 964
Net current liabilities 3,604 3,797
Non-current liabilities 5,401 4,488
Total equity 4,097 4,546
2019 Lenovo Internal. All rights reserved. 36
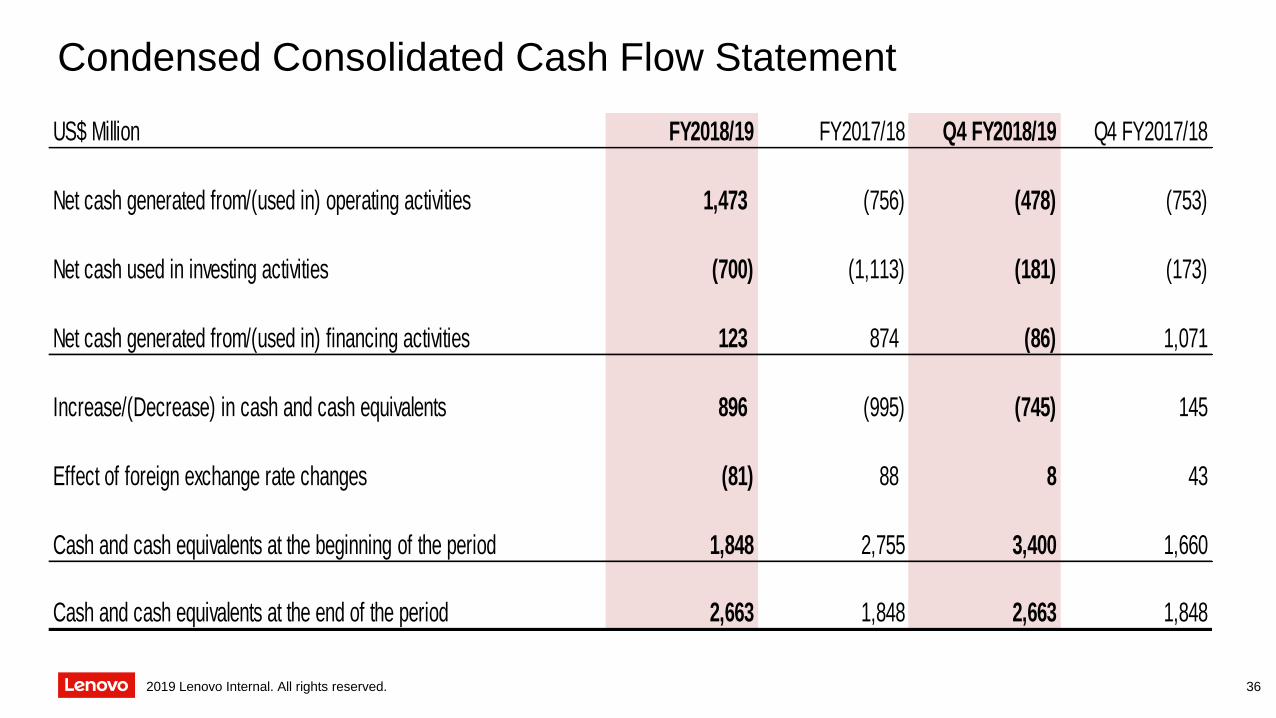
Condensed Consolidated Cash Flow Statement
US$ Million FY2018/19 FY2017/18 Q4 FY2018/19 Q4 FY2017/18
Net cash generated from/(used in) operating activities 1,473 (756) (478) (753)
Net cash used in investing activities (700) (1,113) (181) (173)
Net cash generated from/(used in) financing activities 123 874 (86) 1,071
Increase/(Decrease) in cash and cash equivalents 896 (995) (745) 145
Effect of foreign exchange rate changes (81) 88 8 43
Cash and cash equivalents at the beginning of the period 1,848 2,755 3,400 1,660
Cash and cash equivalents at the end of the period 2,663 1,848 2,663 1,848


![Lee & Man Paper [2314.HK]img3.gelonghui.com/pdf201607/pdf20160714100926297.pdfindustry since 2012. Total production of paper and paperboard grew 1.7% YoY in 2015, down from 2.8% YoY](https://img.pdfslide.us/doc/110x75/5f026c017e708231d4043142/lee-man-paper-2314hkimg3-industry-since-2012-total-production-of-paper.jpg)