Embed Size (px)
Citation preview

Company Update
THIS DOCUMENT MAY NOT BE DISTRIBUTED IN THE U.S., AUSTRALIA, CANADA OR JAPAN
FY18 better than expected still awaiting for M&A
April, 11th 2019 at 17:00
FY2018 results outperformed our forecast, market and main peers In 2018 Neodecortech generated €134mln of total revenue (+2.7% yoy), €19mln of adjusted EBITDA with margin at 14.2% (+250bps yoy) and €7.3mln of adjusted net income. It shows a leveraged financial structure with net debt at €44.3mln and equity at
€58.6mln. In 2018, the Group’s Unlevered Free Cash Flow was €5.9mln, including €7.7mln capex and €2mln of Net Working Capital cash absorption. Neodecortech improved its products mix expanding the LVT offer
Main corporate strategy is to capture a greater portion
of the international Décor Paper market, through a consolidation of its leadership in Italy and a commercial push. Part of this strategy has been implemented in 2018 through the acquisition of Corbetta, which allowed the Group to extend its LVT offering to Plastic Printed Laminated Film products, able to generate
marginality at the high end of Group’s products range. Estimates 2019E-2020E revised upwards According to our estimates in 2018-2020E, total revenue is seen growing (CAGR) by 5% to €146.6mln with EBITDA reaching €21.5mln or 14.7% margin and net income of €9.1mln. In 2019E-2020E, cumulated
Free Cash Flows are projected at €16.2mln, including aggregated Capex of €15.3mln and Net Working Capital absorption at €4.1mln. Net debt is estimated down to
€29.7mln at the end of 2020E from €44.3mln at the end of 2018. M&A needed to boost growth and let integration
synergies arise We believe that M&A deals are needed not only to foster growth and boost the operating leverage, but mostly to allow for the fully integrated business model to release its synergies mainly through a deeper exploitation of CdG production capacity. Even if a
decline has occurred, strategic raw materials cost remains a source of potential pressure on margins which, will improve if integration synergies fully arise within these two years. A strategic Business Plan presentation is scheduled by June. Valuation Update: TP raised; recommendation
confirmed Given the mature cash generating business, the DCF well adapts as a valuation approach. To this we added market multiples and M&A transaction multiples valuation. We raised the TP to €5.6 from €5.3 and given the significant upside on current price (€3.84); we confirm our BUY recommendation.
Target Price (€) €5.6 from €5.3
Recommendation BUY
Price as of April 10st
(€)
3.84
N. of shares (mln) 13.1
Market cap. (€ mln) 50.3
Market segment FTSE AIM ITALIA
Performance (%) 1m IPO 12m
Absolute +16% -5% 0%
% Max/Min (since IPO) €3.93/€2.66
Since IPO avg. daily volumes ('000) 12.5
(€ mln) 2017 2018 2019E 2020E
Total revenue 130.0 133.7 145.8 146.6
yoy change 12.4% 2.7% 9.1% 0.5%
Adj EBITDA 15.2 19.0 19.9 21.5
margin 11.9% 14.2% 13.6% 14.7%
Adj Net income 4.8 7.3 7.4 9.1
margin 3.9% 5.4% 5.1% 6.2%
Fixed assets 80.9 84.0 83.8 83.5
Net Working Capital 24.9 26.8 30.0 30.9
Net Invested Capital 100.9 102.9 102.8 100.3
Net debt/(cash) 46.9 44.3 39.1 29.7
Equity 54.0 58.6 63.7 70.5
Free Cash Flow 8.7 5.9 6.3 9.9
Source: Banca Profilo estimates and elaborations, Company data.
Francesca Sabatini
Head of Equity Research
+39 02 58408 461
Sales Desk
+39 02 58408 478
Equity Research
THIS DOCUMENT MAY NOT BE DISTRIBUTED IN THE U.S., AUSTRALIA, CANADA OR JAPAN
Contents
SWOT analysis ...................................................................................................... 3
FY18 results outperformed our estimates .............................................................. 4
Main operating and financial data ..........................................................................................................4
Strategy and estimates ......................................................................................... 13
Corporate strategies ............................................................................................................................... 13
Upward revision of our estimates 2019E-2020E ................................................................................... 13
Valuation Update .................................................................................................19
DCF Valuation ......................................................................................................................................... 19
Neodecortech competitive arena: strategic positioning and competitive advantages ........................ 20
Relative Valuation on multiples .............................................................................................................23
DISCLAIMER ......................................................................................................................................... 29
Equity Research
3
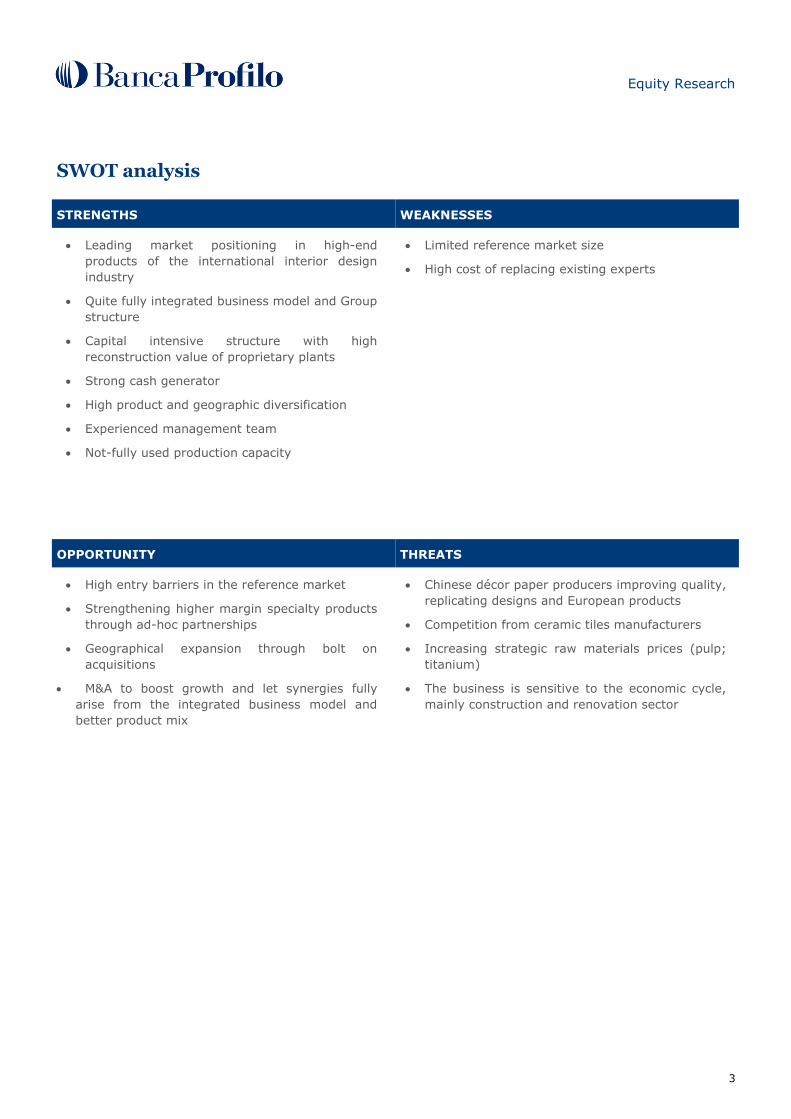
SWOT analysis
STRENGTHS WEAKNESSES
Leading market positioning in high-end
products of the international interior design
industry
Quite fully integrated business model and Group
structure
Capital intensive structure with high
reconstruction value of proprietary plants
Strong cash generator
High product and geographic diversification
Experienced management team
Not-fully used production capacity
Limited reference market size
High cost of replacing existing experts
OPPORTUNITY THREATS
High entry barriers in the reference market
Strengthening higher margin specialty products
through ad-hoc partnerships
Geographical expansion through bolt on
acquisitions
M&A to boost growth and let synergies fully
arise from the integrated business model and
better product mix
Chinese décor paper producers improving quality,
replicating designs and European products
Competition from ceramic tiles manufacturers
Increasing strategic raw materials prices (pulp;
titanium)
The business is sensitive to the economic cycle,
mainly construction and renovation sector
Equity Research
4
FY18 results outperformed our estimates Main operating and financial data Consolidated figures The Group perimeter includes: Neodecortech (NDT) controlling 100% of Cartiere di
Guarcino (CdG), which owns 100% of Bio Energia di Guarcino (BEG) and Corbetta
division.
NDT keeps
outperforming its reference market
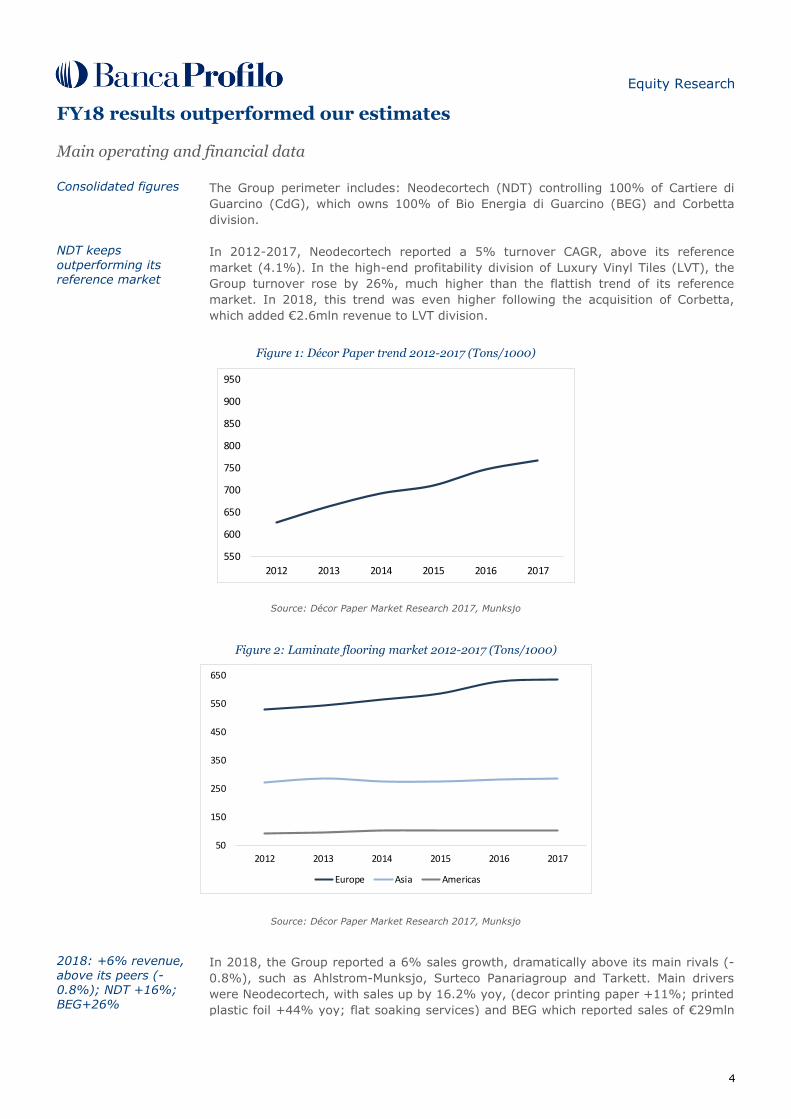
In 2012-2017, Neodecortech reported a 5% turnover CAGR, above its reference
market (4.1%). In the high-end profitability division of Luxury Vinyl Tiles (LVT), the
Group turnover rose by 26%, much higher than the flattish trend of its reference
market. In 2018, this trend was even higher following the acquisition of Corbetta,
which added €2.6mln revenue to LVT division.
Figure 1: Décor Paper trend 2012-2017 (Tons/1000)
550
600
650
700
750
800
850
900
950
2012 2013 2014 2015 2016 2017
Source: Décor Paper Market Research 2017, Munksjo
Figure 2: Laminate flooring market 2012-2017 (Tons/1000)
50
150
250
350
450
550
650
2012 2013 2014 2015 2016 2017
Europe Asia Americas
Source: Décor Paper Market Research 2017, Munksjo
2018: +6% revenue, above its peers (-0.8%); NDT +16%; BEG+26%
In 2018, the Group reported a 6% sales growth, dramatically above its main rivals (-
0.8%), such as Ahlstrom-Munksjo, Surteco Panariagroup and Tarkett. Main drivers
were Neodecortech, with sales up by 16.2% yoy, (decor printing paper +11%; printed
plastic foil +44% yoy; flat soaking services) and BEG which reported sales of €29mln
Equity Research
5
vs €23mln a year earlier, driven by energy and steam. BEG activity was at full regime,
with all 3 engines, for the first time since the accident occurred in 2016. CdG reported
a 10% sales decline, due to the increasing cost of its main production inputs,
especially pulp (in 2018) and titanium (in 2017) affecting selling prices with negative
response by a very elastic demand to price increase. In addition, in the 4Q of 2018, a
landside reduced the water input in to the production facility hilting CdG operations.
Nevertheless, a prompt intervention by the insurance has protected CdG margins.
Figure 3: Neodecortech revenue 2012-2018 by BU (€mln)
85.0 87.0 87.796.6 94.5 100.3 101.7
13.019.0
26.2
26.5
11.6
23.229.214.0
0
20
40
60
80
100
120
140
2012 2013 2014 2015PF 2016PF 2017PF 2018
non-Energy revenues Energy revenues Adjustments
Source: Banca Profilo elaborations on Company data
Product
diversification and domestic market
penetration
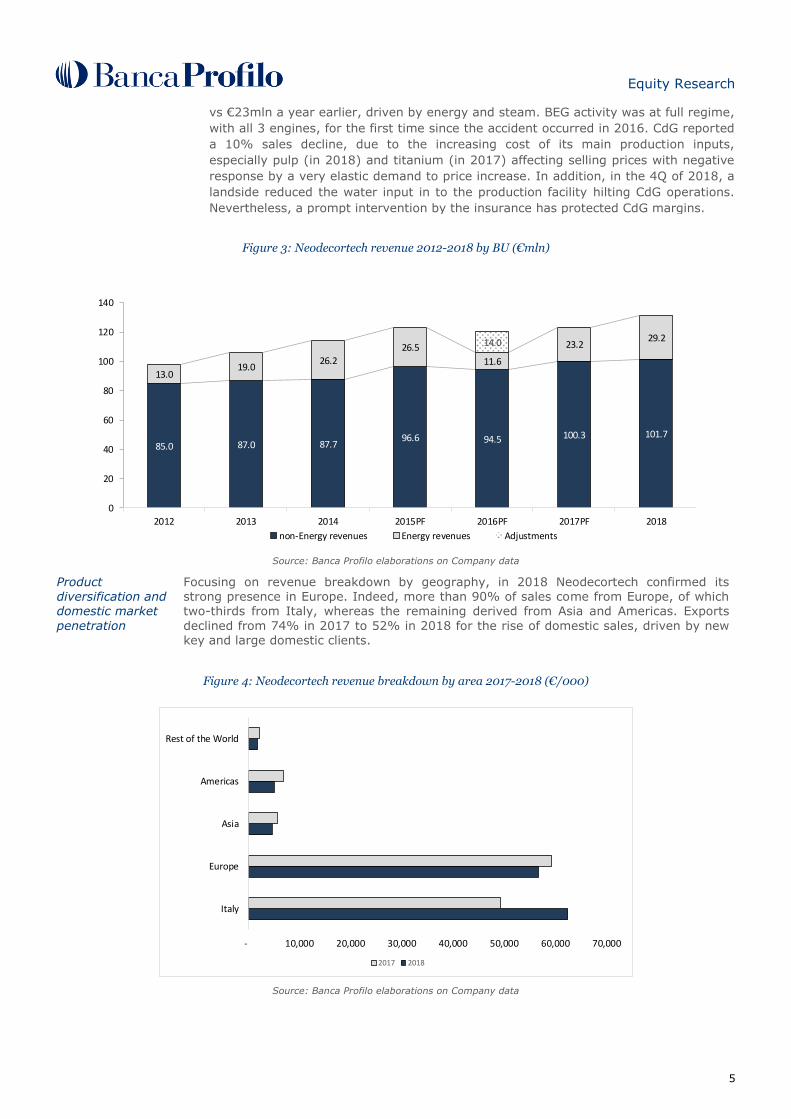
Focusing on revenue breakdown by geography, in 2018 Neodecortech confirmed its
strong presence in Europe. Indeed, more than 90% of sales come from Europe, of which two-thirds from Italy, whereas the remaining derived from Asia and Americas. Exports
declined from 74% in 2017 to 52% in 2018 for the rise of domestic sales, driven by new key and large domestic clients.
Figure 4: Neodecortech revenue breakdown by area 2017-2018 (€/000)
- 10,000 20,000 30,000 40,000 50,000 60,000 70,000
Italy
Europe
Asia
Americas
Rest of the World
2017 2018
Source: Banca Profilo elaborations on Company data
Equity Research
6
2018 turnover:
€131mln €102mln non-Energy €51mln paper printing
In 2018, about 90% of higher raw material costs (vs 2017), especially pulp and
titanium, were shifted to selling prices. In 2018, pulp continued to rise peaking to
€1,000/ton, whereas titanium basically stabilized on its peaks of €2,100/tons. As
regards to the remaining raw materials used, energy price (PUN) increased in 2018
(+15%) reaching its highest level in June; palm oil and fat prices declined, given a
good level of supply.
2018 EBITDA (adj) +250bps to 14.2%; +140bps in non-Energy
Following these trends, in 2018 the incidence of variable costs on sales declined by
100bps to 74% and the adjusted EBITDA margin improved to 14.2% from 11.7% a
year earlier.
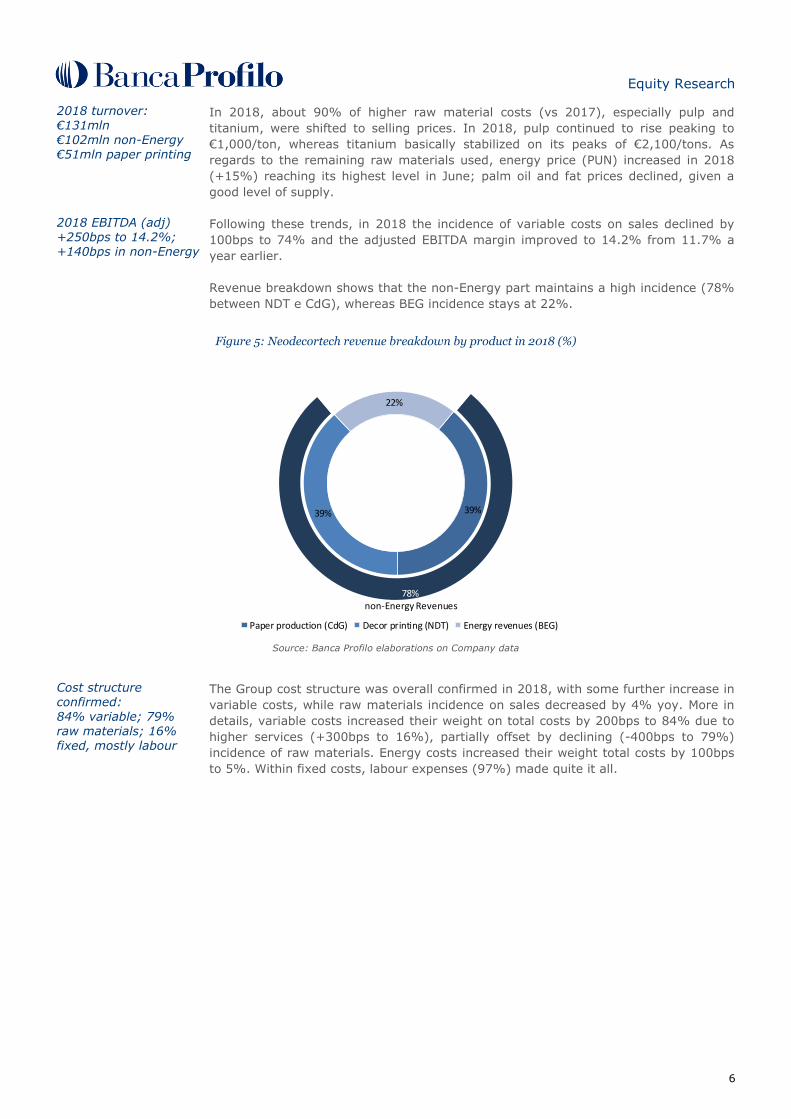
Revenue breakdown shows that the non-Energy part maintains a high incidence (78%
between NDT e CdG), whereas BEG incidence stays at 22%.
Figure 5: Neodecortech revenue breakdown by product in 2018 (%)
39%39%
22%
78%non-Energy Revenues
Paper production (CdG) Decor printing (NDT) Energy revenues (BEG)
Source: Banca Profilo elaborations on Company data
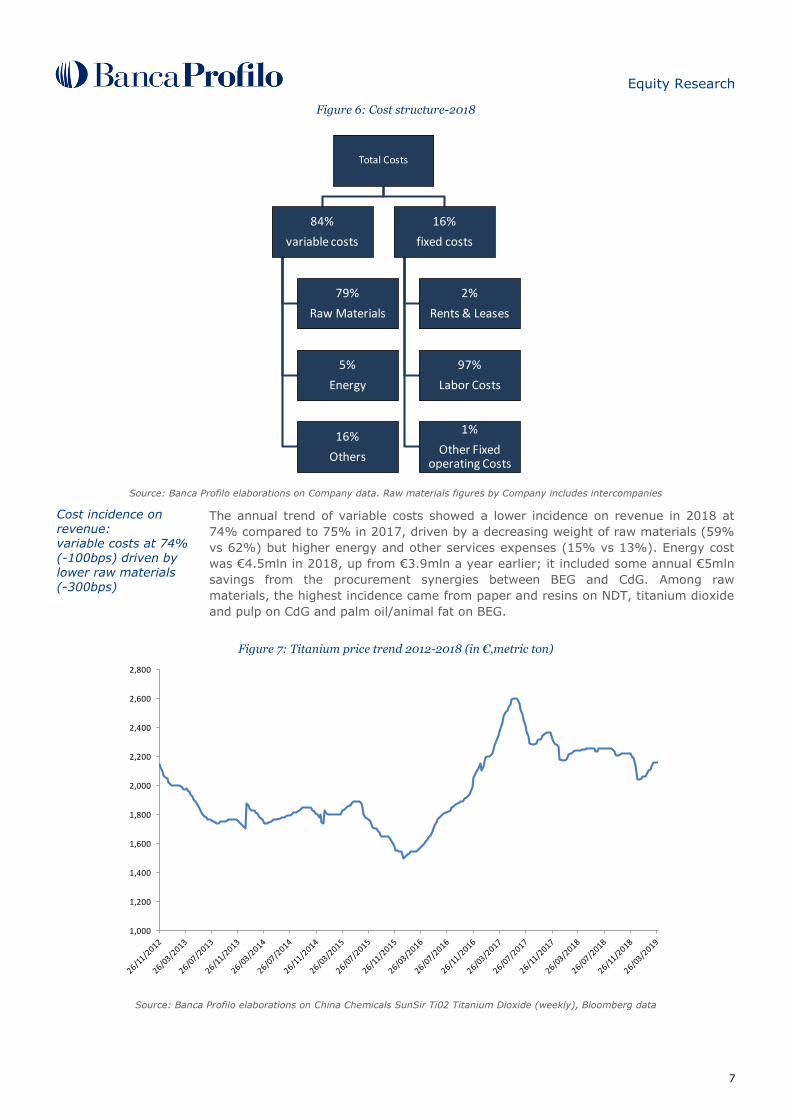
Cost structure confirmed: 84% variable; 79% raw materials; 16% fixed, mostly labour
The Group cost structure was overall confirmed in 2018, with some further increase in
variable costs, while raw materials incidence on sales decreased by 4% yoy. More in
details, variable costs increased their weight on total costs by 200bps to 84% due to
higher services (+300bps to 16%), partially offset by declining (-400bps to 79%)
incidence of raw materials. Energy costs increased their weight total costs by 100bps
to 5%. Within fixed costs, labour expenses (97%) made quite it all.
Equity Research
7
Figure 6: Cost structure-2018
Total Costs
84%
variable costs
79%
Raw Materials
5%
Energy
16%
Others
16%
fixed costs
2%
Rents & Leases
97%
Labor Costs
1%
Other Fixed operating Costs
Source: Banca Profilo elaborations on Company data. Raw materials figures by Company includes intercompanies
Cost incidence on revenue: variable costs at 74% (-100bps) driven by lower raw materials
(-300bps)
The annual trend of variable costs showed a lower incidence on revenue in 2018 at
74% compared to 75% in 2017, driven by a decreasing weight of raw materials (59%
vs 62%) but higher energy and other services expenses (15% vs 13%). Energy cost
was €4.5mln in 2018, up from €3.9mln a year earlier; it included some annual €5mln
savings from the procurement synergies between BEG and CdG. Among raw
materials, the highest incidence came from paper and resins on NDT, titanium dioxide
and pulp on CdG and palm oil/animal fat on BEG.
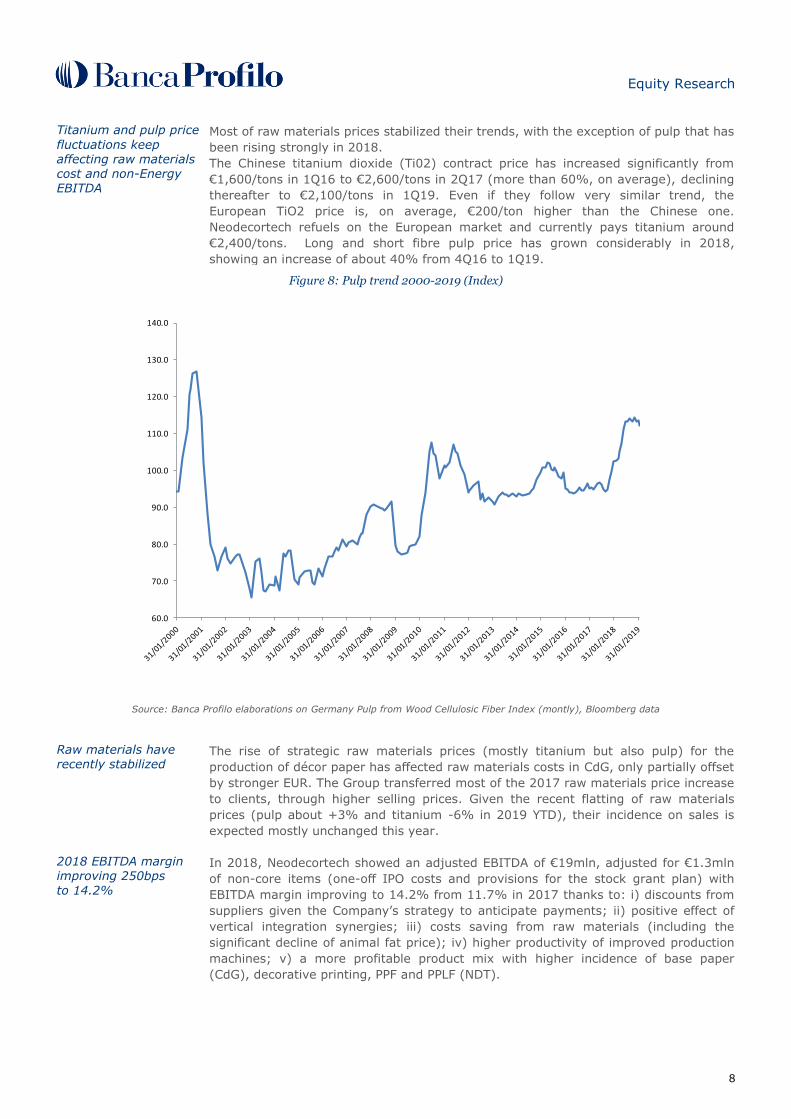
Figure 7: Titanium price trend 2012-2018 (in €,metric ton)
1,000
1,200
1,400
1,600
1,800
2,000
2,200
2,400
2,600
2,800
Source: Banca Profilo elaborations on China Chemicals SunSir Ti02 Titanium Dioxide (weekly), Bloomberg data
Equity Research
8
Titanium and pulp price
fluctuations keep affecting raw materials cost and non-Energy EBITDA
Most of raw materials prices stabilized their trends, with the exception of pulp that has
been rising strongly in 2018.
The Chinese titanium dioxide (Ti02) contract price has increased significantly from
€1,600/tons in 1Q16 to €2,600/tons in 2Q17 (more than 60%, on average), declining
thereafter to €2,100/tons in 1Q19. Even if they follow very similar trend, the
European TiO2 price is, on average, €200/ton higher than the Chinese one.
Neodecortech refuels on the European market and currently pays titanium around
€2,400/tons. Long and short fibre pulp price has grown considerably in 2018,
showing an increase of about 40% from 4Q16 to 1Q19.
Figure 8: Pulp trend 2000-2019 (Index)
60.0
70.0
80.0
90.0
100.0
110.0
120.0
130.0
140.0
Source: Banca Profilo elaborations on Germany Pulp from Wood Cellulosic Fiber Index (montly), Bloomberg data
Raw materials have recently stabilized
The rise of strategic raw materials prices (mostly titanium but also pulp) for the
production of décor paper has affected raw materials costs in CdG, only partially offset
by stronger EUR. The Group transferred most of the 2017 raw materials price increase
to clients, through higher selling prices. Given the recent flatting of raw materials
prices (pulp about +3% and titanium -6% in 2019 YTD), their incidence on sales is
expected mostly unchanged this year.
2018 EBITDA margin improving 250bps to 14.2%
In 2018, Neodecortech showed an adjusted EBITDA of €19mln, adjusted for €1.3mln
of non-core items (one-off IPO costs and provisions for the stock grant plan) with
EBITDA margin improving to 14.2% from 11.7% in 2017 thanks to: i) discounts from
suppliers given the Company’s strategy to anticipate payments; ii) positive effect of
vertical integration synergies; iii) costs saving from raw materials (including the
significant decline of animal fat price); iv) higher productivity of improved production
machines; v) a more profitable product mix with higher incidence of base paper
(CdG), decorative printing, PPF and PPLF (NDT).
Equity Research
9
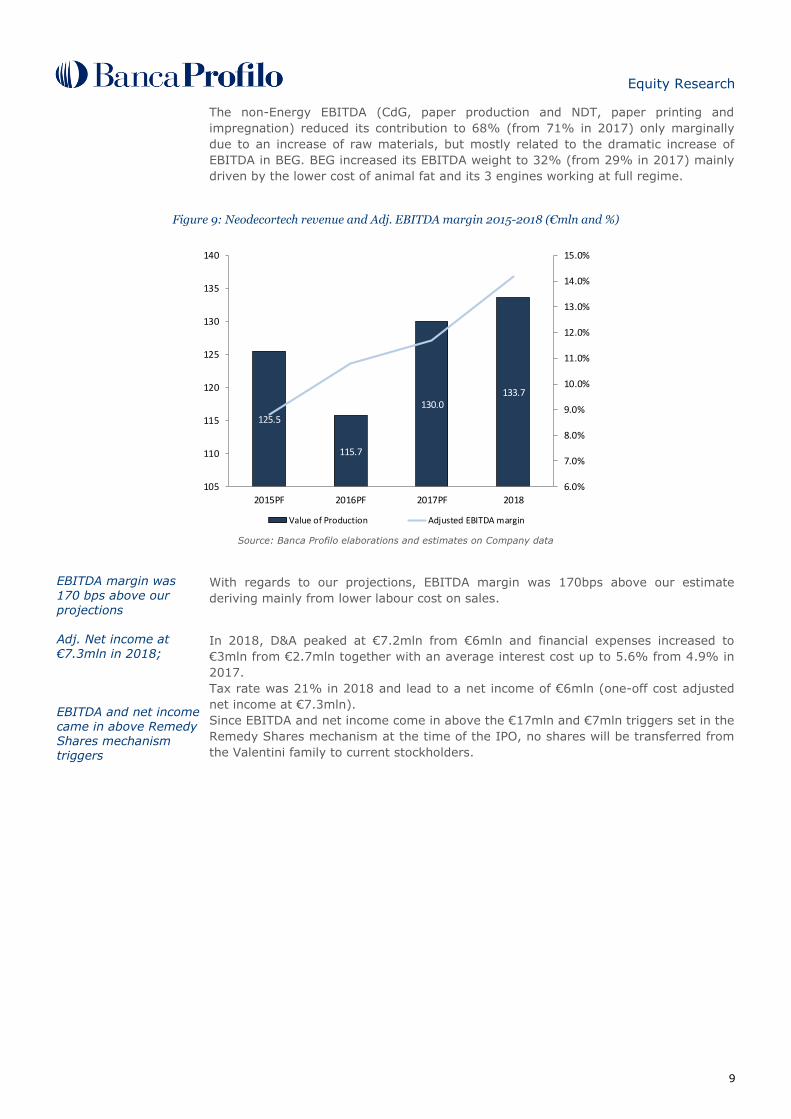
The non-Energy EBITDA (CdG, paper production and NDT, paper printing and
impregnation) reduced its contribution to 68% (from 71% in 2017) only marginally
due to an increase of raw materials, but mostly related to the dramatic increase of
EBITDA in BEG. BEG increased its EBITDA weight to 32% (from 29% in 2017) mainly
driven by the lower cost of animal fat and its 3 engines working at full regime.
Figure 9: Neodecortech revenue and Adj. EBITDA margin 2015-2018 (€mln and %)
125.5
115.7
130.0133.7
6.0%
7.0%
8.0%
9.0%
10.0%
11.0%
12.0%
13.0%
14.0%
15.0%
105
110
115
120
125
130
135
140
2015PF 2016PF 2017PF 2018
Value of Production Adjusted EBITDA margin
Source: Banca Profilo elaborations and estimates on Company data
EBITDA margin was
170 bps above our
projections
With regards to our projections, EBITDA margin was 170bps above our estimate
deriving mainly from lower labour cost on sales.
Adj. Net income at €7.3mln in 2018;
EBITDA and net income came in above Remedy Shares mechanism triggers
In 2018, D&A peaked at €7.2mln from €6mln and financial expenses increased to
€3mln from €2.7mln together with an average interest cost up to 5.6% from 4.9% in
2017.
Tax rate was 21% in 2018 and lead to a net income of €6mln (one-off cost adjusted
net income at €7.3mln).
Since EBITDA and net income come in above the €17mln and €7mln triggers set in the
Remedy Shares mechanism at the time of the IPO, no shares will be transferred from
the Valentini family to current stockholders.
Equity Research
10
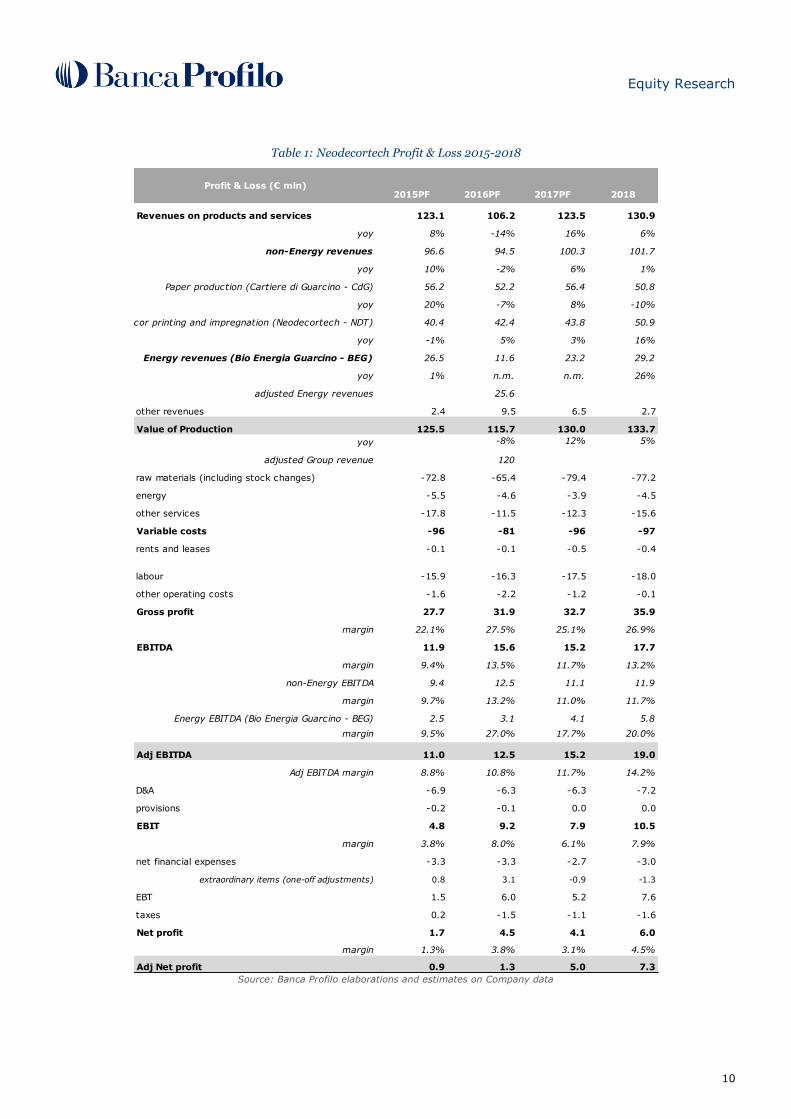
Table 1: Neodecortech Profit & Loss 2015-2018
2015PF 2016PF 2017PF 2018
Revenues on products and services 123.1 106.2 123.5 130.9
yoy 8% -14% 16% 6%
non-Energy revenues 96.6 94.5 100.3 101.7
yoy 10% -2% 6% 1%
Paper production (Cartiere di Guarcino - CdG) 56.2 52.2 56.4 50.8
yoy 20% -7% 8% -10%
Decor printing and impregnation (Neodecortech - NDT) 40.4 42.4 43.8 50.9
yoy -1% 5% 3% 16%
Energy revenues (Bio Energia Guarcino - BEG) 26.5 11.6 23.2 29.2
yoy 1% n.m. n.m. 26%
adjusted Energy revenues 25.6
other revenues 2.4 9.5 6.5 2.7
Value of Production 125.5 115.7 130.0 133.7
yoy -8% 12% 5%
adjusted Group revenue 120
raw materials (including stock changes) -72.8 -65.4 -79.4 -77.2
energy -5.5 -4.6 -3.9 -4.5
other services -17.8 -11.5 -12.3 -15.6
Variable costs -96 -81 -96 -97
rents and leases -0.1 -0.1 -0.5 -0.4
labour -15.9 -16.3 -17.5 -18.0
other operating costs -1.6 -2.2 -1.2 -0.1
Gross profit 27.7 31.9 32.7 35.9
margin 22.1% 27.5% 25.1% 26.9%
EBITDA 11.9 15.6 15.2 17.7
margin 9.4% 13.5% 11.7% 13.2%
non-Energy EBITDA 9.4 12.5 11.1 11.9
margin 9.7% 13.2% 11.0% 11.7%
Energy EBITDA (Bio Energia Guarcino - BEG) 2.5 3.1 4.1 5.8
margin 9.5% 27.0% 17.7% 20.0%
Adj EBITDA 11.0 12.5 15.2 19.0
Adj EBITDA margin 8.8% 10.8% 11.7% 14.2%
D&A -6.9 -6.3 -6.3 -7.2
provisions -0.2 -0.1 0.0 0.0
EBIT 4.8 9.2 7.9 10.5
margin 3.8% 8.0% 6.1% 7.9%
net financial expenses -3.3 -3.3 -2.7 -3.0
extraordinary items (one-off adjustments) 0.8 3.1 -0.9 -1.3
EBT 1.5 6.0 5.2 7.6
taxes 0.2 -1.5 -1.1 -1.6
Net profit 1.7 4.5 4.1 6.0
margin 1.3% 3.8% 3.1% 4.5%
Adj Net profit 0.9 1.3 5.0 7.3
Profit & Loss (€ mln)
Source: Banca Profilo elaborations and estimates on Company data
Equity Research
11
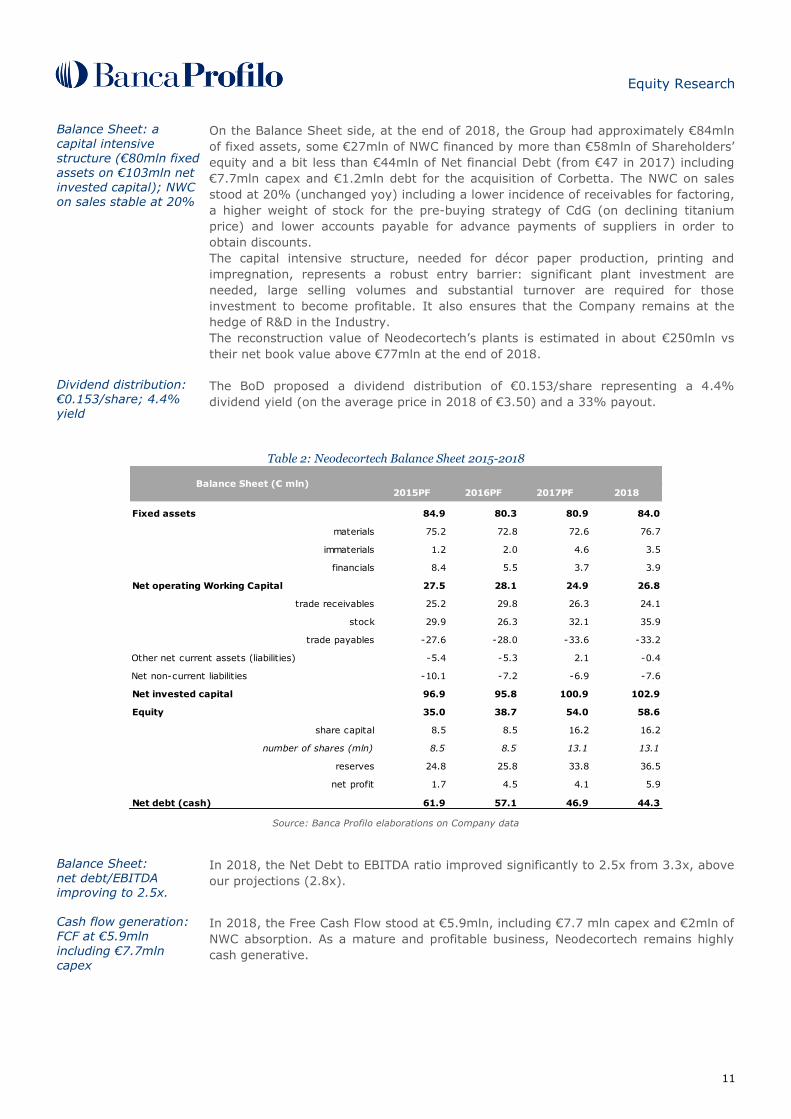
Balance Sheet: a capital intensive structure (€80mln fixed assets on €103mln net invested capital); NWC on sales stable at 20%
On the Balance Sheet side, at the end of 2018, the Group had approximately €84mln
of fixed assets, some €27mln of NWC financed by more than €58mln of Shareholders’
equity and a bit less than €44mln of Net financial Debt (from €47 in 2017) including
€7.7mln capex and €1.2mln debt for the acquisition of Corbetta. The NWC on sales
stood at 20% (unchanged yoy) including a lower incidence of receivables for factoring,
a higher weight of stock for the pre-buying strategy of CdG (on declining titanium
price) and lower accounts payable for advance payments of suppliers in order to
obtain discounts.
The capital intensive structure, needed for décor paper production, printing and
impregnation, represents a robust entry barrier: significant plant investment are
needed, large selling volumes and substantial turnover are required for those
investment to become profitable. It also ensures that the Company remains at the
hedge of R&D in the Industry.
The reconstruction value of Neodecortech’s plants is estimated in about €250mln vs
their net book value above €77mln at the end of 2018.
Dividend distribution: €0.153/share; 4.4% yield
The BoD proposed a dividend distribution of €0.153/share representing a 4.4%
dividend yield (on the average price in 2018 of €3.50) and a 33% payout.
Table 2: Neodecortech Balance Sheet 2015-2018
2015PF 2016PF 2017PF 2018
Fixed assets 84.9 80.3 80.9 84.0
materials 75.2 72.8 72.6 76.7
immaterials 1.2 2.0 4.6 3.5
financials 8.4 5.5 3.7 3.9
Net operating Working Capital 27.5 28.1 24.9 26.8
trade receivables 25.2 29.8 26.3 24.1
stock 29.9 26.3 32.1 35.9
trade payables -27.6 -28.0 -33.6 -33.2
Other net current assets (liabilities) -5.4 -5.3 2.1 -0.4
Net non-current liabilities -10.1 -7.2 -6.9 -7.6
Net invested capital 96.9 95.8 100.9 102.9
Equity 35.0 38.7 54.0 58.6
share capital 8.5 8.5 16.2 16.2
number of shares (mln) 8.5 8.5 13.1 13.1
reserves 24.8 25.8 33.8 36.5
net profit 1.7 4.5 4.1 5.9
Net debt (cash) 61.9 57.1 46.9 44.3
Balance Sheet (€ mln)
Source: Banca Profilo elaborations on Company data
Balance Sheet: net debt/EBITDA improving to 2.5x.
In 2018, the Net Debt to EBITDA ratio improved significantly to 2.5x from 3.3x, above
our projections (2.8x).
Cash flow generation: FCF at €5.9mln
including €7.7mln capex
In 2018, the Free Cash Flow stood at €5.9mln, including €7.7 mln capex and €2mln of
NWC absorption. As a mature and profitable business, Neodecortech remains highly
cash generative.
Equity Research
12
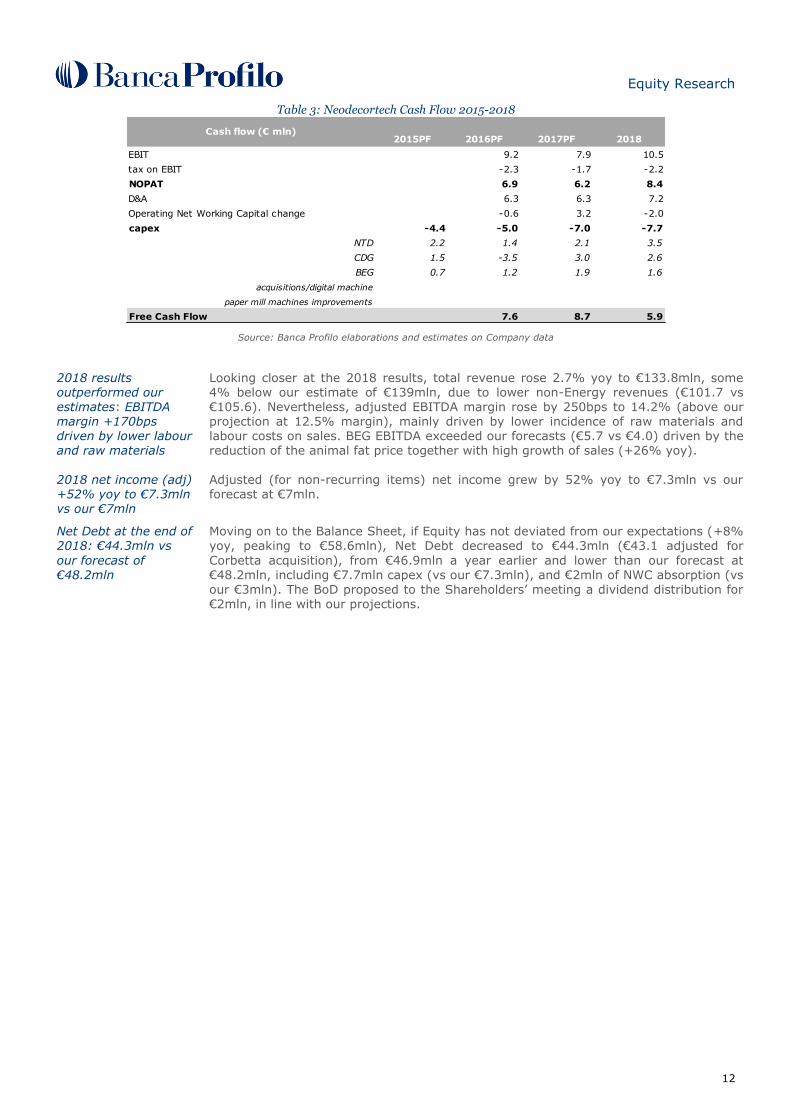
Table 3: Neodecortech Cash Flow 2015-2018
2015PF 2016PF 2017PF 2018
EBIT 9.2 7.9 10.5
tax on EBIT -2.3 -1.7 -2.2
NOPAT 6.9 6.2 8.4
D&A 6.3 6.3 7.2
Operating Net Working Capital change -0.6 3.2 -2.0
capex -4.4 -5.0 -7.0 -7.7
NTD 2.2 1.4 2.1 3.5
CDG 1.5 -3.5 3.0 2.6
BEG 0.7 1.2 1.9 1.6
acquisitions/digital machine
paper mill machines improvements
Free Cash Flow 7.6 8.7 5.9
Cash flow (€ mln)
Source: Banca Profilo elaborations and estimates on Company data
2018 results outperformed our estimates: EBITDA margin +170bps driven by lower labour and raw materials
Looking closer at the 2018 results, total revenue rose 2.7% yoy to €133.8mln, some 4% below our estimate of €139mln, due to lower non-Energy revenues (€101.7 vs €105.6). Nevertheless, adjusted EBITDA margin rose by 250bps to 14.2% (above our projection at 12.5% margin), mainly driven by lower incidence of raw materials and labour costs on sales. BEG EBITDA exceeded our forecasts (€5.7 vs €4.0) driven by the reduction of the animal fat price together with high growth of sales (+26% yoy).
2018 net income (adj) +52% yoy to €7.3mln vs our €7mln
Adjusted (for non-recurring items) net income grew by 52% yoy to €7.3mln vs our forecast at €7mln.
Net Debt at the end of 2018: €44.3mln vs
our forecast of €48.2mln
Moving on to the Balance Sheet, if Equity has not deviated from our expectations (+8% yoy, peaking to €58.6mln), Net Debt decreased to €44.3mln (€43.1 adjusted for
Corbetta acquisition), from €46.9mln a year earlier and lower than our forecast at €48.2mln, including €7.7mln capex (vs our €7.3mln), and €2mln of NWC absorption (vs
our €3mln). The BoD proposed to the Shareholders’ meeting a dividend distribution for €2mln, in line with our projections.
Equity Research
13
Strategy and estimates Corporate strategies Capture a greater
portion of the international Décor Paper market M&A to foster growth, vertical synergies and profitability through a
better product mix
Main corporate strategy is to capture a greater portion of the international Décor
Paper market, through a consolidation of the leadership in Italy and a commercial
push. Moreover, possible extraordinary moves (M&A) may expand the Group presence
in some niches, such as the pre-impregnation segment, and in some areas, such as
North America (NDT) and/or East Europe (CdG). The Company has started to address
the IPO proceeds to enhance the paper machines and make them more productive,
improve paper flatness, its printability and stabilize its quality. A step towards
enhancing the supply and increasing market share has been done with the acquisition
of the business unit from Corbetta. Moreover, Group is orienting its offer to a
diversified product mix, reducing correlation with the macroeconomic cycle.
We believe the M&A is needed not only to foster growth and boost the operating
leverage but also to allow for the fully integrated business model to release its
synergies mainly through a deeper exploitation of CdG production capacity and finally
to boost profitability through higher margin mix of products.
Acquisition of the
division for surface lamination from CorbettaFia, a high growth and margin top end niche product
Neodecortech acquired the surface lamination division of Corbetta. The company
specializes in the production of PPLF laminates. Neodecortech acquired Corbetta’s
plant and developed, through an innovative use of the existing machineries, the
specific know-how to produce the PPLF, a new range of products derived from the
integration of printed PVC with transparent PVC surfaces to realize LVT flooring. As
consequence, the acquisition firstly allows the Group to enter the European LVT
market and then to extend its offering to PPLF products. The PPLF products have a
marginality in line with the LVT flooring, hence at the high end of products range.
Corbetta achieved a turnover of around €8mln in 2018, with an EBITDA margin of 5%.
Including debt, the amount for the acquisition was €1.4mln. Neodecortech places high
expectations on PPLF sales, as it would consolidate its leading position in Europe in
this new market segment, characterized by double-digit growth and substantial
margins.
Upward revision of our estimates 2019E-2020E An upward revision of our estimates
Given a higher 2018 compared to our projections, we updated our estimates and
valuation to include these beating results mostly in terms of marginality. We also
included Corbetta in our estimates. We have not added 2021E yet, waiting for the
Business Plan presentation scheduled by June.
We expect the Group to outpace its reference market thanks to its
faster growing and
niche positioning
We expect Neodecortech to keep outpacing its reference market growth, given: i) its
strategic positioning in faster growing market segments and geographic areas (mainly
décor paper printing and Western Europe); ii) a persisting commercial push; iii),
improved visibility following the IPO process, which has been opening new
opportunities with new clients (or improving selling volumes of historical customers);
iv) increase in market share thanks to external growth. In fact, if the global Décor
Paper market is expected to grow at a CAGR approximately near to 3.5% in the next
two years (Source: Décor Paper Market Research 2017, Munksjo), we project a 10%
total revenue CAGR 2018-2020E for the Group. Moreover, in support of our
assumptions, it is sufficient to observe that against a decrease in main peers sales of
0.8% (on average), Neodecortech increased sales by 2.8% in 2018.
Further non-organic growth potentials
Further non-organic growth, not included in our estimates, might come from
procurement agreements, industrial partnerships and/or to M&A deals. In this
Equity Research
14
scenario, the Group is looking at printers, at the pre-impregnated paper segment, at
the PVC market and at geographies such as North America and Eastern Europe to be
in the trend of substitution of carpet to LVT. The Group is looking at printers in order
to increase the absorption of paper production from CdG within the integrated Group
(from current 15% to 50%) and let consequently rise integration synergies.
According to management, the Company aims at reaching an EBITDA margin of 15%
in 3 to 4 years and capex should stay at 2018 level, before new strategic
developments, still to be defined and planned in the upcoming Business Plan
(scheduled by June).
Some increase in FCF projections 2019-2020
As consequence, on average in the 2019E-2020E period we expect:
top line lower by 7% from €157mln to €146mln, for Corbetta turnover which
we reduced by €4mln both in 2019E and 2020E;
EBITDA margin +90bps for lower labour costs and raw materials expenses;
NWC/sales at 21.2% from previous 22.4% continuing the optimization in
2018, which showed increasing turnover of receivables, offsetting lower
accounts payables and higher stock;
capex at €7.7mln;
We end up with an average FCF to €8.1mln from €7.7mln given by increasing
marginality and lower NWC absorption.
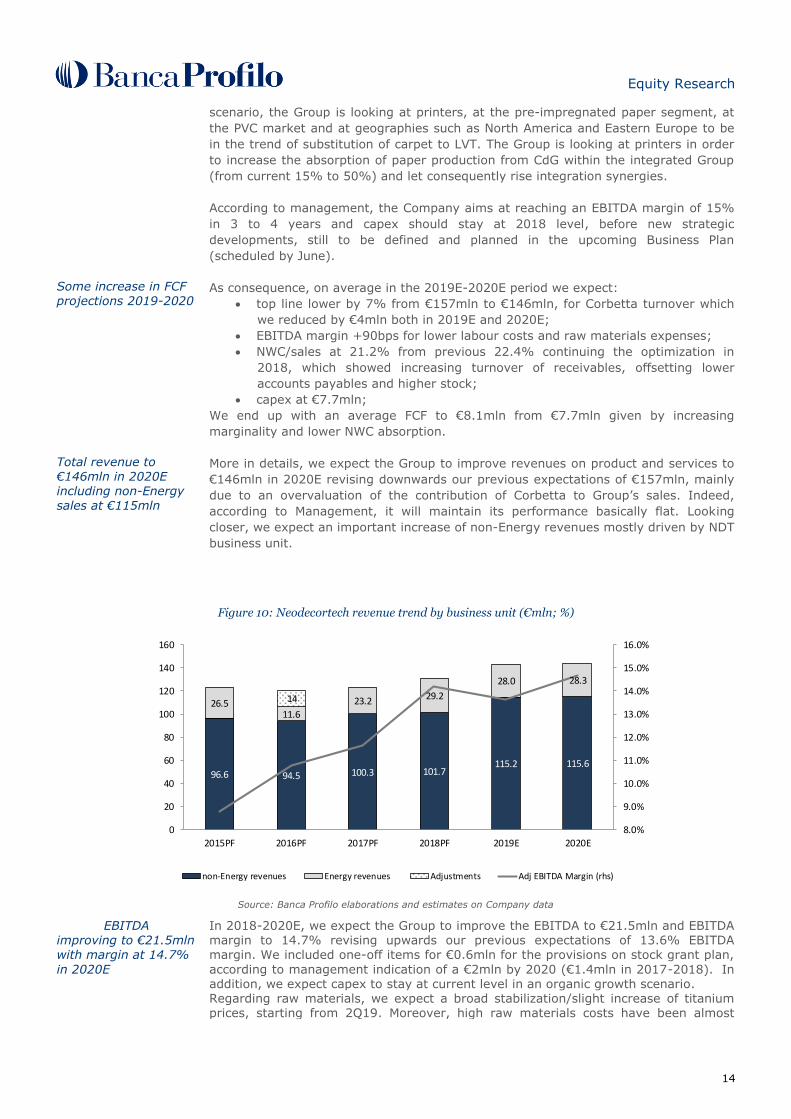
Total revenue to €146mln in 2020E including non-Energy sales at €115mln
More in details, we expect the Group to improve revenues on product and services to
€146mln in 2020E revising downwards our previous expectations of €157mln, mainly
due to an overvaluation of the contribution of Corbetta to Group’s sales. Indeed,
according to Management, it will maintain its performance basically flat. Looking
closer, we expect an important increase of non-Energy revenues mostly driven by NDT
business unit.
Figure 10: Neodecortech revenue trend by business unit (€mln; %)
96.6 94.5 100.3 101.7115.2 115.6
26.511.6
23.2 29.2
28.0 28.3
14
8.0%
9.0%
10.0%
11.0%
12.0%
13.0%
14.0%
15.0%
16.0%
0
20
40
60
80
100
120
140
160
2015PF 2016PF 2017PF 2018PF 2019E 2020E
non-Energy revenues Energy revenues Adjustments Adj EBITDA Margin (rhs)
Source: Banca Profilo elaborations and estimates on Company data
EBITDA improving to €21.5mln with margin at 14.7%
in 2020E
In 2018-2020E, we expect the Group to improve the EBITDA to €21.5mln and EBITDA margin to 14.7% revising upwards our previous expectations of 13.6% EBITDA margin. We included one-off items for €0.6mln for the provisions on stock grant plan,
according to management indication of a €2mln by 2020 (€1.4mln in 2017-2018). In addition, we expect capex to stay at current level in an organic growth scenario. Regarding raw materials, we expect a broad stabilization/slight increase of titanium prices, starting from 2Q19. Moreover, high raw materials costs have been almost
Equity Research
15
totally spread to selling price; therefore, excluding a structural change in demand,
which is very unlikely, raw material costs should just follow sales volume. We have also included some procurement discounts coming from the management strategic policy of accelerating suppliers’ payments. From 2018, the EBITDA increase is also driven by projected synergies of the vertical integrated Group structure, a more efficient usage of raw materials, improving machines productivity and a better product mix.
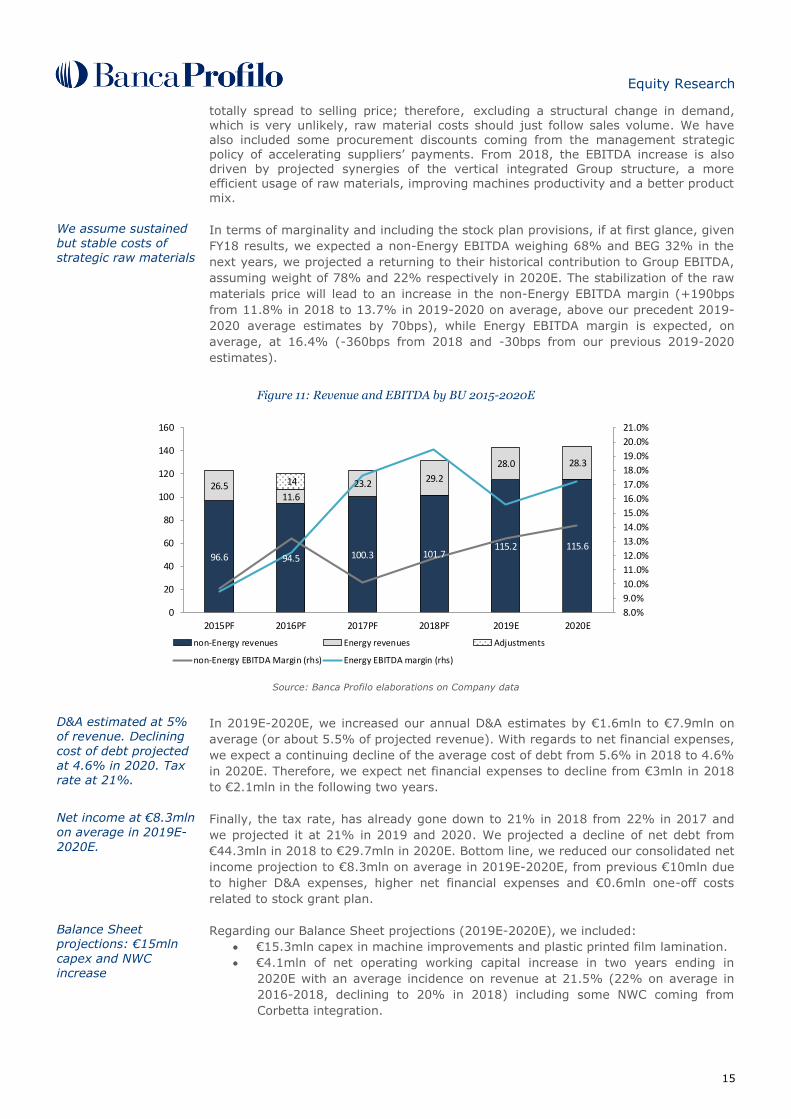
We assume sustained but stable costs of strategic raw materials
In terms of marginality and including the stock plan provisions, if at first glance, given
FY18 results, we expected a non-Energy EBITDA weighing 68% and BEG 32% in the
next years, we projected a returning to their historical contribution to Group EBITDA,
assuming weight of 78% and 22% respectively in 2020E. The stabilization of the raw
materials price will lead to an increase in the non-Energy EBITDA margin (+190bps
from 11.8% in 2018 to 13.7% in 2019-2020 on average, above our precedent 2019-
2020 average estimates by 70bps), while Energy EBITDA margin is expected, on
average, at 16.4% (-360bps from 2018 and -30bps from our previous 2019-2020
estimates).
Figure 11: Revenue and EBITDA by BU 2015-2020E
96.6 94.5 100.3 101.7115.2 115.6
26.511.6
23.2 29.2
28.0 28.3
14
8.0%
9.0%
10.0%
11.0%
12.0%
13.0%
14.0%
15.0%
16.0%
17.0%
18.0%
19.0%
20.0%
21.0%
0
20
40
60
80
100
120
140
160
2015PF 2016PF 2017PF 2018PF 2019E 2020E
non-Energy revenues Energy revenues Adjustments
non-Energy EBITDA Margin (rhs) Energy EBITDA margin (rhs)
Source: Banca Profilo elaborations on Company data
D&A estimated at 5% of revenue. Declining
cost of debt projected at 4.6% in 2020. Tax rate at 21%.
In 2019E-2020E, we increased our annual D&A estimates by €1.6mln to €7.9mln on
average (or about 5.5% of projected revenue). With regards to net financial expenses,
we expect a continuing decline of the average cost of debt from 5.6% in 2018 to 4.6%
in 2020E. Therefore, we expect net financial expenses to decline from €3mln in 2018
to €2.1mln in the following two years.
Net income at €8.3mln
on average in 2019E-
2020E.
Finally, the tax rate, has already gone down to 21% in 2018 from 22% in 2017 and
we projected it at 21% in 2019 and 2020. We projected a decline of net debt from
€44.3mln in 2018 to €29.7mln in 2020E. Bottom line, we reduced our consolidated net
income projection to €8.3mln on average in 2019E-2020E, from previous €10mln due
to higher D&A expenses, higher net financial expenses and €0.6mln one-off costs
related to stock grant plan.
Balance Sheet projections: €15mln
capex and NWC increase
Regarding our Balance Sheet projections (2019E-2020E), we included:
€15.3mln capex in machine improvements and plastic printed film lamination.
€4.1mln of net operating working capital increase in two years ending in
2020E with an average incidence on revenue at 21.5% (22% on average in
2016-2018, declining to 20% in 2018) including some NWC coming from
Corbetta integration.
Equity Research
16
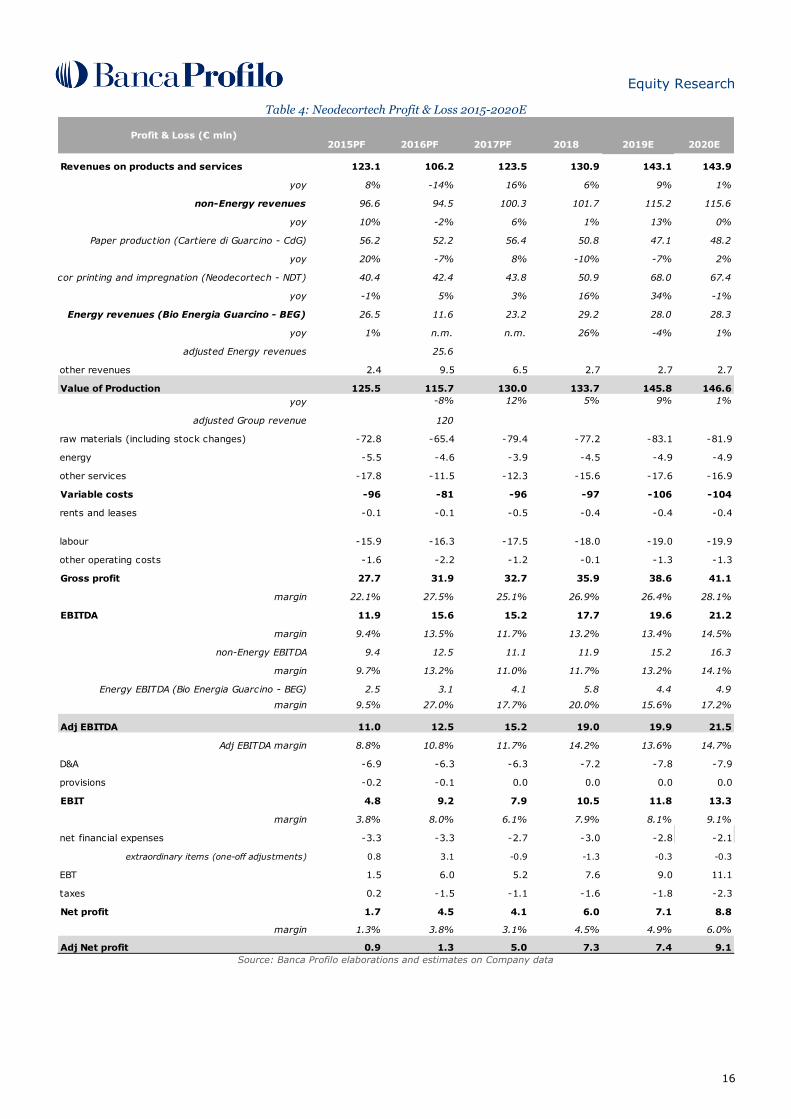
Table 4: Neodecortech Profit & Loss 2015-2020E
2015PF 2016PF 2017PF 2018 2019E 2020E
Revenues on products and services 123.1 106.2 123.5 130.9 143.1 143.9
yoy 8% -14% 16% 6% 9% 1%
non-Energy revenues 96.6 94.5 100.3 101.7 115.2 115.6
yoy 10% -2% 6% 1% 13% 0%
Paper production (Cartiere di Guarcino - CdG) 56.2 52.2 56.4 50.8 47.1 48.2
yoy 20% -7% 8% -10% -7% 2%
Decor printing and impregnation (Neodecortech - NDT) 40.4 42.4 43.8 50.9 68.0 67.4
yoy -1% 5% 3% 16% 34% -1%
Energy revenues (Bio Energia Guarcino - BEG) 26.5 11.6 23.2 29.2 28.0 28.3
yoy 1% n.m. n.m. 26% -4% 1%
adjusted Energy revenues 25.6
other revenues 2.4 9.5 6.5 2.7 2.7 2.7
Value of Production 125.5 115.7 130.0 133.7 145.8 146.6
yoy -8% 12% 5% 9% 1%
adjusted Group revenue 120
raw materials (including stock changes) -72.8 -65.4 -79.4 -77.2 -83.1 -81.9
energy -5.5 -4.6 -3.9 -4.5 -4.9 -4.9
other services -17.8 -11.5 -12.3 -15.6 -17.6 -16.9
Variable costs -96 -81 -96 -97 -106 -104
rents and leases -0.1 -0.1 -0.5 -0.4 -0.4 -0.4
labour -15.9 -16.3 -17.5 -18.0 -19.0 -19.9
other operating costs -1.6 -2.2 -1.2 -0.1 -1.3 -1.3
Gross profit 27.7 31.9 32.7 35.9 38.6 41.1
margin 22.1% 27.5% 25.1% 26.9% 26.4% 28.1%
EBITDA 11.9 15.6 15.2 17.7 19.6 21.2
margin 9.4% 13.5% 11.7% 13.2% 13.4% 14.5%
non-Energy EBITDA 9.4 12.5 11.1 11.9 15.2 16.3
margin 9.7% 13.2% 11.0% 11.7% 13.2% 14.1%
Energy EBITDA (Bio Energia Guarcino - BEG) 2.5 3.1 4.1 5.8 4.4 4.9
margin 9.5% 27.0% 17.7% 20.0% 15.6% 17.2%
Adj EBITDA 11.0 12.5 15.2 19.0 19.9 21.5
Adj EBITDA margin 8.8% 10.8% 11.7% 14.2% 13.6% 14.7%
D&A -6.9 -6.3 -6.3 -7.2 -7.8 -7.9
provisions -0.2 -0.1 0.0 0.0 0.0 0.0
EBIT 4.8 9.2 7.9 10.5 11.8 13.3
margin 3.8% 8.0% 6.1% 7.9% 8.1% 9.1%
net financial expenses -3.3 -3.3 -2.7 -3.0 -2.8 -2.1
extraordinary items (one-off adjustments) 0.8 3.1 -0.9 -1.3 -0.3 -0.3
EBT 1.5 6.0 5.2 7.6 9.0 11.1
taxes 0.2 -1.5 -1.1 -1.6 -1.8 -2.3
Net profit 1.7 4.5 4.1 6.0 7.1 8.8
margin 1.3% 3.8% 3.1% 4.5% 4.9% 6.0%
Adj Net profit 0.9 1.3 5.0 7.3 7.4 9.1
Profit & Loss (€ mln)
Source: Banca Profilo elaborations and estimates on Company data
Equity Research
17
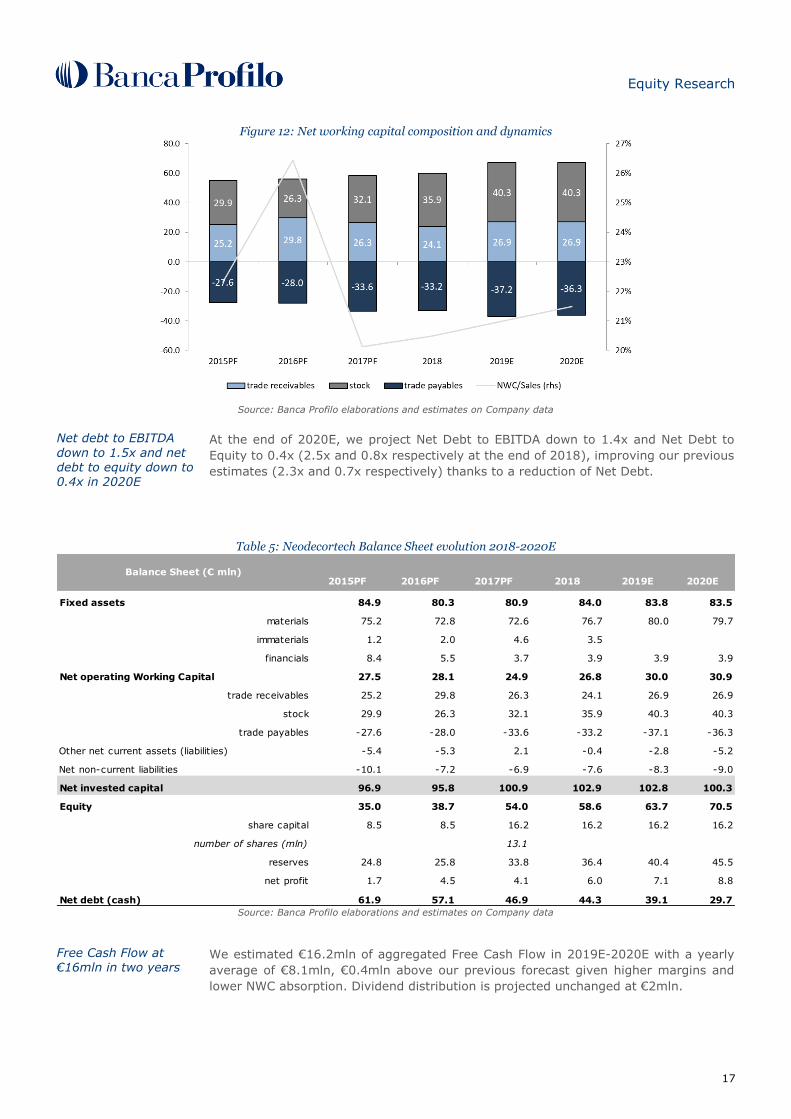
Figure 12: Net working capital composition and dynamics
Source: Banca Profilo elaborations and estimates on Company data
Net debt to EBITDA
down to 1.5x and net debt to equity down to 0.4x in 2020E
At the end of 2020E, we project Net Debt to EBITDA down to 1.4x and Net Debt to
Equity to 0.4x (2.5x and 0.8x respectively at the end of 2018), improving our previous
estimates (2.3x and 0.7x respectively) thanks to a reduction of Net Debt.
Table 5: Neodecortech Balance Sheet evolution 2018-2020E
2015PF 2016PF 2017PF 2018 2019E 2020E
Fixed assets 84.9 80.3 80.9 84.0 83.8 83.5
materials 75.2 72.8 72.6 76.7 80.0 79.7
immaterials 1.2 2.0 4.6 3.5
financials 8.4 5.5 3.7 3.9 3.9 3.9
Net operating Working Capital 27.5 28.1 24.9 26.8 30.0 30.9
trade receivables 25.2 29.8 26.3 24.1 26.9 26.9
stock 29.9 26.3 32.1 35.9 40.3 40.3
trade payables -27.6 -28.0 -33.6 -33.2 -37.1 -36.3
Other net current assets (liabilities) -5.4 -5.3 2.1 -0.4 -2.8 -5.2
Net non-current liabilities -10.1 -7.2 -6.9 -7.6 -8.3 -9.0
Net invested capital 96.9 95.8 100.9 102.9 102.8 100.3
Equity 35.0 38.7 54.0 58.6 63.7 70.5
share capital 8.5 8.5 16.2 16.2 16.2 16.2
number of shares (mln) 13.1
reserves 24.8 25.8 33.8 36.4 40.4 45.5
net profit 1.7 4.5 4.1 6.0 7.1 8.8
Net debt (cash) 61.9 57.1 46.9 44.3 39.1 29.7
Balance Sheet (€ mln)
Source: Banca Profilo elaborations and estimates on Company data
Free Cash Flow at €16mln in two years
We estimated €16.2mln of aggregated Free Cash Flow in 2019E-2020E with a yearly
average of €8.1mln, €0.4mln above our previous forecast given higher margins and
lower NWC absorption. Dividend distribution is projected unchanged at €2mln.
Equity Research
18
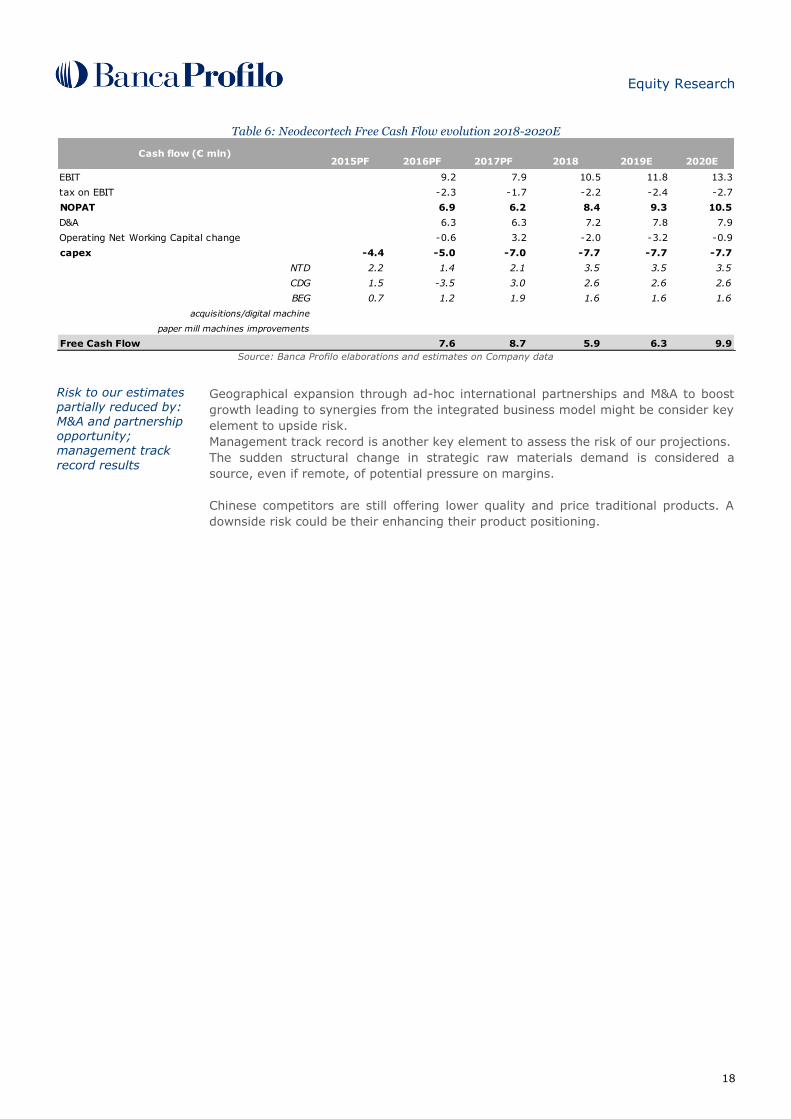
Table 6: Neodecortech Free Cash Flow evolution 2018-2020E
2015PF 2016PF 2017PF 2018 2019E 2020E
EBIT 9.2 7.9 10.5 11.8 13.3
tax on EBIT -2.3 -1.7 -2.2 -2.4 -2.7
NOPAT 6.9 6.2 8.4 9.3 10.5
D&A 6.3 6.3 7.2 7.8 7.9
Operating Net Working Capital change -0.6 3.2 -2.0 -3.2 -0.9
capex -4.4 -5.0 -7.0 -7.7 -7.7 -7.7
NTD 2.2 1.4 2.1 3.5 3.5 3.5
CDG 1.5 -3.5 3.0 2.6 2.6 2.6
BEG 0.7 1.2 1.9 1.6 1.6 1.6
acquisitions/digital machine
paper mill machines improvements
Free Cash Flow 7.6 8.7 5.9 6.3 9.9
Cash flow (€ mln)
Source: Banca Profilo elaborations and estimates on Company data
Risk to our estimates partially reduced by: M&A and partnership opportunity; management track
record results
Geographical expansion through ad-hoc international partnerships and M&A to boost
growth leading to synergies from the integrated business model might be consider key
element to upside risk.
Management track record is another key element to assess the risk of our projections.
The sudden structural change in strategic raw materials demand is considered a
source, even if remote, of potential pressure on margins.
Chinese competitors are still offering lower quality and price traditional products. A
downside risk could be their enhancing their product positioning.
Equity Research
19
Valuation Update Given the mature and robust cash generating business, a DCF method well adapts as
a valuation approach.
A mature and cash generating business: DCF method well
adapts for valuing the Group
For what concerns the relative valuation, there are no listed companies active in the
Décor Paper market, showing a similar vertical integration of both the value chain and
the Group structure, as Neodecortech. Main big diversified groups are either décor
paper producers or décor paper printers and impregnators; none has a synergic Group
structure as that of Neodecortech.
A sample of listed companies active in the reference Industry is
the base for a relative
valuation of the Group confirmed by M&A transactions multiples
We have selected a sample of listed companies active either in some of the production
cycle phases of Décor Paper production and printing or in the substitutive ceramic tile
market. We also included listed players in the downstream interior design industry.
Our sample for the relative approach on market multiples includes: the Swedish
Ahlstrom-Munksjo (décor paper production), the German Surteco (décor paper
printing and impregnation), the Italian Panariagroup (ceramic tiles) and the French
Tarkett (flooring solutions). Finally we add to the relative valuation an average of M&A
multiples derived from comparable transactions in the past three years.
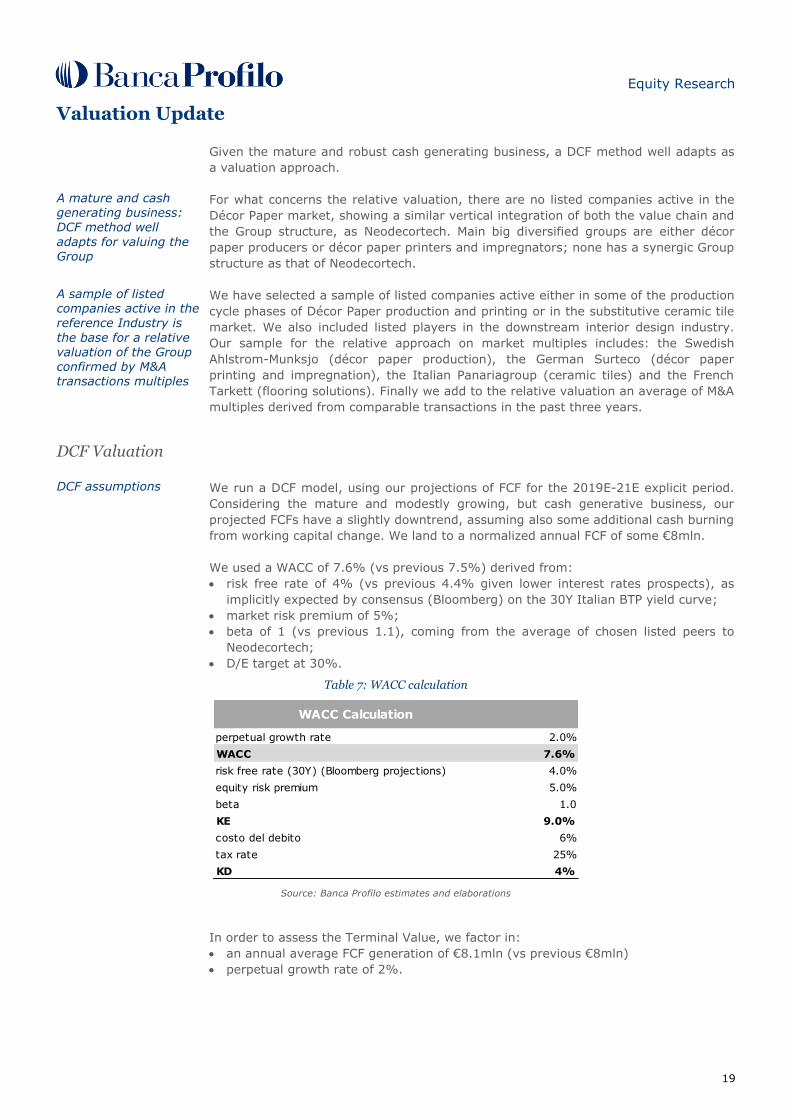
DCF Valuation DCF assumptions We run a DCF model, using our projections of FCF for the 2019E-21E explicit period.
Considering the mature and modestly growing, but cash generative business, our
projected FCFs have a slightly downtrend, assuming also some additional cash burning
from working capital change. We land to a normalized annual FCF of some €8mln.
We used a WACC of 7.6% (vs previous 7.5%) derived from:
risk free rate of 4% (vs previous 4.4% given lower interest rates prospects), as
implicitly expected by consensus (Bloomberg) on the 30Y Italian BTP yield curve;
market risk premium of 5%;
beta of 1 (vs previous 1.1), coming from the average of chosen listed peers to
Neodecortech;
D/E target at 30%.
Table 7: WACC calculation
WACC Calculation
perpetual growth rate 2.0%
WACC 7.6%
risk free rate (30Y) (Bloomberg projections) 4.0%
equity risk premium 5.0%
beta 1.0
KE 9.0%
costo del debito 6%
tax rate 25%
KD 4%
Source: Banca Profilo estimates and elaborations
In order to assess the Terminal Value, we factor in:
an annual average FCF generation of €8.1mln (vs previous €8mln)
perpetual growth rate of 2%.
Equity Research
20
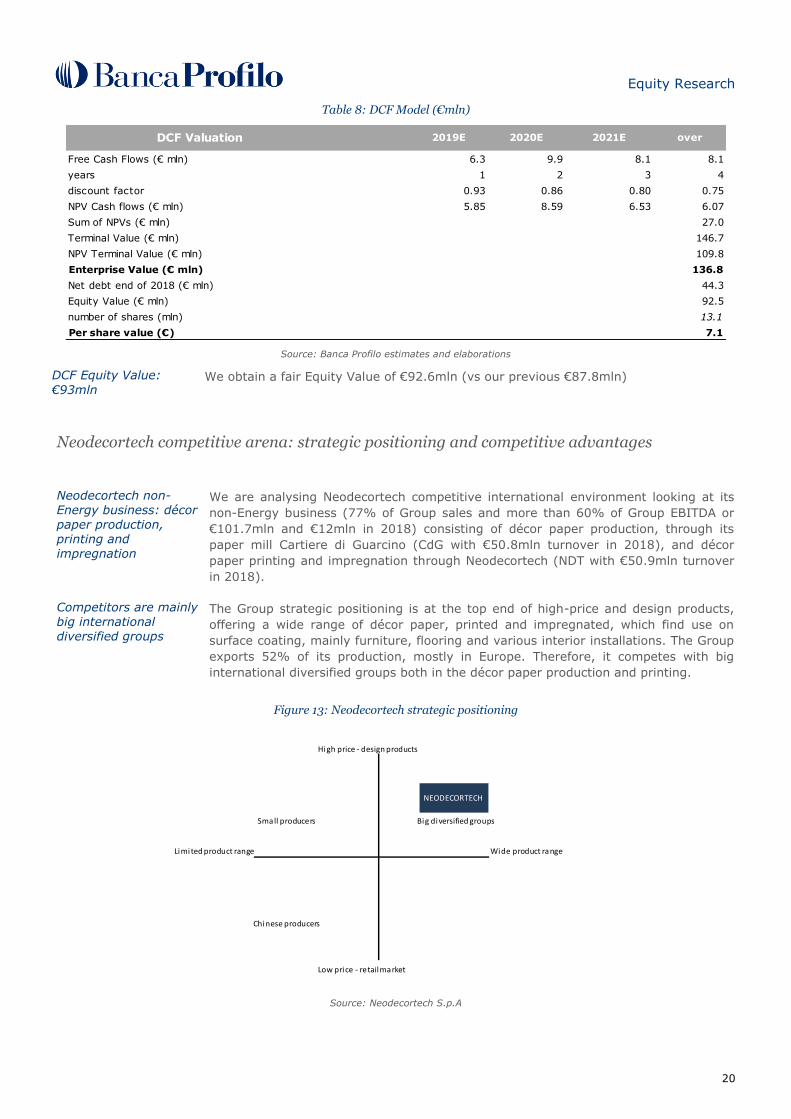
Table 8: DCF Model (€mln)
DCF Valuation 2019E 2020E 2021E over
Free Cash Flows (€ mln) 6.3 9.9 8.1 8.1
years 1 2 3 4
discount factor 0.93 0.86 0.80 0.75
NPV Cash flows (€ mln) 5.85 8.59 6.53 6.07
Sum of NPVs (€ mln) 27.0
Terminal Value (€ mln) 146.7
NPV Terminal Value (€ mln) 109.8
Enterprise Value (€ mln) 136.8
Net debt end of 2018 (€ mln) 44.3
Equity Value (€ mln) 92.5
number of shares (mln) 13.1
Per share value (€) 7.1 Source: Banca Profilo estimates and elaborations
DCF Equity Value:
€93mln We obtain a fair Equity Value of €92.6mln (vs our previous €87.8mln)
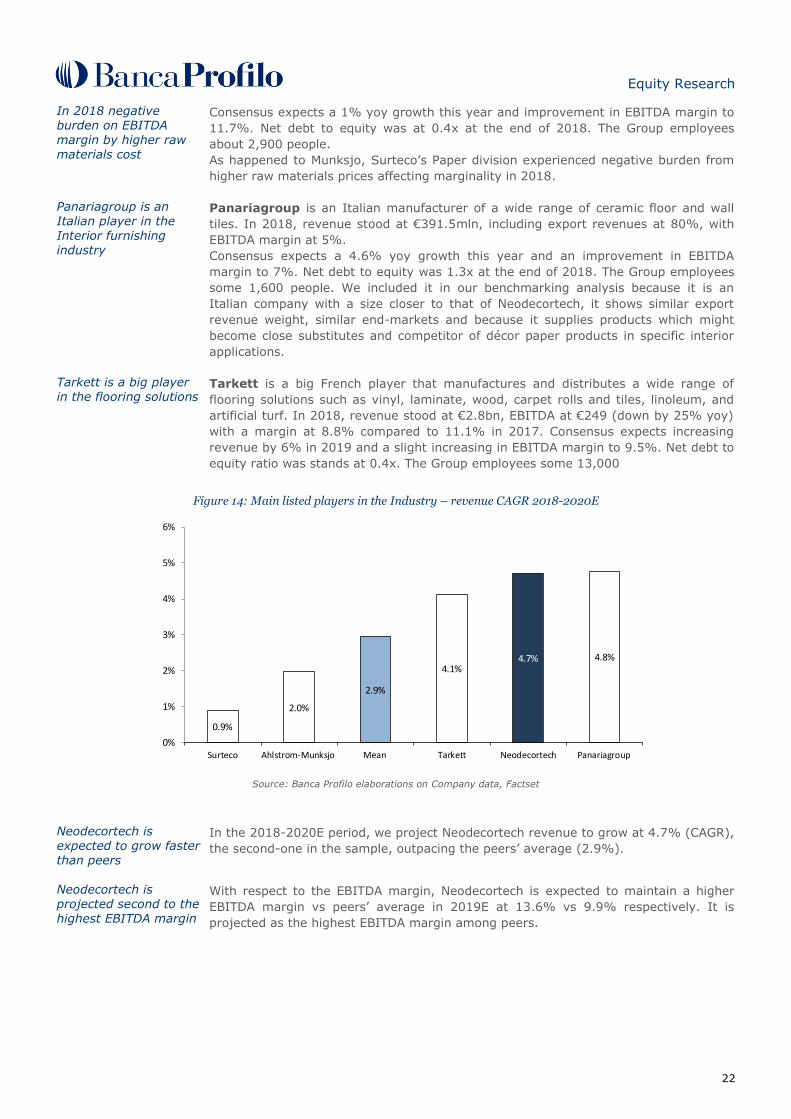
Neodecortech competitive arena: strategic positioning and competitive advantages
Neodecortech non-Energy business: décor paper production, printing and impregnation
We are analysing Neodecortech competitive international environment looking at its
non-Energy business (77% of Group sales and more than 60% of Group EBITDA or
€101.7mln and €12mln in 2018) consisting of décor paper production, through its
paper mill Cartiere di Guarcino (CdG with €50.8mln turnover in 2018), and décor
paper printing and impregnation through Neodecortech (NDT with €50.9mln turnover
in 2018).
Competitors are mainly big international diversified groups
The Group strategic positioning is at the top end of high-price and design products,
offering a wide range of décor paper, printed and impregnated, which find use on
surface coating, mainly furniture, flooring and various interior installations. The Group
exports 52% of its production, mostly in Europe. Therefore, it competes with big
international diversified groups both in the décor paper production and printing.
Figure 13: Neodecortech strategic positioning
High price - design products
Small producers Big diversified groups
Limited product range Wide product range
Chinese producers
Low price - retail market
NEODECORTECH
Source: Neodecortech S.p.A

Equity Research
21
Décor paper producers, printers and impregnators are mostly non-listed German
players. In the low-end of the Industry, Chinese producers historically offered lower-
quality and cheaper products; more recently, they have started to improve their
products quality, boosting exports particularly to China’s neighbour countries.
Main entry barriers: the capital intensive structure and long lasting partnerships with clients
In this competitive arena, the capital intensive structure and long lasting partnerships
with customers are the main entry barriers. Significant plant investment are needed
for décor paper production, printing and impregnation; therefore large selling volumes
and substantial turnover need to be generated for those investment to become
profitable. More in details, the reconstruction value of Neodecortech’s plants is about
€250mln vs their net book value of €77mln at the end of 2018. Clients are large and
concentrated, requesting high quality, production flexibility and tailored offering.
High incidence of energy and raw materials in the cost
structure
In addition of being a capital intensive business, the typical cost structure of décor
paper producers and printers shows a high incidence of variable (often volatile) costs
(74% of revenue), mainly energy and raw materials (titanium dioxide and pulp in
paper production; paper, resins and PVC in paper or plastic printing and
impregnation). Therefore, an efficient use of raw materials, long and stable
partnerships with suppliers, optimization of procurement policies and enhancing
production productivity are key drivers to profitability in this Industry.
Neodecortech key competitive advantage: its vertically integrated business model
In this scenario, the key competitive advantage of Neodecortech is its vertical
integrated business model and Group synergic structure, which allow for control on
the R&D process, generate savings on procurement, enhance the operating leverage,
guarantee supply, production flexibility and time to market.
Benchmarking analysis on listed players
We concentrate our benchmarking analysis on listed players in the reference market
and on other listed companies in the larger industry of Interior Furnishing. Within the
décor paper producers (the paper mill CdG competitors) we analyze the Ahlstrom-
Munksjo Group (Sweden, listed on the Nasdaq Helsinki and on Stockholm stock
exchanges), whereas within the décor paper printers and impregnators (NDT
competitors, yet potentially CdG clients) we examine the German Surteco. In addition,
we look into the Italian Panariagroup, active mostly in the ceramic tiles and the
French Tarkett, a large player in flooring solutions.
Ahlstrom Munksjo is a décor paper producer; competitor of CdG EBITDA margin hit by significant raw material cost escalation in 2018
Ahlstrom-Munksjo is a Sweden supplier of industrial paper: décor papers, coatings,
primer foils, graphic papers, tapes, wall coverings and other fiber based materials. In
2017, Munksjo and Ahlstrom merged and created a global leader in sustainable and
innovative fiber-based solutions with combined annual sales of €2.2bn, more than
6,000 employees and 41 production and converting facilities in 14 countries
worldwide. In 2018, the Group completed the acquisition of both U.S specialty paper
producer Expera Specialty Solutions and Caieiras Paper Mill that expands the
company’s presence in North and South America and strengthens its offering.
In 2018, the Group generated revenue for 3bn (décor paper production accounted for
€451.9mln up by 19.5% yoy) with EBITDA margin of 11% (décor paper EBITDA
margin at 8.2% down by 800bps from 2017 hit by lower sales volumes, adverse
currency and raw material costs). The escalation of raw material costs (mainly
titanium dioxide and pulp) hit margins of the Décor Paper division in 2018, burdened
the results by approximately €145mln (31% of décor division revenue).
Consensus expects revenue growth at 1.5% in 2019E-2020E with EBITDA margin
reaching 11%; net debt to equity ratio was 0.6x at the end of 2018.
Surteco is a décor paper printer and impregnator; competitor of NDT
Surteco is a German specialist in surface technologies. Its product portfolio includes:
paper printed with decorative designs, impregnated products, release papers,
decorative flat foils and other specialized laminates. Its main clients are furniture
manufacturers. In 2018, revenue stood at €695mln (+7.7% yoy), with paper
weighting 60% and plastic 40%. EBITDA margin was 10.5% in 2018.
Equity Research
22
In 2018 negative
burden on EBITDA margin by higher raw materials cost
Consensus expects a 1% yoy growth this year and improvement in EBITDA margin to
11.7%. Net debt to equity was at 0.4x at the end of 2018. The Group employees
about 2,900 people.
As happened to Munksjo, Surteco’s Paper division experienced negative burden from
higher raw materials prices affecting marginality in 2018.
Panariagroup is an Italian player in the Interior furnishing industry
Panariagroup is an Italian manufacturer of a wide range of ceramic floor and wall
tiles. In 2018, revenue stood at €391.5mln, including export revenues at 80%, with
EBITDA margin at 5%.
Consensus expects a 4.6% yoy growth this year and an improvement in EBITDA
margin to 7%. Net debt to equity was 1.3x at the end of 2018. The Group employees
some 1,600 people. We included it in our benchmarking analysis because it is an
Italian company with a size closer to that of Neodecortech, it shows similar export
revenue weight, similar end-markets and because it supplies products which might
become close substitutes and competitor of décor paper products in specific interior
applications.
Tarkett is a big player in the flooring solutions
Tarkett is a big French player that manufactures and distributes a wide range of
flooring solutions such as vinyl, laminate, wood, carpet rolls and tiles, linoleum, and
artificial turf. In 2018, revenue stood at €2.8bn, EBITDA at €249 (down by 25% yoy)
with a margin at 8.8% compared to 11.1% in 2017. Consensus expects increasing
revenue by 6% in 2019 and a slight increasing in EBITDA margin to 9.5%. Net debt to
equity ratio was stands at 0.4x. The Group employees some 13,000
Figure 14: Main listed players in the Industry – revenue CAGR 2018-2020E
0.9%
2.0%
2.9%
4.1%4.7% 4.8%
0%
1%
2%
3%
4%
5%
6%
Surteco Ahlstrom-Munksjo Mean Tarkett Neodecortech Panariagroup
Source: Banca Profilo elaborations on Company data, Factset
Neodecortech is expected to grow faster than peers
In the 2018-2020E period, we project Neodecortech revenue to grow at 4.7% (CAGR),
the second-one in the sample, outpacing the peers’ average (2.9%).
Neodecortech is projected second to the highest EBITDA margin
With respect to the EBITDA margin, Neodecortech is expected to maintain a higher
EBITDA margin vs peers’ average in 2019E at 13.6% vs 9.9% respectively. It is
projected as the highest EBITDA margin among peers.
Equity Research
23
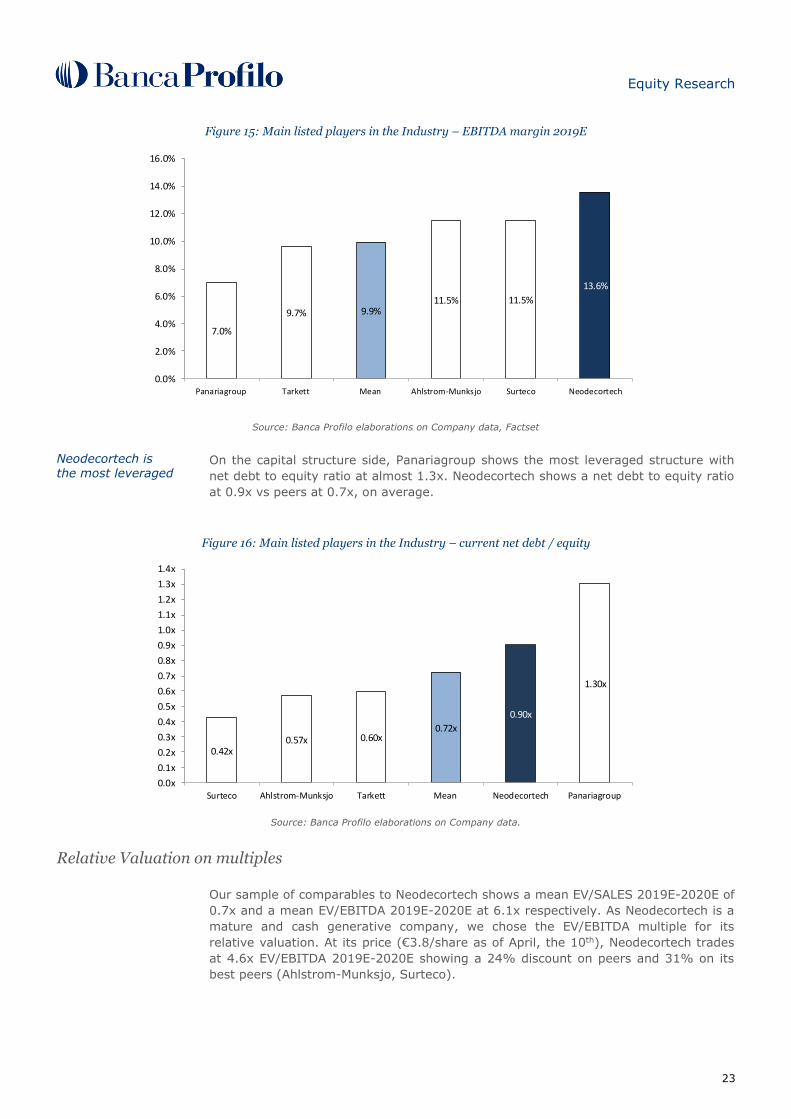
Figure 15: Main listed players in the Industry – EBITDA margin 2019E
7.0%
9.7% 9.9%11.5% 11.5%
13.6%
0.0%
2.0%
4.0%
6.0%
8.0%
10.0%
12.0%
14.0%
16.0%
Panariagroup Tarkett Mean Ahlstrom-Munksjo Surteco Neodecortech
Source: Banca Profilo elaborations on Company data, Factset
Neodecortech is the most leveraged
On the capital structure side, Panariagroup shows the most leveraged structure with
net debt to equity ratio at almost 1.3x. Neodecortech shows a net debt to equity ratio
at 0.9x vs peers at 0.7x, on average.
Figure 16: Main listed players in the Industry – current net debt / equity
0.42x0.57x 0.60x
0.72x
0.90x
1.30x
0.0x
0.1x
0.2x
0.3x
0.4x
0.5x
0.6x
0.7x
0.8x
0.9x
1.0x
1.1x
1.2x
1.3x
1.4x
Surteco Ahlstrom-Munksjo Tarkett Mean Neodecortech Panariagroup
Source: Banca Profilo elaborations on Company data.
Relative Valuation on multiples Our sample of comparables to Neodecortech shows a mean EV/SALES 2019E-2020E of
0.7x and a mean EV/EBITDA 2019E-2020E at 6.1x respectively. As Neodecortech is a
mature and cash generative company, we chose the EV/EBITDA multiple for its
relative valuation. At its price (€3.8/share as of April, the 10th), Neodecortech trades
at 4.6x EV/EBITDA 2019E-2020E showing a 24% discount on peers and 31% on its
best peers (Ahlstrom-Munksjo, Surteco).
Equity Research
24
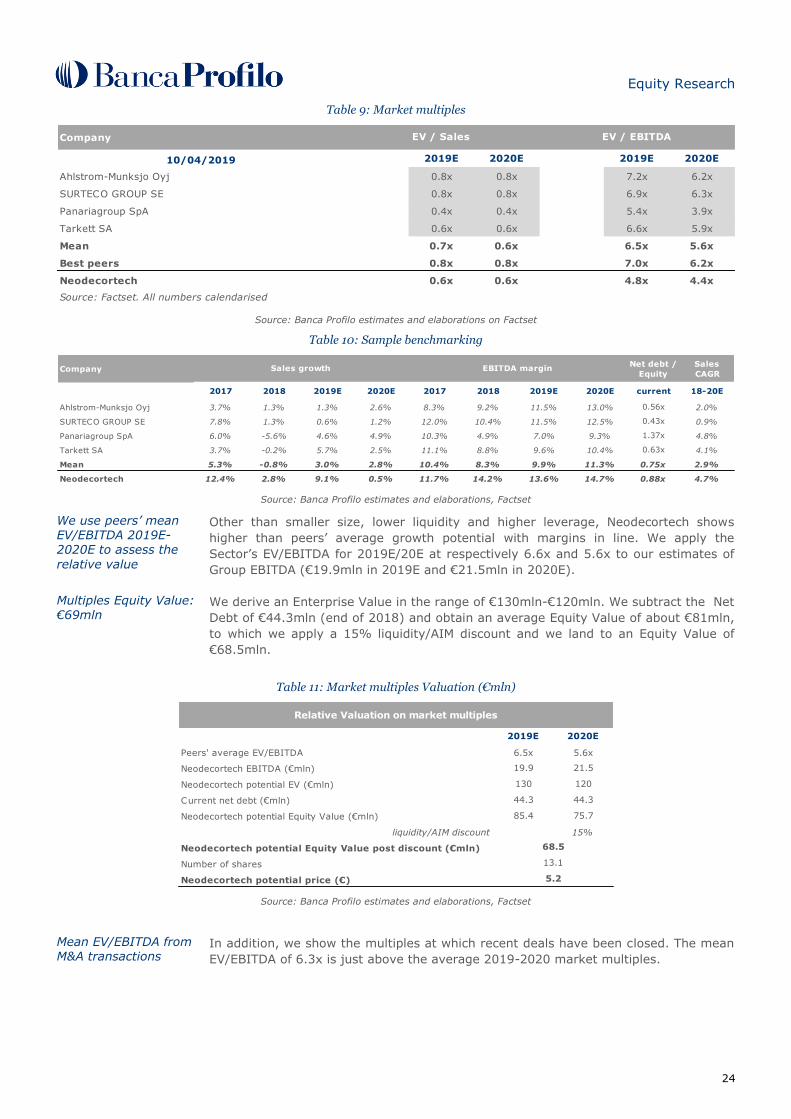
Table 9: Market multiples
Company
10/04/2019 2019E 2020E 2019E 2020E
Ahlstrom-Munksjo Oyj 0.8x 0.8x 7.2x 6.2x
SURTECO GROUP SE 0.8x 0.8x 6.9x 6.3x
Panariagroup SpA 0.4x 0.4x 5.4x 3.9x
Tarkett SA 0.6x 0.6x 6.6x 5.9x
Mean 0.7x 0.6x 6.5x 5.6x
Best peers 0.8x 0.8x 7.0x 6.2x
Neodecortech 0.6x 0.6x 4.8x 4.4x
Source: Factset. All numbers calendarised
EV / Sales EV / EBITDA
Source: Banca Profilo estimates and elaborations on Factset
Table 10: Sample benchmarking
CompanyNet debt /
Equity
Sales
CAGR
2017 2018 2019E 2020E 2017 2018 2019E 2020E current 18-20E
Ahlstrom-Munksjo Oyj 3.7% 1.3% 1.3% 2.6% 8.3% 9.2% 11.5% 13.0% 0.56x 2.0%
SURTECO GROUP SE 7.8% 1.3% 0.6% 1.2% 12.0% 10.4% 11.5% 12.5% 0.43x 0.9%
Panariagroup SpA 6.0% -5.6% 4.6% 4.9% 10.3% 4.9% 7.0% 9.3% 1.37x 4.8%
Tarkett SA 3.7% -0.2% 5.7% 2.5% 11.1% 8.8% 9.6% 10.4% 0.63x 4.1%
Mean 5.3% -0.8% 3.0% 2.8% 10.4% 8.3% 9.9% 11.3% 0.75x 2.9%
Neodecortech 12.4% 2.8% 9.1% 0.5% 11.7% 14.2% 13.6% 14.7% 0.88x 4.7%
Sales growth EBITDA margin
Source: Banca Profilo estimates and elaborations, Factset
We use peers’ mean EV/EBITDA 2019E-2020E to assess the
relative value
Other than smaller size, lower liquidity and higher leverage, Neodecortech shows
higher than peers’ average growth potential with margins in line. We apply the
Sector’s EV/EBITDA for 2019E/20E at respectively 6.6x and 5.6x to our estimates of
Group EBITDA (€19.9mln in 2019E and €21.5mln in 2020E).
Multiples Equity Value: €69mln
We derive an Enterprise Value in the range of €130mln-€120mln. We subtract the Net
Debt of €44.3mln (end of 2018) and obtain an average Equity Value of about €81mln,
to which we apply a 15% liquidity/AIM discount and we land to an Equity Value of
€68.5mln.
Table 11: Market multiples Valuation (€mln)
2019E 2020E
Peers' average EV/EBITDA 6.5x 5.6x
Neodecortech EBITDA (€mln) 19.9 21.5
Neodecortech potential EV (€mln) 130 120
Current net debt (€mln) 44.3 44.3
Neodecortech potential Equity Value (€mln) 85.4 75.7
liquidity/AIM discount 15%
Neodecortech potential Equity Value post discount (€mln)
Number of shares
Neodecortech potential price (€)
68.5
13.1
5.2
Relative Valuation on market multiples
Source: Banca Profilo estimates and elaborations, Factset
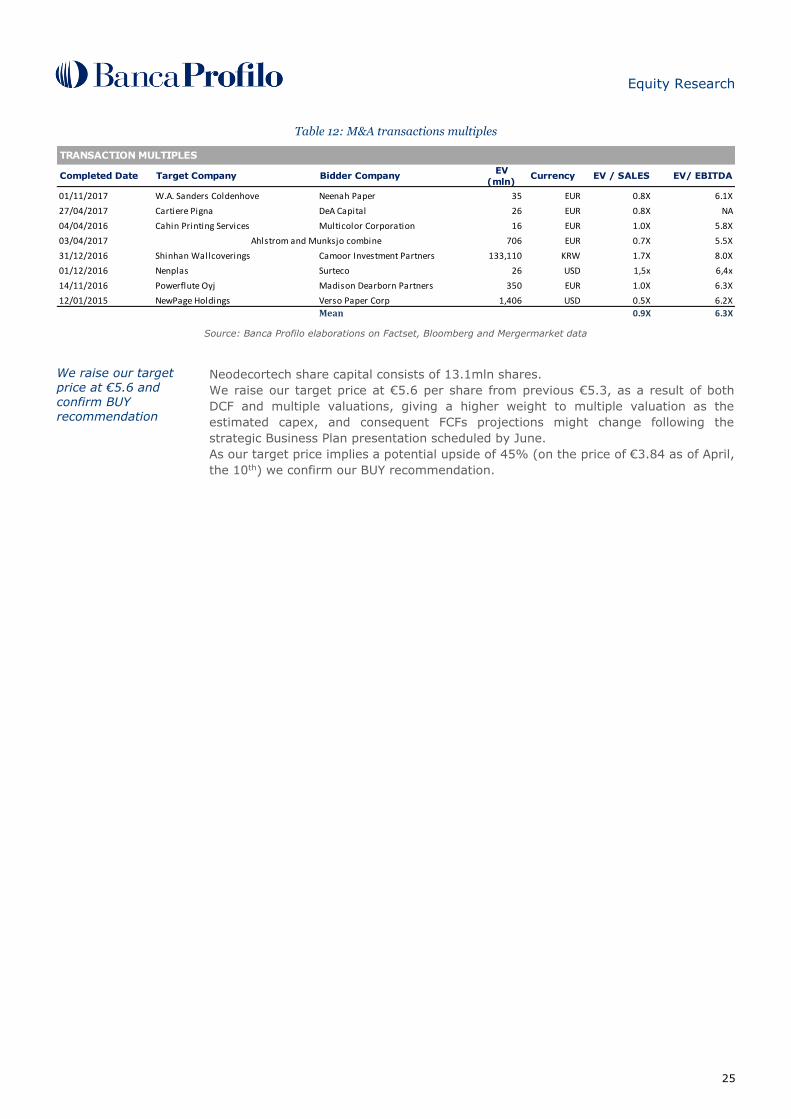
Mean EV/EBITDA from M&A transactions
In addition, we show the multiples at which recent deals have been closed. The mean
EV/EBITDA of 6.3x is just above the average 2019-2020 market multiples.
Equity Research
25
Table 12: M&A transactions multiples
TRANSACTION MULTIPLES
Completed Date Target Company Bidder CompanyEV
(mln)Currency EV / SALES EV/ EBITDA
01/11/2017 W.A. Sanders Coldenhove Neenah Paper 35 EUR 0.8X 6.1X
27/04/2017 Cartiere Pigna DeA Capital 26 EUR 0.8X NA
04/04/2016 Cahin Printing Services Multicolor Corporation 16 EUR 1.0X 5.8X
03/04/2017 706 EUR 0.7X 5.5X
31/12/2016 Shinhan Wallcoverings Camoor Investment Partners 133,110 KRW 1.7X 8.0X
01/12/2016 Nenplas Surteco 26 USD 1,5x 6,4x
14/11/2016 Powerflute Oyj Madison Dearborn Partners 350 EUR 1.0X 6.3X
12/01/2015 NewPage Holdings Verso Paper Corp 1,406 USD 0.5X 6.2X
Mean 0.9X 6.3X
Ahlstrom and Munksjo combine
Source: Banca Profilo elaborations on Factset, Bloomberg and Mergermarket data
We raise our target price at €5.6 and confirm BUY recommendation
Neodecortech share capital consists of 13.1mln shares.
We raise our target price at €5.6 per share from previous €5.3, as a result of both
DCF and multiple valuations, giving a higher weight to multiple valuation as the
estimated capex, and consequent FCFs projections might change following the
strategic Business Plan presentation scheduled by June.
As our target price implies a potential upside of 45% (on the price of €3.84 as of April,
the 10th) we confirm our BUY recommendation.
Equity Research
26
THIS PAGE HAS BEEN INTENTIONALLY LEFT BLANK
Equity Research
27
n Quite fully integrated business model and Group structure n Limited reference market size
n Capital intensive structure with high reconstruction value of proprietary plants n Limited self financing ability
n High margins and strong cash generator
n Product and geographic diversification
n Experienced management team
n Leading market positioning in high-end products of the international
interior design industry
n
n Less exposure to the cycle given high diversification of offering
n Not-fully used production capacity
n High entry barriers in the reference market n Competition from ceramic tiles manufacturer
n Strengthening higher margin specialty products through ad-hoc partnerships n China décor paper producers improving quality, replicating
n Geographical expansion through ad-hoc international partnerships and/or bolt designs and European products
on acquisitions n Escalation of strategic raw materials price increase
n The business is sensitive to the economic cycle,
M&A deals boost growth through new geographies and new market niches
M&A deals to let synergies from the integrated business model and product mix fully arise
Technology upgrade through the new digital machine
Competition from Chinese players and ceramic tiles manufacturer
Less than expected return on the digital machine investment
Less than estimated reference market growth in the next three years
Accelerating increase in raw materials prices not fully (not as quick as expected) transferred to customers
Neodecortech
"ID Card"
Recommendation Target Price Upside
BUY 5.6 € 45%
Opportunities Threats
Company Overview
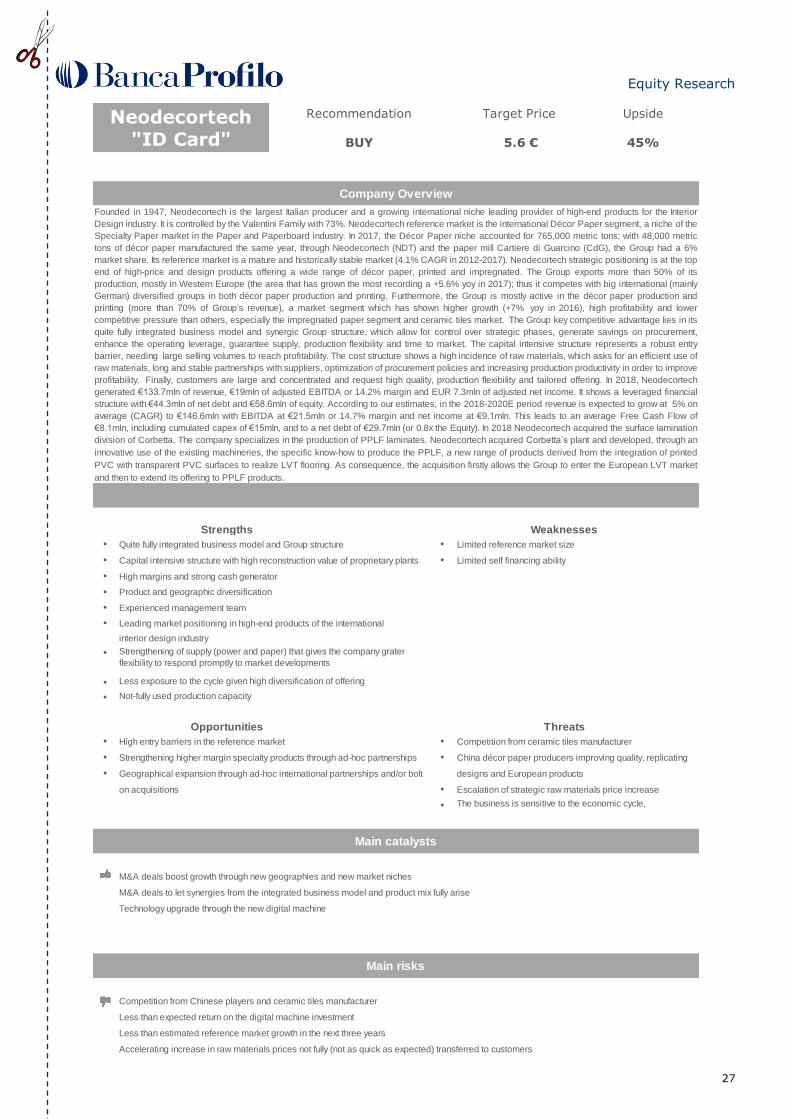
Founded in 1947, Neodecortech is the largest Italian producer and a growing international niche leading provider of high-end products for the Interior
Design industry. It is controlled by the Valentini Family with 73%. Neodecortech reference market is the international Décor Paper segment, a niche of the
Specialty Paper market in the Paper and Paperboard industry. In 2017, the Décor Paper niche accounted for 765,000 metric tons; with 48,000 metric
tons of décor paper manufactured the same year, through Neodecortech (NDT) and the paper mill Cartiere di Guarcino (CdG), the Group had a 6%
market share. Its reference market is a mature and historically stable market (4.1% CAGR in 2012-2017). Neodecortech strategic positioning is at the top
end of high-price and design products offering a wide range of décor paper, printed and impregnated. The Group exports more than 50% of its
production, mostly in Western Europe (the area that has grown the most recording a +5.6% yoy in 2017); thus it competes with big international (mainly
German) diversified groups in both décor paper production and printing. Furthermore, the Group is mostly active in the décor paper production and
printing (more than 70% of Group's revenue), a market segment which has shown higher growth (+7% yoy in 2016), high profitability and lower
competitive pressure than others, especially the impregnated paper segment and ceramic tiles market. The Group key competitive advantage lies in its
quite fully integrated business model and synergic Group structure, which allow for control over strategic phases, generate savings on procurement,
enhance the operating leverage, guarantee supply, production flexibility and time to market. The capital intensive structure represents a robust entry
barrier, needing large selling volumes to reach profitability. The cost structure shows a high incidence of raw materials, which asks for an efficient use of
raw materials, long and stable partnerships with suppliers, optimization of procurement policies and increasing production productivity in order to improve
profitability. Finally, customers are large and concentrated and request high quality, production flexibility and tailored offering. In 2018, Neodecortech
generated €133.7mln of revenue, €19mln of adjusted EBITDA or 14.2% margin and EUR 7.3mln of adjusted net income. It shows a leveraged financial
structure with €44.3mln of net debt and €58.6mln of equity. According to our estimates, in the 2018-2020E period revenue is expected to grow at 5% on
average (CAGR) to €146.6mln with EBITDA at €21.5mln or 14.7% margin and net income at €9.1mln. This leads to an average Free Cash Flow of
€8.1mln, including cumulated capex of €15mln, and to a net debt of €29.7mln (or 0.8x the Equity). In 2018 Neodecortech acquired the surface lamination
division of Corbetta. The company specializes in the production of PPLF laminates. Neodecortech acquired Corbetta’s plant and developed, through an
innovative use of the existing machineries, the specific know-how to produce the PPLF, a new range of products derived from the integration of printed
PVC with transparent PVC surfaces to realize LVT flooring. As consequence, the acquisition firstly allows the Group to enter the European LVT market
and then to extend its offering to PPLF products.
Main catalysts
Main risks
Strengths Weaknesses
Strengthening of supply (power and paper) that gives the company grater
flexibility to respond promptly to market developments
Equity Research
28
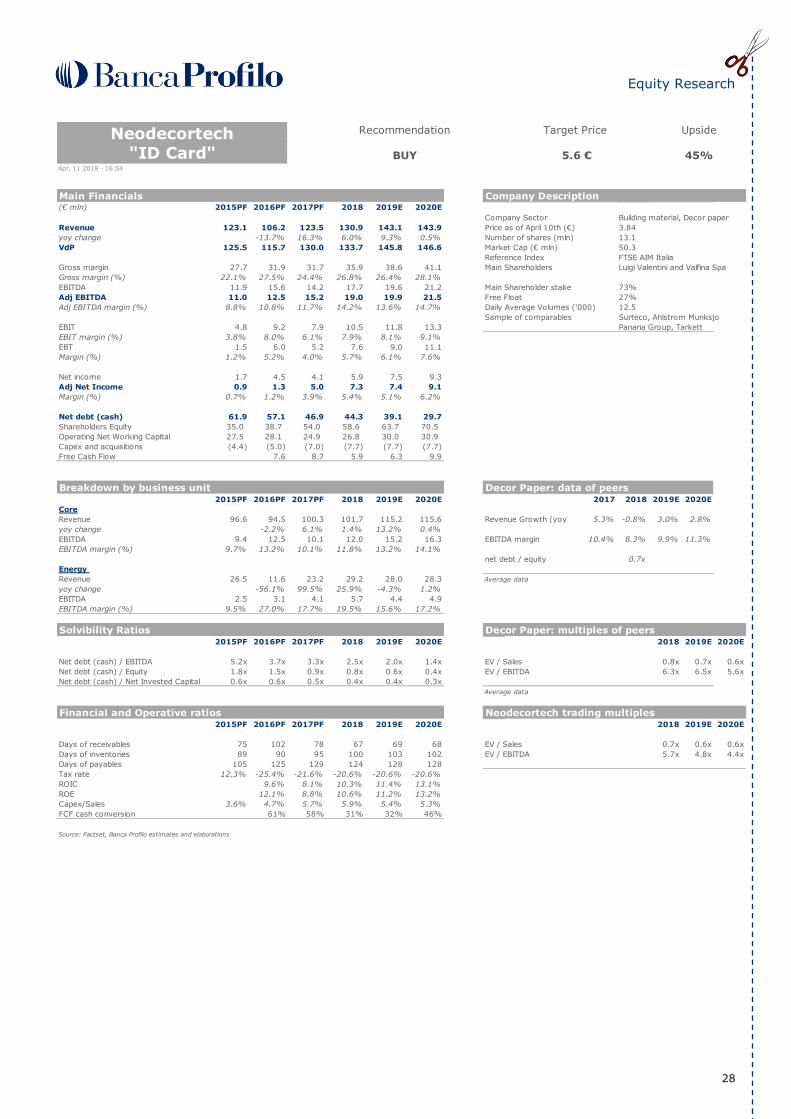
Main Financials Company Description(€ mln) 2015PF 2016PF 2017PF 2018 2019E 2020E
Company Sector Building material, Decor paper
Revenue 123.1 106.2 123.5 130.9 143.1 143.9 Price as of April 10th (€) 3.84
yoy change -13.7% 16.3% 6.0% 9.3% 0.5% Number of shares (mln) 13.1
VdP 125.5 115.7 130.0 133.7 145.8 146.6 Market Cap (€ mln) 50.3
Reference Index FTSE AIM Italia
Gross margin 27.7 31.9 31.7 35.9 38.6 41.1 Main Shareholders Luigi Valentini and Valfina Spa
Gross margin (%) 22.1% 27.5% 24.4% 26.8% 26.4% 28.1%
EBITDA 11.9 15.6 14.2 17.7 19.6 21.2 Main Shareholder stake 73%
Adj EBITDA 11.0 12.5 15.2 19.0 19.9 21.5 Free Float 27%
Adj EBITDA margin (%) 8.8% 10.8% 11.7% 14.2% 13.6% 14.7% Daily Average Volumes ('000) 12.5
Sample of comparables Surteco, Ahlstrom Munksjo
EBIT 4.8 9.2 7.9 10.5 11.8 13.3 Panaria Group, Tarkett
EBIT margin (%) 3.8% 8.0% 6.1% 7.9% 8.1% 9.1%
EBT 1.5 6.0 5.2 7.6 9.0 11.1
Margin (%) 1.2% 5.2% 4.0% 5.7% 6.1% 7.6%
Net income 1.7 4.5 4.1 5.9 7.5 9.3
Adj Net Income 0.9 1.3 5.0 7.3 7.4 9.1
Margin (%) 0.7% 1.2% 3.9% 5.4% 5.1% 6.2%
Net debt (cash) 61.9 57.1 46.9 44.3 39.1 29.7
Shareholders Equity 35.0 38.7 54.0 58.6 63.7 70.5
Operating Net Working Capital 27.5 28.1 24.9 26.8 30.0 30.9
Capex and acquisitions (4.4) (5.0) (7.0) (7.7) (7.7) (7.7)
Free Cash Flow 7.6 8.7 5.9 6.3 9.9
Breakdown by business unit Decor Paper: data of peers2015PF 2016PF 2017PF 2018 2019E 2020E 2017 2018 2019E 2020E
Core
Revenue 96.6 94.5 100.3 101.7 115.2 115.6 Revenue Growth (yoy) 5.3% -0.8% 3.0% 2.8%
yoy change -2.2% 6.1% 1.4% 13.2% 0.4%
EBITDA 9.4 12.5 10.1 12.0 15.2 16.3 EBITDA margin 10.4% 8.3% 9.9% 11.3%
EBITDA margin (%) 9.7% 13.2% 10.1% 11.8% 13.2% 14.1%
net debt / equity 0.7x
Energy
Revenue 26.5 11.6 23.2 29.2 28.0 28.3 Average data
yoy change -56.1% 99.5% 25.9% -4.3% 1.2%
EBITDA 2.5 3.1 4.1 5.7 4.4 4.9
EBITDA margin (%) 9.5% 27.0% 17.7% 19.5% 15.6% 17.2%
Solvibility Ratios Decor Paper: multiples of peers2015PF 2016PF 2017PF 2018 2019E 2020E 2018 2019E 2020E
Net debt (cash) / EBITDA 5.2x 3.7x 3.3x 2.5x 2.0x 1.4x EV / Sales 0.8x 0.7x 0.6x
Net debt (cash) / Equity 1.8x 1.5x 0.9x 0.8x 0.6x 0.4x EV / EBITDA 6.3x 6.5x 5.6x
Net debt (cash) / Net Invested Capital 0.6x 0.6x 0.5x 0.4x 0.4x 0.3x
Average data
Financial and Operative ratios Neodecortech trading multiples2015PF 2016PF 2017PF 2018 2019E 2020E 2018 2019E 2020E
Days of receivables 75 102 78 67 69 68 EV / Sales 0.7x 0.6x 0.6x
Days of inventories 89 90 95 100 103 102 EV / EBITDA 5.7x 4.8x 4.4x
Days of payables 105 125 129 124 128 128
Tax rate 12.3% -25.4% -21.6% -20.6% -20.6% -20.6%
ROIC 9.6% 8.1% 10.3% 11.4% 13.1%
ROE 12.1% 8.8% 10.6% 11.2% 13.2%
Capex/Sales 3.6% 4.7% 5.7% 5.9% 5.4% 5.3%
FCF cash conversion 61% 58% 31% 32% 46%
Source: Factset, Banca Profilo estimates and elaborations
Apr, 11 2019 - 16:54
Neodecortech
"ID Card"
Recommendation Target Price Upside
BUY 5.6 € 45%
Equity Research
29
DISCLAIMER
ANALYST’S AND BANK’S INFORMATION
THIS DOCUMENT CONCERNING NEODECORTECH S.P.A, (THE “ISSUER” OR THE “COMPANY”) HAS BEEN DRAFTED BY FRANCESCA SABATINI WHO IS EMPLOYED BY
BANCA PROFILO S.P.A. (“THE BANK”) AS FINANCIAL ANALYST; FRANCESCA SABATINI IS RESPONSIBLE FOR THE DRAFTING OF THE DOCUMENT.
BANCA PROFILO S.P.A. IS A BANK AUTHORISED TO PERFORM BANKING AND INVESTMENT SERVICES; IT IS PART OF BANCA PROFILO BANKING GROUP (THE “GROUP”) AND IT IS SUBJECT TO THE MANAGEMENT AND CO-ORDINATION OF AREPO BP S.P.A. (THE “PARENT COMPANY”). SATOR PRIVATE EQUITY FUND “A” LP
(THE “PARENT ENTITY”) HOLDS INDIRECT CONTROL PARTICIPATION INTERESTS IN BANCA PROFILO.
THE BANK IS REGISTERED WITH THE ITALIAN BANKING ASSOCIATION CODE NO. 3025 AND IS SUBJECT TO THE REGULATION AND SURVEILLANCE OF THE BANK OF
ITALY AND OF CONSOB (COMMISSIONE NAZIONALE PER LE SOCIETÀ E LE BORSA). THE BANK HAS PREPARED THIS DOCUMENT FOR ITS PROFESSIONAL CLIENTS ONLY, PURSUANT TO DIRECTIVE 2004/39/EC AND ANNEX 3 OF THE CONSOB REGULATION ON INTERMEDIARIES (RESOLUTION N. 16190). THIS DOCUMENT IS BEING
DISTRIBUTED AS OF [NOVEMBER, 23RD, 17:48].
THE ANALYST FRANCESCA SABATINI WHO HAS DRAFTED THIS DOCUMENT HAS SIGNIFICANT EXPERIENCE IN BANCA PROFILO S.P.A. AND OTHER INVESTMENT
COMPANIES. THE ANALYST AND ITS RELATIVES DO NOT OWN FINANCIAL INSTRUMENTS ISSUED BY THE ISSUER AND SHE DOES NOT ACT AS SENIOR MANAGER, DIRECTOR OR ADVISOR FOR THE ISSUER. THE ANALYST DOES NOT RECEIVE BONUSES, INCOME OR ANY OTHER REMUNERATION CORRELATING, DIRECTLY OR
INDIRECTLY, TO THE SUCCESS OF THE INVESTMENT BANKING OPERATIONS OF BANCA PROFILO S.P.A.
A REDACTED VERSION OF THIS REPORT HAS BEEN DISCLOSED TO THE ISSUER TO PERMIT TO IT TO REVIEW AND COMMENT ON FACTUAL INFORMATION RELATING
TO THE ISSUER AND THIS REPORT HAS BEEN AMENDED FOLLOWING SUCH DISCLOSURE PRIOR TO ITS FINAL DISSEMINATION.
THIS DOCUMENT IS BASED UPON INFORMATION THAT WE CONSIDER RELIABLE, BUT THE BANK HAS NOT INDEPENDENTLY VERIFIED THE CONTENTS HEREOF. THE
OPINIONS, ESTIMATES AND PROJECTIONS EXPRESSED IN IT ARE AS OF THE DATE HEREOF AND ARE SUBJECT TO CHANGE WITHOUT NOTICE TO THE RECIPIENT.
PAST PERFOMANCE IS NOT GUARANTEE OF FUTURE RESULTS.
THIS REPORT HAS BEEN PREPARED BY ITS AUTHORS INDEPENDENTLY OF THE COMPANY AND ITS SHAREHOLDERS, SUBSIDIARIES AND AFFILIATES. THE BANK HAS
NO AUTHORITY WHATSOEVER TO GIVE ANY INFORMATION OR MAKE ANY REPRESENTATION OR WARRANTY ON BEHALF OF THE COMPANY, ANY OTHER PERSON IN
CONNECTION THEREWITH. IN PARTICULAR, THE OPINIONS, ESTIMATES AND PROJECTIONS EXPRESSED IN IT ARE ENTIRELY THOSE OF THE AUTHOR HEREOF.
NO REPRESENTATION OR WARRANTY, EXPRESS OR IMPLIED, IS MADE AS TO AND NO RELIANCE SHOULD BE PLACED ON THE FAIRNESS, ACCURACY, COMPLETENESS
OR REASONABLENESS OF THE INFORMATION, OPINIONS AND PROJECTIONS CONTAINED IN THIS DOCUMENT, AND NONE OF THE BANK, THE COMPANY, NOR ANY
OTHER PERSON ACCEPTS ANY LIABILITY WHATSOEVER FOR ANY LOSS HOWSOEVER ARISING FROM ANY USE OF THIS DOCUMENT OR ITS CONTENTS OR OTHERWISE
ARISING IN CONNECTION THEREWITH.
NO DUPLICATION
NO PART OF THE CONTENT OF THE DOCUMENT MAY BE COPIED, FORWARDED OR DUPLICATED IN ANY FORM OR BY ANY MEANS WITHOUT THE PRIOR CONSENT OF
THE BANK. BY ACCEPTING THIS REPORT, YOU AGREE TO BE BOUND BY THE FOREGOING LIMITATIONS.
NO OFFER OR SOLICITAION
THIS DOCUMENT DOES NOT CONSTITUTE AN OFFER OR INVITATION OR FORM PART OF AN OFFER, SOLICITATION OR INVITATION TO PURCHASE ANY SECURITIES,
AND NEITHER THIS DOCUMENT NOR ANYTHING CONTAINED HEREIN SHALL FORM THE BASIS OF ANY CONTRACT OR COMMITMENT WHATSOEVER.
RECIPIENTS
THIS DOCUMENT IS GIVEN TO YOU SOLELY FOR YOUR INFORMATION ON A CONFIDENTIAL BASIS AND MAY NOT BE REPRODUCED OR REDISTRIBUTED, IN WHOLE OR IN PART, TO ANY OTHER PERSON. IN PARTICULAR, NEITHER THIS DOCUMENT NOR ANY COPY HEREOF MAY BE TAKEN OR TRANSMITTED IN OR INTO THE UNITED
STATES (THE “U.S.”), AUSTRALIA, CANADA OR JAPAN OR REDISTRIBUTED, DIRECTLY OR INDIRECTLY, IN THE U.S., AUSTRALIA, CANADA OR JAPAN. ANY FAILURE TO
COMPLY WITH THIS RESTRICTION MAY CONSTITUTE A VIOLATION OF U.S., AUSTRALIAN, CANADIAN OR JAPANESE SECURITIES LAWS.
THIS DOCUMENT IS BEING DISTRIBUTED ONLY TO, AND IS DIRECTED ONLY AT, PERSONS WHO ARE QUALIFIED INVESTORS WITHIN THE MEANING OF ARTICLE 2(1)
(E) OF THE PROSPECTUS DIRECTIVE (DIRECTIVE 2003/71/EC) (ALL SUCH PERSONS BEING REFERRED TO AS “RELEVANT PERSONS”). THIS DOCUMENT MUST NOT BE ACTED ON OR RELIED ON BY PERSONS WHO ARE NOT RELEVANT PERSONS. ANY INVESTMENT OR INVESTMENT ACTIVITY TO WHICH THIS COMMUNICATION RELATES
IS AVAILABLE ONLY TO RELEVANT PERSONS AND WILL BE ENGAGED IN ONLY WITH RELEVANT PERSONS.
IN CASE THAT THIS DOCUMENT IS DISTRIBUTED IN ITALY IT SHALL BE DIRECTED ONLY AT QUALIFIED INVESTORS WITHIN THE MEANING OF ARTICLE 100(1) (A) OF
LEGISLATIVE DECREE NO. 58 OF FEBRUARY 24, 1998, AS AMENDED, AND ARTICLE 34-TER, PARA. 1, LETT B), OF CONSOB REGULATION NO. 11971 OF 1999, AS AMENDED. THIS DOCUMENT IS NOT ADDRESSED TO ANY MEMBER OF THE GENERAL PUBLIC IN ITALY. IN NO CIRCUMSTANCES SHOULD THIS DOCUMENT CIRCULATE
AMONG OR BE DISTRIBUTED TO (I) A MEMBER OF THE GENERAL PUBLIC, (II) INDIVIDUALS OR ENTITIES FALLING OUTSIDE THE DEFINITION OF “QUALIFIED
INVESTORS” AS SPECIFIED ABOVE OR (III) TO DISTRIBUTION CHANNELS THROUGH WHICH INFORMATION IS OR IS LIKELY TO BECOME AVAILABLE TO A LARGE
NUMBER OF PERSONS.
THE DISTRIBUTION OF THIS DOCUMENT IN OTHER JURISDICTIONS MAY BE RESTRICTED BY LAW AND PERSONS INTO WHOSE POSSESSION THIS DOCUMENT COMES
SHOULD INFORM THEMSELVES ABOUT, AND OBSERVE, ANY SUCH RESTRICTION. ANY FAILURE TO COMPLY WITH THESE RESTRICTIONS MAY CONSTITUTE A
VIOLATION OF THE LAWS OF ANY SUCH OTHER JURISDICTION.
CONFLICTS OF INTEREST
THE BANK MAY, FROM TIME TO TIME, DEAL IN, HOLD OR ACT AS MARKET MAKER OR ADVISER, BROKER OR BANKER IN RELATION TO THE FINANCIAL INSTRUMENTS, OR DERIVATIVES THEREOF, OF PERSONS, FIRMS OR ENTITIES MENTIONED IN THIS DOCUMENT, OR BE REPRESENTED IN THE GOVERNING BODIES OF THE
COMPANY. IN FACT, THE BANK HAS ACTED AS GLOBAL COORDINATOR IN THE IPO OF THE ISSUER, THE BANK IS PRESENTLY CORPORATE BROKER, LIQUIDITY
PROVIDER AND SPECIALIST OF THE ISSUER.
BANCA PROFILO S.P.A. HAS ADOPTED INTERNAL PROCEDURES FOR THE PREVENTION AND AVOIDANCE OF CONFLICTS OF INTEREST WITH RESPECT TO THE RECOMMENDATIONS, WHICH CAN BE CONSULTED ON THE RELEVANT SECTION OF ITS WEBSITE (WWW.BANCAPROFILO.IT, IN THE SECTION “CLIENTI AZIENDALI E
ISTITUZIONALI/ANALISI E RICERCA).
EQUITY RESEARCH PUBLICATIONS IN LAST 12M
THE BANK PUBLISHES ON ITS WEBSITE WWW.BANCAPROFILO.IT, ON A QUARTERLY BASIS, THE PROPORTION OF ALL RECOMMENDATIONS THAT ARE ‘BUY’, ‘HOLD’,
‘SELL’ OR EQUIVALENT TERMS OVER THE PREVIOUS 12 MONTHS, AND THE PROPORTION OF ISSUERS CORRESPONDING TO EACH OF THOSE CATEGORIES TO WHICH SUCH PERSON HAS SUPPLIED MATERIAL SERVICES OF INVESTMENT FIRMS SET OUT IN SECTIONS A AND B OF ANNEX I TO DIRECTIVE 2014/65/EU OVER THE
PREVIOUS 12 MONTHS.
ADDITIONAL INFORMATION
THE BANK PROVIDES ALL OTHER ADDITIONAL INFORMATION, ACCORDING TO ARTICLE 114, PARAGRAPH 8 OF LEGISLATIVE DECREE 58/98 (“FINANCIAL DECREE”) AND COMMISSION DELEGATED REGULATION (EU) 2016/958 AS OF 9 MARCH 2016 (THE “COMMISSION REGULATION”) ON THE RELEVANT SECTION OF ITS WEBSITE
(WWW.BANCAPROFILO.IT, IN THE SECTION “CLIENTI AZIENDALI E ISTITUZIONALI/ANALISI E RICERCA”).