Embed Size (px)
Citation preview

FY’12 RESULTSConference Call

HIGHLIGHTS

3
MAIN TOPICS
Boosting revenues of tests based on CLIA technology ex Vitamin D (+14% in FY’12 and +19% in Q4’12)
Worldwide success attributed to the LIAISON XL from customers: •LIAISONXLplacementsinkeycountries: •+477in2012 •+125inQ4’12 •setthebasisforapositiveeffectonthefuturerevenuesderivedfromreagentssales
Expansion of the immunoassay menu: •10 new products developed and launched in 2012 •targetof100 tests availableon CLIAtechnologyexceeded •DiaSorinleaderinproductofferingsintheclinicalareasinwhichitoperates
Strengthening of Murexlinepositionthrough: •remarkablecontracts(e.g.5-yearcontractwithoneofthemostimportantbloodbanksintheworld,
basedinTaiwan) •Placementofmorethan40EvolyzersinLatAm,TurkeyandTaiwan •Growthof20%inChina
Acquisition ofNorDiagGroup’sbusiness lineandapproach to the Molecular Diagnosticswith thelaunch of:
•Liaison IXT(nucleicacidextraction) •Liaison IAM(amplificationanddetection) • first 2 products(fieldofInfectiousDiseases)
Establishment of a Joint Venture (51%)withTrivitronHealthcareto enter the Indian market
Positive NFP •€ 92.2 million,beforethepaymentofthespecialdividendof€0.83,equalto€45.1million •€47.2millionafterthepayment,still€5.5millionmorethanNFPinFY’11
Ordinary dividend proposal: € 0.50 per share (vs. € 0.44 in FY’11) •Div Yield(onlyincludingordinarydividend):2.1% •Div Yield(includingordinaryandspecialdividend):5.6%

4
@ CER
FY’12 REVENUES
Q4’12vs.
Q4’11
+0.8%
-0.6%
@ current
FY’12vs.
FY’11
-4.1%
-1.4%
FY’12SALES
Vitamin D pricing pressure, offsetting growth from
other CLIA products in FY’12
Q4’12 results showing a positive change in trend
of sales (+0.8%)
Difficult macro-economic environment
CLIA ex Vitamin D sales up +14%in FY’12 and +19% in Q4’12
5
REVENUES: BREAKDOWN BY TECHNOLOGY
Q4’12 vs. Q4’11
+19.1%
-13.5%
+40.5%
FY’12 vs. FY’11
+13.7%
-13.8%
+19.6%
CLIA ex VIT D
VIT D
INSTRUMENTS
Negative effect mainly due to pricing pressure, especially in the US
Growth mainly driven by LIAISON XL
Positive effect on future revenues derived from the sale of the reagents used on instruments
CLIA ex Vit D revenues surpassing VIT D Sales in absolute value
Boosting growth in Q4’12
Double-digit growth confirmed in FY’12

6
Vit D
CLIA ex Vit D
REVENUES: BREAKDOWN BY GEOGRAPHY (1 OF 2)
Q4’12 vs. Q4’11
+6.7%
FY’12 vs. FY’11
+1.2%
-19.8% -18.6%
Q4’12 vs. Q4’11
+8.6%
-2.1%
+4.9%
FY’12 vs. FY’11
+5.7%
-8.5%
+0.1%
-23.7%
+33.5%
-20.9%
+29.2%
Germany
France
Italy
Strong and steady growth
CLIA ex Vit D up in FY’12 and in Q4’12, offset by
Vitamin D price pressure
Strong performance, notwithstanding a weak market
Mainly driven by pricing pressure
Steady and sustained growth, with sales exceeding
$10 million in 2012
Managerial outlook on data reported (revenues including Murex)
Europe
Menu expansion
North America
7
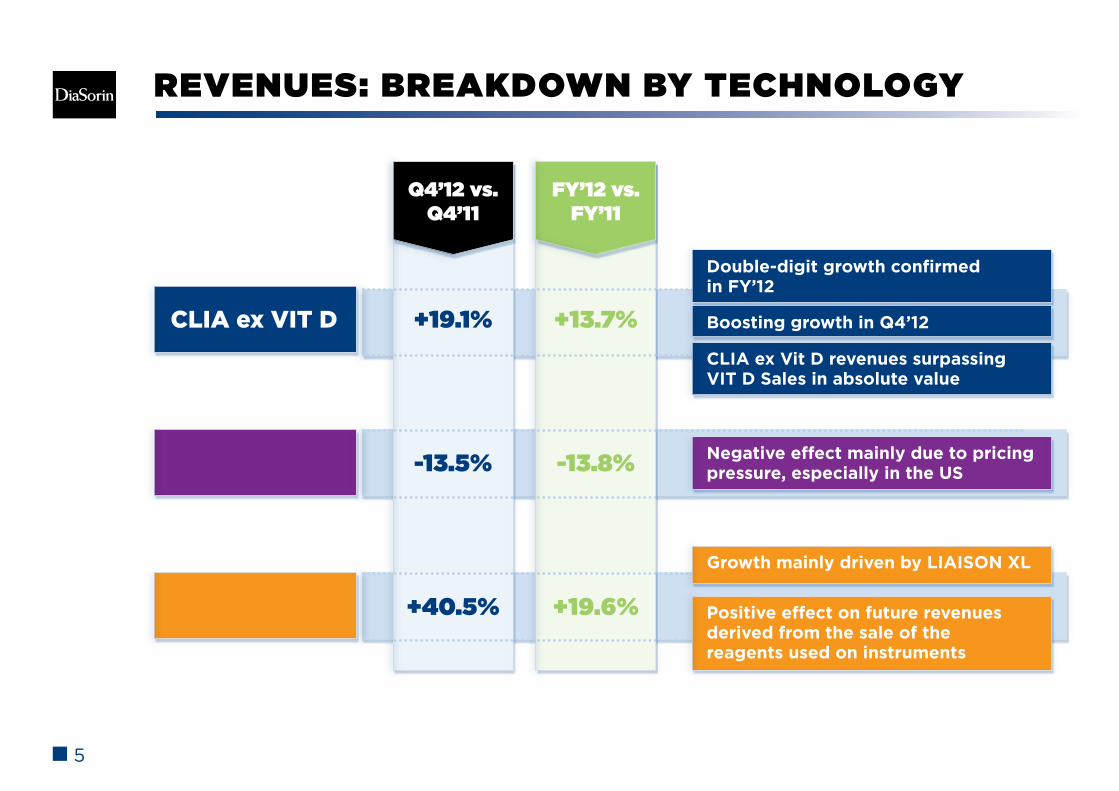
REVENUES: BREAKDOWN BY GEOGRAPHY (2 OF 2)
Brazil
Mexico
Q4’12 vs. Q4’11
+27.0%
FY’12 vs. FY’11
+19.1%
-4.0% -5.0%
Apac
Q4’12 vs. Q4’11
+29.0%
-11.7%
FY’12 vs. FY’11
+26.0%
-33.8%
-13.8%
+12.4%
-3.6%
+7.3%
China
Australia
Steady and impressive growth across all menu
LIAISON XL successful launch in Dec 2012
CLIA ex Vit D business developed from scratch,
with sales consistently up
Strong recovery of Vit D, after H2’11 hit
After good 9M growth, Q4 hit by strikes of Regulatory
Body (ANVISA)
Approval of LIAISON XL, with launch in Q1’13
LatAm
Good performance across all the menu
Managerial outlook on data reported (revenues including Murex)

8
INSTALLED BASE ENLARGEMENT
Total unitsat Dec 31, 2011
New unitsin 2012
Total unitsat Dec 31, 2012
4,078 + 57 4,135
4,206 + 534 4,740TOTAL
128 + 477 605
New unitsQ4'12
+ 10
+ 135
+ 125

9
PROFITABILITY PROFILE
Q4’12
36.0%
FY’12
39.7%
Q4’11
40.7%
FY’11
43.2%
- 350 bps
EBITDA margin
GROUP MARGINALTY DRIVEN BY:
Progressive build-up of the organization supporting the launch of the new Molecular Diagnostics business, particularly in Q4’12
Managerial outlook on data reported (@ constant scope of consolidation, excluding NorDiag business)
Reagents ex Vitamin D confirming the 2011 steady and high margin levels
Vitamin D pricing pressure affecting negatively reagents marginality as predicted
High instruments sales, mainly driven by LIAISON XL launch, with a different mix effect, particularly in Q4’12
~ 100 bps
~ 250 bps
-

10
BUSINESS DEVELOPMENT

11
BUSINESS DEVELOPMENTClinical Area
Imm
uno
dia
gno
stic
s
# test Test Instruments family
Infectious Diseases
GastrointestinalInfections
Hypertension
Hepatitis and Retrovirus
Bone & Metabolism
4
2
1
2
1
Measles IgMMumps IgM
CMV IgG Avidity(*)
Toxo IgG Avidity(*)
Helicobacter PyloriClostridium Difficile GDH
Aldosterone
HTLV I-IIHepatitis B (*)
Vitamin D 25 OH (*)
(*) products redevelopment
Clinical Area # test Test Instruments family
Infectious Diseases 2 Varicella Zoster
BK Virus
Mo
lecu
lar
dia
gno
stic
s
12
FY’12 FINANCIALS
13
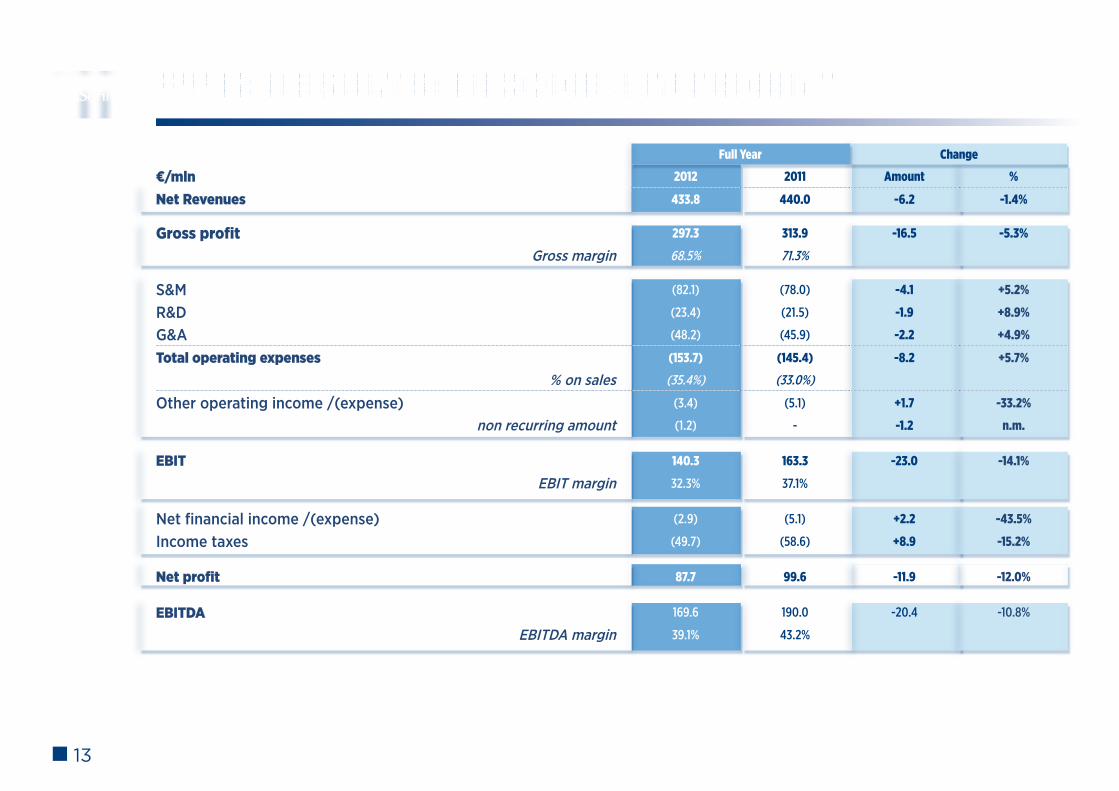
FY’12 RESULTS: INCOME STATEMENT
Full Year Change
€/mln 2012 2011 Amount %
Net Revenues 433.8 440.0 -6.2 -1.4%
Gross profit 297.3 313.9 -16.5 -5.3%
Gross margin 68.5% 71.3%
S&M (82.1) (78.0) -4.1 +5.2%
R&D (23.4) (21.5) -1.9 +8.9%
G&A (48.2) (45.9) -2.2 +4.9%
Total operating expenses (153.7) (145.4) -8.2 +5.7%
% on sales (35.4%) (33.0%)
Other operating income /(expense) (3.4) (5.1) +1.7 -33.2%
non recurring amount (1.2) - -1.2 n.m. EBIT 140.3 163.3 -23.0 -14.1%
EBIT margin 32.3% 37.1% Net financial income /(expense) (2.9) (5.1) +2.2 -43.5%
Income taxes (49.7) (58.6) +8.9 -15.2% Net profit 87.7 99.6 -11.9 -12.0% EBITDA 169.6 190.0 -20.4 -10.8%
EBITDA margin 39.1% 43.2%

14
FY’12 RESULTS: BALANCE SHEET
€/mln 12/31/2012 12/31/2011
Total intangible assets 125.3 121.9
Total tangible assets 65.3 62.7
Other non-current assets 21.3 20.7
Net Working Capital 137.6 133.9
Other non-current liabilities (28.6) (29.7)
Net Capital Employed 320.9 309.5
Net Financial Position 47.2 41.6
Total Shareholders’ equity 368.1 351.1

15
€/mln 12/31/2012 12/31/2011 Change in value
Cash and cash equivalents at beginning of period 64.1 62.4 +1.7
Operating activities 110.6 108.6 +2.0
Financing activities (32.3) (79.3) +47.0
Investing activities (30.3) (27.5) -2.8
M&A (7.6) - -7.6
Net Change in net cash and cash equivalents 40.5 1.8 +38.7
Cash and cash equivalents at end of period 104.6 64.1 +40.5
FY’12 RESULTS: CASH FLOW STATEMENT
SOLID FINANCIAL STRUCTURENet Financial Position• € 92.2 million,beforethepaymentofthespecialdividendof€0.83,equalto€45.1million• €47.2million,afterthepayment,still€5.5millionmorethanNFPinFY’11
Strong Free Cash Flow generation• € 82.6 millioninFY’12vs.€82.7millioninFY’11

16
Revenues:growthbetween+2%and+4%atCERvs.FY’12revenues;molecularrevenuesrepresenting~€5mln
EBITDA: inlinewiththeabsolutevalueof2012atCER,withanabsorptionfromMolecularbusinessequalto~€6mln,asaresultofinvestmentsrequiredinthe
developmentofthenewbusiness
New systems installed (Liaison + Liaison XL): ~ 500
FY 2013 GUIDANCE

17
ORDINARY DIVIDEND
Ordinary dividend:
Shareholders’Meetingconvenedfor:
Apr22,2013(firstcalling)
Apr24,2013(secondcalling)
tovoteonamotiontodistributeanordinarydividend
AMOUNT: 0.50 euros per share
Total amount: 27,176,628.50 euros,calculatedon54,353,257shares,notcounting
the1,550,000treasurysharesheldbytheCompanyequalto2.77%oftheshare
capitalonthecurrentdate.
ThedividendwillbepayablestartingonMay 23, 2013,withMay 20, 2013 record date.