Embed Size (px)
Citation preview
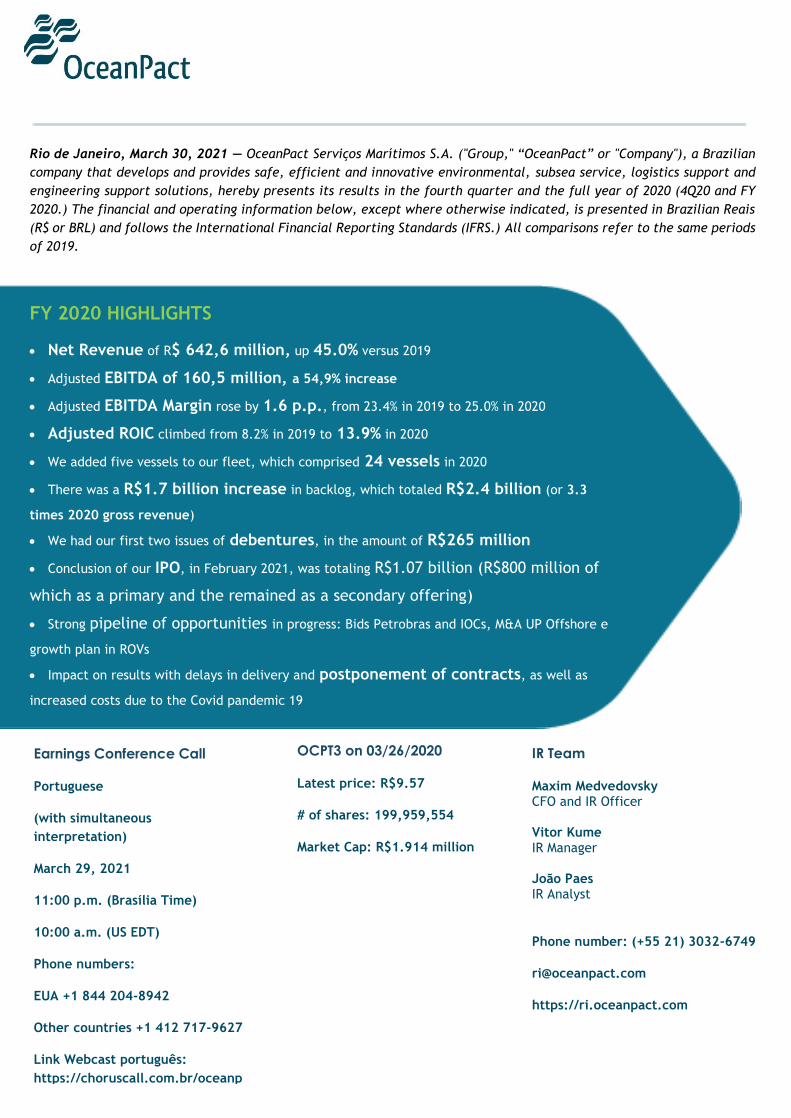
Rio de Janeiro, March 30, 2021 — OceanPact Serviços Marítimos S.A. ("Group," “OceanPact” or "Company"), a Brazilian
company that develops and provides safe, efficient and innovative environmental, subsea service, logistics support and
engineering support solutions, hereby presents its results in the fourth quarter and the full year of 2020 (4Q20 and FY
2020.) The financial and operating information below, except where otherwise indicated, is presented in Brazilian Reais
(R$ or BRL) and follows the International Financial Reporting Standards (IFRS.) All comparisons refer to the same periods
of 2019.
FY 2020 HIGHLIGHTS
• Net Revenue of R$ 642,6 million, up 45.0% versus 2019
• Adjusted EBITDA of 160,5 million, a 54,9% increase
• Adjusted EBITDA Margin rose by 1.6 p.p., from 23.4% in 2019 to 25.0% in 2020
• Adjusted ROIC climbed from 8.2% in 2019 to 13.9% in 2020
• We added five vessels to our fleet, which comprised 24 vessels in 2020
• There was a R$1.7 billion increase in backlog, which totaled R$2.4 billion (or 3.3
times 2020 gross revenue)
• We had our first two issues of debentures, in the amount of R$265 million
• Conclusion of our IPO, in February 2021, was totaling R$1.07 billion (R$800 million of
which as a primary and the remained as a secondary offering)
• Strong pipeline of opportunities in progress: Bids Petrobras and IOCs, M&A UP Offshore e
growth plan in ROVs
• Impact on results with delays in delivery and postponement of contracts, as well as
increased costs due to the Covid pandemic 19
Earnings Conference Call
Portuguese
(with simultaneous
interpretation)
March 29, 2021
11:00 p.m. (Brasília Time)
10:00 a.m. (US EDT)
Phone numbers:
EUA +1 844 204-8942
Other countries +1 412 717-9627
Link Webcast português:
https://choruscall.com.br/oceanp
act/4t20.htm
OCPT3 on 03/26/2020
Latest price: R$9.57
# of shares: 199,959,554
Market Cap: R$1.914 million
IR Team
Maxim Medvedovsky CFO and IR Officer Vitor Kume IR Manager João Paes IR Analyst
Phone number: (+55 21) 3032-6749
https://ri.oceanpact.com
OceanPact – Earnings Release 4Q20 | 2020 - 2
MESSAGE FROM MANAGEMENT
We certainly had many challenges and saw many changes in 2020, a year that really put us to the
test since we had to seek a balance among attributes as diverse as determination, caution,
nimbleness and resilience.
We entered the year with great expectations for the growth of the Subsea line of services due to our
excellent performance in the procurement process for RSVs (ROV Support Vessel, used to provide
support for ROVs (Remotely Operated Vehicles, or underwater robots)) in late 2019. Thus, in addition
to both vessels acquired in 2019, the Abrolhos and the Parcel das Paredes, we added three more
RSVs to our fleet: the Parcel das Timbebas, the Parcel do Bandolim and the Parcel dos Meros,
totaling five RSVs.
We had to make difficult decisions throughout the year. The start of the COVID-19 pandemic, in
March, delayed us in establishing the funding structure for those acquisitions and customizations, and
extending our debt maturity profile. To protect our cash position, we had to make the difficult
decisions not to hire a sixth RSV and not to insource ROV operations. We decided to focus on
structuring the delivery of the five RSVs in a creative and safe manner under the terms of their
respective contracts. It was crucial for our success to negotiate charter contracts for the vessels if it
became infeasible to purchase them, as well as to secure the issue of debentures.
Interestingly, we always turn to our values naturally and spontaneously whenever handling difficult
issues. The first of those values is what we call:
“We can do it” — If it can be done safely, we will do it. We are not afraid of challenges and
spare no effort to do whatever it takes. We are always available and prepared to take swift
action.
Our second value is:
“The right way” — Whatever has to be done, we do it well, in a sustainable and fair manner.
We deliver what we promise and what is agreed upon while respecting people, regulations
and the environment.
That is how we balance our determination and desire to grow with our commitment to do everything
well and as quickly as possible while delivering whatever we agree upon with our clients, partners,
financiers and shareholders. We knew we would have other opportunities to operate our own ROVs
and add new RSVs to our fleet in the future; as a result, we focused on delivering what was possible
and safe at the moment, which would in itself be a very important accomplishment, just as it was.
After we decided to sign contracts both with our clients and with the sellers and charterers of the
vessels, the remaining challenge was to mobilize three foreign and two Brazilian vessels under new
contracts while operating our existing fleet — amid the pandemic.
We were the first to adopt the procedure of testing all crew members after three days in isolation in
individual hotel room and maintaining them in isolation until the test results are received, thus
ensuring isolation for at least seven days before boarding all fleet ships. We have had over 4000 tests
run. All our partners and clients boarding with us have agreed to follow the same protocol, which
remains in force to this day.
Our entire sea and field staff — over 1400 professionals — remained at the forefront to ensure the
continuity of our operations, services and contracts while the entire office staff has been working
from home since March 16, 2020. We have hired doctors and nurses, as well as test, laboratory,
emotional support and clinical support services, for all employees, including their dependents, to
ensure the continuity of business and provide the appropriate support both for crews and for support
teams at our operating sites, thus minimizing people’s exposure to, and the circulation of, the virus.
All suspected or confirmed COVID-19 cases are monitored closely by our crisis room (installed on
March 11, 2020) whereas hospitalizations are monitored by an independent, external medical team.
OceanPact – Earnings Release 4Q20 | 2020 - 3
In addition to this growth in the Subsea line of service, the other activities also achieved significant
results.
During the year, we renewed an important environmental monitoring service agreement with
Petrobras after winning a new bidding process. This contract, which covers all sea basins in Brazil
and had been in force since 2015, has now been renewed for another four years, bringing a backlog
of R$234 million. In addition, we entered into six new agreements with Exxon, Karoon (two
contracts), AET, Petrorio and Trident, two of which for the Martin Vaz and Didi – K OSRVs (Oil Spill
Recovery Vessel), in the amount of R$72 million; one for the Ilha de São Sebastião PSV (Platform
Support Vessel), in the amount of R$76 million; and three Oil Spill service agreements, with a R$82
million backlog.
Our environmental emergency consulting and management line of service also had a busy and
challenging year. While delivering all the environmental assessments related to the licensing process
of all the blocks acquired by Exxon, we handled three major emergencies during the pandemic: a
forest fire, a ship grounding accident and continuing actions related to a dam failure. Having
succeeded in all those activities, we consolidated our leading position both in offshore environmental
licensing and in all types of environmental emergencies.
As a result of all of the above, we achieved our best operating performance ever in 2020. Net revenue
totaled R$642,6 million in 2020, 45.0% up on R$443,2 million in 2019. Adjusted EBITDA rose by 54.9%
to R$160.5 million, with 25.0% margin (up 1.6 pp.)
We also worked to improve our capital structure. We closed the year with a strong cash position of
R$197.3 million due to the two issues of debenture held in September 2020, through which we raised
R$265.0 million (with five-year maturity with a one-year deferment period and earning interest at a
rate of the CDI [Certificado de Depósito Interfinanceiro, or Interbank Deposit Certificate] rate plus
5.5%.) We used about R$108.5 million of those proceeds to extend our current debt maturity profile
and R$156.5 million as CAPEX, to purchase and adapt the new RSVs.
Nothing was easy or commonplace in 2020. Operating expenses increased due to pre-boarding
quarantines, tests, logistics, PPE, overtime, reserve staff, medical and disinfection teams, among
others. In addition, we put off several projects, suspended contracts, but, above all, had major
challenges involving international logistics for receiving parts from other countries and foreign
technicians for the customization and maintenance of our current vessels and new contracts.
Justifiable delays accepted by clients immediately lead to a temporary increase in costs and a
postponement of the contractual performance as a whole. We had those delays and postponements
in some cases.
Some of those postponements/interruptions paved the way for major innovations, as in the
geophysical data collection project for Equinor in the Sergipe Alagoas basin. The project involved
Canadian and Norwegian technicians on board our vessel. When the pandemic was declared, all of
them had to go back to their countries. The project was suspended in March 2020, and there was no
contract for vessel. Since the situation is taking too long to go back to “normal” and we are concerned
about the costly idleness of the vessel and technical teams, we set up a working group led by our
innovation team and OceanPact GEO. Jointly with the Canadian suppliers and the Norwegian clients,
the working group developed a remote control and monitoring system and managed — for the first
time — to operate an AUV (Autonomous Underwater Vehicle), launched from a ship in the Sergipe-
Alagoas basin, as well as validate and approve this procedure. At depth of 2000 m (6562 ft.), the AUV
was controlled by a technician in Canada and monitored by an inspector in Norway from October
2020 to January 2021. We can say our initiative has changed the way deepwater geophysical services
are conducted and monitored.
With some procurement processes and contracts postponed, we moved up the regular docking of our
vessels for classification purposes to 1Q21. As a result, our fleet is prepared for projects to be
resumed sooner, which has already occurred since late March.
OceanPact – Earnings Release 4Q20 | 2020 - 4
In 2020, we focused heavily on preparing the company for a new cycle of growth by upgrading
systems, hiring consulting services and increasing the shared services and operational support
workforce significantly. Hiring staff during the pandemic — to work from home — was obviously one
of the challenges we had in 2020. Even though we hope to be able to return safely to our headquarters
in Glória district — a comfortable, welcoming and beautiful environment that brings people together
— as soon as possible, we currently have over 50 local employees who have never been to our offices.
We have been using all the technological tools available, but we are fully aware they cannot provide
the same experience as sharing the same building, cafeteria or library with everybody else, nor can
they create a sense of camaraderie and integration among co-workers.
Investing in our structure to seize the opportunities for growth that lay ahead of us culminated in our
decision to prepare the company for an IPO.
On February 12, 2021, we joined B3's Novo Mercado special corporate governance segment, which
brings together companies with the highest corporate governance practices. Of the R$1.07 billion
comprising our IPO, we raised R$800 million through the primary offering. We will be using that
amount to expand our business by acquiring vessels and equipment and expanding our specialized
services so we can meet the booming demand for marine support services in Brazil.
The process leading us to the IPO, which involved countless meetings and internal conversations with
directors, consultants, analysts, banks and potential investors, was extremely enriching and inspiring.
It helped us question and validate our capital allocation, decision-making and long-term vision
strategies.
The pandemic also showed us in practice how important it is to assess opportunities carefully since
it plunged us in unusual situations. While we saw negative oil prices at certain points, our clients
pressed us to sign contracts for new high-spec vessels to meet the demands of very high productivity
fields.
We are very happy and optimistic about our current market and the future since we have consolidated
our leading position and gained recognition as leaders in marine environmental matters and
submarine operations. In addition, part of our clients from the oil industry have set ambitious
greenhouse gas emission goals, and the UN has proclaimed the Decade of Ocean Science for
Sustainable Development, to be held from 2021 to 2030. We from OceanPact are part of this
movement, along with our scientists, vessels, oceanographic equipment and innovative projects that
make it easier to collect, manage, examine and share oceanographic data.
We will keep on working to create value for all our stakeholders by helping our clients use the sea,
the coast and marine resources in a sustainable manner. This will, in turn, allow them to make
people's lives better since there is an increasing awareness of how much human activities depend on
the marine environment, due to its role in regulating the climate, producing energy, supplying
protein, enhancing carbon sequestration, serving as a source of leisure or simply inspiring us with its
beauty. We thank our shareholders and directors for their trust, our more than 1,700 employees for
their commitment, and our clients and suppliers for their partnership. Those are the people who
helped us achieve strong results in 2020.
Flavio Nogueira Pinheiro de Andrade
CEO
OceanPact – Earnings Release 4Q20 | 2020 - 5
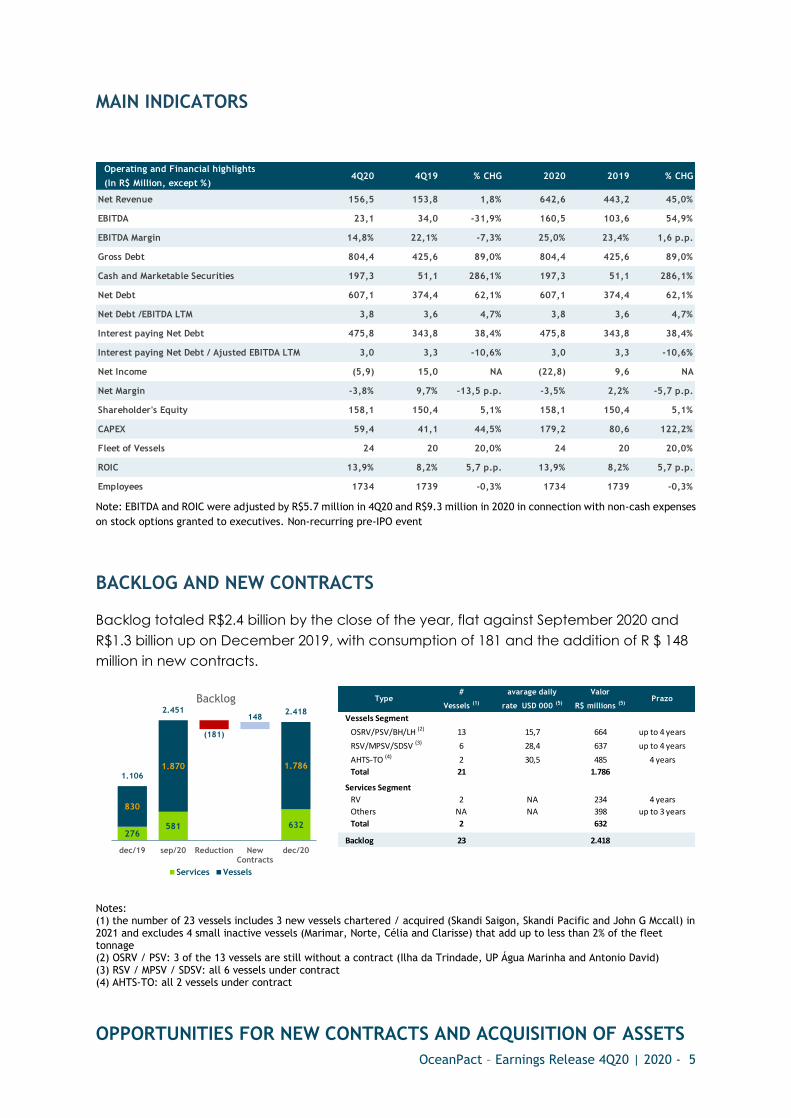
MAIN INDICATORS
Note: EBITDA and ROIC were adjusted by R$5.7 million in 4Q20 and R$9.3 million in 2020 in connection with non-cash expenses
on stock options granted to executives. Non-recurring pre-IPO event
BACKLOG AND NEW CONTRACTS
Backlog totaled R$2.4 billion by the close of the year, flat against September 2020 and
R$1.3 billion up on December 2019, with consumption of 181 and the addition of R $ 148
million in new contracts.
Notes: (1) the number of 23 vessels includes 3 new vessels chartered / acquired (Skandi Saigon, Skandi Pacific and John G Mccall) in 2021 and excludes 4 small inactive vessels (Marimar, Norte, Célia and Clarisse) that add up to less than 2% of the fleet tonnage (2) OSRV / PSV: 3 of the 13 vessels are still without a contract (Ilha da Trindade, UP Água Marinha and Antonio David) (3) RSV / MPSV / SDSV: all 6 vessels under contract (4) AHTS-TO: all 2 vessels under contract
OPPORTUNITIES FOR NEW CONTRACTS AND ACQUISITION OF ASSETS
Operating and Financial highlights
(In R$ Million, except %)4Q20 4Q19 % CHG 2020 2019 % CHG
Net Revenue 156,5 153,8 1,8% 642,6 443,2 45,0%
EBITDA 23,1 34,0 -31,9% 160,5 103,6 54,9%
EBITDA Margin 14,8% 22,1% -7,3% 25,0% 23,4% 1,6 p.p.
Gross Debt 804,4 425,6 89,0% 804,4 425,6 89,0%
Cash and Marketable Securities 197,3 51,1 286,1% 197,3 51,1 286,1%
Net Debt 607,1 374,4 62,1% 607,1 374,4 62,1%
Net Debt /EBITDA LTM 3,8 3,6 4,7% 3,8 3,6 4,7%
Interest paying Net Debt 475,8 343,8 38,4% 475,8 343,8 38,4%
Interest paying Net Debt / Ajusted EBITDA LTM 3,0 3,3 -10,6% 3,0 3,3 -10,6%
Net Income (5,9) 15,0 NA (22,8) 9,6 NA
Net Margin -3,8% 9,7% -13,5 p.p. -3,5% 2,2% -5,7 p.p.
Shareholder's Equity 158,1 150,4 5,1% 158,1 150,4 5,1%
CAPEX 59,4 41,1 44,5% 179,2 80,6 122,2%
Fleet of Vessels 24 20 20,0% 24 20 20,0%
ROIC 13,9% 8,2% 5,7 p.p. 13,9% 8,2% 5,7 p.p.
Employees 1734 1739 -0,3% 1734 1739 -0,3%
276581 632
830
1.870 1.786
(181)
148
1.106
2.451 2.418
dec/19 sep/20 Reduction NewContracts
dec/20
Backlog
Services Vessels
Type#
Vessels (1)
avarage daily
rate USD 000 (5)
Valor
R$ millions (5)Prazo
Vessels Segment
OSRV/PSV/BH/LH (2) 13 15,7 664 up to 4 years
RSV/MPSV/SDSV (3) 6 28,4 637 up to 4 years
AHTS-TO (4) 2 30,5 485 4 years
Total 21 1.786
Services Segment
RV 2 NA 234 4 years
Others NA NA 398 up to 3 years
Total 2 632
Backlog 23 2.418
OceanPact – Earnings Release 4Q20 | 2020 - 6
The Company continues to convert its pipeline of opportunities into contracts with customers and
the acquisition of vessels. The contracts for two AHTS-TO and OSRV 66 with Petrobras were signed in
March 2021, the vessel from John G Mccall was acquired for US$3.4 million and the vessels Skandi
Saigon and Skandi Pacific were chartered for two years with its expected acquisition in sequence for
US$9 million each. In addition, the vessel UP Água Marinha, which was chartered, was acquired in
February 2021 for US$500 thousand.
Bids with IOCs and Petrobras (RSVs) are in progress as well as the due diligence / negotiation process
for the acquisition of UP Offshore. The ROV plan is also in progress with the assessment of equipment
acquisition and partnerships.
VESSELS SEGMENT
Operating results
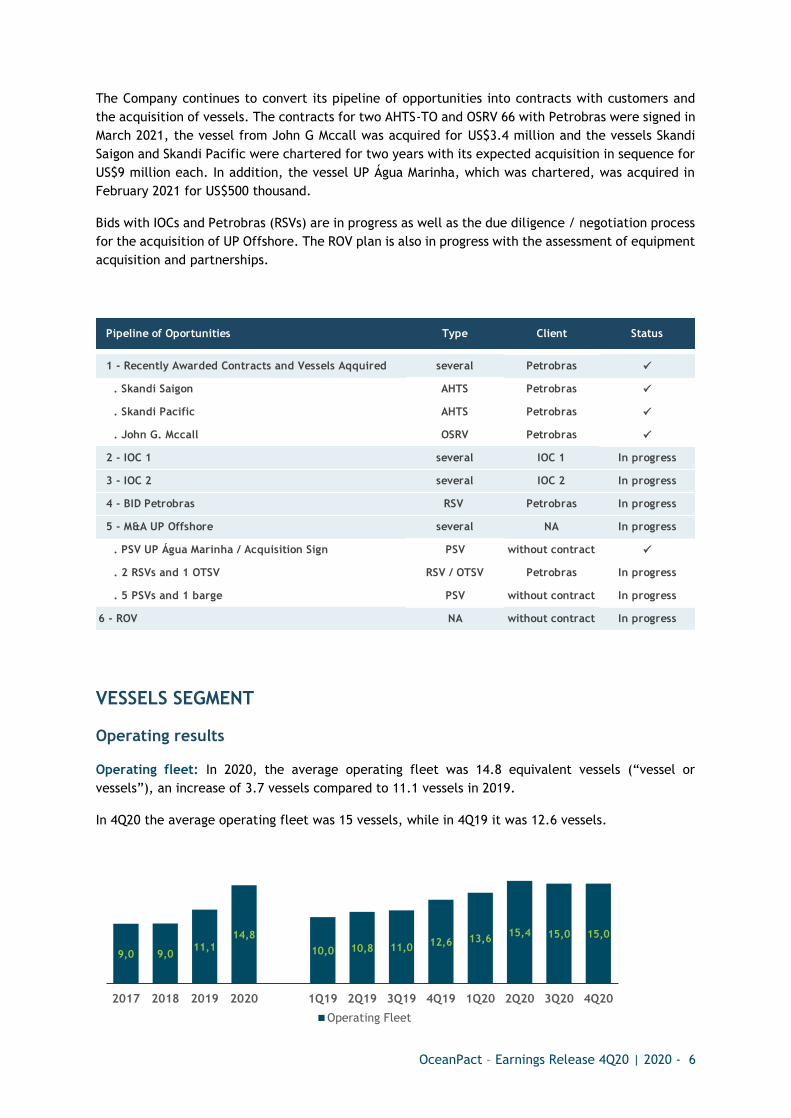
Operating fleet: In 2020, the average operating fleet was 14.8 equivalent vessels (“vessel or
vessels”), an increase of 3.7 vessels compared to 11.1 vessels in 2019.
In 4Q20 the average operating fleet was 15 vessels, while in 4Q19 it was 12.6 vessels.
Pipeline of Oportunities Type Client Status
1 - Recently Awarded Contracts and Vessels Aqquired several Petrobras ✓
. Skandi Saigon AHTS Petrobras ✓
. Skandi Pacific AHTS Petrobras ✓
. John G. Mccall OSRV Petrobras ✓
2 - IOC 1 several IOC 1 In progress
3 - IOC 2 several IOC 2 In progress
4 - BID Petrobras RSV Petrobras In progress
5 - M&A UP Offshore several NA In progress
. PSV UP Água Marinha / Acquisition Sign PSV without contract ✓
. 2 RSVs and 1 OTSV RSV / OTSV Petrobras In progress
. 5 PSVs and 1 barge PSV without contract In progress
6 - ROV NA without contract In progress
9,0 9,011,1
14,8
10,0 10,8 11,012,6 13,6
15,4 15,0 15,0
0,0
2,0
4,0
6,0
8,0
10,0
12,0
14,0
16,0
18,0
20,0
2017 2018 2019 2020 1Q19 2Q19 3Q19 4Q19 1Q20 2Q20 3Q20 4Q20
Operating Fleet
OceanPact – Earnings Release 4Q20 | 2020 - 7
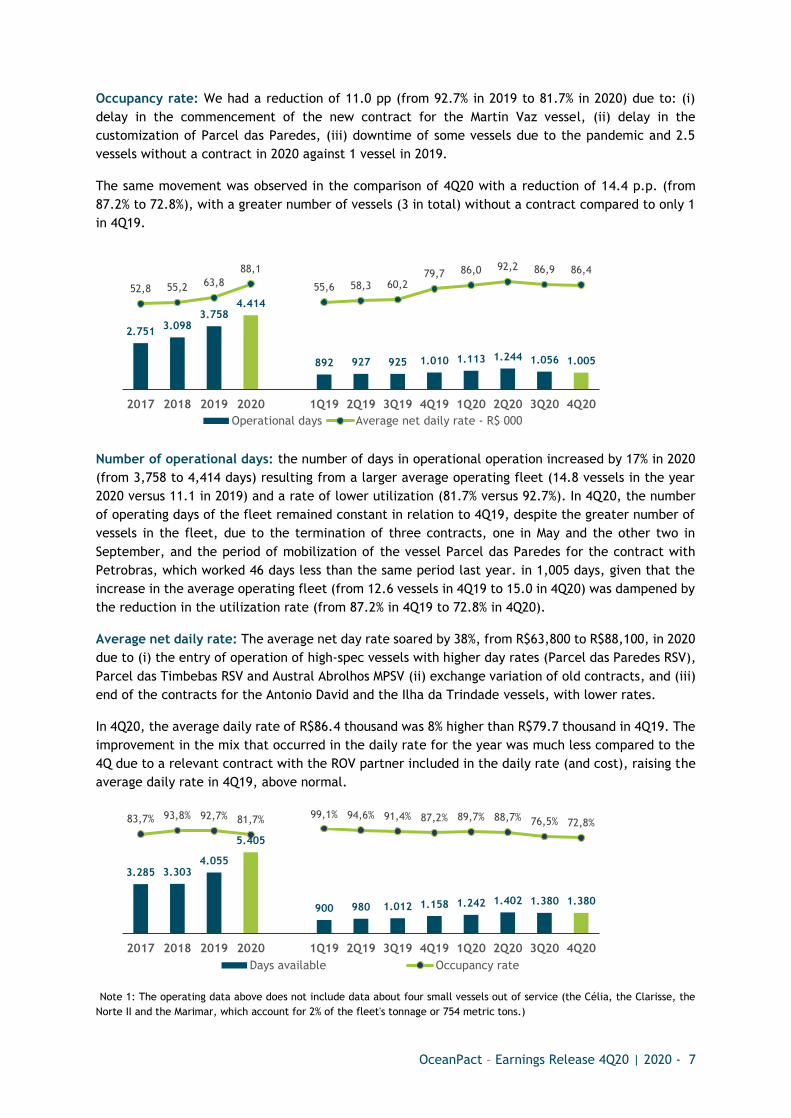
Occupancy rate: We had a reduction of 11.0 pp (from 92.7% in 2019 to 81.7% in 2020) due to: (i)
delay in the commencement of the new contract for the Martin Vaz vessel, (ii) delay in the
customization of Parcel das Paredes, (iii) downtime of some vessels due to the pandemic and 2.5
vessels without a contract in 2020 against 1 vessel in 2019.
The same movement was observed in the comparison of 4Q20 with a reduction of 14.4 p.p. (from
87.2% to 72.8%), with a greater number of vessels (3 in total) without a contract compared to only 1
in 4Q19.
Number of operational days: the number of days in operational operation increased by 17% in 2020
(from 3,758 to 4,414 days) resulting from a larger average operating fleet (14.8 vessels in the year
2020 versus 11.1 in 2019) and a rate of lower utilization (81.7% versus 92.7%). In 4Q20, the number
of operating days of the fleet remained constant in relation to 4Q19, despite the greater number of
vessels in the fleet, due to the termination of three contracts, one in May and the other two in
September, and the period of mobilization of the vessel Parcel das Paredes for the contract with
Petrobras, which worked 46 days less than the same period last year. in 1,005 days, given that the
increase in the average operating fleet (from 12.6 vessels in 4Q19 to 15.0 in 4Q20) was dampened by
the reduction in the utilization rate (from 87.2% in 4Q19 to 72.8% in 4Q20).
Average net daily rate: The average net day rate soared by 38%, from R$63,800 to R$88,100, in 2020
due to (i) the entry of operation of high-spec vessels with higher day rates (Parcel das Paredes RSV),
Parcel das Timbebas RSV and Austral Abrolhos MPSV (ii) exchange variation of old contracts, and (iii)
end of the contracts for the Antonio David and the Ilha da Trindade vessels, with lower rates.
In 4Q20, the average daily rate of R$86.4 thousand was 8% higher than R$79.7 thousand in 4Q19. The
improvement in the mix that occurred in the daily rate for the year was much less compared to the
4Q due to a relevant contract with the ROV partner included in the daily rate (and cost), raising the
average daily rate in 4Q19, above normal.
Note 1: The operating data above does not include data about four small vessels out of service (the Célia, the Clarisse, the
Norte II and the Marimar, which account for 2% of the fleet's tonnage or 754 metric tons.)
2.7513.098
3.7584.414
892 927 925 1.010 1.113 1.244 1.056 1.005
52,8 55,2 63,8
88,1
55,6 58,3 60,279,7 86,0 92,2 86,9 86,4
-100,0
-50,0
0,0
50, 0
100 ,0
0
1.000
2.000
3.000
4.000
5.000
6.000
7.000
2017 2018 2019 2020 1Q19 2Q19 3Q19 4Q19 1Q20 2Q20 3Q20 4Q20
Operational days Average net daily rate - R$ 000
3.285 3.3034.055
5.405
900 980 1.012 1.158 1.242 1.402 1.380 1.380
83,7% 93,8% 92,7% 81,7%99,1% 94,6% 91,4% 87,2% 89,7% 88,7% 76,5% 72,8%
-200,0%
-150,0%
-100,0%
-50,0%
0,0 %
50, 0%
100 ,0%
0
1.000
2.000
3.000
4.000
5.000
6.000
7.000
2017 2018 2019 2020 1Q19 2Q19 3Q19 4Q19 1Q20 2Q20 3Q20 4Q20
Days available Occupancy rate
OceanPact – Earnings Release 4Q20 | 2020 - 8
Note 2: “Days available” is the number of potentially usable days with 100% occupancy, "days utilized" is the number of days
actually used, "occupancy rate" equals "days utilized" divided by "days available” and “Average day rate” equals “Net revenue
from vessels” divided by “days utilized.”
Net revenue and adjusted EBITDA of Vessels Segment
Net Revenue of vessels segment in 2020 grew 60.6% in 2020 (from R$242.6 million in 2019 to R$389.6
million in 2020), and was compounded by multiplying the number of operating days (4,414) by average
daily rate (R$88.1 thousand).
In 4Q20 this revenue was composed by multiplying the number of operating days (1,005) by the
average daily rate (R$86.4 thousand), resulting in a Net Revenue from Operational Vessels of R$86.8
million.
Impacts on the result of vessels in 4Q20
We had a loss of revenue on the vessel RSV Parcel das Paredes in the amount of R$5.2 million due to
an inoperability of 59 days: 35 days due to the delay in customization and 24 days due to the rupture
of the ROV cable operated by the partner, both due to difficulties associated with Covid-19.
The Austral Abrolhos vessel had a lower than expected operational performance with fewer
kilometers inspected in the period due to the low allocation by the customer, partially caused by
Covid-19 generating a loss of revenue of R$5.1 million.
SERVICES SEGMENT
Net revenue and adjusted EBITDA of Services Segment
Net revenue from the services segment grew by 26.1% in 2020 (from R$200.6 million in 2019 to
R$253.0 million in 2020).
In 4Q20, aet revenue fell 2.1% (from R$71.2 million in 2019 to R$69.7 million in 2020).
Year Quarter
2017 2018 2019 2020 1Q19 2Q19 3Q19 4Q19 1Q20 2Q20 3Q20 4Q20
Operating Fleet (a) 9,0 9,0 11,1 14,8 10,0 10,8 11,0 12,6 13,6 15,4 15,0 15,0
Period - days (b) 365 365 365 366 90 91 92 92 91 91 92 92
Days available (c = a * b) 3.285 3.303 4.055 5.405 900 980 1.012 1.158 1.242 1.402 1.380 1.380
Occupancy rate (d) 84% 94% 93% 82% 99% 95% 91% 87% 90% 89% 77% 73%
Operational days (e = c * d) 2.751 3.098 3.758 4.414 892 927 925 1.010 1.113 1.244 1.056 1.005
Average net daily rate - R$ mil (f) 52,8 55,2 63,8 88,1 55,6 58,3 60,2 79,7 86,0 92,2 86,9 86,4
Operating Fleet Net Revenue (g = e * f) 145,3 171,1 239,7 389,0 49,6 54,1 55,7 80,4 95,8 114,7 91,8 86,8
Other Vessel Revenue (h) 3,9 3,5 2,8 0,6 0,6 0,0 0,2 2,1 0,4 0,1 0,0 0,0
Vessels Net Revenue (i = g + h) 149,2 174,6 242,6 389,6 50,2 54,1 55,8 82,5 96,1 114,8 91,8 86,8
Operating Cost (90,4) (100,0) (154,4) (250,7) (26,9) (32,9) (34,9) (59,7) (50,8) (75,7) (63,1) (61,1)
Adjusted G&A expenses (21,5) (22,8) (26,5) (40,1) (4,4) (4,7) (5,8) (11,5) (7,3) (9,2) (9,1) (14,5)
Other Results 3,6 (6,0) 0,7 4,8 (0,1) (0,2) (0,2) 1,3 (0,2) (0,6) 1,5 4,2
Adjusted EBITDA 41,0 45,8 62,5 103,6 18,8 16,2 14,9 12,6 37,9 29,3 21,0 15,4
Adjusted EBITDA Margin 27% 26% 26% 27% 37% 30% 27% 15% 39% 26% 23% 18%
Net revenue and adjusted EBITDA of Vessels
Segment- R$ millions
OceanPact – Earnings Release 4Q20 | 2020 - 9
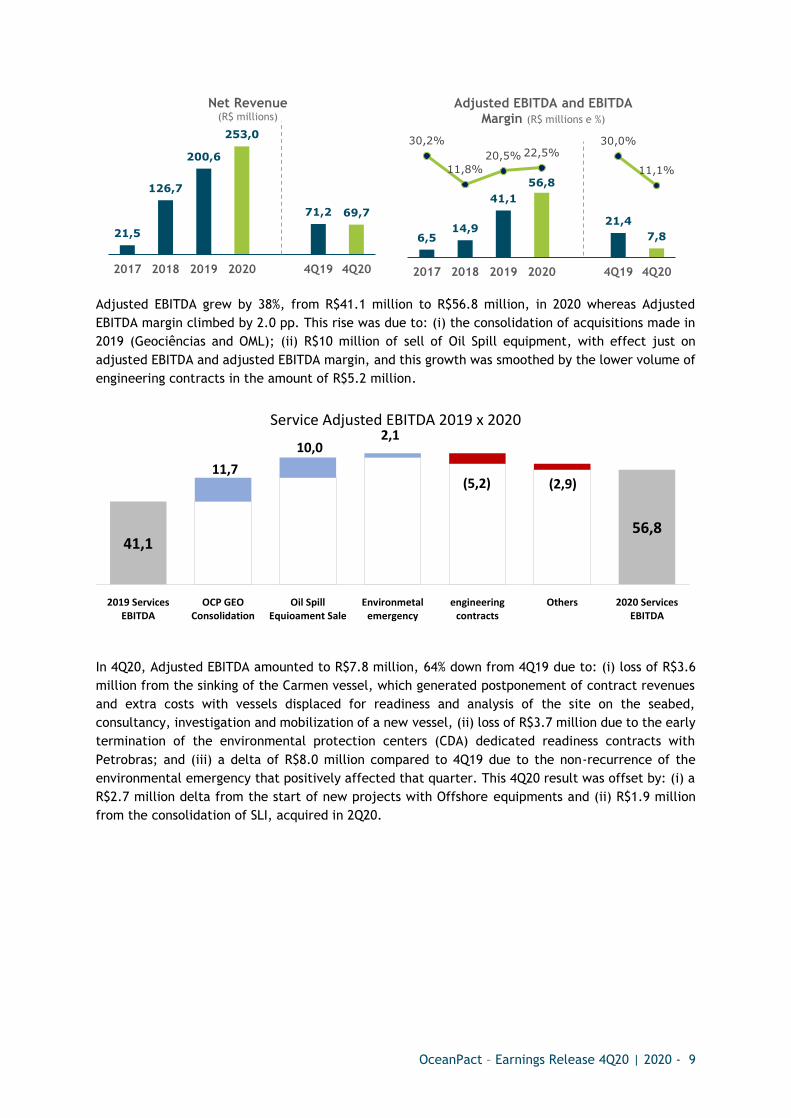
Adjusted EBITDA grew by 38%, from R$41.1 million to R$56.8 million, in 2020 whereas Adjusted
EBITDA margin climbed by 2.0 pp. This rise was due to: (i) the consolidation of acquisitions made in
2019 (Geociências and OML); (ii) R$10 million of sell of Oil Spill equipment, with effect just on
adjusted EBITDA and adjusted EBITDA margin, and this growth was smoothed by the lower volume of
engineering contracts in the amount of R$5.2 million.
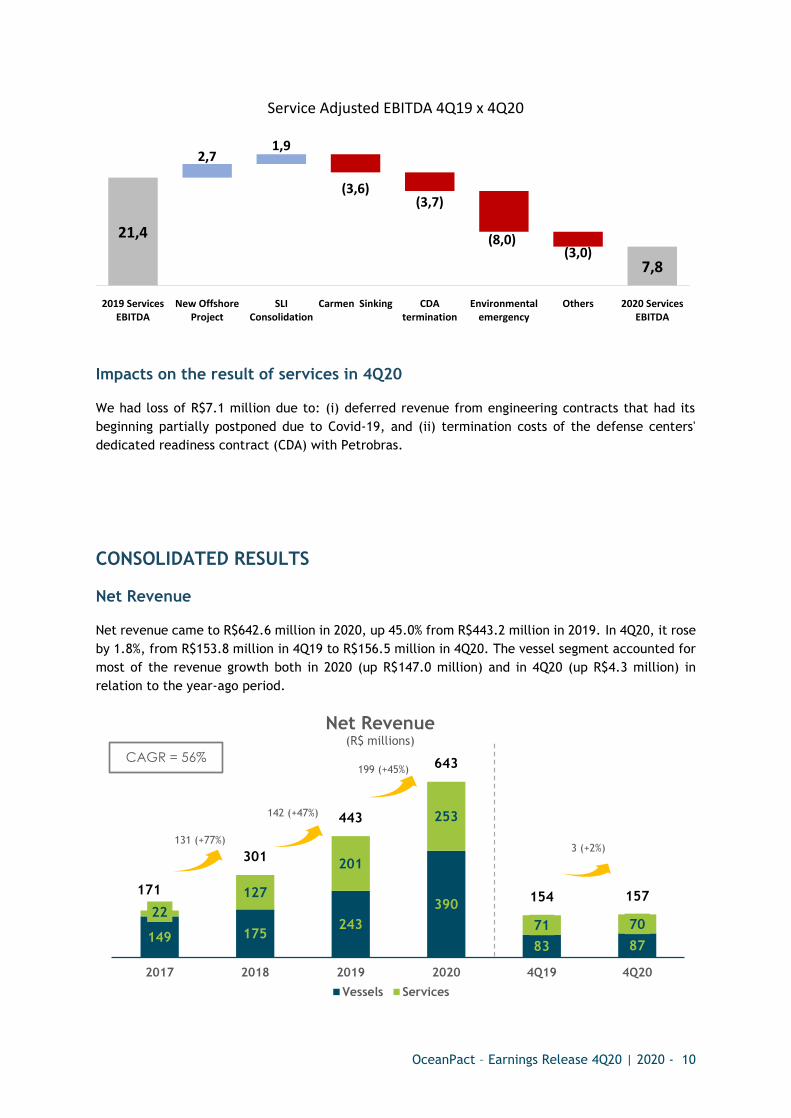
In 4Q20, Adjusted EBITDA amounted to R$7.8 million, 64% down from 4Q19 due to: (i) loss of R$3.6
million from the sinking of the Carmen vessel, which generated postponement of contract revenues
and extra costs with vessels displaced for readiness and analysis of the site on the seabed,
consultancy, investigation and mobilization of a new vessel, (ii) loss of R$3.7 million due to the early
termination of the environmental protection centers (CDA) dedicated readiness contracts with
Petrobras; and (iii) a delta of R$8.0 million compared to 4Q19 due to the non-recurrence of the
environmental emergency that positively affected that quarter. This 4Q20 result was offset by: (i) a
R$2.7 million delta from the start of new projects with Offshore equipments and (ii) R$1.9 million
from the consolidation of SLI, acquired in 2Q20.
21,5
126,7
200,6
253,0
71,2 69,7
2017 2018 2019 2020 4Q19 4Q20
Net Revenue(R$ millions)
6,514,9
41,1
56,8
21,4
7,8
30,2%
11,8%
20,5% 22,5%30,0%
11,1%
-35,0%
-25,0%
-15,0%
-5,0%
5,0 %
15, 0%
25, 0%
35, 0%
45, 0%
55, 0%
0,0
20, 0
40, 0
60, 0
80, 0
100 ,0
120 ,0
2017 2018 2019 2020 4Q19 4Q20
Adjusted EBITDA and EBITDA Margin (R$ millions e %)
41,156,8
11,7
10,02,1
(5,2) (2,9)
2019 ServicesEBITDA
OCP GEOConsolidation
Oil SpillEquioament Sale
Environmetalemergency
engineeringcontracts
Others 2020 ServicesEBITDA
Service Adjusted EBITDA 2019 x 2020
OceanPact – Earnings Release 4Q20 | 2020 - 10
Impacts on the result of services in 4Q20
We had loss of R$7.1 million due to: (i) deferred revenue from engineering contracts that had its
beginning partially postponed due to Covid-19, and (ii) termination costs of the defense centers'
dedicated readiness contract (CDA) with Petrobras.
CONSOLIDATED RESULTS
Net Revenue
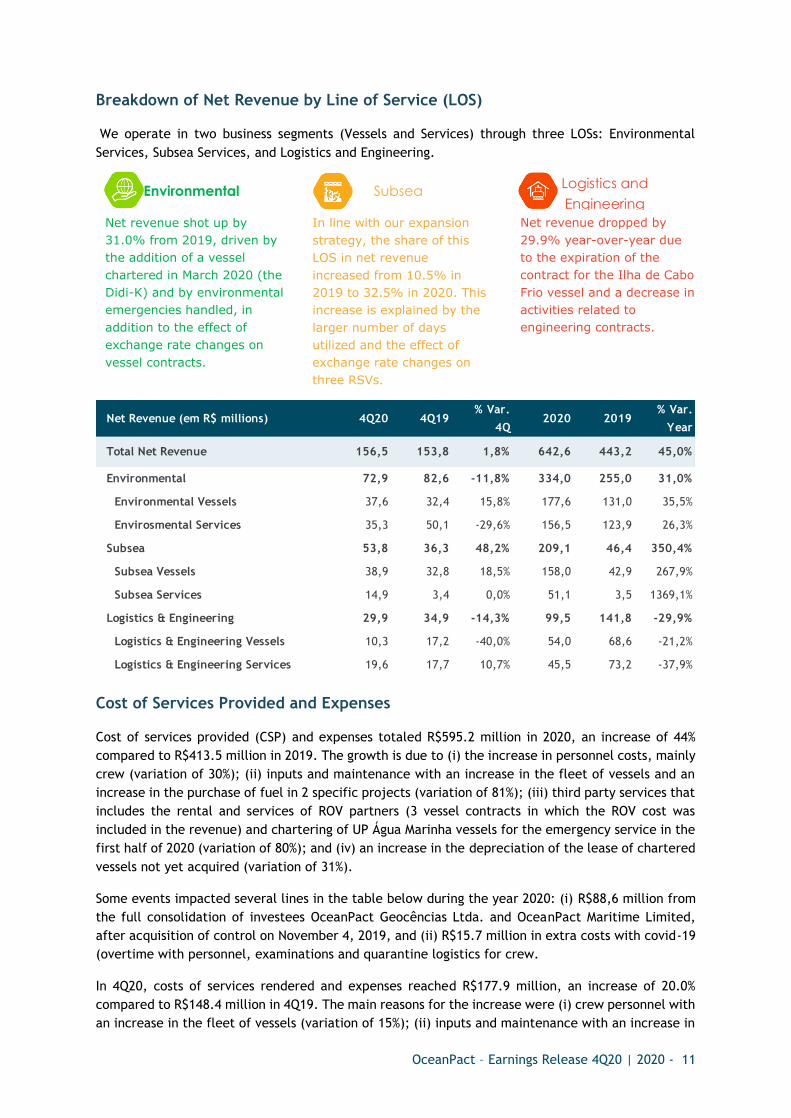
Net revenue came to R$642.6 million in 2020, up 45.0% from R$443.2 million in 2019. In 4Q20, it rose
by 1.8%, from R$153.8 million in 4Q19 to R$156.5 million in 4Q20. The vessel segment accounted for
most of the revenue growth both in 2020 (up R$147.0 million) and in 4Q20 (up R$4.3 million) in
relation to the year-ago period.
21,4
7,8
2,71,9
(3,6)(3,7)
(8,0)(3,0)
2019 ServicesEBITDA
New OffshoreProject
SLIConsolidation
Carmen Sinking CDAtermination
Environmentalemergency
Others 2020 ServicesEBITDA
Service Adjusted EBITDA 4Q19 x 4Q20
149 175243
390
83 87
22
127
201
253
71 70
171
301
443
643
154 157
2017 2018 2019 2020 4Q19 4Q20
Net Revenue(R$ millions)
Vessels Services
CAGR = 56%
131 (+77%)
142 (+47%)
199 (+45%)
3 (+2%)
OceanPact – Earnings Release 4Q20 | 2020 - 11
Breakdown of Net Revenue by Line of Service (LOS)
We operate in two business segments (Vessels and Services) through three LOSs: Environmental
Services, Subsea Services, and Logistics and Engineering.
Cost of Services Provided and Expenses
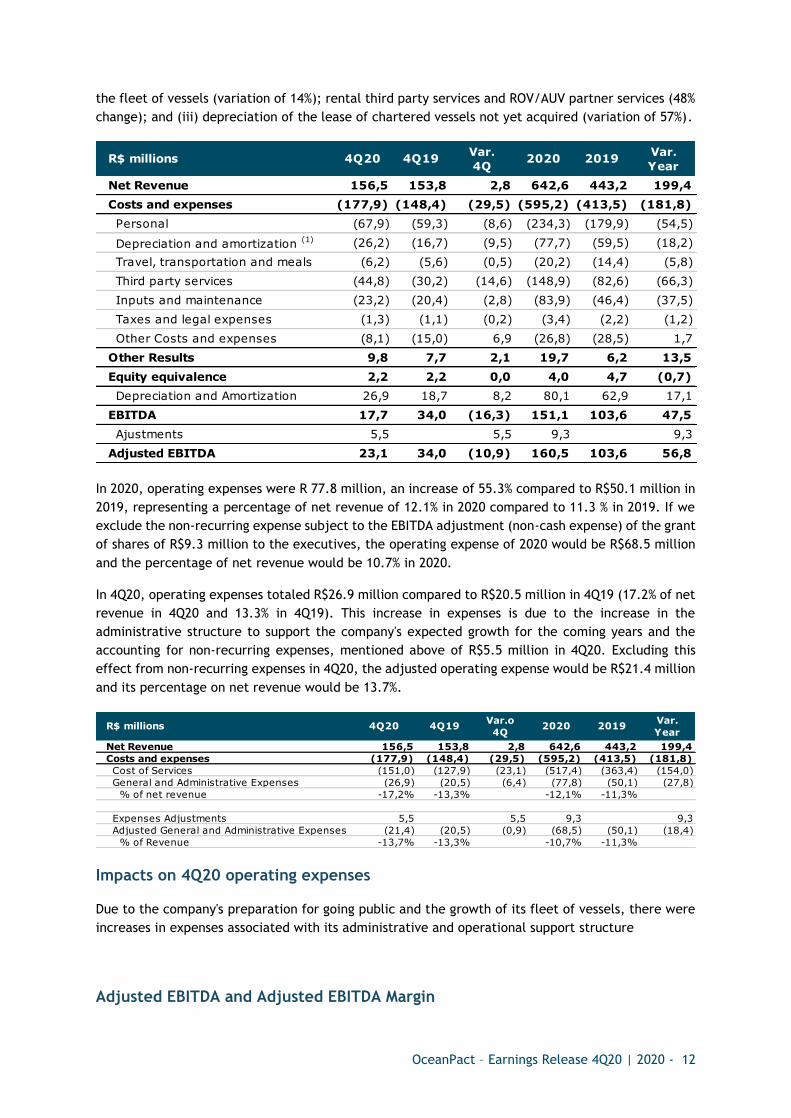
Cost of services provided (CSP) and expenses totaled R$595.2 million in 2020, an increase of 44%
compared to R$413.5 million in 2019. The growth is due to (i) the increase in personnel costs, mainly
crew (variation of 30%); (ii) inputs and maintenance with an increase in the fleet of vessels and an
increase in the purchase of fuel in 2 specific projects (variation of 81%); (iii) third party services that
includes the rental and services of ROV partners (3 vessel contracts in which the ROV cost was
included in the revenue) and chartering of UP Água Marinha vessels for the emergency service in the
first half of 2020 (variation of 80%); and (iv) an increase in the depreciation of the lease of chartered
vessels not yet acquired (variation of 31%).
Some events impacted several lines in the table below during the year 2020: (i) R$88,6 million from
the full consolidation of investees OceanPact Geocências Ltda. and OceanPact Maritime Limited,
after acquisition of control on November 4, 2019, and (ii) R$15.7 million in extra costs with covid-19
(overtime with personnel, examinations and quarantine logistics for crew.
In 4Q20, costs of services rendered and expenses reached R$177.9 million, an increase of 20.0%
compared to R$148.4 million in 4Q19. The main reasons for the increase were (i) crew personnel with
an increase in the fleet of vessels (variation of 15%); (ii) inputs and maintenance with an increase in
Net Revenue (em R$ millions) 4Q20 4Q19% Var.
4Q2020 2019
% Var.
Year
Total Net Revenue 156,5 153,8 1,8% 642,6 443,2 45,0%
Environmental 72,9 82,6 -11,8% 334,0 255,0 31,0%
Environmental Vessels 37,6 32,4 15,8% 177,6 131,0 35,5%
Envirosmental Services 35,3 50,1 -29,6% 156,5 123,9 26,3%
Subsea 53,8 36,3 48,2% 209,1 46,4 350,4%
Subsea Vessels 38,9 32,8 18,5% 158,0 42,9 267,9%
Subsea Services 14,9 3,4 0,0% 51,1 3,5 1369,1%
Logistics & Engineering 29,9 34,9 -14,3% 99,5 141,8 -29,9%
Logistics & Engineering Vessels 10,3 17,2 -40,0% 54,0 68,6 -21,2%
Logistics & Engineering Services 19,6 17,7 10,7% 45,5 73,2 -37,9%
Net revenue shot up by
31.0% from 2019, driven by
the addition of a vessel
chartered in March 2020 (the
Didi-K) and by environmental
emergencies handled, in
addition to the effect of
exchange rate changes on
vessel contracts.
In line with our expansion
strategy, the share of this
LOS in net revenue
increased from 10.5% in
2019 to 32.5% in 2020. This
increase is explained by the
larger number of days
utilized and the effect of
exchange rate changes on
three RSVs.
Net revenue dropped by
29.9% year-over-year due
to the expiration of the
contract for the Ilha de Cabo
Frio vessel and a decrease in
activities related to
engineering contracts.
Environmental Subsea Logistics and
Engineering
OceanPact – Earnings Release 4Q20 | 2020 - 12
the fleet of vessels (variation of 14%); rental third party services and ROV/AUV partner services (48%
change); and (iii) depreciation of the lease of chartered vessels not yet acquired (variation of 57%).
In 2020, operating expenses were R 77.8 million, an increase of 55.3% compared to R$50.1 million in
2019, representing a percentage of net revenue of 12.1% in 2020 compared to 11.3 % in 2019. If we
exclude the non-recurring expense subject to the EBITDA adjustment (non-cash expense) of the grant
of shares of R$9.3 million to the executives, the operating expense of 2020 would be R$68.5 million
and the percentage of net revenue would be 10.7% in 2020.
In 4Q20, operating expenses totaled R$26.9 million compared to R$20.5 million in 4Q19 (17.2% of net
revenue in 4Q20 and 13.3% in 4Q19). This increase in expenses is due to the increase in the
administrative structure to support the company's expected growth for the coming years and the
accounting for non-recurring expenses, mentioned above of R$5.5 million in 4Q20. Excluding this
effect from non-recurring expenses in 4Q20, the adjusted operating expense would be R$21.4 million
and its percentage on net revenue would be 13.7%.
Impacts on 4Q20 operating expenses
Due to the company's preparation for going public and the growth of its fleet of vessels, there were
increases in expenses associated with its administrative and operational support structure
Adjusted EBITDA and Adjusted EBITDA Margin
R$ millions 4Q20 4Q19Var.
4Q2020 2019
Var.
Year
Net Revenue 156,5 153,8 2,8 642,6 443,2 199,4
Costs and expenses (177,9) (148,4) (29,5) (595,2) (413,5) (181,8)
Personal (67,9) (59,3) (8,6) (234,3) (179,9) (54,5)
Depreciation and amortization (1) (26,2) (16,7) (9,5) (77,7) (59,5) (18,2)
Travel, transportation and meals (6,2) (5,6) (0,5) (20,2) (14,4) (5,8)
Third party services (44,8) (30,2) (14,6) (148,9) (82,6) (66,3)
Inputs and maintenance (23,2) (20,4) (2,8) (83,9) (46,4) (37,5)
Taxes and legal expenses (1,3) (1,1) (0,2) (3,4) (2,2) (1,2)
Other Costs and expenses (8,1) (15,0) 6,9 (26,8) (28,5) 1,7
Other Results 9,8 7,7 2,1 19,7 6,2 13,5
Equity equivalence 2,2 2,2 0,0 4,0 4,7 (0,7)
Depreciation and Amortization 26,9 18,7 8,2 80,1 62,9 17,1
EBITDA 17,7 34,0 (16,3) 151,1 103,6 47,5
Ajustments 5,5 5,5 9,3 9,3
Adjusted EBITDA 23,1 34,0 (10,9) 160,5 103,6 56,8
R$ millions 4Q20 4Q19Var.o
4Q2020 2019
Var.
Year
Net Revenue 156,5 153,8 2,8 642,6 443,2 199,4
Costs and expenses (177,9) (148,4) (29,5) (595,2) (413,5) (181,8)
Cost of Services (151,0) (127,9) (23,1) (517,4) (363,4) (154,0)
General and Administrative Expenses (26,9) (20,5) (6,4) (77,8) (50,1) (27,8)
% of net revenue -17,2% -13,3% -12,1% -11,3%
Expenses Adjustments 5,5 5,5 9,3 9,3
Adjusted General and Administrative Expenses (21,4) (20,5) (0,9) (68,5) (50,1) (18,4)
% of Revenue -13,7% -13,3% -10,7% -11,3%
OceanPact – Earnings Release 4Q20 | 2020 - 13
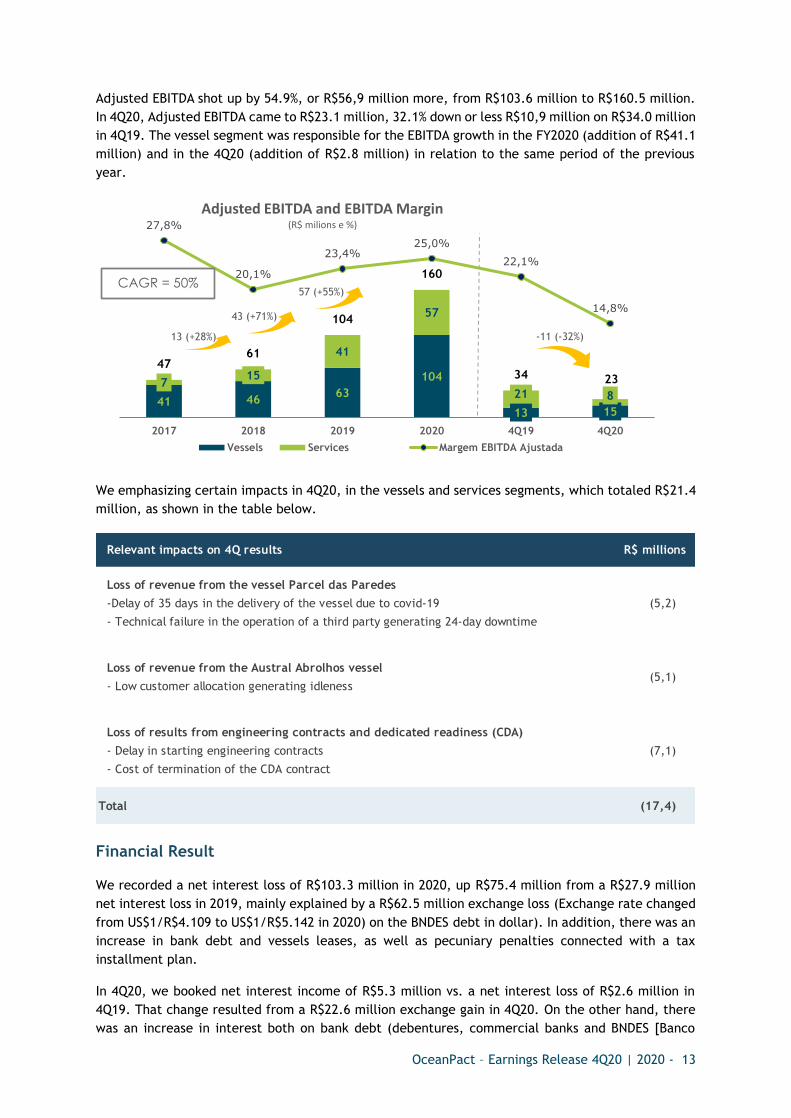
Adjusted EBITDA shot up by 54.9%, or R$56,9 million more, from R$103.6 million to R$160.5 million.
In 4Q20, Adjusted EBITDA came to R$23.1 million, 32.1% down or less R$10,9 million on R$34.0 million
in 4Q19. The vessel segment was responsible for the EBITDA growth in the FY2020 (addition of R$41.1
million) and in the 4Q20 (addition of R$2.8 million) in relation to the same period of the previous
year.
We emphasizing certain impacts in 4Q20, in the vessels and services segments, which totaled R$21.4
million, as shown in the table below.
Financial Result
We recorded a net interest loss of R$103.3 million in 2020, up R$75.4 million from a R$27.9 million
net interest loss in 2019, mainly explained by a R$62.5 million exchange loss (Exchange rate changed
from US$1/R$4.109 to US$1/R$5.142 in 2020) on the BNDES debt in dollar). In addition, there was an
increase in bank debt and vessels leases, as well as pecuniary penalties connected with a tax
installment plan.
In 4Q20, we booked net interest income of R$5.3 million vs. a net interest loss of R$2.6 million in
4Q19. That change resulted from a R$22.6 million exchange gain in 4Q20. On the other hand, there
was an increase in interest both on bank debt (debentures, commercial banks and BNDES [Banco
41 4663
104
13 15
715
41
57
21 8
4761
104
160
34 23
27,8%
20,1%
23,4%25,0%
22,1%
14,8%
0,0 %
5,0 %
10, 0%
15, 0%
20, 0%
25, 0%
30, 0%
0
50
100
150
200
2017 2018 2019 2020 4Q19 4Q20
Adjusted EBITDA and EBITDA Margin(R$ milions e %)
Vessels Services Margem EBITDA Ajustada
Relevant impacts on 4Q results R$ millions
Loss of revenue from the vessel Parcel das Paredes
-Delay of 35 days in the delivery of the vessel due to covid-19
- Technical failure in the operation of a third party generating 24-day downtime
(5,2)
Loss of revenue from the Austral Abrolhos vessel
- Low customer allocation generating idleness(5,1)
Loss of results from engineering contracts and dedicated readiness (CDA)
- Delay in starting engineering contracts
- Cost of termination of the CDA contract
(7,1)
Total (17,4)
13 (+28%)
CAGR = 50%
43 (+71%)
57 (+55%)
-11 (-32%)
OceanPact – Earnings Release 4Q20 | 2020 - 14
Nacional de Desenvolvimento Econômico e Social, or Brazilian National Bank for Economic and Social
Development]) and on vessels leases, as well as the effect of pecuniary penalties connected with a
tax installment plan on 4Q20.
Net Income/Loss
Owing to the effect of exchange rate changes on interest expenses in 2020 related with BNDES debt
in dollar, we recorded a net loss of R$22.8 million, vs. net income of R$9.6 million in the previous
year. In 4Q20, there was a R$5.9 million net loss, vs. R$15.0 million net income in 4Q19.
Debt
Gross debt amounted to R$804.4 million at the close of 2020, up R$378.8 million year-over-year, due
to the issue of debentures, in the amount of R$265.0 million; R$104.7 million in newly raised capital;
the effect of exchange rate changes on dollar-denominated debt, totaling R$84.5 million; R$85.6
million related to new leases for the Parcel do Bandolim, Havila Harmony (Parcel dos Meros) and UP
Água Marinha vessels; and R$18.7 million connected with a standstill agreement with BNDES. The
debentures provided cash for future investments and allowed us to extend the maturity of the
Company's debt, 84% of which is now comprised of long-term debt.
Cash and cash equivalents totaled R$197.3 million at the close of 2020, increase of R$146.2 million
in relation to the end of 2019 to face the new investments planned in 2021.
Net debt (including leases) amounted to R$607.1 million in December 2020, up R$232.7 million year-
over-year. The leverage ratio (net debt/Adjusted EBITDA) was 3.8 times at the close of the year, up
0.2 times from the close of 2019. Had it not been for those leases, the leverage ratio, considering
only bank debt (net bank debt/adjusted EBITDA) at the close of the period, would have been 3.0
times, down 0.3 time from the close of 2019.
R$ millions 4Q20 4Q19Var.
4Q2020 2019
Var.
Year
Financial income
Income from investments 0,8 0,3 0,5 1,6 1,0 0,6
Exchange variations 22,6 3,7 18,8 0,0 0,0 0,0
Interest 1,4 0,4 1,1 1,8 0,9 0,9
Other revenue 0,5 0,0 0,5 0,6 0,1 0,6
Total 25,3 4,4 20,9 4,0 1,9 2,1
Financial expenses
Bank interest and charges (7,9) (5,8) (2,1) (26,9) (15,6) (11,3)
Exchange variations (62,5) (9,4)
Interest and charges - leases (4,0) (0,6) (3,4) (7,2) (3,9) (3,3)
Fines and other expenses (8,1) (0,5) (7,5) (10,7) (0,9) (9,8)
Total (20,0) (7,0) (13,0) (107,3) (29,8) (77,5)
Net Financial Result 5,3 (2,6) 7,8 (103,3) (27,9) (75,4)
OceanPact – Earnings Release 4Q20 | 2020 - 15
Gross Bank Debt
Total Gross Bank Debt: R$673.1 million
BNDES: R$274.4 million with maturities up
to 2031, cost of USD + 3.5%
Debentures: R$256.5 million with a 1-year
grace period and maturities up to 2025,
cost of CDI + 5.5%
Outras dívidas Bancárias: R$ 142.3 million
with maturities up to 2023, average cost
of CDI + 4.5%
Of OceanPact’s total debt, R$274.4 million (41%) is denominated in USD, was obtained from the
BNDES through the FMM [Fundo da Marinha Mercante, or Merchant Nave Fund] and has a long-term
maturity, up to 2031. Despite the change in the book value of debt resulting from exchange rate
changes, we seek to keep our cash flow in balance by managing cash receipts and payments in USD
(revenue vs. OPEX, CAPEX and debt service.)
Whereas the average cost of dollar-denominated debt is USD plus 3.5% per year, the cost of loans in
BRL is, for the most part, the CDI [Certificado de Depósito Interfinanceiro, or Interbank Deposit
Certificate] rate plus 4 to 6% per year.
Capital Expenditures
Debt (in R$ Million, except %) 2020 2019 2018 2017
Gross Debt 804. 4 425. 6 271. 3 206. 7
Short-Term 130.2 92.8 38.9 17.9
Long-Term 674.2 332.7 232.4 188.8
% Short-Term 16% 22% 14% 9%
% Long-Term 84% 78% 86% 91%
Cash and Equivalents (*) (197.3) (51.1) (22.4) (36.8)
Net Debt 607. 1 374. 4 248. 9 169. 9
Short and Long-Term Lease 131.3 30.6 9.0 1.8
Net banking debt 475. 8 343. 8 239. 9 168. 1
Adjusted EBITDA LTM 160. 5 103. 6 60.7 47.4
Net Debt/Adjusted EBITDA 3.78 3.61 4.10 3.58
Net Banking Debt/Adjusted EBITDA 2.97 3.32 3.96 3.54
41%
38%
21%
BNDES Debentures Other Banks Debt
16%
84%
Short-Term Long-Term
41%
59%
In US$ In R$
OceanPact – Earnings Release 4Q20 | 2020 - 16
CAPEX totaled R$179.2 million in 2020, up 122% from 2019.
Equipment Acquisition: R$73.5 million (45%) in the acquisition of Oil Spill Offshore equipment
(Current Buster), equipment for collecting oceanographic data and investments in innovation.
Vessel Acquisition: R$48.1 million (27%) in the purchase of the Sealion Amazônia (currently Parcel
das Timbebas) and the acquisition of the Seabulk Angra and the Seabulk Brasil (currently Ilha de São
Sebastião and Ilha de Cabo Frio.)
Vessel Customization: R$38.2 million (25%) in the preparation of the Parcel das Paredes, Havila
Harmony (Parcel dos Meros) and Parcel do Bandolim vessels for contracts with Petrobras. The Parcel
das Paredes and the Havila Harmony went into service respectively in November 2020 and March
2021. The Parcel do Bandolim is expected to go into service early in 2Q21.
Dockages: R$19.5 million (11%) in the Parcel das Timbebas, Martin Vaz, Ilha de Cabo Frio, Ilha de São
Sebastião, Austral Abrolhos and Jim Obrien vessels.
SUBSEQUENT EVENTS
On February 12, 2021, OceanPact’s common shares joined B3’s Novo Mercado segment under ticker
symbol OPCT3. Our IPO (Initial Public Offering) totaled about R$1.07 billion, approximately R$800
million in the primary offering and R$270 million in the secondary offering.
Moving ahead with the negotiations for the acquisition of Grupo UP along with its 10 vessels,
OceanPact also signed an extension of the exclusive purchase agreement (i) for all shares issued by
UP Offshore (Uruguay) S.A., the parent company of UP Offshore Support Maritime Ltda., a Brazilian
company that owns four PSVs and a barge; and (ii) two PSVs, two RSVs and an OTSV, none of which
are Brazilian flag vessels. The parties also agreed on (a) a down payment to Grupo UP, to be deducted
from the total amount eventually paid by the Company for the assets involved if the transaction is
completed, and (b) the acquisition of the UP Água Marinha, a Brazilian-flag OSV (Offshore Supply
Vessel), of the PSV category, previously owned by UP Offshore Apoio Marítimo Ltda. and leased to
OceanPact since late 2020.
Continuing its expansion program, the Company entered into 26-month charter contracts for the
Skandi Saigon and Skandi Pacific AHTS-TO vessels (with a 2-month deferment period), with a
17.245.8
80.6
179.2
41.159.4
2017 2018 2019 2020 4Q19 4Q20
Capex - R$ MM
41%
27%
21%
11%
Acquisitions of Equipments Acquisitions of Vessels
Vessels Customization Dockages
OceanPact – Earnings Release 4Q20 | 2020 - 17
(bilateral) acquisition commitment for US$9.0 million each vessel at the end of the respective charter
periods. The Skandi Saigon and Skandi Pacific are Norwegian-flag and Bahamian-flag vessels,
respectively, built in 2011 at the STX Vietnam Offshore shipyard (an important shipbuilding company
in Europe and worldwide.) Both have high-standard technical specifications. The Company entered
into those contracts to meet the demand resulting from contracts signed with Petrobras to provide
support vessels for FPSO (Floating Production Storage and Offloading) units handling and maintaining
discharge hoses.
The Company continues investing heavily in the Vessels segment. In 2021, it has already adapted both
RSVs (the Parcel do Bandolim and Parcel dos Meros) and docked six fleet vessels, taking the
opportunity provided by some exchanges and contract renewals (the Austral Abrolhos, Loreto, Macaé,
Parcel das Timbebas, Ilha de Cabo Frio and Ilha da Trindade). Therefore, the occupancy rate is
expected to drop to approximately 60%, returning to the historical level throughout the year.
OceanPact – Earnings Release 4Q20 | 2020 - 18
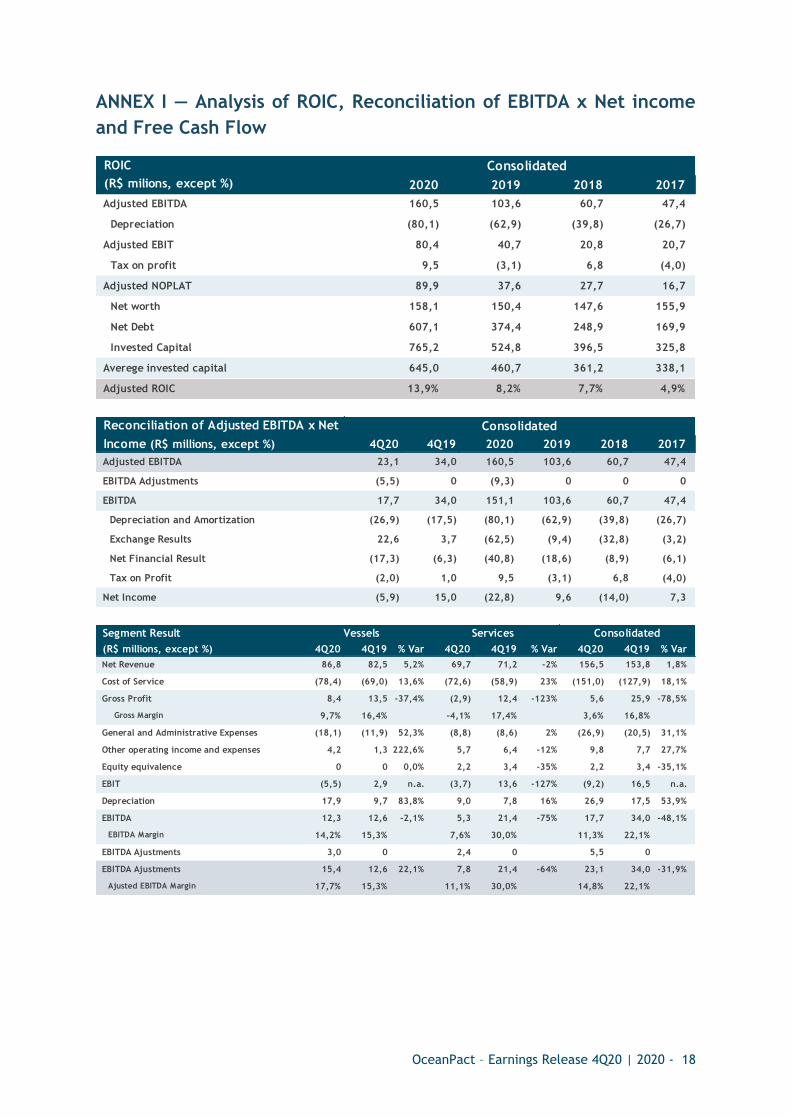
ANNEX I — Analysis of ROIC, Reconciliation of EBITDA x Net income
and Free Cash Flow
Consolidated
2020 2019 2018 2017
Adjusted EBITDA 160,5 103,6 60,7 47,4
Depreciation (80,1) (62,9) (39,8) (26,7)
Adjusted EBIT 80,4 40,7 20,8 20,7
Tax on profit 9,5 (3,1) 6,8 (4,0)
Adjusted NOPLAT 89,9 37,6 27,7 16,7
Net worth 158,1 150,4 147,6 155,9
Net Debt 607,1 374,4 248,9 169,9
Invested Capital 765,2 524,8 396,5 325,8
Averege invested capital 645,0 460,7 361,2 338,1
Adjusted ROIC 13,9% 8,2% 7,7% 4,9%
ROIC
(R$ milions, except %)
Consolidated
4Q20 4Q19 2020 2019 2018 2017
Adjusted EBITDA 23,1 34,0 160,5 103,6 60,7 47,4
EBITDA Adjustments (5,5) 0 (9,3) 0 0 0
EBITDA 17,7 34,0 151,1 103,6 60,7 47,4
Depreciation and Amortization (26,9) (17,5) (80,1) (62,9) (39,8) (26,7)
Exchange Results 22,6 3,7 (62,5) (9,4) (32,8) (3,2)
Net Financial Result (17,3) (6,3) (40,8) (18,6) (8,9) (6,1)
Tax on Profit (2,0) 1,0 9,5 (3,1) 6,8 (4,0)
Net Income (5,9) 15,0 (22,8) 9,6 (14,0) 7,3
Reconciliation of Adjusted EBITDA x Net
Income (R$ millions, except %)
Vessels Services Consolidated
4Q20 4Q19 % Var 4Q20 4Q19 % Var 4Q20 4Q19 % Var
Net Revenue 86,8 82,5 5,2% 69,7 71,2 -2% 156,5 153,8 1,8%
Cost of Service (78,4) (69,0) 13,6% (72,6) (58,9) 23% (151,0) (127,9) 18,1%
Gross Profit 8,4 13,5 -37,4% (2,9) 12,4 -123% 5,6 25,9 -78,5%
Gross Margin 9,7% 16,4% -4,1% 17,4% 3,6% 16,8%
General and Administrative Expenses (18,1) (11,9) 52,3% (8,8) (8,6) 2% (26,9) (20,5) 31,1%
Other operating income and expenses 4,2 1,3 222,6% 5,7 6,4 -12% 9,8 7,7 27,7%
Equity equivalence 0 0 0,0% 2,2 3,4 -35% 2,2 3,4 -35,1%
EBIT (5,5) 2,9 n.a. (3,7) 13,6 -127% (9,2) 16,5 n.a.
Depreciation 17,9 9,7 83,8% 9,0 7,8 16% 26,9 17,5 53,9%
EBITDA 12,3 12,6 -2,1% 5,3 21,4 -75% 17,7 34,0 -48,1%
EBITDA Margin 14,2% 15,3% 7,6% 30,0% 11,3% 22,1%
EBITDA Ajustments 3,0 0 2,4 0 5,5 0
EBITDA Ajustments 15,4 12,6 22,1% 7,8 21,4 -64% 23,1 34,0 -31,9%
Ajusted EBITDA Margin 17,7% 15,3% 11,1% 30,0% 14,8% 22,1%
Segment Result
(R$ millions, except %)
OceanPact – Earnings Release 4Q20 | 2020 - 19
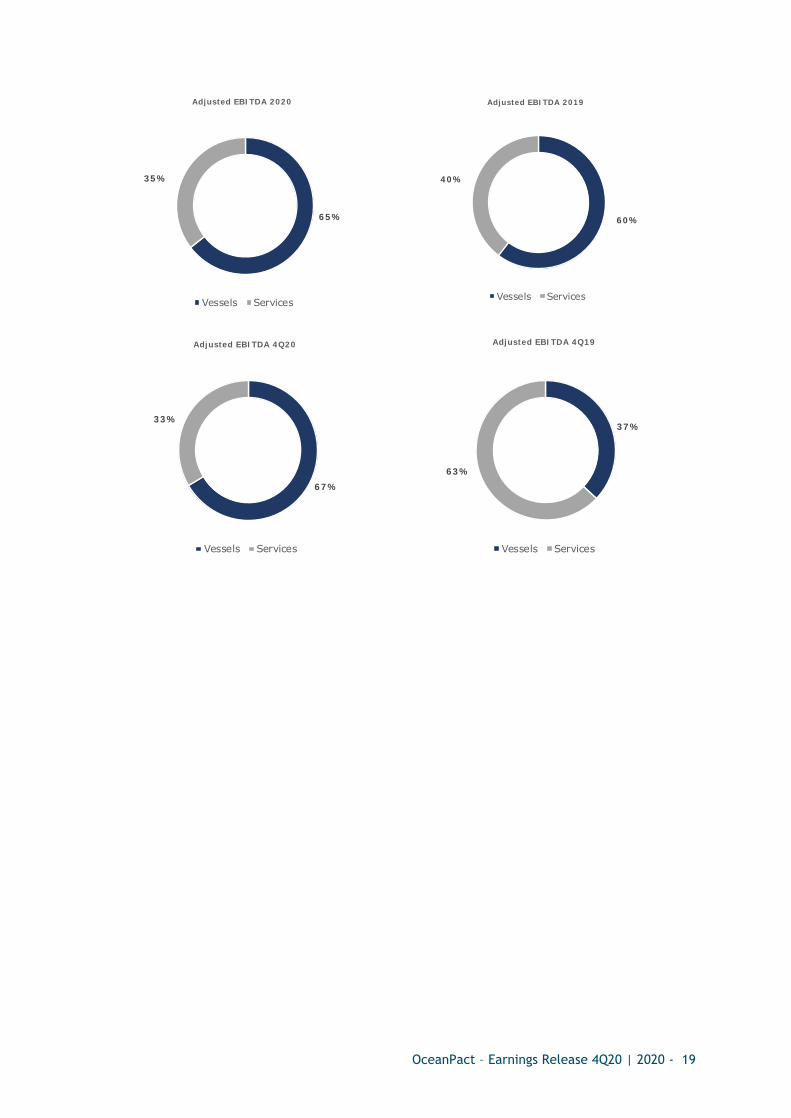
6 5 %
3 5 %
Adjusted EBI TDA 2020
Vessels Services
6 0 %
4 0 %
Adjusted EBI TDA 2019
Vessels Services
6 7 %
3 3 %
Adjusted EBI TDA 4Q20
Vessels Services
3 7 %
6 3 %
Adjusted EBI TDA 4Q19
Vessels Services
OceanPact – Earnings Release 4Q20 | 2020 - 20
ANNEX II — Breakdown of Results by Segment