Embed Size (px)
Citation preview

FY 2018
BUDGET REQUEST
FOR
OPERATING
AND
CAPITAL FUNDS
PREPARED FOR THE
BOARD OF TRUSTEES
NOVEMBER 10, 2016

FY 2018
BUDGET REQUEST
FOR
OPERATING
AND
CAPITAL FUNDS
PREPARED FOR THE
BOARD OF TRUSTEES
NOVEMBER 10, 2016


November 2016 Page ii
TABLE OF CONTENTS
Operating Budget Request for FY 2018
Background and Context ............................................................................................... 1
Economic Environment ...................................................................................... 4
The Budget Framework ...................................................................................... 6
FY 2017 Budget Outcomes .............................................................................. 10
Budget Trends in Perspective: Reallocation .................................................... 14
Budget Trends in Perspective: Tuition ............................................................ 16
University Strategic Framework ....................................................................... 17
Summary of the FY 2018 Budget Request ....................................................... 19
Medicaid Support – UI Health System
Medicaid Support – UI Health System ....................................................................... 20
Capital Budget Request for FY 2018
Background and Context ............................................................................................... 1
Summary of FY 2018 Priorities .................................................................................... 4
Priorities ........................................................................................................................ 6
Repair and Renovation ....................................................................................... 6
Art & Design Renovation/Addition .................................................................... 7
Advanced Pharmaceutical and Innovation Institute ........................................... 7
Altgeld/Illini Hall Renovation ............................................................................ 8
Feed Mill Replacement ....................................................................................... 8
STEM Building ................................................................................................... 9
Repair and Renovation Project Descriptions .............................................................. 11
Urbana-Champaign Projects ............................................................................. 11
Chicago Projects ............................................................................................... 13
Springfield Projects .......................................................................................... 14
Operating
Budget
Request for
FY 2018
Capital
Budget
Request for
FY 2018

TABLE OF CONTENTS
November 2016 Page iii
FY 2018 Budget Request Addenda
Retirement ..................................................................................................................... 1
Pension Reform (PA98-0599) ............................................................................ 5
Ensuring Access–Financial Aid .................................................................................... 9
Guiding Principles for Financial Aid - 2014 .................................................... 11
Institutional Supplemental Financial Aid Policy - 2014 ................................... 12
FY 2018
Budget
Request
Addenda

November 2016 Page iv
LIST OF FIGURES
Operating Budget Request for FY 2018
Background and Context
Figure 1: U of I Flash Index ........................................................................... 4
Figure 2: Change in Real Gross Domestic Product by State .......................... 5
Figure 3: University of Illinois Direct State Tax Support .............................. 7
Table 1: State of Illinois General Tax Appropriations ................................ 11
Figure 4: University of Illinois Share of State Tax Appropriations ............. 12
Figure 5: State Tax Appropriations Changes by Agency ............................. 13
Figure 6: Cumulative Change in State Tax Appropriations by Selected
Higher Education Sector ............................................................... 13
Figure 7: Cumulative Change in State Tax Appropriation for State
Universities Retirement System (SURS) ...................................... 14
Figure 8: Uses of Reallocated Funds FY 2002 to FY 2017 .......................... 15
Figure 9: Reallocation for Academic Programs FY 2002 to FY 2017 ......... 16
Figure 10: Direct State Support Per Tuition Dollar FY 1970 to FY 2017 ...... 17
Capital Budget Request for FY 2018
Background and Context
Table 1: History of Recent Capital Budget Actions
FY 2012 to FY 2017 Governor’s Level .......................................... 3
Summary of FY 2018 Priorities
Table 2: FY 2018 Combined Capital Budget Request Summary
by Priority ....................................................................................... 4
Table 3: FY 2018 Combined Capital Budget Request Summary
by Category and Campus ................................................................ 5
Priorities
Table 4: Repair and Renovation Projects by Campus ................................... 6
Operating
Budget
Request for
FY 2018
Capital
Budget
Request for
FY 2018

LIST OF FIGURES
November 2016 Page v
FY 2018 Budget Request Addenda
Retirement
Table 1: PA 96-0889 – Applicable to SURS Participants ............................. 4
Ensuring Access–Financial Aid
Table 2: Federal Pell Grants and Illinois Monetary Award Program
Maximum Award Levels................................................................. 9
Figure 1: Supplemental Financial Aid Expenditures
FY 2008 to FY 2017 ..................................................................... 10
Figure 2: Undergraduate PELL, MAP, SEOG, and UI Supplemental Aid ... 11

BACKGROUND AND CONTEXT

November 2016 Page 1
BACKGROUND AND CONTEXT
Higher education in the United States is uniquely positioned to help the nation face
some of its most pressing issues. Through its various economic, social and
intellectual outcomes, higher education is the key to a vibrant economy and society.
President Obama has acknowledged higher education’s role in the country’s future
by setting a goal of having the world’s largest share of college graduates by 2020.
Great public universities across the United States with their vast enrollments,
research discoveries, health and outreach services and other functions have never
been more important to the nation’s future. The University of Illinois is one such
institution that will continue to have a significant impact in the state, nation and
across the globe.
The University of Illinois System is uniquely diverse, consisting of a traditional
flagship university, an urban university, a hospital and health sciences system and a
small liberal arts university in the state’s capital. The Urbana-Champaign, Chicago
and Springfield universities all perform their traditional teaching and learning
missions well, serving constituents throughout the state. Each university also has
distinct research strengths: Urbana with its science, agriculture, cutting-edge
technology, engineering and interdisciplinary projects; Chicago with its medical,
health professions and urban research initiatives; and Springfield with its public
policy, political and media strengths.
The greatest challenge faced by the University of Illinois is one of maintaining the
highest standards of quality while at the same time keeping access affordable. This
same challenge can be found at public institutions across the country. In many
states, the challenge has been exacerbated by a weakened economy and mounting
pressures on state budgets. This document represents a budget plan for FY 2018 that
will help the University of Illinois address this challenge and ensure that we
continue to achieve our most important goals.
The University of Illinois has remained exceptionally productive in the face of its
challenges, enrolling over 81,000 students and producing 20,900 graduates in 600
degree programs annually. More than 8,500 students annually earn University of
Overview
The University of
Illinois: World-class
University, statewide
impact.
BACKGROUND AND CONTEXT
November 2016 Page 2
Illinois advanced degrees—master’s degrees, MBAs, law degrees, health discipline
degrees, veterinary medicine degrees and doctorates—from the three universities.
In addition to enrolling students from all over the state, the University of Illinois also
makes a statewide impact through its Cooperative Extension and health care
services. Cooperative Extension, based at UIUC’s College of Agriculture,
Consumer and Environmental Sciences (ACES), offers educational programs in
every county in the state. Programs fit into five broad areas: healthy society; food
security and safety; environmental stewardship; sustainable and profitable food
production and marketing systems; and enhancing youth, family and community
well-being.
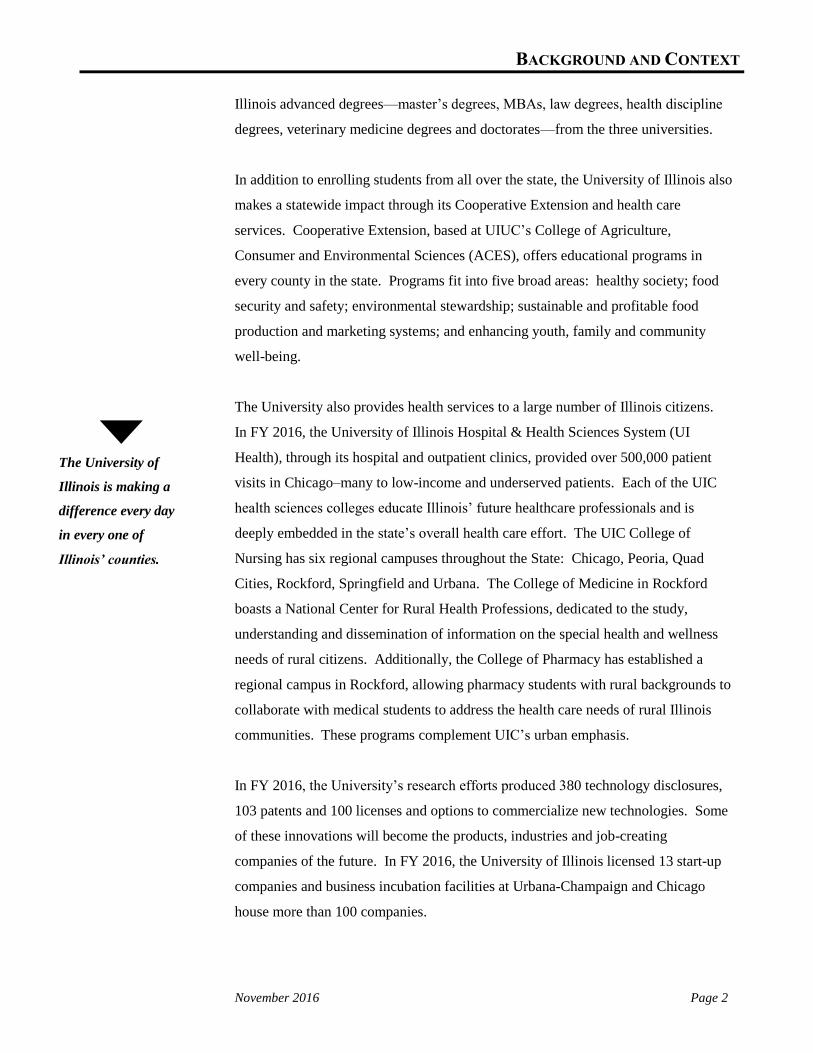
The University also provides health services to a large number of Illinois citizens.
In FY 2016, the University of Illinois Hospital & Health Sciences System (UI
Health), through its hospital and outpatient clinics, provided over 500,000 patient
visits in Chicago–many to low-income and underserved patients. Each of the UIC
health sciences colleges educate Illinois’ future healthcare professionals and is
deeply embedded in the state’s overall health care effort. The UIC College of
Nursing has six regional campuses throughout the State: Chicago, Peoria, Quad
Cities, Rockford, Springfield and Urbana. The College of Medicine in Rockford
boasts a National Center for Rural Health Professions, dedicated to the study,
understanding and dissemination of information on the special health and wellness
needs of rural citizens. Additionally, the College of Pharmacy has established a
regional campus in Rockford, allowing pharmacy students with rural backgrounds to
collaborate with medical students to address the health care needs of rural Illinois
communities. These programs complement UIC’s urban emphasis.
In FY 2016, the University’s research efforts produced 380 technology disclosures,
103 patents and 100 licenses and options to commercialize new technologies. Some
of these innovations will become the products, industries and job-creating
companies of the future. In FY 2016, the University of Illinois licensed 13 start-up
companies and business incubation facilities at Urbana-Champaign and Chicago
house more than 100 companies.
The University of
Illinois is making a
difference every day
in every one of
Illinois’ counties.

BACKGROUND AND CONTEXT
November 2016 Page 3
Appropriately for a university located in a state capital, the University of Illinois at
Springfield brings a living-laboratory approach to the public policy and politics that
dominate the city. Many of UIS’s faculty and staff have long ties to state
government and media and function as policy experts and media contacts throughout
the state and beyond. The University of Illinois also houses the Institute of
Government and Public Affairs (IGPA) with policy and political experts at all three
universities.
The Illinois Fire Service Institute at UIUC offers on-campus and online instruction
and certifications for the state’s fire fighters. Courses offering college credits range
from fire-fighting basics to rescue techniques to homeland security and weapons of
mass destruction response. In 2015, the Illinois Fire Service Institute provided
training to more than 66,900 firefighter students from all 102 counties–training that
translates into lives saved and property damage minimized throughout the state.
The University of Illinois employs over 29,300 FTE and provides an annual direct
and indirect economic impact of $13.9 billion. This economic impact is associated
with 175,000 jobs. The university spends over $5.6 billion on payroll, supplies and
services. For every dollar the State of Illinois contributes to the University of
Illinois an additional $17 is infused into the state’s economy.
The University of Illinois is a treasure for our state and its people. But it is a
dynamic treasure, seeking to transform lives through the power of education in an
ever-changing environment and for an increasingly diverse population. Ultimately
the greatest impact of the University of Illinois is on the lives of students. They
learn in our classrooms, interact with our faculty, study in our libraries and
laboratories and graduate to make their own contributions to society. In the face of
new technologies and the forces of globalization, a high quality education is more
important today than ever before, enabling people to achieve their dreams and
change their economic conditions. University of Illinois students help build our
society, shape our culture and fuel our economy. They are the engaged and
informed citizens on whom our democracy depends. The University of Illinois is
also a dynamic treasure because of the original knowledge that it produces and
disseminates. This knowledge is the foundation of the new economy. It is
responsible for new industries that put people to work.
The University of
Illinois is a dynamic
treasure for our State
because of the
transforming power
of education in
people’s lives.

BACKGROUND AND CONTEXT
November 2016 Page 4
As evidenced by its broad scope of impacts, the University of Illinois makes a
difference in the prosperity and quality of life of thousands of Illinoisans every day.
Many of these constituents care deeply about the state of the university and its
future. Stewardship requires that the university’s stakeholders–from trustees,
administrators and faculty to students, alumni and taxpayers–share an unshakable
commitment to the value and the values of public higher education and particularly
to the University of Illinois.
ECONOMIC ENVIRONMENT
The context in which the University of Illinois is requesting funding is important.
The past decade has been a challenging one for the state as measured by the Institute
of Government and Public Affairs’ “Flash Index” in Figure 1.
Figure 1
U of I Flash Index
In 2008 the nation and state began an economic downturn that has been termed the
“Great Recession,” the deepest and most prolonged economic downturn since World
War II. The Flash Index has been relatively steady in recent years. Despite modest
decreases to-date in 2016, the Flash Index still indicates continued economic growth
in Illinois.
90
92
94
96
98
100
102
104
106
108
Source: IGPA, U of I.
Growth
No Growth

BACKGROUND AND CONTEXT
November 2016 Page 5
However, even before the “Great Recession,” Illinois’ economic growth rate was
lower than the national average. State employment has also lagged the national
average; manufacturing employment is 34% below 2000 levels; and although overall
employment increased from 2004 to 2008, we still have not recovered from a sharp
decline in 2009. As shown in Figure 2, trends for the last decade show that Illinois’
Gross Domestic Product has significantly underperformed compared to the national
average. Illinois was even further behind the top five states. While it is possible
that this trend will reverse, there is little evidence of it happening.
Figure 2
Change in Real Gross Domestic Product by State
1997 – 2015
In addition to weak economic growth, the state has also faced another major fiscal
challenge in the form of unfunded pension obligations. The state’s five public
pension systems had unfunded liabilities of over $111 billion at the end of FY 2015
and were estimated to have an asset-to-liability ratio of under 41.9%. Unfunded
liabilities have accumulated primarily as a result of under-funding from the state for
several decades. In March 2010, the General Assembly passed major pension
reform legislation that significantly reduced benefits for new state employees. Even
with these changes, state payments to the retirement system increased significantly
between FY 2011 and FY 2015.
Source: U.S. Bureau of Economic Analysis
*Average of top five performing states.
100
110
120
130
140
150
160
170
180
190
200
Ind
ex
United States
Illinois
Top Five States*

BACKGROUND AND CONTEXT
November 2016 Page 6
In December 2013, the General Assembly passed SB1, which reduced benefits for
current employees. Reductions in state contributions to the pension systems
resulting from this legislation were estimated to be $1.2 billion in FY 2016.
However, in May 2015, the Illinois Supreme Court struck down the legislation. The
uncertainty surrounding the pension reforms not only has important implications for
the state’s budget outlook, but it also creates unique challenges for the University of
Illinois and its efforts to attract and retain world-class faculty and staff.
Illinois’ personal and corporate income tax rates also contribute to uncertainty in the
state’s budget outlook. In January 2011, the state legislature passed an increase in
the personal income tax from 3.0% to 5.0% and an increase from 4.8% to 7.0% in
the corporate income tax rate. This legislation, which also included budgetary
spending limits, had a partial sunset provision for 2015. The sunset of the tax rate
increases led to mid-year rescissions in FY 2015 and has led to a larger state budget
hole for FY 2016. See Addendum I for more retirement information.
THE BUDGET FRAMEWORK
The University of Illinois has faced a harsher financial environment in recent years
than at any time in the last half century. In FY 2015, the original state appropriation
to the University of Illinois from general revenue funds was $662.1 million for day-
to-day operations. This figure included $16.8 million for the Prairie Research
Institute (State Scientific Surveys). Along with student tuition, these funds pay most
faculty and staff salaries and wages; heat, cool and light our buildings; put books in
the libraries; and equip classrooms and instructional labs. These funds are the
foundation for our central missions of teaching, research, public service and
economic development.
In FY 2016, public institutions operated over half of the fiscal year with no state
appropriation. While higher education institutions have been dealing with delayed
payments for a number of years, the impasse in FY 2016 presented a new set of
challenges. Institutional leaders, students, faculty and staff faced an unprecedented
level of uncertainty in funding levels. A “stopgap” appropriation was finally passed
in May 2016, and the University of Illinois received $180 million. This stopgap
amount for FY 2016 represented only 27.8% of final FY 2015 state support.
Redirection of
existing resources to
meet high priority
funding needs is an
integral and ongoing
part of the
University’s annual
budget process.

BACKGROUND AND CONTEXT
November 2016 Page 7
Through the challenges in recent years, university administrators and faculty have
worked closely with the Board of Trustees to address key issues of resource
management, administrative reorganization, tuition and financial aid policies. Even
as education is often cited among the state’s highest budget priorities, an
examination of direct state tax appropriations as shown in Figure 3 reveals that the
University of Illinois’ share of the state budget today is well below its position prior
to the income tax increase of 1989-1990.
Figure 3
University of Illinois
Direct State Tax Support
(In FY 2017 Estimated CPI Dollars)
As historical perspective, the economic environment and outlook for state revenues
changed dramatically in FY 2002. From FY 2002 to FY 2005, the direct general tax
appropriation from the state declined by more than 16%, representing a loss of $130
million. In addition, consecutive years of mid-year rescissions totaled more than
$75 million. Spending authority was again reduced mid-year in FY 2009 by $18.6
million. Although FY 2010 appropriations restored the FY 2009 mid-year cut (with
support from federal stimulus funds of $45.5 million), the university’s budget was
reduced $46.4 million (6.2%) in FY 2011 when federal stimulus funding expired, $8
million (1.1%) in FY 2012, $42.5 million (6.2%) in FY 2013 and $1.4 million in
FY 2015. An additional $14.9 million mid-year reduction was enacted for FY 2015.
$100
$300
$500
$700
$900
$1,100
1965 1980 1990 2000 2002 2010 2015 2016 2017
Do
lla
rs i
n M
illi
on
s
Footnote: FY 1965 does not include UIS, all other years include UIS. FY 2002 and FY 2015 at original appropriation amount. FY 2010, FY 2015, andFY 2017 include transfer of State Surveys; FY 2010 and FY 2015 exclude health insurance redirection.
BACKGROUND AND CONTEXT
November 2016 Page 8
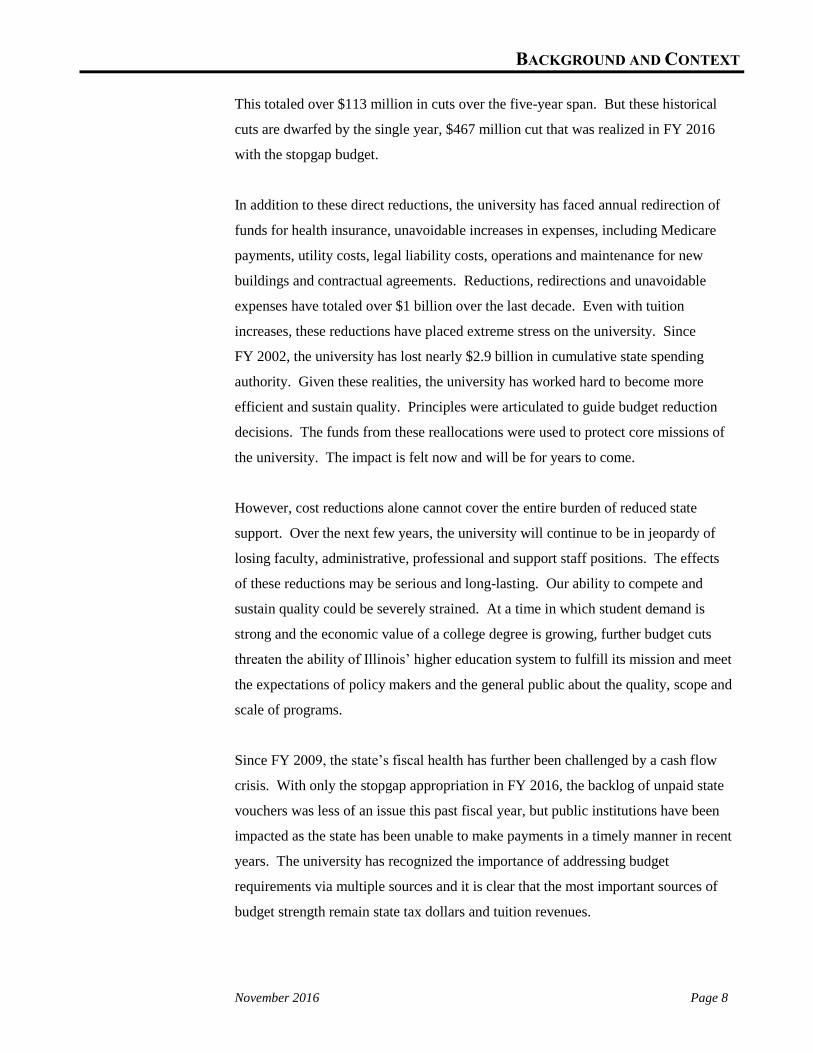
This totaled over $113 million in cuts over the five-year span. But these historical
cuts are dwarfed by the single year, $467 million cut that was realized in FY 2016
with the stopgap budget.
In addition to these direct reductions, the university has faced annual redirection of
funds for health insurance, unavoidable increases in expenses, including Medicare
payments, utility costs, legal liability costs, operations and maintenance for new
buildings and contractual agreements. Reductions, redirections and unavoidable
expenses have totaled over $1 billion over the last decade. Even with tuition
increases, these reductions have placed extreme stress on the university. Since
FY 2002, the university has lost nearly $2.9 billion in cumulative state spending
authority. Given these realities, the university has worked hard to become more
efficient and sustain quality. Principles were articulated to guide budget reduction
decisions. The funds from these reallocations were used to protect core missions of
the university. The impact is felt now and will be for years to come.
However, cost reductions alone cannot cover the entire burden of reduced state
support. Over the next few years, the university will continue to be in jeopardy of
losing faculty, administrative, professional and support staff positions. The effects
of these reductions may be serious and long-lasting. Our ability to compete and
sustain quality could be severely strained. At a time in which student demand is
strong and the economic value of a college degree is growing, further budget cuts
threaten the ability of Illinois’ higher education system to fulfill its mission and meet
the expectations of policy makers and the general public about the quality, scope and
scale of programs.
Since FY 2009, the state’s fiscal health has further been challenged by a cash flow
crisis. With only the stopgap appropriation in FY 2016, the backlog of unpaid state
vouchers was less of an issue this past fiscal year, but public institutions have been
impacted as the state has been unable to make payments in a timely manner in recent
years. The university has recognized the importance of addressing budget
requirements via multiple sources and it is clear that the most important sources of
budget strength remain state tax dollars and tuition revenues.

BACKGROUND AND CONTEXT
November 2016 Page 9
The University of Illinois has done what it can to manage this crisis by enacting
measures to save resources and postpone payments as long as possible. However,
ongoing financial commitments must be met. Without timely funding of our
appropriations, we will be forced to take even more drastic actions that will diminish
the educational opportunities of our students and our service to the people of Illinois.
Still, no amount of cutting and sacrifice can make up for the absence of state
appropriation payments. Direct state support now represents less than one-fourth of
the university’s total operating budget, but in combination with tuition revenue,
represents virtually the entire funding for instructional programs. The University of
Illinois cannot sustain, let alone enhance, its quality without a firm foundation of
strong and reliable state support.
The university’s budgeting process is further complicated by the “Truth in Tuition”
Act that was signed into law in 2003. The purpose of the legislation was to help
students and families plan for college by providing certainty on tuition costs.
Guaranteed tuition applies to all undergraduate students enrolled in a baccalaureate
degree program at the University of Illinois or one of the other nine public
universities in the state. The plan treats every undergraduate student as part of a
cohort defined by the date of entry to the university and each cohort is guaranteed an
unchanged tuition schedule for four years.
In spring 2011, the legislature also passed a bill that mandates the introduction of
performance based funding for the state’s public higher education institutions. The
Illinois Board of Higher Education (IBHE) was tasked with developing this new
budgeting system. A steering committee that was assembled in July 2011 identified
the key metrics and proposed a funding model that was first implemented into the
FY 2013 budget. During the FY 2016 and FY 2017 budget cycles, IBHE developed
performance funding metrics; however, they did not appear to be used in the stopgap
and bridge appropriations. It is not known at this time how or to what extent
performance funding will be used in the future.
Through budget uncertainty and complexity, attention has understandably been
focused on the immediate and unavoidable problems that the budget reductions
present. However, it is even more critical for university leaders, legislative leaders
and the executive branch to assess the long-term impact of these cuts. Illinois’

BACKGROUND AND CONTEXT
November 2016 Page 10
ability to compete effectively in an information-age economy depends on a healthy,
vibrant and robust system of higher education.
FY 2017 BUDGET OUTCOMES
On June 30, 2016, the legislature passed a “bridge” budget for FY 2017, intended to
fund public universities through December 31st. The University of Illinois received
$350.1 million in the FY 2017 bridge budget, which is 54.2% of the final FY 2015
appropriation. While the bridge budget provides some stability for the first 6
months of the fiscal year, it is inadequate to fund the University for the entire year.
The University of Illinois and the state’s other public universities will need the
legislature to appropriate additional funding for the remainder of the fiscal year. To
further alleviate the concerns associated with appropriation uncertainty, it would
greatly benefit the University to return to a budget process in FY 2018 and beyond
that included stable and appropriate levels of funding approved prior to the
beginning of the fiscal year.
Tuition revenues will increase modestly in FY 2017 with the incoming cohort of
students paying a higher rate than the graduating cohort, even with a tuition freeze
for incoming students. Cohort-specific tuition rates result from Illinois’ guaranteed
tuition law. In addition, it is expected that additional internal reallocations will be
redirected in FY 2017. Continued internal reallocations will allow the university to
address its most pressing needs.
A $31 billion state capital budget was passed in FY 2010. It funded the first new
capital projects since FY 2003. The capital bill included projects at all three
universities as well as repair and renovation funding for existing facilities. Several
of those projects from the FY 2010 bill have been completed although there are still
projects in the balance. The aforementioned “bridge” budget passed on June 30,
2016 did include reappropriations for the Integrated Bioprocessing Lab at Urbana,
the Dentistry Modernization at Chicago and various smaller repair and renovation
projects. However, not included in the bill were reappropriations for the Public
Safety Building at Springfield, the Advanced Chemical Technologies Building at
Chicago and the remaining repair and renovation projects.
Achieving salary
competitiveness for
all employees
remains a top
priority for redirected
funds.

BACKGROUND AND CONTEXT
November 2016 Page 11
The following tables and figures illustrate the changes in funding that higher
education has experienced in the recent past. The state faces many legal mandates
and entitlements that require increased funding now and in the future. In short, there
are more priorities for state funding than available resources. The result has been
limited available funds for direct appropriations to public universities. Table 1
illustrates that the budget share for higher education has dropped substantially in
recent decades.
In the past three decades, budget shares for other human and social services have
risen sharply. Just before the 1989-1990 tax increase, the state invested almost
identical shares of its budget in higher education (13.1%) and the combined set of
major human service agencies, which includes children and family services, human
services and corrections (12.9%). By FY 2000, this relationship had changed
dramatically, and although the major human service agencies have seen reductions
in recent years, higher education continues to see declines.
Table 1
State of Illinois General Tax Appropriations
(Percent Share of the Total)
Higher education tax
appropriation
increases have
lagged those of the
major social and
human services since
FY 2000, after
accounting for
inflation.
Elementary/ Higher DCFS, Human Services, All
Year Secondary Education & Corrections DHFS Other
1980 28.8% 12.9% 10.7% 33.8% 13.7%
1989 24.9% 12.0% 12.3% 31.5% 19.3%
1990 26.7% 13.1% 12.9% 30.7% 16.6%
2005 30.0% 9.6% 24.8% 22.1% 13.5%
2010 31.3% 8.3% 22.6% 23.2% 14.6%
2011 31.8% 9.4% 20.4% 22.2% 16.2%
2012 31.6% 9.5% 18.5% 23.0% 17.4%
2013 30.8% 10.5% 17.6% 22.2% 18.9%
2014 32.4% 10.3% 16.4% 23.1% 17.8%
2015 32.8% 10.6% 17.4% 21.2% 18.0%
2016* 32.9% 9.3% 16.4% 23.6% 17.8%
2017* 32.0% 9.1% 17.6% 25.5% 15.8%
Note: FY10 - FY11 include the allocation of pension bonds for comparison purposes.
*FY 2016 Estimated Expenditures and FY 2017 Recommended Appropriation
from FY 2017 Governor's Budget Book. Full Appropriations not enacted for FY 2016 and FY 2017.

BACKGROUND AND CONTEXT
November 2016 Page 12
As a result of higher education’s declining share of general tax appropriations,
Figure 4 illustrates that the budget share for the University of Illinois has dropped
substantially as well. Prior to the income tax increase of 1989-1990, the University
of Illinois share of total state tax appropriations was 4.4%.
Figure 4
University of Illinois
Share of State Tax Appropriations
Changes in tax support among state agencies are further demonstrated by the trends
shown in Figure 5, which illustrate tax funding shifts for state agencies since
FY 2000 after appropriations are adjusted for inflation. Elementary/secondary
education has experienced a large boost in recent years while Higher Education
continues to lag the state average.
0.0%
0.5%
1.0%
1.5%
2.0%
2.5%
3.0%
3.5%
4.0%
4.5%
5.0%
Note: FY02-FY15 exclude $45 million in payments to CMS from Universities for Health Insurance.FY09-FY17 excludes transfer of State Scientific Surveys.
1.1%

BACKGROUND AND CONTEXT
November 2016 Page 13
Figure 5
State Tax Appropriations Changes by Agency
Unfortunately, higher education has seen the gains from the late 1990s and early
2000s completely eroded. Tax support has varied dramatically within the four
largest segments of the higher education budget, (Community Colleges, ISAC,
SURS and Universities) three of which are shown in Figure 6, again adjusted for
inflation.
Figure 6
Cumulative Change in State Tax Appropriations
by Selected Higher Education Sector
Within the higher
education budget,
appropriations for
SURS have captured
a significant share of
the funding since
FY 2000 after
accounting for
inflation.
-30%
-15%
0%
15%
30%
45%
60%In Constant 2017 Dollars (CPI)
Human Services
Elementary/Secondary
Higher Education
All Other
State Average
-6.7%
6.1%
-12.8%
22.9%
29.0%
Note: FY02 - FY17 exclude $45 million from higher education for Health Insurance payment to CMS; Health Insurance funding moved from DHFS back to CMS in FY12; FY04-FY12 adjusted to reflect the change. FY13-FY17 higher education includes budget for state surveys. FY 2017 based on Governor's budget as Introduced. FY 2016 reflects Estimated Expenditures.
-90%
-80%
-70%
-60%
-50%
-40%
-30%
-20%
-10%
0%
10%
-64.7%
-74.5%-72.4%
In Constant 2017 Dollars (CPI)
ISAC
Community Colleges
Universities
Note: FY02 - FY15 exclude $45 million from higher education for Health Insurance payment to CMS. SURS: FY05 - FY17 include State Pension Fund; FY10 & FY11 SURS includes full funding from pension bonds.FY13-FY17 higher education includes funding for state surveys. FY 2017 based on Bridge Appropriation.

BACKGROUND AND CONTEXT
November 2016 Page 14
The most significant factor within the four largest segments of the higher education
budget (Community Colleges, ISAC, SURS and Universities) is the dramatic growth
in State Universities Retirement System (SURS) funding between FY 2000 and
FY 2017 when adjusted for inflation as shown in Figure 7.
Figure 7
Cumulative Change in State Tax Appropriation for
State Universities Retirement System (SURS)
Responding to legislation setting out a multi-year plan to bring SURS support in line
with its obligations to employees, SURS received a significant and essential budget
boost to preserve the strength of the retirement program serving higher education.
The 1995 “catch-up” law combined with the bond sale created a very large pension
funding obligation that, along with rising Medicaid and other program costs, has
posed a severe challenge to the state for the past decade.
BUDGET TRENDS IN PERSPECTIVE: REALLOCATION
For the University of Illinois, the early 1990s brought diminished direct state tax
support with two years of outright reductions in combination with general tuition
increases held to the level of inflation. What has changed substantially from the
earlier period has been the university’s determination to redirect resources internally.
In earlier times, reallocations might have been made on an ad hoc basis to
accommodate declining support, but with the expectation that the next year’s
-40%
0%
40%
80%
120%
160%
200%
240%
280%
320%
360%
400%
440%
480%In Constant 2017 Dollars (CPI)
.
441.3%SURS
Note: FY02 - FY15 exclude $45 million from higher education for Health Insurance payment to CMS. SURS: FY05 - FY17 include State Pension Fund; FY10 & FY11 SURS includes full funding from pension bonds.FY13-FY17 higher education includes funding for state surveys. FY 2017 based on Bridge Appropriation.

BACKGROUND AND CONTEXT
November 2016 Page 15
funding from the state would improve. Now, however, the university has a renewed
emphasis on the importance of adopting long-term budget planning strategies that
include redirection of existing resources as an integral component augmenting tax
and tuition support.
As has already been emphasized, the university responded to its decline in budget
share primarily through a comprehensive review of academic and support programs
and priorities with a corresponding reallocation of existing funds. Figure 8
illustrates the size of the reallocations accomplished annually since FY 2000 and
identifies the principal uses of reallocations each year.
Figure 8
Uses of Reallocated Funds
FY 2002 to FY 2017
(Dollars in Millions)
Among academic program reallocations, faculty recruitment, retention efforts and
academic programs have received the largest percentage of funds from the
reallocation pool, including special salary initiatives, laboratory remodeling and
upgrades, equipment purchases and other improvements. As reflected in Figure 9,
library initiatives, recruitment of underrepresented groups and campus
computerization efforts round out the major categories of program reallocations.
The University’s
reallocation efforts
are often focused on
gaining efficiencies
in its administrative
services.
$0
$50
$100
$150
$200
$250
$300
$350
$400
$450
$500
2002 2003 2004 2005 2006 2007 2008 2009 2010 2011 2012 2013 2014 2015 2016 2017
Compensation Improvement Support Programs Academic Programs Budget Reductions
$54.9$48.4
$79.5
$62.4
$32.4 $37.5$28.0
$40.0
$18.4
$53.8
$22.3$18.5 $16.9$27.3
$467.7
$281.7

BACKGROUND AND CONTEXT
November 2016 Page 16
Figure 9
Reallocation for Academic Programs
FY 2002 to FY 2017
(Dollars in Millions)
The university’s reallocation efforts are often focused on gaining efficiencies in its
administrative services. In FY 2009 and FY 2010, the university embarked on a
three-year plan to reduce administrative costs by $15.05 million, half within
University Administration and the other half spread across the three universities.
It should be understood, however, that investments in administrative services will
still be required in order to improve business processes, meet compliance and
regulatory requirements and respond to needs of new academic initiatives. Going
forward, the fiscal pressures on the university resulting from reduced state
appropriations and cost increases will be substantial and impossible to manage
without a more disciplined approach to allocating resources and setting priorities for
investments.
BUDGET TRENDS IN PERSPECTIVE: TUITION
Since FY 1980, tuition revenue has become a much more visible component of the
university’s total appropriated funds budget as students and their families have been
asked to share the burden of offsetting declining state support. In the 1990s,
Under Represented
Groups$2.1
Library $6.6
Undergraduate Instruction
$1.6
Campus Computerization
$9.1
Faculty Recruitment and Retention
$24.9
Academic Programs
$21.9

BACKGROUND AND CONTEXT
November 2016 Page 17
however, general tuition increases remained at approximately the level of the
consumer price index. As illustrated in Figure 10, over forty-six years ago the
university received more than $12 in direct state tax support for each dollar of
tuition revenue it collected from students.
Figure 10
Direct State Support per Tuition Dollar
FY 1970 to FY 2017
UNIVERSITY STRATEGIC FRAMEWORK
In May 2016, the University of Illinois Board of Trustees approved a Strategic
Framework that will serve as a roadmap for the University’s future. The framework,
titled “The public’s university: Optimizing impact for the public good,” sets
collective priorities of the University of Illinois System and each of its three
universities. The Framework pledges to organize University resources around four
strategic pillars:
I. An Institution of and for Our Students
Our world-class faculty, and the many staff members who support them, are
entrusted with critical and enormously rewarding responsibilities to: expand our
students’ understanding of life and work; equip them to be civic-minded, resourceful
$0
$2
$4
$6
$8
$10
$12
$14
1970 1980 1990 2000 2005 2010 2011 2012 2013 2014 2015 2016 2017
12.8 to 1
8.6 to 1
4.5 to 1
2.9 to 1
1.5 to 1
FY09 - FY15 exclude survey transfer and survey spec appropriation lines. FY02-15 excludes health insurance re-direction to CMS. FY16 excludes survey specific appropriation lines and no adjustment for CMS. FY17 excludes survey specific appropriations but includes full bridge funding (no adjustment for CMS).
0.8 to 11 to 10.7 to 1 0.6 to 1 0.6 to 1 0.6 to 1
0.2 to 1 0.3 to 1

BACKGROUND AND CONTEXT
November 2016 Page 18
problem-solvers; broaden their appreciation of culture, history and the arts; and
prepare them to leave our institution ready to contribute to society. The success of
the University of Illinois System in fulfilling this commitment can be seen in the
lives of our nearly 700,000 alumni around the world. They are members of local
school boards and heads of state; they are small business owners and lead central
banks of some of the world’s largest economies; they teach our children and care for
those who are ill and vulnerable; they open up our perspectives with their
inventiveness and creativity.
II. Research and Scholarship with Global Impact
The University of Illinois System is a powerhouse of discovery, problem solving,
innovation and creative production. We have given the world the graphical web
browser that led to exponential growth in Internet use; created an affordable,
accessible treatment for multidrug-resistant HIV that has saved countless lives
worldwide; and exonerated the wrongly convicted and imprisoned through our
Innocence Project. The awards our scholars have won, their reputation in
professional academies and the recognition accorded them worldwide affirm the
excellence and power of the System’s people and ideas.
III. A Healthy Future for Illinois and the Midwest
As The Public’s University, we are committed to serving the people and industries
across Illinois. We already provide pathways for transformation and opportunity by
virtue of our academic excellence and our role as a major healthcare provider. But
as the state’s economy and demographics continue to change, the University of
Illinois System’s approach to economic development must evolve as well. At the
same time, we have the opportunity to take on a leadership role among other
Midwestern institutions in reinvigorating the region’s economy, making it an
international magnet for investment and talent.
IV. Tomorrow’s University Today
The traditional models of public higher education are being challenged as never
before. State funding has become more uncertain at just the time that more is being
expected of public universities. The higher education marketplace has become more
competitive and more global. Policy makers and public officials as well as students
and families are raising serious and appropriate questions about the escalating cost

BACKGROUND AND CONTEXT
November 2016 Page 19
of college, unacceptable levels of student debt, the readiness of graduates to enter a
rapidly changing workplace and the management practices employed at every level
of the academic enterprise. It is our duty as the University of Illinois System to offer
the best possible return on investment for all our stakeholders and to ensure that we
are efficient, competitive and constantly improving. In doing this, we must
aggressively promote our reputation as a leading global brand in higher education
and a preeminent destination for the world’s best students and scholars.
For more information on each of these pillars and the overall strategic planning
process at the University, visit the Strategic Framework website here:
https://www.uillinois.edu/strategic_framework.
SUMMARY OF THE FY 2018 BUDGET REQUEST
The university’s FY 2018 operating budget request is to restore core state support to
original FY 2015 appropriation levels, $662.1 million, in order to protect our in-state
students, guarantee our overall academic competitiveness and aid the State in
economic development.
We continue to strategically reassess the scope of our academic programs and search
for opportunities to consolidate or even reduce offerings. In the process, we must
protect our core land-grant missions of teaching, research, public service and
economic development, including clinical care. We must also remain competitive
for faculty, staff and students; maintain essential services, but eliminate duplicate
and lower priority activities; consolidate and share services and resources; make
efficient use of facilities; and take other steps necessary to sustain the university’s
quality and continuity of operations.
We are challenged more seriously today than at any time during the last half century.
By working together and making the right decisions we can ensure that Illinois
higher education and the University of Illinois remain respected national leaders for
the quality of programs they provide and for the diversity of students served. By
increasing state support at a steady level, the University of Illinois can focus on
preserving the core missions of teaching, research, public service and economic
development.

MEDICAID SUPPORT−
UI HEALTH SYSTEM
November 2016 Page 20
MEDICAID SUPPORT – UI HEALTH SYSTEM
($25,000,000)
The University of Illinois Hospital and Health Sciences System (UI Health), through
its hospital, clinics and seven health sciences colleges is a significant contributor to
the healthcare needs of the state of Illinois. Through its partnerships with
government, industry, community organizations and other academic institutions
throughout the state, UI Health fosters economic growth and collaboration by
leveraging University and regional strengths. In addition to delivering direct patient
care, the system serves as a laboratory where tomorrow’s healthcare professionals
are trained and where cutting edge health research is conducted. In order to ensure
that every citizen of Illinois has access to world-class healthcare and to grow the
capacity to produce skilled providers to meet the healthcare needs of the State and
nation, the University is requesting additional support.
UI Health is the only state-owned health care provider in Illinois, with over 500,000
patient visits annually, treating some of the state’s most vulnerable populations. The
health system has a history of providing innovative and state-of-the-art procedures.
It was one of the first hospitals in the Chicago area to offer minimally invasive
technology for treating brain aneurysms and it was one of the first institutions in the
nation to perform a robotic-assisted surgery.
The UI Health System is also marked by its excellence in health education, research
and training. UI Health emphasizes translating scientific discoveries into better
health for the people of Illinois, such as new medications and treatments that are
now part of standard clinical practice. The seven health sciences colleges
collectively generate over $150 million in federal research funding annually. In
Illinois, one in three pharmacists, more than 40 percent of dentists, 20 percent of
nurses and one in six physicians are graduates of the University of Illinois. The UIC
College of Medicine is the largest and one of the most diverse medical schools in the
nation and trains approximately 2,200 medical students. Physicians trained at the
UIC College of Medicine, the largest medical school in the country, practice in
nearly every Illinois county.
Overview

MEDICAID SUPPORT – UI HEALTH SYSTEM
November 2016 Page 21
UI Health currently faces significant challenges in meeting the healthcare needs of
the state. The Patient Protection and Affordable Care Act (ACA) significantly
increased the number of people with access to health services, including more than
600,000 Illinois residents who newly enrolled in Medicaid. Providing high quality
care to these patients–some of whom are highly vulnerable and many of whom
struggle to access care elsewhere–is a core part of our mission and more UI Health
patients are enrolled in Medicaid than in any other type of insurance. We request
financial support to ensure adequate, high quality care for this vulnerable population.
Recurring State support of $25 million per year is being requested to be used to
reimburse UI Health for hospital and pharmacy services, reimburse practitioners
employed by UI Health and to secure federal matching funds for Medicaid as a
result of services provided by UI Health.

CAPITAL BUDGET REQUEST
FOR FY 2018

November 2016 Page 1
BACKGROUND AND CONTEXT
To begin consideration of the University’s capital budget request it is important to
recall that an institution of the size, scope and complexity of the University of
Illinois faces a recurring array of facilities related needs every year. The capital
facilities make up the University’s largest asset and provide the foundation to attract
and retain top quality, faculty, staff and students. As buildings age through their
normal life cycles, it is crucial to address minor repair and renovation needs as they
occur. Failure to do so accelerates deterioration and leads to costly major
remodeling requirements more quickly than would be necessary if prudent attention
to annual repair and renovation were possible. Changing programmatic emphases in
academic units also create the need for relatively small remodeling projects which
can be addressed quickly to make existing space more useful for emerging academic
priorities. Toward that end the University is coming off of several fiscal years with
a limited capital budget appropriation.
Consistent and steady funding patterns are supremely important to maintain the
physical plant. Fiscal year 2010 did see a budget approved by the Governor and
General Assembly which provided a capital appropriation to the University that
included funds for repair and renovation. However, the recent budget freeze on
capital has impacted several repair and renovation projects contributing to the
inconsistent funding pattern that has only exacerbated the deferred maintenance
problem while making it more difficult to reduce it in the future. The state’s
contribution in reducing the level of deferred maintenance on the campuses is an
integral part of the funding plan toward that end. Several years without that piece of
the funding solution leaves the University in the proverbial two steps forward and
one step back position.
Based on these factors, the University has again placed the repair and renovation
request of $60 million at the top of the capital request list. Along with that request
the University continues to utilize the Academic Facilities Fund Assessment coupled
with prior issues of Certificates of Participation in order to jump start the reduction
of deferred maintenance on each campus. However, the state portion of the funding
Overview

CAPITAL BUDGET BACKGROUND AND CONTEXT
November 2016 Page 2
tool is still critical and frankly without the state support, reduction in deferred
maintenance will be severely curtailed.
Buildings and the infrastructure systems which support them have finite useful lives.
Roofs deteriorate; heating, ventilating and cooling systems wear out; masonry
decays; and so on. At a certain point major remodeling is required to extend the
useful life of every University facility constructed and every annual capital budget
request will contain a share of major remodeling projects, usually in the cost range
of $20 million to $85 million. Major remodeling projects can also result from the
need to enlarge the capacity of a building, change its functional use, upgrade or
extend campus wide infrastructure systems. For example, as technological advances
have accelerated over the past two decades and computers are now an integral part
of almost every phase of instruction and research activity, the need to expand
electrical and cooling capacity for individual buildings and for entire campuses has
grown dramatically.
At times, buildings may outlive their usefulness for the purposes for which they
were originally constructed, but with remodeling and renovation, can be refitted for
other, usually less complex uses. This is particularly true for research facilities more
than 40 or 50 years old. The cost to upgrade building systems to current state-of-
the-art standards for today’s research and instructional programs is usually greater
than new construction costs for the same type of space.
From time to time, the University will require construction of completely new
facilities to replace outmoded buildings that have gone beyond their useful lives, to
expand significantly the scope of an existing program or to begin new program
initiatives. Land acquisition may also be required to address such needs. Due to the
extraordinary length of time required to move from initial determination that a new
facility is required, through planning, appropriation and construction phases to the
point at which a new building is actually in use (often a minimum of six years), each
annual capital request from the University may have a few new building requests at
various priority rankings.
It is important to reemphasize the recurring nature of these crucial facilities-related
budget requirements which must be addressed on an annual basis. When that is not
CAPITAL BUDGET BACKGROUND AND CONTEXT
November 2016 Page 3
possible, a backlog of unfunded projects grows quickly and accelerates the cycle of
deterioration in facilities which, if not addressed, leads inevitably to deterioration of
academic programs and loss of key faculty and students.
In this context where steady and measured funding increases for facility needs are
vitally important, the last decade of capital budgets has been disappointing. The
FY 2010 capital appropriation did, however, provide some hope as several
University projects were appropriated and released and those projects are now
complete including: Lincoln Hall Remodeling, Electrical and Computer
Engineering, College of Medicine Rockford, along with funding for the NCSA
Petascale project. Other projects from FY 2010 that were released and then frozen
as part of the budget impasse include Integrated Bioprocessing Research Lab (IBRL)
at Urbana-Champaign, Dentistry Modernization and the original FY 2003
appropriation of the Advanced Chemical Technology Building at Chicago, and the
Public Safety Building in Springfield. With this past summer’s stop gap funding
bill, the IBRL and Dentistry projects were re-released but the hold on the Advanced
Chemical Technologies Building and Public Safety Building serve as a reminder of
the unsteady and unreliable funding pattern as it further complicates the capital
delivery process for the universities.
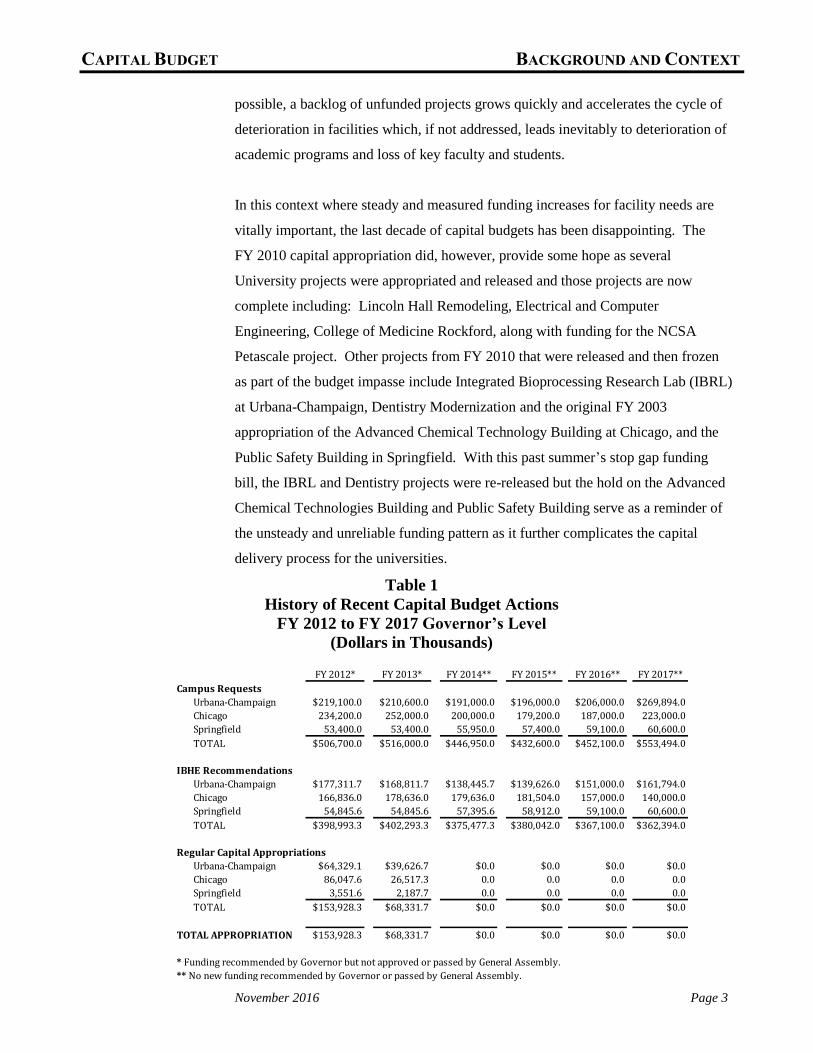
Table 1
History of Recent Capital Budget Actions
FY 2012 to FY 2017 Governor’s Level
(Dollars in Thousands)
FY 2012* FY 2013* FY 2014** FY 2015** FY 2016** FY 2017**
Campus Requests
Urbana-Champaign $219,100.0 $210,600.0 $191,000.0 $196,000.0 $206,000.0 $269,894.0
Chicago 234,200.0 252,000.0 200,000.0 179,200.0 187,000.0 223,000.0
Springfield 53,400.0 53,400.0 55,950.0 57,400.0 59,100.0 60,600.0
TOTAL $506,700.0 $516,000.0 $446,950.0 $432,600.0 $452,100.0 $553,494.0
IBHE Recommendations
Urbana-Champaign $177,311.7 $168,811.7 $138,445.7 $139,626.0 $151,000.0 $161,794.0
Chicago 166,836.0 178,636.0 179,636.0 181,504.0 157,000.0 140,000.0
Springfield 54,845.6 54,845.6 57,395.6 58,912.0 59,100.0 60,600.0
TOTAL $398,993.3 $402,293.3 $375,477.3 $380,042.0 $367,100.0 $362,394.0
Regular Capital Appropriations
Urbana-Champaign $64,329.1 $39,626.7 $0.0 $0.0 $0.0 $0.0
Chicago 86,047.6 26,517.3 0.0 0.0 0.0 0.0
Springfield 3,551.6 2,187.7 0.0 0.0 0.0 0.0
TOTAL $153,928.3 $68,331.7 $0.0 $0.0 $0.0 $0.0
TOTAL APPROPRIATION $153,928.3 $68,331.7 $0.0 $0.0 $0.0 $0.0
* Funding recommended by Governor but not approved or passed by General Assembly.
** No new funding recommended by Governor or passed by General Assembly.
November 2016 Page 4
SUMMARY OF FY 2018 PRIORITIES
($414,439,000)
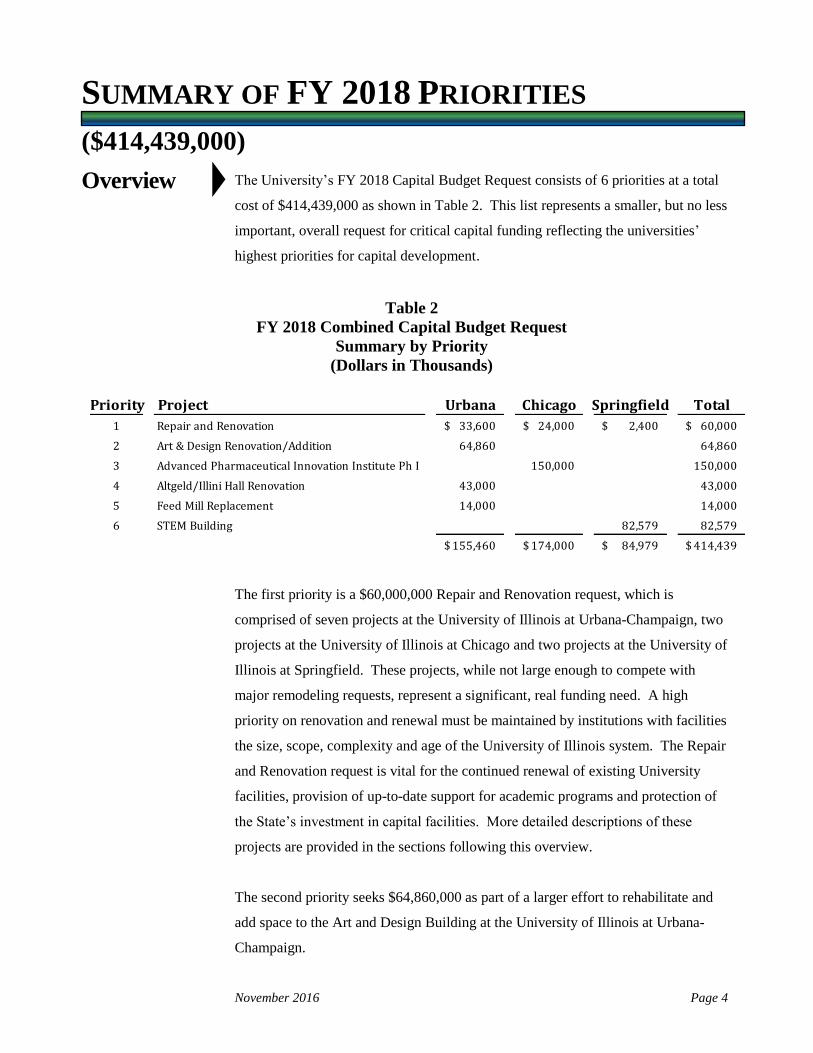
The University’s FY 2018 Capital Budget Request consists of 6 priorities at a total
cost of $414,439,000 as shown in Table 2. This list represents a smaller, but no less
important, overall request for critical capital funding reflecting the universities’
highest priorities for capital development.
Table 2
FY 2018 Combined Capital Budget Request
Summary by Priority
(Dollars in Thousands)
The first priority is a $60,000,000 Repair and Renovation request, which is
comprised of seven projects at the University of Illinois at Urbana-Champaign, two
projects at the University of Illinois at Chicago and two projects at the University of
Illinois at Springfield. These projects, while not large enough to compete with
major remodeling requests, represent a significant, real funding need. A high
priority on renovation and renewal must be maintained by institutions with facilities
the size, scope, complexity and age of the University of Illinois system. The Repair
and Renovation request is vital for the continued renewal of existing University
facilities, provision of up-to-date support for academic programs and protection of
the State’s investment in capital facilities. More detailed descriptions of these
projects are provided in the sections following this overview.
The second priority seeks $64,860,000 as part of a larger effort to rehabilitate and
add space to the Art and Design Building at the University of Illinois at Urbana-
Champaign.
Overview
Priority Project Urbana Chicago Springfield Total
1 Repair and Renovation 33,600$ 24,000$ 2,400$ 60,000$
2 Art & Design Renovation/Addition 64,860 64,860
3 Advanced Pharmaceutical Innovation Institute Ph I 150,000 150,000
4 Altgeld/Illini Hall Renovation 43,000 43,000
5 Feed Mill Replacement 14,000 14,000
6 STEM Building 82,579 82,579
155,460$ 174,000$ 84,979$ 414,439$

CAPITAL BUDGET SUMMARY OF FY 2018 PRIORITIES
November 2016 Page 5
The third priority seeks $150,000,000 for the University of Illinois at Chicago to
create a unique research engine with construction of the Advanced Pharmaceutical
Innovation Institute.
The fourth priority seeks $43,000,000 for the University of Illinois at Urbana-
Champaign campus to renovate Altgeld/Illini Halls.
The fifth priority requests $14,000,000 to construct a new Feed Mill Building at the
University of Illinois at Urbana-Champaign.
The sixth priority seeks $82,579,000 to build a new STEM Building for the
University of Illinois at Springfield.
Table 3 lists the FY 2018 capital budget request by category.
Table 3
FY 2018 Combined Capital Budget Request
Summary by Category and Campus
(Dollars in Thousands)
Urbana-
Category Champaign Chicago Springfield TOTAL
Building, Additions, and/or Structure 14,000$ 150,000$ 82,579$ 246,579$
Land Acquisition
Utilities
Remodeling 141,460 24,000 2,400$ 167,860
Site Improvements
Planning
155,460$ 174,000$ 84,979$ 414,439$
November 2016 Page 6
PRIORITIES
($414,439,000)
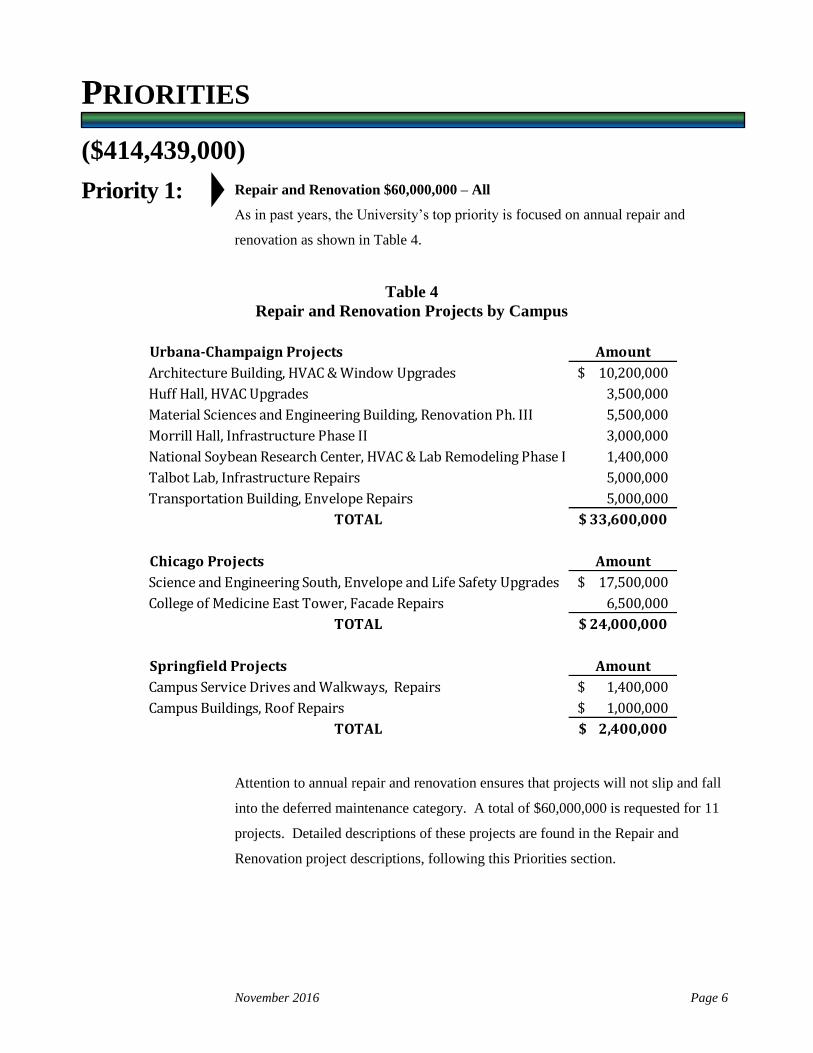
Repair and Renovation $60,000,000 – All
As in past years, the University’s top priority is focused on annual repair and
renovation as shown in Table 4.
Table 4
Repair and Renovation Projects by Campus
Attention to annual repair and renovation ensures that projects will not slip and fall
into the deferred maintenance category. A total of $60,000,000 is requested for 11
projects. Detailed descriptions of these projects are found in the Repair and
Renovation project descriptions, following this Priorities section.
Priority 1:
Urbana-Champaign Projects Amount
Architecture Building, HVAC & Window Upgrades 10,200,000$
Huff Hall, HVAC Upgrades 3,500,000
Material Sciences and Engineering Building, Renovation Ph. III 5,500,000
Morrill Hall, Infrastructure Phase II 3,000,000
National Soybean Research Center, HVAC & Lab Remodeling Phase I 1,400,000
Talbot Lab, Infrastructure Repairs 5,000,000
Transportation Building, Envelope Repairs 5,000,000
TOTAL 33,600,000$
Chicago Projects Amount
Science and Engineering South, Envelope and Life Safety Upgrades 17,500,000$
College of Medicine East Tower, Facade Repairs 6,500,000
TOTAL 24,000,000$
Springfield Projects Amount
Campus Service Drives and Walkways, Repairs 1,400,000$
Campus Buildings, Roof Repairs 1,000,000$
TOTAL 2,400,000$

CAPITAL REQUESTS PRIORITIES
November 2016 Page 7
Art and Design Renovation/Addition $64,860,000 – Urbana
Built in the late 1950s, the Art and Design Building has undergone only minor
repairs and upgrades. The current condition of the building reflects the wear and
tear of 60+ years of continuous use as an administrative, teaching, and research
facility. It suffers from general fatigue and deterioration of comfort and visual
quality. Also during this time, requirements of the School’s disciplines have
undergone dramatic change, creating entirely new functional demands which were
unimagined when the building was conceived. New program and equipment needs
have rendered the original space configuration outmoded, inefficient and ill-suited to
their original purposes. This project will renovate and upgrade the existing facility
and provide an addition to consolidate all functions, activities, and programs into
one facility. Total project budget is $64,860,000 being requested from the state.
Advanced Pharmaceutical and Innovation Institute $150,000,000 – Chicago
The University of Illinois at Chicago is requesting funds to construct a new 250,000
square foot building adjacent and connected to the 1954 College of Pharmacy
building. The vision for the Advanced Pharmaceutical and Innovation Institute will
be to create an interactive environment employing interdisciplinary and
multidisciplinary teams to address fundamental biological and biomedical questions.
This Institute will facilitate a new model for commercializing basic findings and
innovative therapies with international leaders in the pharmaceutical and healthcare
industry. The new facility will: provide new opportunities for innovation in drug
discovery, pharmaceutical product development and personalized medicine; provide
state-of-the-art space for contemporary biomedical research which requires intense
collaborations across different campus disciplines with investigators having unique
and specialized skills; develop a transformative center of research excellence housed
in cutting-edge core facilities that will benefit the entire Institution Drive growth as a
major economic engine for the State of Illinois. The University of Illinois Hospital
& Health Sciences System (UI Health) continues to be a significant resource for
healthcare innovation within the State of Illinois which includes partnerships such as
the Prior Authorization for State Medical Programs and the Medication Review
Program. The Advanced Pharmaceutical and Innovation Institute will create new
jobs and develop new healthcare products and discoveries that will create a
significant economic impact for the State of Illinois. The construction of this
building will allow the expansion of the University’s top-ranked research programs.
Priority 2:
Priority 3:

CAPITAL REQUESTS PRIORITIES
November 2016 Page 8
The College of Pharmacy is consistently ranked among the top five colleges
nationally, and the College of Medicine is one of the nation’s largest and most
diverse medical schools. Total project is estimated at $200,000,000 with
$150,000,000 requested from the state at this time.
Altgeld/Illini Hall Renovation $43,000,000 – Urbana
A comprehensive renovation is desired for historic Altgeld Hall and the 2nd and 3rd
floors of Illini Hall. These spaces serve the Departments of Mathematics and
Statistics, the Mathematics Library, and the campus classrooms in Altgeld Hall. The
project will restore Altgeld and Illini Halls to a level consistent with a world class
academic enterprise. The classrooms must be improved, the library refurbished, and
departmental offices, computer labs and common areas require comprehensive
modernizations. Many ancillary, but essential, infrastructural elements such as
heating, cooling, data technology, roofing, masonry, flooring and windows must be
brought up to modern standards for occupant comfort, safety and progressive
instructional practices. Landscaping will be addressed, as will many deferred
maintenance elements that have been identified in the campus wide facilities
condition audit. Total project budget is $90,000,000 with $43,000,000 being
requested from the state.
Feed Mill Replacement $14,000,000 – Urbana
The Department of Animal Sciences is world renowned for equipping future leaders
in animal production and feed manufacturing industries. This would not be possible
without the cornerstone of their nutrition program, the Feed Processing Facility and
Service Unit. This facility will not only support our world-renowned graduate
programs in animal nutrition, but it will also enhance our ongoing partnerships with
the feed, grain and biofuel industries, and offer opportunities to enhance educational
programs in feed milling and processing. The proposed Feed Processing Facility is
critical to the future training of graduate students in animal nutrition and
management. Graduates with this training are in high demand at this time. The
continuation of these training programs is critical to the development of future
professionals to meet the needs of the feed manufacturing and animal production
industries. Total project cost for this project is $14,000,000 requested from the
State.
Priority 4:
Priority 5:

CAPITAL REQUESTS PRIORITIES
November 2016 Page 9
STEM Building $82,579,000 – Springfield
According to the 2015-16 Annual Report of the Illinois Science and Technology
Institute, seven of the top ten fastest-growing occupations in Illinois are Science,
Technology, Engineering, and Mathematics (STEM) related. In the coming decade,
professional STEM-related jobs in Illinois (including the healthcare professions) are
projected to grow 60% faster than the U.S. average. As STEM fields have become
more important for the Illinois economy they are also important for the colleges that
produce those skill sets and expertise. This demand has served to increase the
computer science majors at Springfield over 500% in the last decade and is directly
related to creation of new majors such as Cybersecurity, Data Analytics,
Environmental Science, and Biochemistry. UIS has also partnered with the UIC
College of Nursing and Memorial Health System in Springfield to offer a Bachelor
of Science in Nursing (BSN) to meet increasing demands from the local healthcare
field, one of the largest employment sectors in Sangamon County.
As the campus continues to grow and add new programs in these areas of study,
there is an acute need for more specialized space for these units and a larger and
more integrated footprint for the programs to collaborate. Currently the Springfield
campus has a 25-year-old building designated the Health Science Building which
houses the departments of Allied Health, Chemistry, and Biology as well as the
University’s Information Technology Services Center. Additionally, Computer
Science, Environmental Science with its GIS lab, and Mathematics are in three
separate buildings–none of which provide ideal facilities for these disciplines.
STEM-focused facilities are designed to spur collaboration and interdisciplinary
learning. STEM teaching methodologies require flexible classrooms, team-based
and active learning studios and collaborative spaces and laboratories that enable
project-based experiments. The new STEM facility will allow UIS to cluster STEM
related programs in one location, providing specialized state-of-the-art laboratories
and flexible spaces fostering interdisciplinary work of the highest quality.
Programs/departments to be housed in the new academic building include:
Computer Science, Mathematics, Chemistry, Biology, Allied Health, and
Environmental Studies. The new building estimated at 130,200 square feet will
include laboratories and collaborative spaces for existing sciences programs but also
specialized laboratories for Cyber and Homeland Security, Computer Forensics,
Priority 6:

CAPITAL REQUESTS PRIORITIES
November 2016 Page 10
Data Analytics, Cyber Innovation, Intelligent Machines and Systems, Game
Programming, Robotics, Biochemistry, and Kinesiology. Having these units in one
facility will not only increase synergies, especially as many of the programs are
interrelated and offer joint degrees, but will allow new opportunities for
collaboration with partners both on and off campus. The request of $82,579,000 in
funding for this project is critical to supporting the continued growth of UIS in
STEM related areas and aids in their commitment to producing programs that serve
the local and state economy in cutting edge technologies.

November 2016 Page 11
REPAIR AND RENOVATION PROJECT
DESCRIPTIONS
Architecture Building, HVAC & Window Upgrades $10,200,000
The Architecture Building, built in 1926, is currently highly energy inefficient and a
constant drain on maintenance resources. This project is an opportunity to
significantly improve student and faculty comfort, stabilize building function, and
advance sustainability on campus by connecting the facility to central chilled water,
upgrading ventilation systems and replacing single paned windows. This project
will introduce up to date controlled environment throughout the building and
significantly reduce energy consumption.
Huff Hall, HVAC Upgrades $3,500,000
George Huff Hall, built in 1924 with major additions in 1926 and 2010, has areas
within the building currently served by deficient mechanical systems. This project
would address each of these deficiencies prioritized as follows:
1) The gymnasium is currently exhausted with large fans that create major
negative pressure issues throughout the building. This project would add
make-up air units to relieve that negative pressure;
2) Offices on the east and west of the original building have original windows
and window air conditioners. This project would replace windows and
provide new air handling units for heating, ventilation and air conditioning.
The existing perimeter heating system would also be considered for
potential replacement;
3) Room 300 (aka. the wrestling room) on the third floor of the 1926 addition
does not have air conditioning which causes issues to the air conditioned
office areas adjacent to this room. This project would add a new air
handling unit to service this area.
Material Sciences and Engineering Building, Renovation Phase III $5,500,000
The Materials Science and Engineering Building (MSEB) was built in 1908 for the
Physics department and at one time was also known as the Metallurgy and Mining
Building. Today, MSEB is occupied by the Department of Materials Science and
Engineering. MSEB contains approximately 102,521 gross square feet on five
levels, with approximately 61,304 net assignable square feet. Material Science is
assigned 46,949 of assignable space in the building. Recent remodeling phases have
addressed main corridors and research labs in select areas of the building. In this
Urbana-
Champaign
Projects
($33,600,000)

CAPITAL REQUESTS REPAIR AND RENOVATION PROJECT DESCRIPTIONS
November 2016 Page 12
phase we will remodel approximately 9,500 square feet of research, office, and
mechanical space. This includes the unfinished center portion of the fourth floor
which will be mechanical space, the entire south side of the third floor and the first
floor northeast wing.
Morrill Hall, Infrastructure Phase II $3,000,000
Aged air handling units and associated components primarily serving the fourth,
fifth and sixth floors of the west portion of the building and select components in the
east portion of the building will be replaced. This project includes heat recovery and
modifications to the air distribution system. Electrical switchgear, transformer,
distribution panel boards, and antiquated wiring systems and other electrical
components will be replaced. Fume hoods in poor condition will be replaced.
National Soybean Research Center, HVAC and Lab Remodeling Phase I
$1,400,000
The focus of this project is modernization and energy efficiency elements for two
areas of National Soybean Research Center. Work includes remodeling of a class
room, research laboratories, support areas and office spaces which support soybean
research activities. All rooms in the remodeled space need to be connected to a
central air handling unit since no HVAC is currently provided in these areas. The
project would also replace select windows with energy efficient units and life safety
components would be installed.
Talbot Lab, Infrastructure Repairs $5,000,000
Chilled water is to be distributed throughout Talbot Lab. This infrastructure project
will prepare selected areas of Talbot Laboratory for campus chilled water usage. Air
handlers, ductwork and other components are to be installed. Window air
conditioners are to be removed. Single paned metal windows are to be replaced with
energy efficient aluminum double-pane units. This project will also include
installation of a sprinkler system to comply with life safety provisions.
Transportation Building, Envelope Repairs $5,000,000
This project will address identified deficiencies in the Transportation Building.
Included are the repairs or replacement of the slate roof, windows, gutters,
downspouts, tuckpointing of masonry surfaces, replacement of exterior doors and

CAPITAL REQUESTS REPAIR AND RENOVATION PROJECT DESCRIPTIONS
November 2016 Page 13
hardware and other miscellaneous exterior repairs. Installation of a new air handling
system with DDC controls and connection to the campus chilled water loop are also
included in this project.
Science and Engineering South, Envelope and Life Safety Upgrades
$17,500,000
Science and Engineering South (SES) was built in 1968 as part of the original East
Side construction. The 456,000 gross square foot building is among the most
heavily utilized academic buildings on the campus when measuring credits hours of
instruction and quantity of space (square feet) dedicated to sponsored research
activities. Unfortunately, SES is among the plethora of buildings constructed in the
1960s which all have building systems requiring replacement at once. Even though
it is one of the most productive academic facilities on campus, it has an estimated
facility condition of critical. Due to the size, complexity and utilization of SES, it is
not feasible to be replaced and must therefore be recapitalized.
The campus has invested heavily in the building’s mechanical systems and has
included it in a multi-building $65 million Energy Conservation Project which is
currently overhauling its mechanical systems–air handlers, exhaust fans, fume
hoods. Once completed, it will take the building’s facility condition to poor.
Despite these major investments in this crucial facility, several deficiencies exist.
The building lacks a fire sprinkler system, despite having a high concentration of
research and teaching laboratories utilizing volatile chemicals. Furthermore, the
building facade is severely deteriorated. A 2009 facade assessment estimated the
repair construction costs at over $35 million. Since then, the campus has
implemented a $4 million project in immediate facade repairs to address the most
urgent requirements. This repair and renovation will upgrade the fire alarm system
in the building and repair the building facade.
College of Medicine East Tower, Facade Repairs $6,500,000
The College of Medicine East Tower is an academic facility built in 1931. It has an
estimated condition index of 0.21, indicating it is in poor condition. The 189,314
gross square foot building supports academic, research and clinical activities for the
College of Medicine and the College of Applied Health Sciences. The facility is
connected to the College of Medicine West Tower and College of Medicine West,
Chicago
Projects
($24,000,000)

CAPITAL REQUESTS REPAIR AND RENOVATION PROJECT DESCRIPTIONS
November 2016 Page 14
forming a large complex of health sciences facilities. Combined, this complex is
physically connected to another complex of health sciences facilities, including the
Medical Sciences Building, College of Medicine Research Building, Clinical
Sciences Building, Neuropsychiatric Institute, and several others.
In the past several years, over $15 million have been invested in repairing the
facades of this complex of buildings. The repairs have been needed to ensure the
integrity of the building envelope systems and to prevent water infiltration. A series
of 2004 reports prepared by an independent engineering firm identified a multitude
of facade deficiencies requiring repair. This $6.5 million project is the final phase in
the effort to complete major repairs to the facades of the College of Medicine
Complex and to ensure the integrity of the building envelope systems.
Campus Service Drives and Walkways, Repairs $1,400,000
Many of the campus service drives and interior roadways throughout campus are
severely degraded and in need of replacement. This project will provide for the
resurfacing of these internal campus roads with asphalt overlay along with paving of
the maintenance yard and central receiving areas with concrete. Many sidewalks
throughout the older east side of campus are damaged from the normal wear patterns
in the Midwest with cracked, heaving or crumbled concrete. This project will repair
those areas with deteriorated sidewalks and provide a safe path of transit for visitors,
faculty and staff with new sidewalks. Related site work associated with those
projects will be included with this project.
Campus Buildings, Roof Repairs $1,000,000
Several roofs on campus buildings are in need of repair as they have developed tears
or soft spots over time and have outlived their useful life. The single ply fully
adhered EPDM roofing membrane will be replaced along with the thermal and
moisture protective insulation and associated roofing system materials. There are
two one story buildings that will be repaired as part of this project; Human
Resources Building and the Health and Sciences Building.
Springfield
Projects
($2,400,000)

FY 2018 BUDGET REQUEST ADDENDA

November 2016 Page 1
ADDENDUM I
RETIREMENT
The level of funding of the State Universities Retirement System (SURS) has been a
source of significant concern through the years. Although legislation passed in 1967
required that annual appropriations for the System cover the projected costs of future
benefits plus interest on the System’s existing unfunded liability (i.e., future pension
costs for employees still working), this statutory level of funding was rarely
achieved and, in effect, part of the State’s obligation to cover the legacy costs of
current and past employees has been shifted to future years.
There was modest movement toward an improved level of retirement funding from
FY 1979 through FY 1981. In each of those years, the State’s contribution was at or
above the "gross payout" level of funding–covering all of that year’s benefits and
administrative expenses. But from FY 1982 through FY 1994 annual funding
dropped significantly below the "gross payout" level. While these reductions were
seen as necessary to prevent deeper cuts in current operating funds, the State was in
effect borrowing against the future pension obligations.
In FY 1995, there was significant movement towards an improved level of
retirement funding. Public Act (PA) 88-593 mandated that the State’s five pension
systems achieve a level of 90% of full actuarial funding in 50 years and includes a
continuing appropriation provision to enable the State to reach that goal. Under new
Governmental Accounting Standards Board (GASB) guidelines, SURS assets as of
June 30, 1997 were valued at market rather than book value. This change alone
significantly increased the funding ratio of assets to liabilities, and the funding ratio
was increased even further by a new set of actuarial assumptions adopted in
December 1996 that recognized strong returns on SURS assets, which lowered
projected future liabilities. The System’s funding ratio peaked at over 88% in
FY 2000, based on strong investment returns.
Unfortunately, investment returns in 2001 and 2002 were negative, and only about
3% in FY 2003. As a result unfunded liabilities increased greatly for SURS, as they
did for all of the State’s retirement systems, which also experienced poor investment
returns.
Overview

ADDENDUM RETIREMENT
November 2016 Page 2
Faced with an extremely constrained budget situation in FY 2004, the General
Assembly and the Governor approved PA 93-2, authorizing the sale of $10 billion in
pension obligation bonds in order to meet the statutory pension funding obligations.
The infusion of money combined with strong investment performance increased the
funding ratio of SURS from a low of 53.9% at the end of FY 2003 to 66% at the end
of FY 2004. The law called for the State’s pension contribution to be split between
payments to the pensions systems and interest and principal payments on the bonds.
The 1995 “catch-up” law combined with the bond sale created a very large pension
funding obligation that, along with rising Medicaid and other program costs, posed a
severe challenge to the State’s FY 2006 budget. The Governor and General
Assembly responded by approving PA 98-4, which reduced the State’s required
pension contributions to all systems by about $1.2 billion in FY 2006 and $1.1
billion in FY 2007 and recalculated the pension catch-up amounts in subsequent
years. SURS contributions were reduced to about $167 million (from $365 million)
in FY 2006 and $252 million (from $432 million) in FY 2007. The FY 2008 SURS
contribution was $340 million, FY 2009 was $450 million and FY 2010 was $708
million. The law also made the following major substantive changes to SURS:
The State Comptroller (rather than the SURS Board) will now certify the
SURS effective rate of interest for the money-purchase formula.
The money-purchase formula is not available for new SURS members hired
on or after July 1, 2005.
Employers must pay the actuarial value of pension increases that result from
earnings increases over 6% in any year used to calculate a retiree’s final rate
of earnings. This provision does not apply to raises paid under collective
bargaining agreements in effect before July 1, 2005. This legislation was
modified under PA 94-1057 and signed by the Governor in July 2006 to
further clarify the basis used for calculations and included a sunset provision
to address exclusions such as overload work and certain promotions.
Unfortunately, these exclusions expired on June 30, 2011 and the University
no longer benefits from those exclusions.
The Governor created an Advisory Commission on Pension.
Though pension systems invest for the long run, all have been greatly impacted by
the historic declines in asset prices over recent years. The public pension systems of
Illinois are no exception. The combination of long term underfunding and the

ADDENDUM RETIREMENT
November 2016 Page 3
historic drop in asset prices have created a long term concern regarding the stability
of the Illinois pension systems.
Again faced with negative investment returns in FY 2009 which further escalated
funding requirements and the continued ramp up in funding from PA 88-593, the
Governor and General Assembly responded by passing legislation that fully funded
the FY 2010 required pension contributions by issuing $3.5 billion in 5-year Pension
Obligation Bonds. Governor Quinn also appointed a Pension Modernization Task
Force which formed subcommittees and provided recommendations on investments,
benefits and funding.
Under PA 88-593 there continued to be a ramp up in funding for the State’s five
retirement systems. This significant increase in employer contributions dramatically
impacted the availability of State revenues for other purposes. On April 14, 2010,
Governor Quinn signed (SB 1946) PA 96-0889 into law. It was one of the most
substantial pension overhauls in the country, modifying most public pension systems
other than Police and Fire funds. Of note, it created a two-tier pension system in
which the required age to receive full annuity increased to 67–the highest teacher
retirement age in the country–and the vesting period was raised to 10 years. The
required age to receive a reduced annuity was modified to age 62 with 10 years of
service; the reduction in benefit amounting to ½ of 1% for each month that the
member’s age is under 67. PA 96-0889 also caps maximum pensionable salary at
$106,800 with grandfathering for those above. The new provisions named, as well
as others outlined in Table 1, apply to all newly hired employees eligible to
participate in any retirement system on or after January 1, 2011.

ADDENDUM RETIREMENT
November 2016 Page 4
Table 1
PA 96-0889 – Applicable to SURS Participants
Provision Current Members New Members on or after January 1, 2011
Required Age and Service Years to Receive Full Annuity
Age 62 with 5 years of service, 55 with 8 years OR any age with 30 years
At age 67 with at least 10 years of service
Required Age and Service Years to Receive Reduced Annuity
If under 30 years of service, the annuity is reduced by ½% per month for each month that the member’s age is under 60
At age 62 with 10 years of service. The pension would be reduced a ½% for each month the member is under the normal retirement age as provided by SSA
Average Final Salary Calculation
The average of the highest 52 consecutive pay periods of earnings in the last 10 years preceding retirement
The average highest 96 months of earnings in the last 10 years preceding retirement
Maximum Pensionable Earnings
IRS requires that pensionable earnings cannot exceed $265,000 in 2015 (for employees hired after 1/1/96)
Caps the average final salary used at $106,800; this amount automatically increases annually by 3% or by one-half of the increase in the Consumer Price Index-u, whichever is lower
Computation of the Surviving Spouse’s Annuity
60% plus 1% per year of service of the annuity the deceased member had been receiving or would be entitled to receive on the date of death, maximum 85%.
66-2/3% of the annuity the deceased member had been receiving or would be entitled to receive on the date of death
Annuitant (Retiree and Surviving Spouse) COLA
3% of the annuity payable at the time of the increase
3% or one-half of the increase in the Consumer Price Index, whichever is lower, of the original annuity
Schedule for First Retiree Annuitant COLA
On the first of the month in which the anniversary of retirement occurred
The first of the month following the attainment of age 67 or the first anniversary of the commencement of the annuity, whichever is later
Schedule for First Spouse Annuitant COLA
First day of the calendar month in which there is an anniversary of the employee’s retirement or date of death, whichever occurred first
January 1st occurring on or after the commencement of the spouse annuity if the member died after retirement. For the spouse of the member who died in service, January 1st occurring after the first anniversary of the commencement of the annuity.
With passage of PA 96-0889, contributions for FY 2011 were recertified and the
funding required for the pension systems was reduced. PA 96-1497 was signed on
January 14, 2011, and amended the General Obligation Bond Act to authorize an
additional $3.7 billion in bonds for the purpose of making the state's Fiscal Year
2011 required contributions to the state retirement systems.

ADDENDUM RETIREMENT
November 2016 Page 5
After years of underfunding by the employer (the State of Illinois) and issuing bonds
for pension payments, the State did make a positive step by appropriating the full
certified funding amounts for all five pension systems for FY 2012, FY 2013,
FY 2014 and FY 2015 of $4.9 billion, $5.9 billion, $6.8 billion and $6.9 billion
respectively. Without a FY 2016 or FY 2017 appropriation enacted for the Pension
Systems, the state is statutorily required to fund the systems at the certified level of
$7.6 billion for FY 2016 and $8.5 billion for FY 2017. The required state FY 2017
contribution for SURS, which is determined actuarially based on the System's June
30, 2015, fiscal year-end results, is $1,718.9 million. Although an estimated $47
million will be received by SURS from non-state funding sources, the remaining
$1,671.9 million will come from the state's General Revenue Fund and the state's
unclaimed property fund, which is called the State Pension Fund.
With continuing pressure to reduce state appropriations for this purpose, the General
Assembly has proposed a number of major changes to the pensions for current
employees under various bills introduced in the past four years. Both changes to
benefits and shifting of the normal cost to universities and local school districts have
been introduced. Although both chambers did individually pass pension bills with
substantial changes, in the spring of 2013 the legislature ended that regular session
without coming to a consensus. During the last week of spring 2013 session, both
chambers voted to convene a pension conference committee charged with drafting a
bipartisan bill addressing changes to the pension systems.
PENSION REFORM (PA98-0599)
In the November/December 2013 veto session, the legislature acted on the
conference committee legislation by passing major pension reform for four of the
five pension systems (excludes the Judges Retirement System). On December 5,
2013 the Governor signed the bill into law with PA98-0599 with an effective date of
June 1, 2014. The following benefit changes were enacted for current Tier I
employees (hired prior to January 1, 2011) and additional changes for new
employees:
Automatic Annual Increase (COLA)
1) Automatic annual increases on or after the effective date of the law are
reduced to 3% of the lesser of

ADDENDUM RETIREMENT
November 2016 Page 6
a) the total annuity payable at the time of the increase, including previously
granted increased or
b) $1,000 multiplied by the number of years of creditable service upon
which the annuity is based. The $1,000 multiplier will be increased by
CPI-u each year beginning January 1, 2016.
2) Tier 1 actives will not be eligible to receive the following automatic annual
increase:
a) Age 50 or over [on the effective date of the law] - will not receive their
2nd automatic annual increase;
b) Age 47 to 50 [on the effective date of the law] - will not receive their 2nd,
4th, or 6th automatic annual increase;
c) Age 44 to 47 [on the effective date of the law] - will not receive their 2nd,
4th, 6th, or 8th automatic annual increase;
d) Age 43 and under [on the effective date of the law] - will not receive their
2nd, 4th, 6th, 8th, or 10th automatic annual increase.
Normal Retirement Age
1) Normal Retirement Ages are adjusted for those employees age 45 or younger
on June 1, 2014 by 4 months (up to 60 months/5 years) for every year a
member is under 46.
Pensionable Earnings Limitation
1) Pensionable earnings shall not exceed the Tier 2 Wage Base (2011 Social
Security wage base adjusted by ½ CPI).
2) Tier 1 participants that are receiving earnings exceeding the Tier 2 Wage Base
as of the effective date are grandfathered and pensionable earnings are limited
to the participant’s rate of earnings as of the effective date of the law, or the
expiration, renewal or amendment of a collective bargaining agreement that is
in effect on the effective date of the law.
Tier 1 Employee Contribution Decrease
1) Beginning July 1, 2014, Tier 1 employee contributions are decreased by 1%
of earnings.
SURS and TRS Money Purchase Formula Changes
1) Beginning in FY 2015, the annuity factors used to calculate money purchase
benefits shall change to a new effective rate of interest.
2) The new effective rate of interest shall be equal to the 30-year US Treasury
bond rate plus 75 basis points. The new effective rate of interest shall apply
prospectively towards crediting interest to money purchase plan accounts,
portable plan lump sum payouts, portable plan refunds, purchases of service
credit, etc.
3) Changes to the money purchase conversion factors are applied prospectively,
but members who retire after the effective date of the law are eligible to
receive the money purchase benefit they were eligible to receive had they
retired during the fiscal year preceding the effective date of the law or the
money purchase benefit they are eligible to receive under the new formula,
whichever is greater.

ADDENDUM RETIREMENT
November 2016 Page 7
Optional Defined Contribution Plan
1) An optional defined contribution will be made available to active Tier 1
employees. The plan is to be implemented by July 1, 2015, unless the plan is
not qualified under the Internal Revenue Code. If the plan is not qualified by
July 1, 2015, the plan shall be implemented upon being determined a qualified
plan. No more than 5% of eligible employees may elect to participate in the
plan.
2) Tier 1 employees participating in the DC plan will contribute at the same rate
as other participants contribute under the DB plan.
3) Employer contributions shall be a minimum of 3% of pay up to the
employer’s normal cost for Tier I members in the DB plan.
Unused Sick and Vacation Time- New Hires
1) Persons who first become participants on or after the effective date of the law
are not eligible to convert unused sick and/or vacation days into service credit
or have unused sick and/or vacation days used to enhance pensionable
earnings.
Prohibition of Non-Public Employers
1) Employers that are not defined as an employer under the SURS article shall
be excluded from enrolling new employees in SURS. Those employees of
such employers that are already SURS participants shall remain participants.
The SURS Board of Trustees is given the authority to determine whether or
not a person is an employee. SURS members shall not be eligible to receive
service credit for a leave of absence for service with a teacher organization if
that leave of absence begins on or after the effective date.
State Funding
1) The State shall be required to adhere to a funding schedule that provides an
annual contribution, beginning in FY 2015, equal to normal cost plus an
amount that is sufficient to fund 100% of each system’s liabilities by
FY 2044. Normal cost contributions shall be determined under the entry age
normal cost method beginning in FY 2016. In FY 2045 and each fiscal year
thereafter, the State shall contribute an annual amount to maintain a funding
status of 100%. Prior to this, the systems had been operating under the
statutory funding program established by PA 88-593 since 1996. This
funding program was designed to reach a 90% funding ratio by the end
FY 2045.
2) Additional Pension Stabilization Fund Contributions– beginning in FY 2019,
the 5 state retirement systems shall receive additional payments as debt
service payments on existing Pension Obligation Bonds expire. The Pension
Stabilization Fund will receive dedicated revenues that will be proportionately
distributed to each system based on the systems proportional share of the
State’s total unfunded liabilities. In FY 2019, the Pension Stabilization Fund
will receive $364 million. Beginning FY 2020, the Pension Stabilization
Fund will receive $1 billion a year. The transfers will terminate at the end of
FY 2045 or when each of the retirement systems has achieved 100% funding,
whichever occurs first. The systems shall not include these contributions or

ADDENDUM RETIREMENT
November 2016 Page 8
interest accrued on these contributions in calculations to determine required
contributions until the system is 100% funded or FY 2045, whichever occurs
first.
3) Additional supplemental payments- beginning in FY 2016, the 5 state
retirement systems shall receive additional payments equal to 10% of the
difference of what contributions would have been required had the reform not
been enacted and required contributions under the reform. The systems shall
not include these contributions or interest accrued on these contributions in
calculations to determine required contributions until the system is 100%
funded or FY 2045, whichever occurs first.
Funding Guarantee
1) Beginning July 1, 2014, the State is obligated to properly fund the system. If
the State fails to make a required payment, the Board of Trustees shall bring a
mandamus action in the Illinois Supreme Court to compel the State to make
the required payment. For purposes of this Section, the State waives its
sovereign immunity. This payment mechanism will also apply to “Pension
Stabilization Fund” payments. However, all such payments are subordinate to
bonded debt obligations.
Prior to the June 1, 2014 effective date of the enacted changes, the court suspended
implementation until lawsuits brought by unions, retirees and others challenging the
constitutionality of the overhaul of the retirement systems. On May 8, 2015 the
Supreme Court of the State of Illinois upheld the ruling by the Circuit Courts of
Sangamon County and found the changes unconstitutional. The Governor and
General Assembly continue to discuss changes to the pension system, however there
have not been any new bills introduced to date.
While the University understands the very difficult budget situation facing Illinois, it
also supports adequate annual funding for all State pension systems, including
SURS. SURS should be viewed not only as an important part of the University’s
benefit package, but as a crucial component of the State’s commitment to higher
education. While Illinois’ pension funding ratio is one of the lowest in the nation,
many other states are not changing their benefit structure significantly. Major
changes in benefits could put the University of Illinois at a substantial disadvantage
when recruiting faculty of national and international stature. While the University is
a creation of the State, the market in which it operates is significantly different than
state agencies. While the State continues to grapple with this major problem, the
University is concerned about being able to maintain an overall competitive
compensation package to recruit top faculty and staff.

November 2016 Page 9
ADDENDUM II
ENSURING ACCESS–FINANCIAL AID
The University of Illinois has a strong commitment to access for the people of
Illinois whose taxes contribute substantially to the support of the University. To
ensure full access for all qualified Illinois residents, regardless of their income level,
the University assists students with a wide range of financial aid programs including
grants and loans from federal, State and private sources; federal work study funds;
and grants and loans from institutional resources. Over 31,300 U of I
undergraduates received some form of gift assistance, the largest portion being need
based financial aid. Financial aid is crucial for ensuring accessibility to students
from families with limited means. A critical component of financial aid packages
for Illinois residents is the Monetary Award Program (MAP) grants they receive
from the Illinois Student Assistance Commission (ISAC). For many years the
maximum MAP grant awarded to those students with greatest financial need was
sufficient to cover the full tuition and mandatory fees at Illinois public universities.
In FY 1996, tuition and mandatory fees at the Chicago and Urbana campuses of the
University of Illinois first exceeded the maximum MAP award, and the University
began supplementing MAP grants for these students to cover the difference.
Students and the University are more directly affected by changes in State and
federally sponsored financial aid programs than ever before. Maximum award
levels for Pell and MAP are shown in Table 2.
Table 2
Federal Pell Grants and Illinois Monetary Award Program
Maximum Award Levels
Overview
UIUC Freshmen
General
Fiscal Year Pell MAP Total Tuition + Fees
2007 4,050$ 4,968$ 9,018$ 9,882$
2008 4,310 4,968 9,278 11,130
2009 4,731 4,968 9,699 12,230
2010 5,350 4,968 10,318 12,528
2011 5,550 4,968 10,518 13,508
2012 5,550 4,968 10,518 14,276
2013 5,550 4,968 10,518 14,960
2014 5,645 4,968 10,613 15,258
2015 5,730 4,968 10,698 15,602
2016 5,775 4,968 10,743 15,626
2017 5,815 4,968 10,783 15,698
ISAC MAP formula uses FY 2003-2004 tuition levels.
MAP Formula uses max of $4,968 and reduces all awards by 5%. (FY12 - FY17)
FY 2016 MAP awards may change.

ADDENDUM ENSURING ACCESS–FINANCIAL AID
November 2016 Page 10
For several years the Pell and MAP program maximum awards have not kept pace
with the increases in tuition and fees. To ensure access the University has set aside
supplemental funding to help the neediest students. As shown in the Figure 1, the
cost of the Supplemental Financial Aid program began to increase several years ago
as budget cuts to both ISAC and the University precipitated reductions in MAP
grants and increases in the sticker price of tuition and fees.
Figure 1
University of Illinois
Supplemental Financial Aid Expenditures
FY 2008 to FY 2017
As the University continues to balance quality with affordability, institutional aid
has become a much larger part of the access for students. Institutional aid in
FY 2016 will exceed both Pell grants and MAP grants, and as such the University
has become a major partner in the financial aid process. Figure 2 shows the
changing environment, the increase in the total amount of aid and the growth in
institutional aid in the last decade.
$0
$15
$30
$45
$60
$75
$90
FY08 FY09 FY10 FY11 FY12 FY13 FY14 FY15 FY16* FY17*
Dollars in Millions
$83.4M$85.5M
Tuition Blue
Fees Red
$36.3M
$27.9M
$32.3M
FY 2016 preliminary, FY17 estimated.
$49.3M
$60.9M
$71.4M
$78.6M
$82.5M
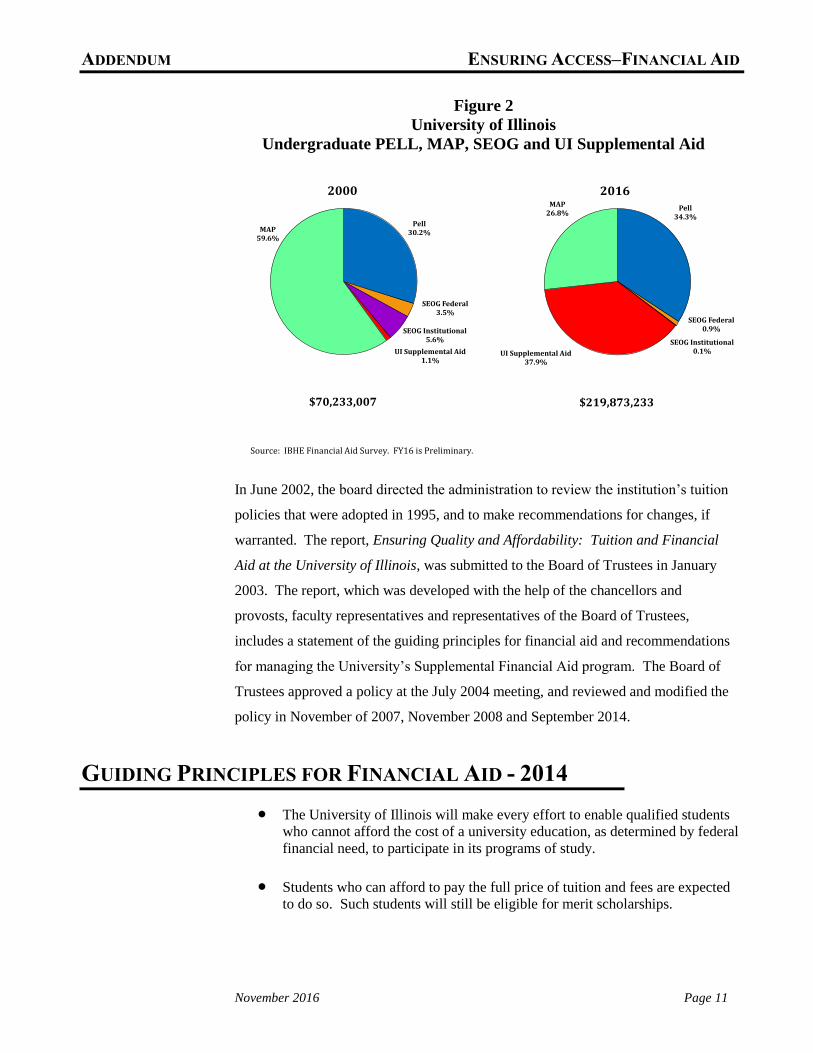
ADDENDUM ENSURING ACCESS–FINANCIAL AID
November 2016 Page 11
Figure 2
University of Illinois
Undergraduate PELL, MAP, SEOG and UI Supplemental Aid
In June 2002, the board directed the administration to review the institution’s tuition
policies that were adopted in 1995, and to make recommendations for changes, if
warranted. The report, Ensuring Quality and Affordability: Tuition and Financial
Aid at the University of Illinois, was submitted to the Board of Trustees in January
2003. The report, which was developed with the help of the chancellors and
provosts, faculty representatives and representatives of the Board of Trustees,
includes a statement of the guiding principles for financial aid and recommendations
for managing the University’s Supplemental Financial Aid program. The Board of
Trustees approved a policy at the July 2004 meeting, and reviewed and modified the
policy in November of 2007, November 2008 and September 2014.
GUIDING PRINCIPLES FOR FINANCIAL AID - 2014
The University of Illinois will make every effort to enable qualified students
who cannot afford the cost of a university education, as determined by federal
financial need, to participate in its programs of study.
Students who can afford to pay the full price of tuition and fees are expected
to do so. Such students will still be eligible for merit scholarships.
Source: IBHE Financial Aid Survey. FY16 is Preliminary.
$219,873,233$70,233,007
Pell30.2%
SEOG Federal3.5%
SEOG Institutional5.6%
UI Supplemental Aid1.1%
MAP59.6%
2000Pell
34.3%
SEOG Federal0.9%
SEOG Institutional0.1%UI Supplemental Aid
37.9%
MAP26.8%
2016

ADDENDUM ENSURING ACCESS–FINANCIAL AID
November 2016 Page 12
Students who cannot afford to pay the full price will be offered a combination
of grants and loans from various sources appropriate to their financial
circumstances.
The University will control its costs through control of the length of study for
which it will support students from institutional funds and of the proportion of
loans to grants made from institutional funds.
Each campus will determine eligibility for financial aid based on a number of
criteria. Good academic progress toward degree completion is an essential
feature.
INSTITUTIONAL SUPPLEMENTAL FINANCIAL AID
POLICY - 2014
Supplemental Financial Aid grants will be derived from institutional funds, as
well as from auxiliary enterprise and self-supporting funds.
These grants will be awarded to Illinois resident undergraduates, and
generally be limited to the first four years (eight semesters), with an additional
year available at the discretion of each campus.
The financial aid officers, in consultation with the campus academic leaders,
will develop specific campus policies for awarding Supplemental Financial
Aid grants to their undergraduate students. Grants to individual students will
be adjusted, within the constraints of campus policy and available resources,
as circumstances warrant to best serve these students and their families.
On a yearly basis, the University will review and set Supplemental Financial
Aid budgets on the campuses in relation to resident tuition and mandatory
fees collected during the academic year, and will assess the effectiveness and
the financial viability of financial aid programs. On average, each campus
will increase its supplemental financial aid pool by a percentage that is greater
than or equal to the percent increase in resident undergraduate tuition and
mandatory fee income, provided student unmet financial needs warrant such
increase, and provided such increase does not impair the University’s core
missions and functions.
This information will be reported to the Board of Trustees on a yearly basis in
order to ensure that Supplemental Financial Aid expenditures at each campus
are appropriate and that financial aid programs are effective in meeting the
objectives.
The financial aid guidelines and policy were developed with the advice and counsel
of Trustees, the Administration and the Academic Affairs Management Team. The
University Policy Council reviewed the financial aid guidelines and policy before

ADDENDUM ENSURING ACCESS–FINANCIAL AID
November 2016 Page 13
being enacted by the Board of Trustees. The supplemental financial aid program
will continue to be monitored and evaluated, in conjunction with multiple sources of
student aid, student needs and student progress, in order to maximize its benefit to
the students. The actual amount needed in the budget year will continue to be
analyzed based on a number of variables.
Additionally the University has been impacted by shortfalls in funding for other
programs administered through ISAC. The State’s cash flow problems have
impacted ISAC funding and timing of payments as well. Changes in funding to
ISAC are critical to over 15,600 university students directly, and also to the financial
health of the University. The University will continue to monitor payments and cash
flow from ISAC.
ISAC has also determined the highest priority for funding is the MAP program and
has reduced or eliminated funding for several other programs such as the Illinois
Veterans Grant (IVG) program. Beginning in FY 2011, IVG grant funding was
eliminated by the state. If there is insufficient funding in the program, under current
Illinois state statute the college or university is prohibited from collecting the funds
from the student. Although recent Federal Post 911 benefit changes have diverted
some students off of the IVG, expected IVG and other veteran related program
waivers for FY 2016 are estimated at over $27 million for public universities. The
program has not been fully funded since FY 2005, and today they are waived
entirely by the institution. While ISAC made some funding available for this
program in the past on a non-recurring basis, a permanent funding for this statutory
program is not in place. Two related programs, Illinois National Guard Grants and
POW/MIA Scholarships have also been underfunded. In FY 2015 the University
waived $9.3 million for the IVG and veteran related programs.