Embed Size (px)
Citation preview
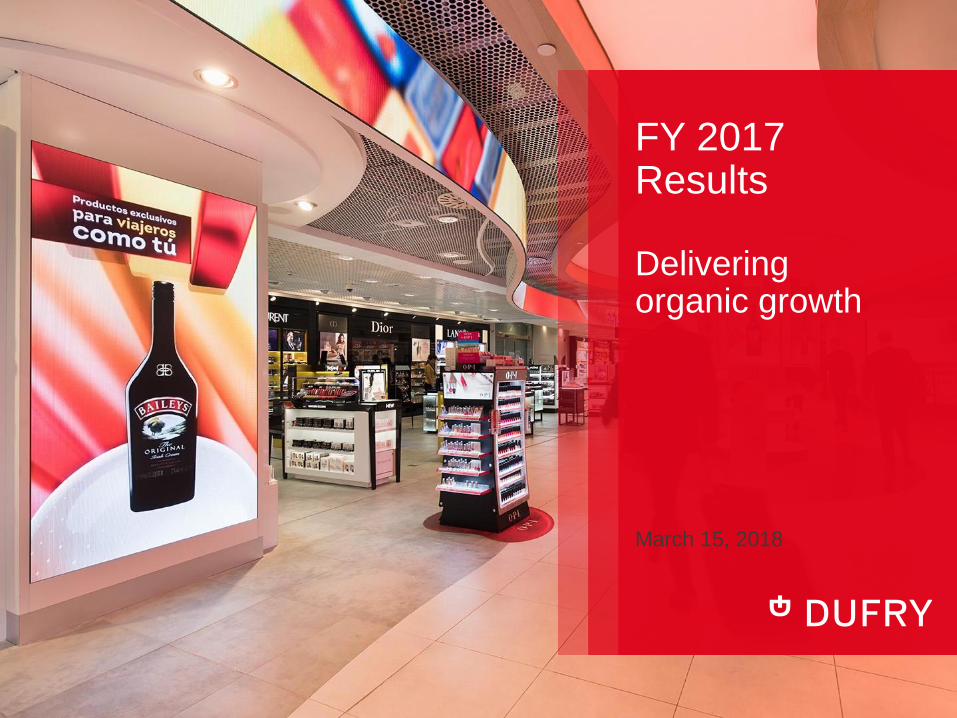
March 15, 2018
FY 2017 Results Delivering organic growth
2_ 2017 Full Year Results Presentation
Legal Disclaimer
Information in this presentation may involve guidance, expectations, beliefs, plans,
intentions or strategies regarding the future. These forward-looking statements
involve risks and uncertainties. All forward-looking statements included in this
release are based on information available to Dufry AG (the “Company”) as of the
date of this release, and we assume no duty to update any such forward-looking
statements. Factors that could affect the Company’s forward-looking statements
include, among other things: global GDP trends, competition in the markets in which
the Company operates, unfavorable changes in airline passenger traffic,
unfavorable changes in taxation and restrictions on the duty-free sale in countries
where the company operates.
This presentation does not constitute an offer to sell or the solicitation of an offer to
buy securities, and shall not constitute an offer, solicitation or sale in any jurisdiction
in which such an offer, solicitation or sale would be unlawful prior to registration or
qualification under the securities laws of that jurisdiction. There can be no assurance
that any transaction will be pursued or consummated.
3_ 2017 Full Year Results Presentation
AGENDA
1. FY 2017 Results
2. Financials FY 2017
3. Conclusion
4_ 2017 Full Year Results Presentation
Full Year Results 2017 1
5_ 2017 Full Year Results Presentation
Strong organic growth of 7.4%
+80 bps gross profit margin
CHF 125 million WDF synergies fully reflected
in FY financials
EBITDA exceeds CHF 1 billion
Free cash flow of CHF 467 million
6_ 2017 Full Year Results Presentation
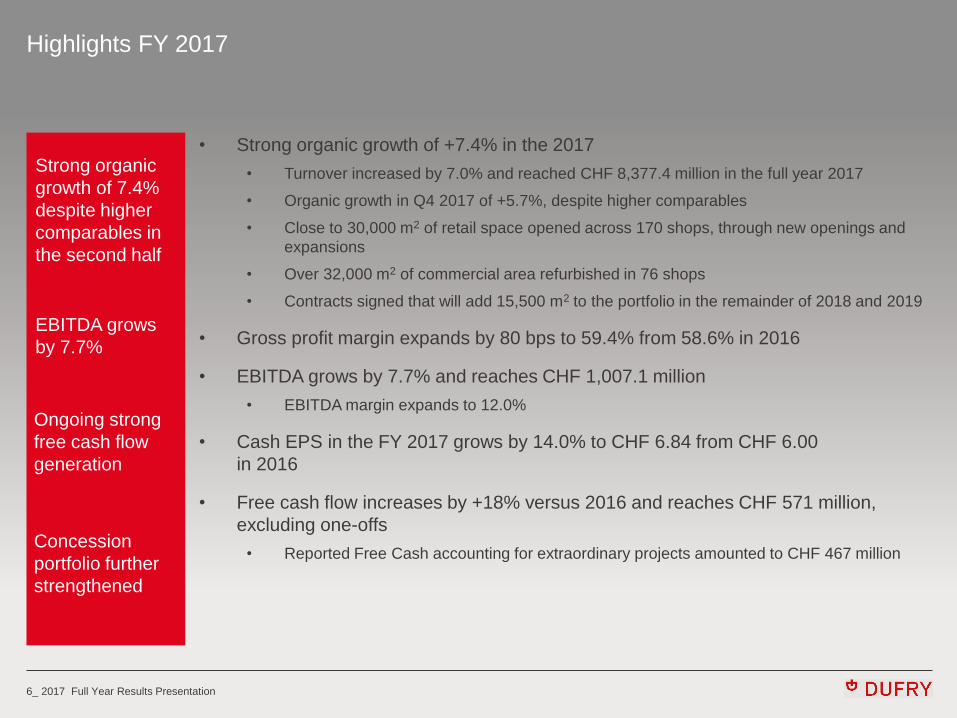
Highlights FY 2017
• Strong organic growth of +7.4% in the 2017
• Turnover increased by 7.0% and reached CHF 8,377.4 million in the full year 2017
• Organic growth in Q4 2017 of +5.7%, despite higher comparables
• Close to 30,000 m2 of retail space opened across 170 shops, through new openings and
expansions
• Over 32,000 m2 of commercial area refurbished in 76 shops
• Contracts signed that will add 15,500 m2 to the portfolio in the remainder of 2018 and 2019
• Gross profit margin expands by 80 bps to 59.4% from 58.6% in 2016
• EBITDA grows by 7.7% and reaches CHF 1,007.1 million
• EBITDA margin expands to 12.0%
• Cash EPS in the FY 2017 grows by 14.0% to CHF 6.84 from CHF 6.00
in 2016
• Free cash flow increases by +18% versus 2016 and reaches CHF 571 million,
excluding one-offs
• Reported Free Cash accounting for extraordinary projects amounted to CHF 467 million
Strong organic
growth of 7.4%
despite higher
comparables in
the second half
EBITDA grows
by 7.7%
Ongoing strong
free cash flow
generation
Concession
portfolio further
strengthened
7_ 2017 Full Year Results Presentation
7,829.1
8,377.4
5,000
5,500
6,000
6,500
7,000
7,500
8,000
8,500
9,000
FY 2016 FY 2017
(CH
F m
illio
n)
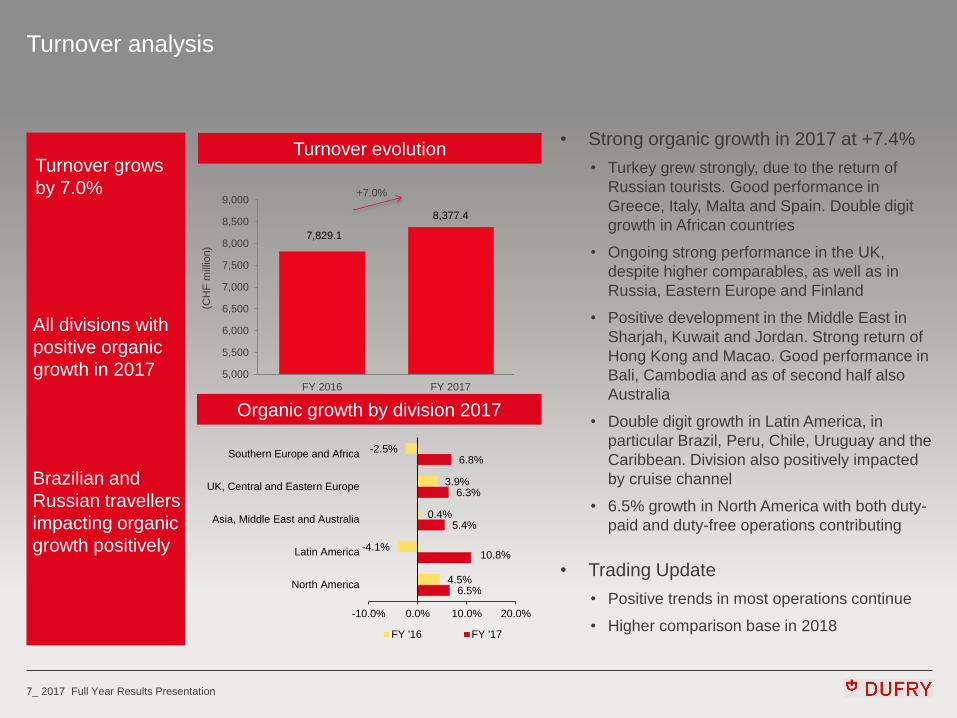
Turnover analysis
Turnover grows
by 7.0%
All divisions with
positive organic
growth in 2017
Brazilian and
Russian travellers
impacting organic
growth positively
Turnover evolution • Strong organic growth in 2017 at +7.4%
• Turkey grew strongly, due to the return of
Russian tourists. Good performance in
Greece, Italy, Malta and Spain. Double digit
growth in African countries
• Ongoing strong performance in the UK,
despite higher comparables, as well as in
Russia, Eastern Europe and Finland
• Positive development in the Middle East in
Sharjah, Kuwait and Jordan. Strong return of
Hong Kong and Macao. Good performance in
Bali, Cambodia and as of second half also
Australia
• Double digit growth in Latin America, in
particular Brazil, Peru, Chile, Uruguay and the
Caribbean. Division also positively impacted
by cruise channel
• 6.5% growth in North America with both duty-
paid and duty-free operations contributing
• Trading Update
• Positive trends in most operations continue
• Higher comparison base in 2018
+7.0%
Organic growth by division 2017
-2.5%
3.9%
0.4%
-4.1%
4.5%
6.8%
6.3%
5.4%
10.8%
6.5%
-10.0% 0.0% 10.0% 20.0%
Southern Europe and Africa
UK, Central and Eastern Europe
Asia, Middle East and Australia
Latin America
North America
FY '16 FY '17
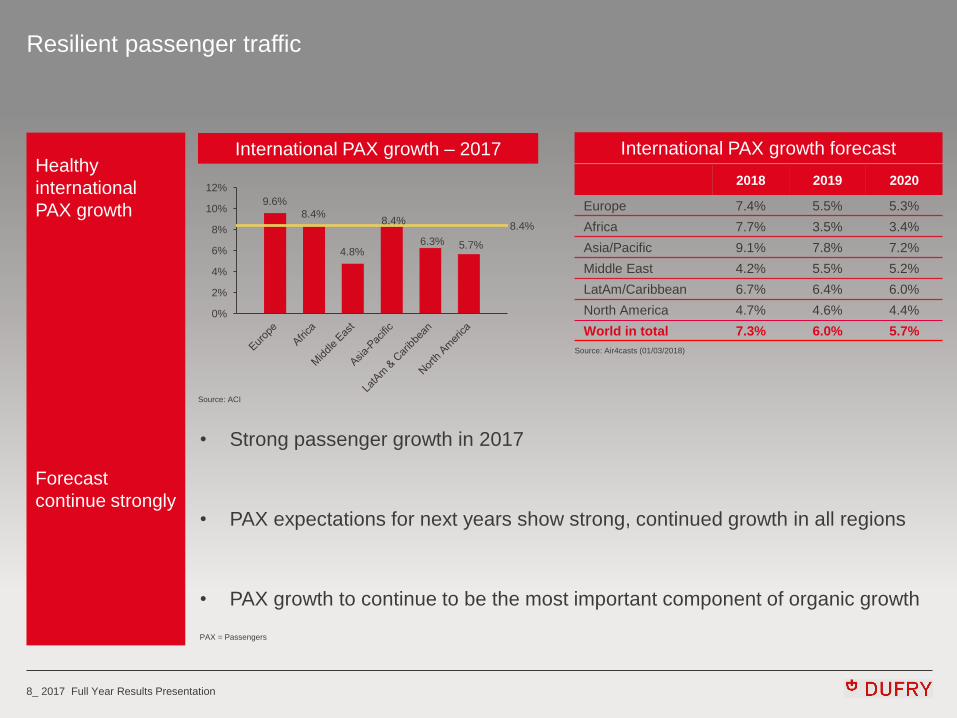
8_ 2017 Full Year Results Presentation
2018 2019 2020
Europe 7.4% 5.5% 5.3%
Africa 7.7% 3.5% 3.4%
Asia/Pacific 9.1% 7.8% 7.2%
Middle East 4.2% 5.5% 5.2%
LatAm/Caribbean 6.7% 6.4% 6.0%
North America 4.7% 4.6% 4.4%
World in total 7.3% 6.0% 5.7%
Resilient passenger traffic
Healthy
international
PAX growth
Forecast
continue strongly
Source: Air4casts (01/03/2018)
• Strong passenger growth in 2017
• PAX expectations for next years show strong, continued growth in all regions
• PAX growth to continue to be the most important component of organic growth
International PAX growth – 2017 International PAX growth forecast
Source: ACI
9.6%
8.4%
4.8%
8.4%
6.3% 5.7%
8.4%
0%
2%
4%
6%
8%
10%
12%
PAX = Passengers
9_ 2017 Full Year Results Presentation
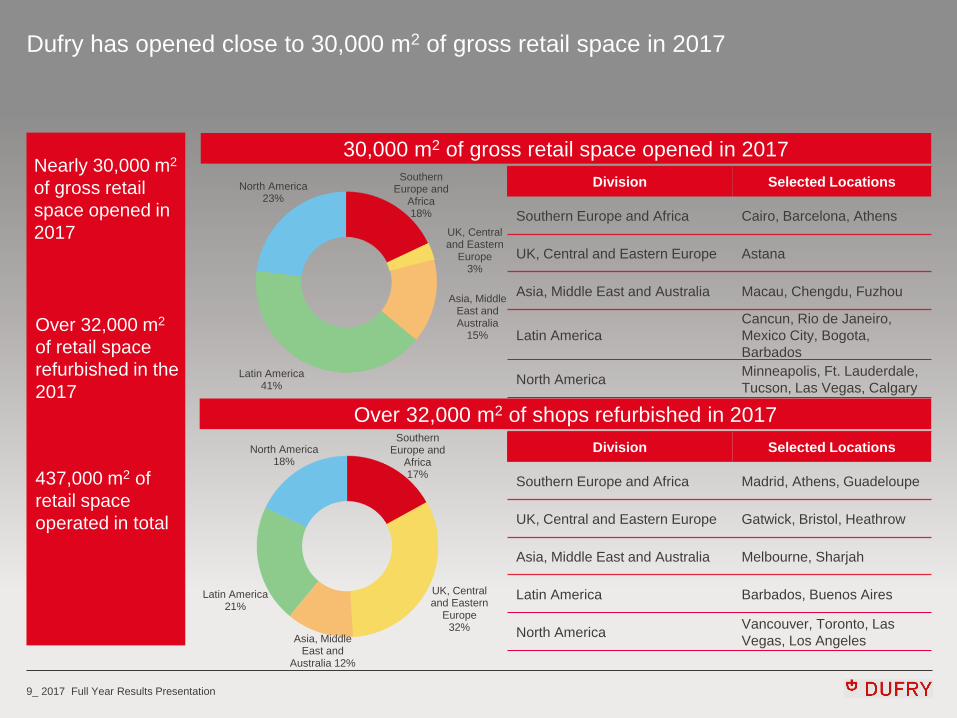
Southern Europe and
Africa 18%
UK, Central and Eastern
Europe 3%
Asia, Middle East and Australia
15%
Latin America 41%
North America 23%
Dufry has opened close to 30,000 m2 of gross retail space in 2017
Nearly 30,000 m2
of gross retail
space opened in
2017
437,000 m2 of
retail space
operated in total
Over 32,000 m2
of retail space
refurbished in the
2017
30,000 m2 of gross retail space opened in 2017
Over 32,000 m2 of shops refurbished in 2017
Division Selected Locations
Southern Europe and Africa Madrid, Athens, Guadeloupe
UK, Central and Eastern Europe Gatwick, Bristol, Heathrow
Asia, Middle East and Australia Melbourne, Sharjah
Latin America Barbados, Buenos Aires
North America Vancouver, Toronto, Las
Vegas, Los Angeles
Southern Europe and
Africa 17%
UK, Central and Eastern
Europe 32%
Asia, Middle East and
Australia 12%
Latin America 21%
North America 18%
Division Selected Locations
Southern Europe and Africa Cairo, Barcelona, Athens
UK, Central and Eastern Europe Astana
Asia, Middle East and Australia Macau, Chengdu, Fuzhou
Latin America
Cancun, Rio de Janeiro,
Mexico City, Bogota,
Barbados
North America Minneapolis, Ft. Lauderdale,
Tucson, Las Vegas, Calgary
10_ 2017 Full Year Results Presentation
11_ 2017 Full Year Results Presentation
12_ 2017 Full Year Results Presentation
13_ 2017 Full Year Results Presentation
14_ 2017 Full Year Results Presentation
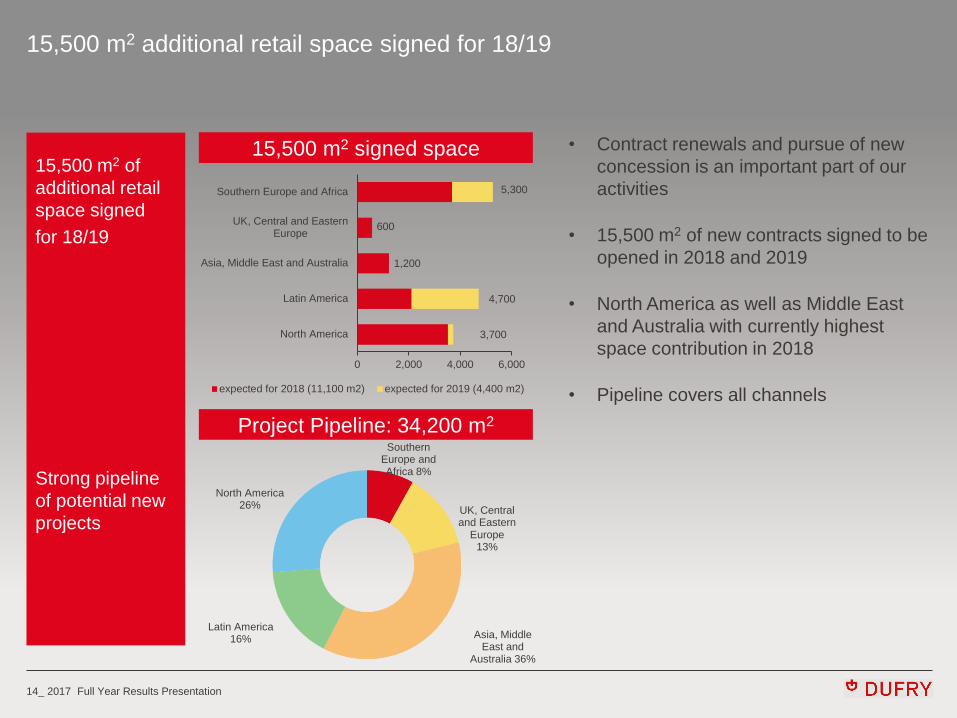
Southern Europe and Africa 8%
UK, Central and Eastern
Europe 13%
Asia, Middle East and
Australia 36%
Latin America 16%
North America 26%
15,500 m2 additional retail space signed for 18/19
15,500 m2 of
additional retail
space signed
for 18/19
Strong pipeline
of potential new
projects
15,500 m2 signed space
Project Pipeline: 34,200 m2
• Contract renewals and pursue of new
concession is an important part of our
activities
• 15,500 m2 of new contracts signed to be
opened in 2018 and 2019
• North America as well as Middle East
and Australia with currently highest
space contribution in 2018
• Pipeline covers all channels
5,300
600
1,200
4,700
3,700
0 2,000 4,000 6,000
Southern Europe and Africa
UK, Central and EasternEurope
Asia, Middle East and Australia
Latin America
North America
expected for 2018 (11,100 m2) expected for 2019 (4,400 m2)
15_ 2017 Full Year Results Presentation
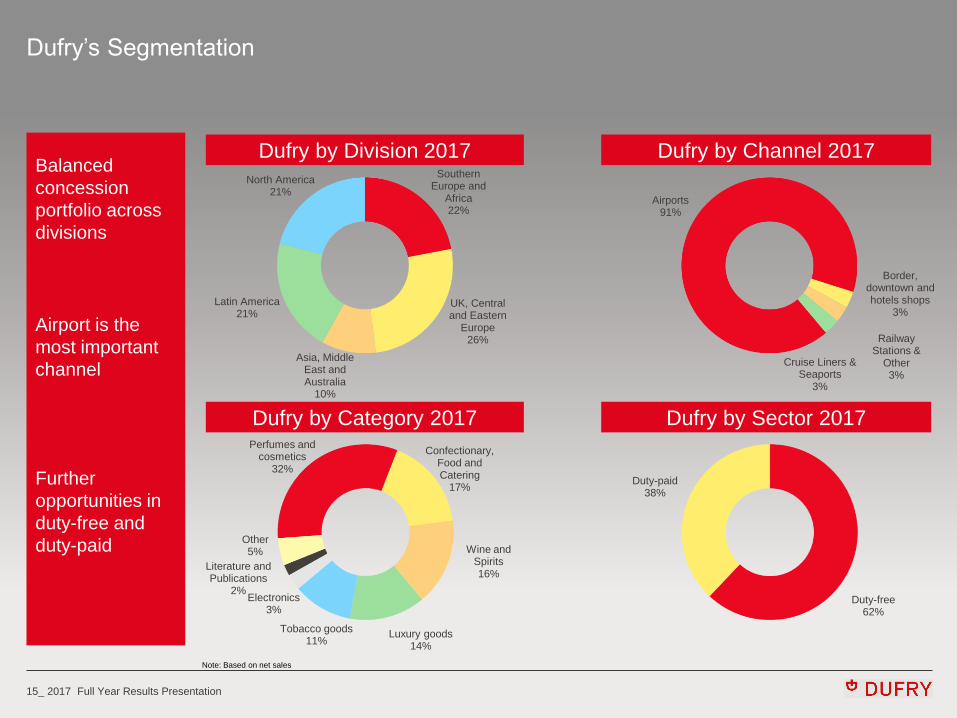
Dufry’s Segmentation
Balanced
concession
portfolio across
divisions
Airport is the
most important
channel
Further
opportunities in
duty-free and
duty-paid
Dufry by Division 2017
Dufry by Category 2017
Dufry by Channel 2017
Dufry by Sector 2017
Note: Based on net sales
Perfumes and cosmetics
32%
Confectionary, Food and Catering
17%
Wine and Spirits 16%
Luxury goods 14%
Tobacco goods 11%
Electronics 3%
Literature and Publications
2%
Other 5%
Southern Europe and
Africa 22%
UK, Central and Eastern
Europe 26%
Asia, Middle East and Australia
10%
Latin America 21%
North America 21%
Duty-free 62%
Duty-paid 38%
Airports 91%
Border, downtown and hotels shops
3%
Railway Stations &
Other 3%
Cruise Liners & Seaports
3%
16_ 2017 Full Year Results Presentation
Hudson IPO
• IPO of Hudson Ltd. successfully concluded – first trading day on Feb 1st, 2018
• Dufry priced Hudson Ltd. shares on February 1st, 2018 @ USD 19.00
• Net proceeds of USD 714 million
• Free float of 43%
• Implications for Dufry
• Dufry continues to fully consolidate the business
• North American business will remain highly integrated, thus
sustaining the efficiencies in place for both units
• The IPO will mainly impact Dufry’s minorities interest line
IPO of Hudson
Ltd. successfully
concluded
Dufry continues
to fully
consolidate the
business
IPO mainly to
impact Dufry’s
minorities interest
line
17_ 2017 Full Year Results Presentation
Priorities for 2018 (1)
• New organization implemented to facilitate acceleration of growth and digital
transformation
• Simplified structure will further improve speed of decision making
• Global Executive Committee with new appointments and roles focusing on
Group development
• New Divisional Executive Committee with new appointments and roles focusing
on business growth
• Business operating model (BOM) to be fully implemented by end of 2018
• BOM implementation already launched in 19 countries, of which 10 (Mexico,
Switzerland, African countries, Australia) already passed internal certification
• Further acceleration to achieve full scope of implementation in 2018
• Currently being implemented in Europe, Middle East, South America and
Canada
• New strategic initiatives to expand the business
• Multiple sectors (duty-free; duty-paid, downtown)
• Multiple channels (cruise lines; border shops; as well as F&B
and master concessions in the US)
• Increase footprint in Asia
BOM
implementation
accelerated
New strategic
initiatives
launched
New
organization
implemented in
early 2018
18_ 2017 Full Year Results Presentation
Priorities for 2018 (2)
• Customer focused and digital driven to better engage with customers and
drive sales
• Accelerate digitalization of sales representatives
• Customer Research (CRM database)
• Omni-channel strategy
• Four New Generation Stores already opened; additional 2 to come in 2018
• Further expand global deployment of RED by Dufry loyalty program, currently available in
over 100 locations
• Reserve & Collect active in 47 airports across the globe; further enhance offer by
catalogue refinement
• Further expand social media presence
• New products and services
• Continue to drive organic growth by winning new concessions, expand
existing locations and increase spend-per-passenger
• Focus on cash generation continues, with further deleveraging as primary
goal
• Returning cash to shareholders; proposal to be submitted to AGM of 3 May
2018
Continue to drive
organic growth
Cash generation
and deleveraging
remain priorities
Customer
focused, digital
driven
19_ 2017 Full Year Results Presentation
FINANCIALS
FY 2017 2
20_ 2017 Full Year Results Presentation
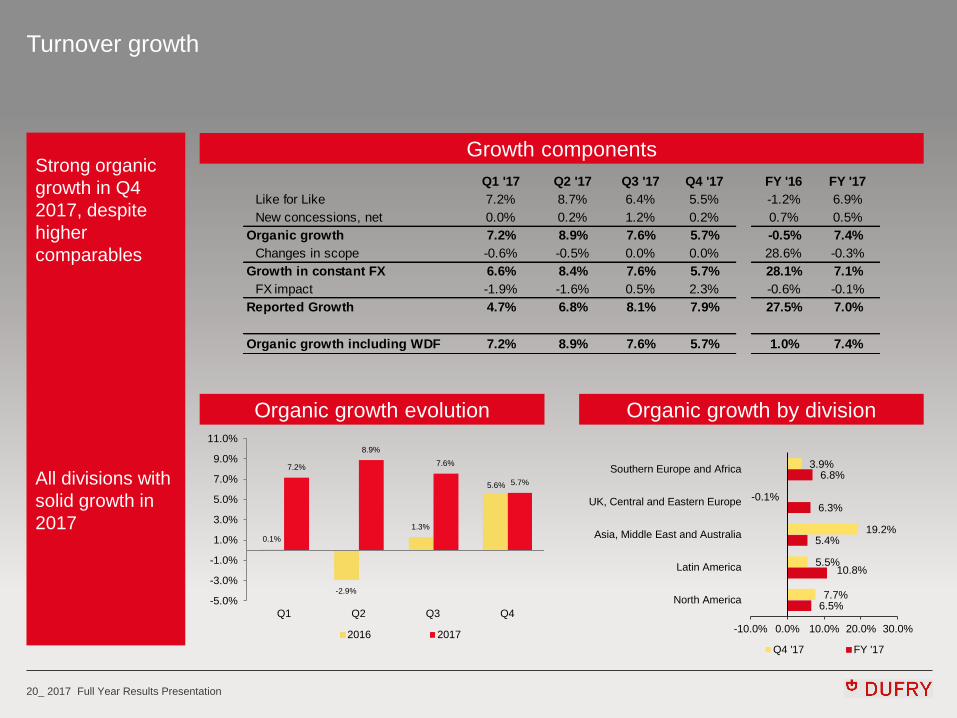
Turnover growth
Strong organic
growth in Q4
2017, despite
higher
comparables
All divisions with
solid growth in
2017
Growth components
Organic growth evolution Organic growth by division
0.1%
-2.9%
1.3%
5.6%
7.2%
8.9%
7.6%
5.7%
-5.0%
-3.0%
-1.0%
1.0%
3.0%
5.0%
7.0%
9.0%
11.0%
Q1 Q2 Q3 Q4
2016 2017
Q1 '17 Q2 '17 Q3 '17 Q4 '17 FY '16 FY '17
Like for Like 7.2% 8.7% 6.4% 5.5% -1.2% 6.9%
New concessions, net 0.0% 0.2% 1.2% 0.2% 0.7% 0.5%
Organic growth 7.2% 8.9% 7.6% 5.7% -0.5% 7.4%
Changes in scope -0.6% -0.5% 0.0% 0.0% 28.6% -0.3%
Growth in constant FX 6.6% 8.4% 7.6% 5.7% 28.1% 7.1%
FX impact -1.9% -1.6% 0.5% 2.3% -0.6% -0.1%
Reported Growth 4.7% 6.8% 8.1% 7.9% 27.5% 7.0%
Organic growth including WDF 7.2% 8.9% 7.6% 5.7% 1.0% 7.4%
3.9%
-0.1%
19.2%
5.5%
7.7%
6.8%
6.3%
5.4%
10.8%
6.5%
-10.0% 0.0% 10.0% 20.0% 30.0%
Southern Europe and Africa
UK, Central and Eastern Europe
Asia, Middle East and Australia
Latin America
North America
Q4 '17 FY '17
21_ 2017 Full Year Results Presentation
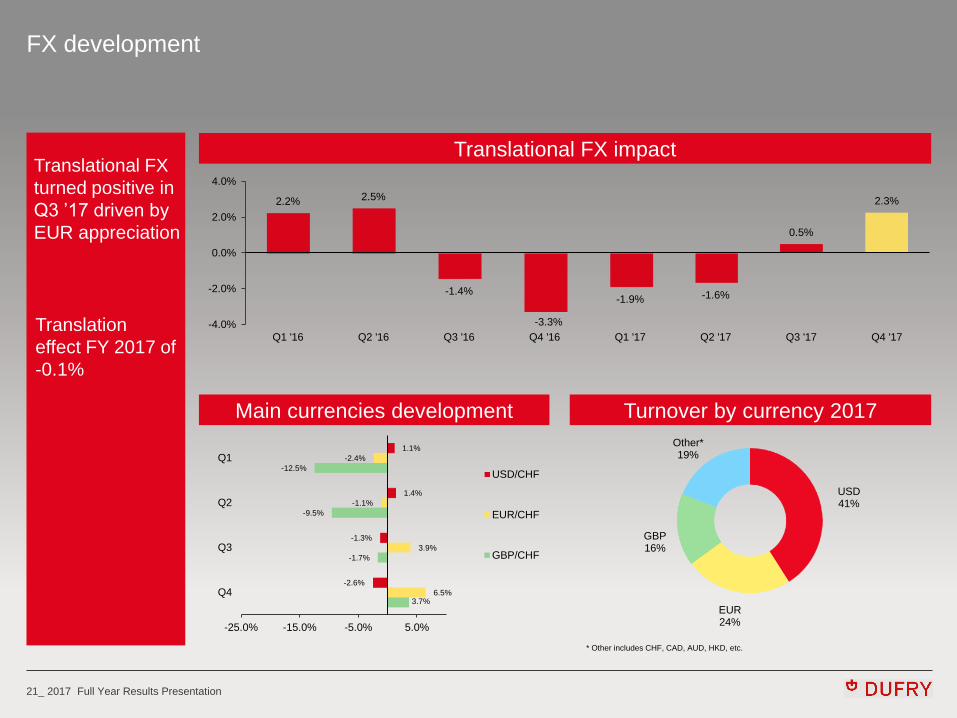
FX development
Translational FX
turned positive in
Q3 ’17 driven by
EUR appreciation
Translational FX impact
Main currencies development Turnover by currency 2017
Translation
effect FY 2017 of
-0.1%
* Other includes CHF, CAD, AUD, HKD, etc.
2.2% 2.5%
-1.4%
-3.3%
-1.9% -1.6%
0.5%
2.3%
-4.0%
-2.0%
0.0%
2.0%
4.0%
Q1 '16 Q2 '16 Q3 '16 Q4 '16 Q1 '17 Q2 '17 Q3 '17 Q4 '17
1.1%
1.4%
-1.3%
-2.6%
-2.4%
-1.1%
3.9%
6.5%
-12.5%
-9.5%
-1.7%
3.7%
-25.0% -15.0% -5.0% 5.0%
Q1
Q2
Q3
Q4
USD/CHF
EUR/CHF
GBP/CHF
USD 41%
EUR 24%
GBP 16%
Other* 19%
22_ 2017 Full Year Results Presentation
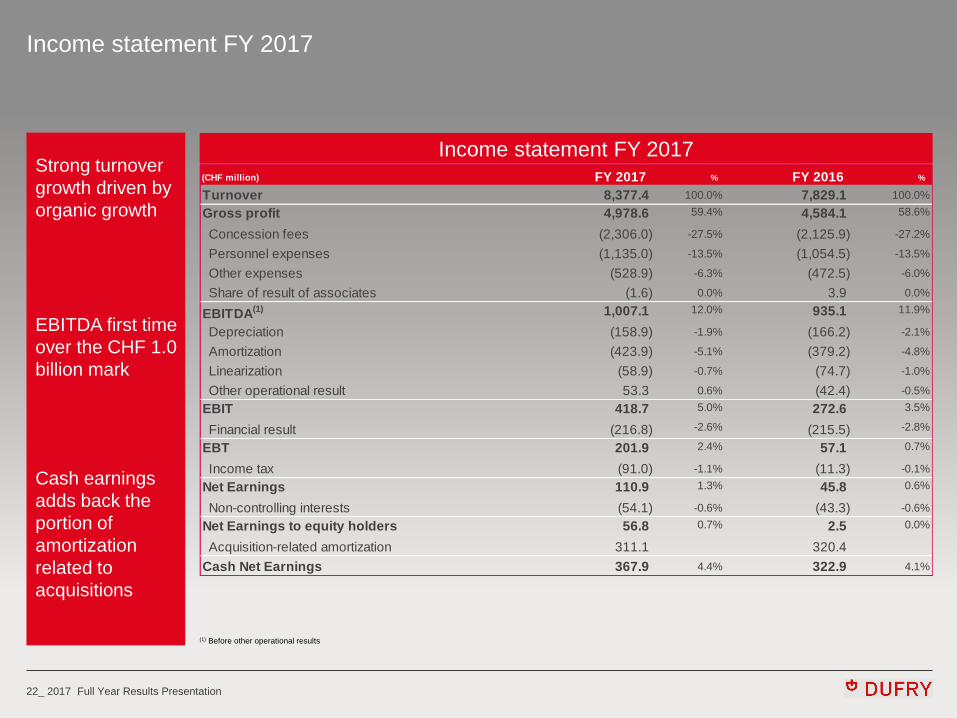
Income statement FY 2017
Strong turnover
growth driven by
organic growth
EBITDA first time
over the CHF 1.0
billion mark
Cash earnings
adds back the
portion of
amortization
related to
acquisitions
Income statement FY 2017
(1) Before other operational results
(CHF million) FY 2017 % FY 2016 %
Turnover 8,377.4 100.0% 7,829.1 100.0%
Gross profit 4,978.6 59.4% 4,584.1 58.6%
Concession fees (2,306.0) -27.5% (2,125.9) -27.2%
Personnel expenses (1,135.0) -13.5% (1,054.5) -13.5%
Other expenses (528.9) -6.3% (472.5) -6.0%
Share of result of associates (1.6) 0.0% 3.9 0.0%
EBITDA(1) 1,007.1 12.0% 935.1 11.9%
Depreciation (158.9) -1.9% (166.2) -2.1%
Amortization (423.9) -5.1% (379.2) -4.8%
Linearization (58.9) -0.7% (74.7) -1.0%
Other operational result 53.3 0.6% (42.4) -0.5%
EBIT 418.7 5.0% 272.6 3.5%
Financial result (216.8) -2.6% (215.5) -2.8%
EBT 201.9 2.4% 57.1 0.7%
Income tax (91.0) -1.1% (11.3) -0.1%
Net Earnings 110.9 1.3% 45.8 0.6%
Non-controlling interests (54.1) -0.6% (43.3) -0.6%
Net Earnings to equity holders 56.8 0.7% 2.5 0.0%
Acquisition-related amortization 311.1 320.4
Cash Net Earnings 367.9 4.4% 322.9 4.1%
23_ 2017 Full Year Results Presentation
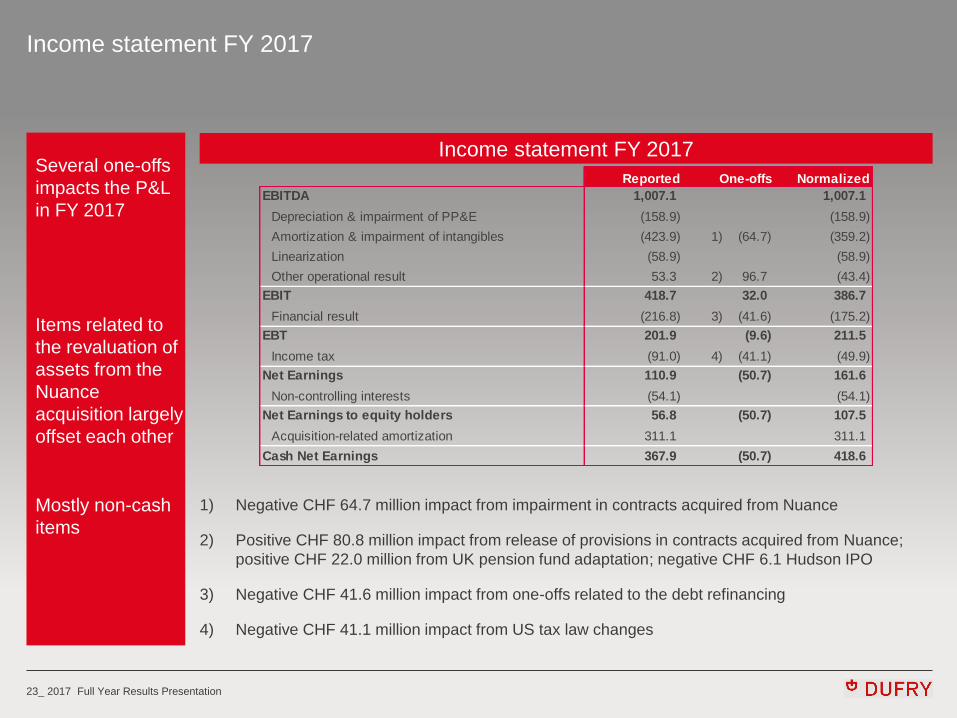
Income statement FY 2017
Several one-offs
impacts the P&L
in FY 2017
Items related to
the revaluation of
assets from the
Nuance
acquisition largely
offset each other
Mostly non-cash
items
Income statement FY 2017
1) Negative CHF 64.7 million impact from impairment in contracts acquired from Nuance
2) Positive CHF 80.8 million impact from release of provisions in contracts acquired from Nuance;
positive CHF 22.0 million from UK pension fund adaptation; negative CHF 6.1 Hudson IPO
3) Negative CHF 41.6 million impact from one-offs related to the debt refinancing
4) Negative CHF 41.1 million impact from US tax law changes
Reported Normalized
EBITDA 1,007.1 1,007.1
Depreciation & impairment of PP&E (158.9) (158.9)
Amortization & impairment of intangibles (423.9) 1) (64.7) (359.2)
Linearization (58.9) (58.9)
Other operational result 53.3 2) 96.7 (43.4)
EBIT 418.7 32.0 386.7
Financial result (216.8) 3) (41.6) (175.2)
EBT 201.9 (9.6) 211.5
Income tax (91.0) 4) (41.1) (49.9)
Net Earnings 110.9 (50.7) 161.6
Non-controlling interests (54.1) (54.1)
Net Earnings to equity holders 56.8 (50.7) 107.5
Acquisition-related amortization 311.1 311.1
Cash Net Earnings 367.9 (50.7) 418.6
One-offs
24_ 2017 Full Year Results Presentation
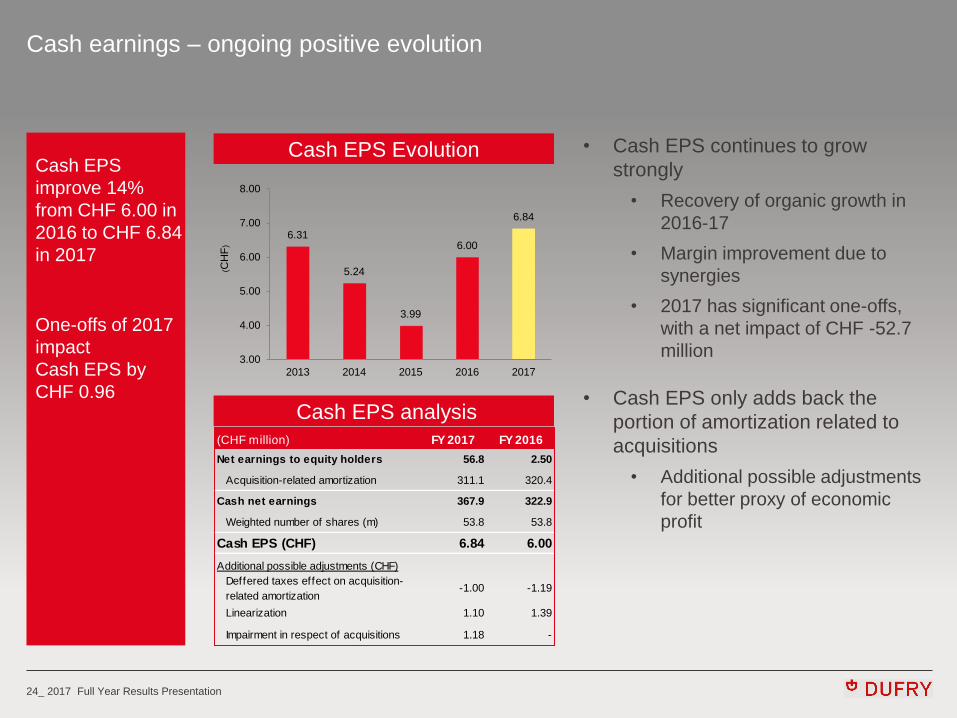
Cash earnings – ongoing positive evolution
Cash EPS
improve 14%
from CHF 6.00 in
2016 to CHF 6.84
in 2017
One-offs of 2017
impact
Cash EPS by
CHF 0.96
• Cash EPS continues to grow
strongly
• Recovery of organic growth in
2016-17
• Margin improvement due to
synergies
• 2017 has significant one-offs,
with a net impact of CHF -52.7
million
• Cash EPS only adds back the
portion of amortization related to
acquisitions
• Additional possible adjustments
for better proxy of economic
profit
Cash EPS analysis
Cash EPS Evolution
6.31
5.24
3.99
6.00
6.84
3.00
4.00
5.00
6.00
7.00
8.00
2013 2014 2015 2016 2017
(CH
F)
(CHF million) FY 2017 FY 2016
Net earnings to equity holders 56.8 2.50
Acquisition-related amortization 311.1 320.4
Cash net earnings 367.9 322.9
Weighted number of shares (m) 53.8 53.8
Cash EPS (CHF) 6.84 6.00
Additional possible adjustments (CHF)
Deffered taxes effect on acquisition-
related amortization-1.00 -1.19
Linearization 1.10 1.39
Impairment in respect of acquisitions 1.18 -
25_ 2017 Full Year Results Presentation
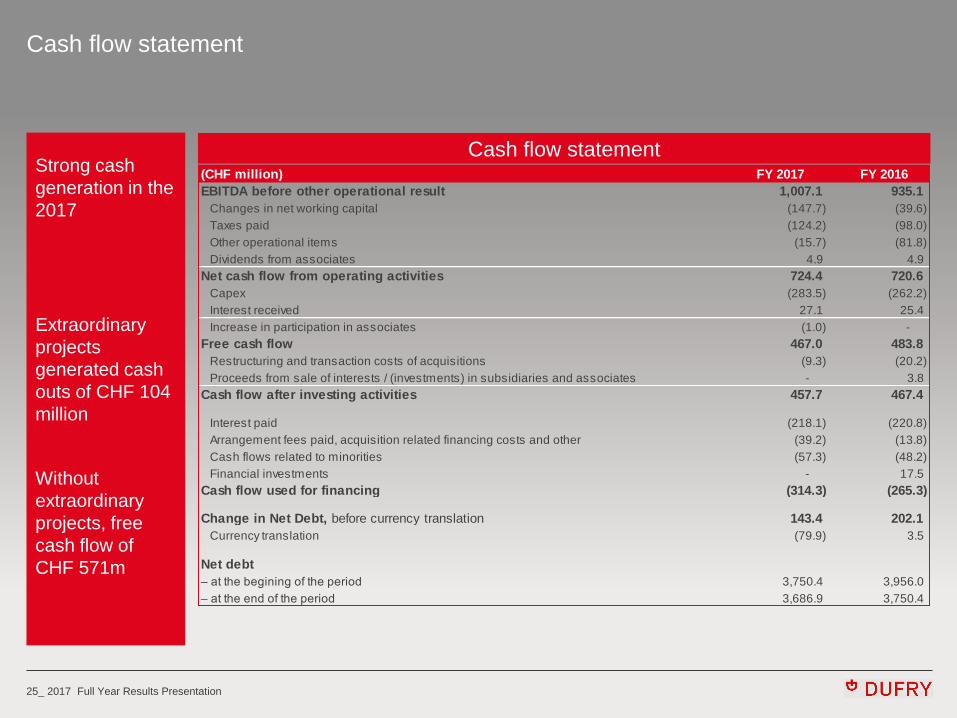
Cash flow statement
Strong cash
generation in the
2017
Extraordinary
projects
generated cash
outs of CHF 104
million
Without
extraordinary
projects, free
cash flow of
CHF 571m
Cash flow statement (CHF million) FY 2017 FY 2016
EBITDA before other operational result 1,007.1 935.1
Changes in net working capital (147.7) (39.6)
Taxes paid (124.2) (98.0)
Other operational items (15.7) (81.8)
Dividends from associates 4.9 4.9
Net cash flow from operating activities 724.4 720.6
Capex (283.5) (262.2)
Interest received 27.1 25.4
Increase in participation in associates (1.0) -
Free cash flow 467.0 483.8
Restructuring and transaction costs of acquisitions (9.3) (20.2)
Proceeds from sale of interests / (investments) in subsidiaries and associates - 3.8
Cash flow after investing activities 457.7 467.4
Interest paid (218.1) (220.8)
Arrangement fees paid, acquisition related financing costs and other (39.2) (13.8)
Cash flows related to minorities (57.3) (48.2)
Financial investments - 17.5
Cash flow used for financing (314.3) (265.3)
Change in Net Debt, before currency translation 143.4 202.1
Currency translation (79.9) 3.5
Net debt
– at the begining of the period 3,750.4 3,956.0
– at the end of the period 3,686.9 3,750.4
26_ 2017 Full Year Results Presentation
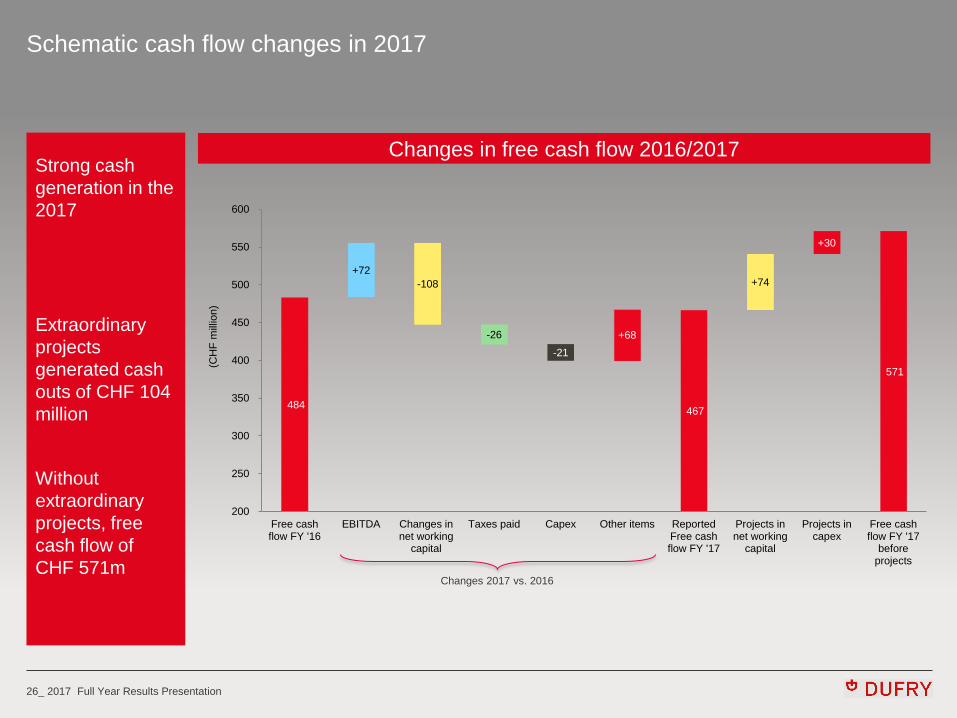
Schematic cash flow changes in 2017
Strong cash
generation in the
2017
Extraordinary
projects
generated cash
outs of CHF 104
million
Without
extraordinary
projects, free
cash flow of
CHF 571m
Changes in free cash flow 2016/2017
Changes 2017 vs. 2016
484
+72
-108
-26
-21
+68
467
+74
+30
571
200
250
300
350
400
450
500
550
600
Free cashflow FY '16
EBITDA Changes innet working
capital
Taxes paid Capex Other items ReportedFree cashflow FY '17
Projects innet working
capital
Projects incapex
Free cashflow FY '17
beforeprojects
(CH
F m
illio
n)
27_ 2017 Full Year Results Presentation
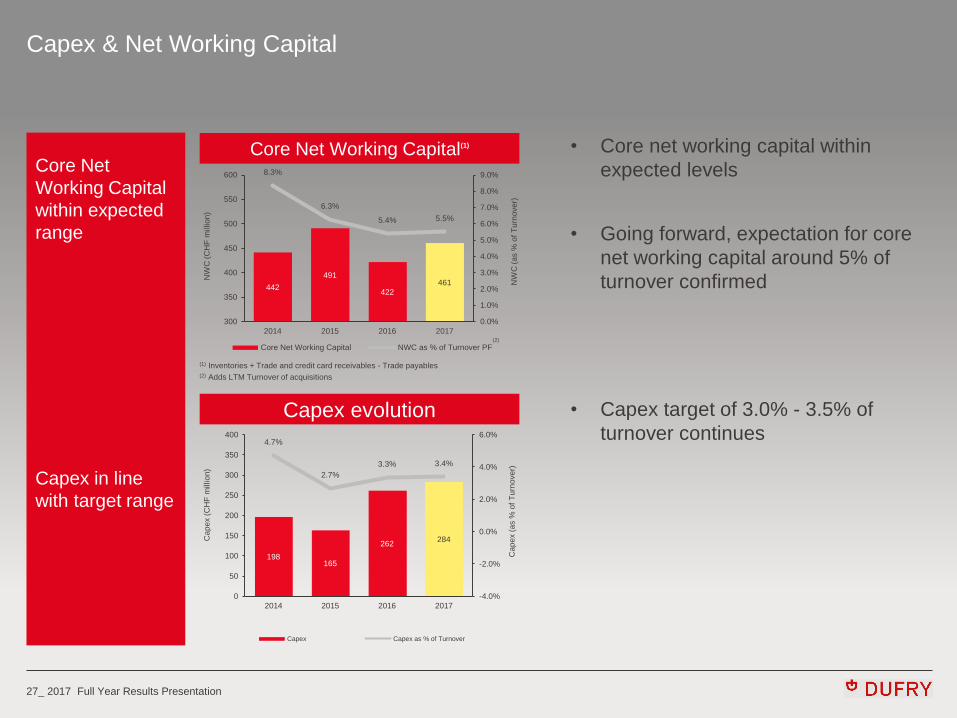
Capex & Net Working Capital
Core Net
Working Capital
within expected
range
Core Net Working Capital(1)
Capex evolution
(1) Inventories + Trade and credit card receivables - Trade payables (2) Adds LTM Turnover of acquisitions
• Core net working capital within
expected levels
• Going forward, expectation for core
net working capital around 5% of
turnover confirmed
• Capex target of 3.0% - 3.5% of
turnover continues
Capex in line
with target range
(2)
442
491
422
461
8.3%
6.3%
5.4% 5.5%
0.0%
1.0%
2.0%
3.0%
4.0%
5.0%
6.0%
7.0%
8.0%
9.0%
300
350
400
450
500
550
600
2014 2015 2016 2017
NW
C (
as %
of
Tu
rno
ve
r)
NW
C (
CH
F m
illio
n)
Core Net Working Capital NWC as % of Turnover PF
198 165
262 284
4.7%
2.7%
3.3% 3.4%
-4.0%
-2.0%
0.0%
2.0%
4.0%
6.0%
0
50
100
150
200
250
300
350
400
2014 2015 2016 2017
Cap
ex (
as %
of
Tu
rno
ve
r)
Cap
ex (
CH
F m
illio
n)
Capex Capex as % of Turnover
28_ 2017 Full Year Results Presentation
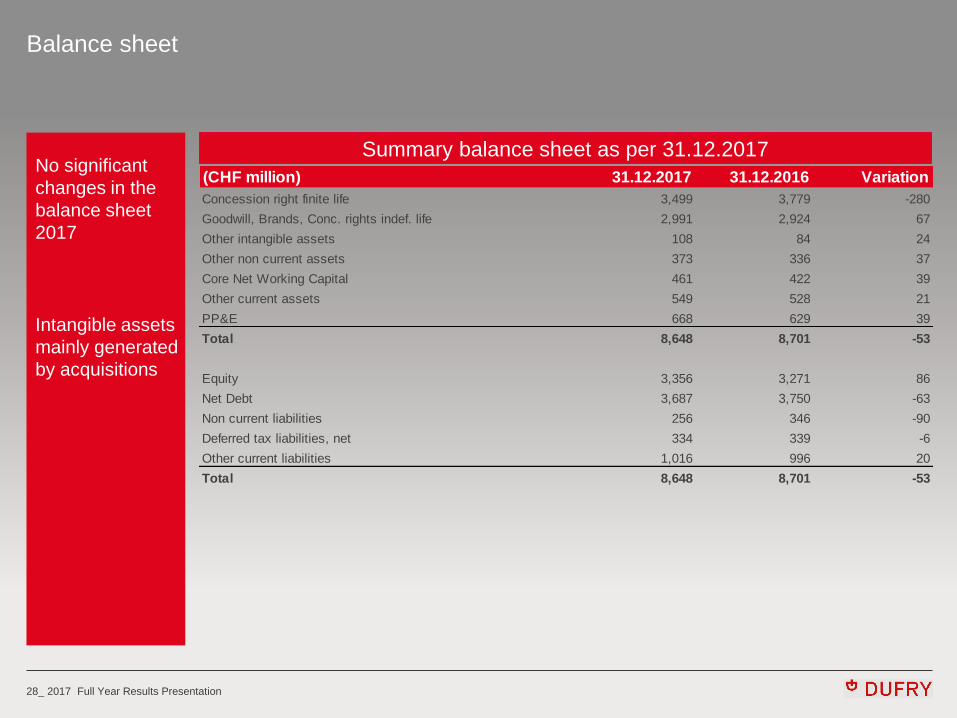
Balance sheet
No significant
changes in the
balance sheet
2017
Intangible assets
mainly generated
by acquisitions
Summary balance sheet as per 31.12.2017
(CHF million) 31.12.2017 31.12.2016 Variation
Concession right finite life 3,499 3,779 -280
Goodwill, Brands, Conc. rights indef. life 2,991 2,924 67
Other intangible assets 108 84 24
Other non current assets 373 336 37
Core Net Working Capital 461 422 39
Other current assets 549 528 21
PP&E 668 629 39
Total 8,648 8,701 -53
Equity 3,356 3,271 86
Net Debt 3,687 3,750 -63
Non current liabilities 256 346 -90
Deferred tax liabilities, net 334 339 -6
Other current liabilities 1,016 996 20
Total 8,648 8,701 -53
29_ 2017 Full Year Results Presentation
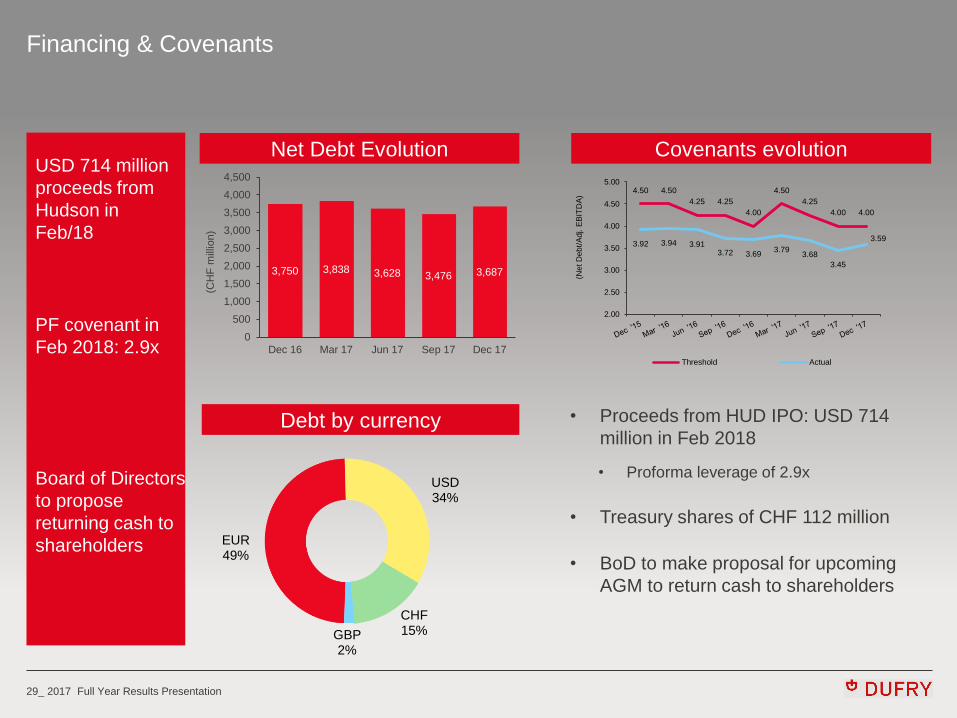
Financing & Covenants
Board of Directors
to propose
returning cash to
shareholders
Net Debt Evolution Covenants evolution
USD 714 million
proceeds from
Hudson in
Feb/18
PF covenant in
Feb 2018: 2.9x
Debt by currency
EUR 49%
USD 34%
CHF 15% GBP
2%
3,750 3,838 3,628 3,476 3,687
0
500
1,000
1,500
2,000
2,500
3,000
3,500
4,000
4,500
Dec 16 Mar 17 Jun 17 Sep 17 Dec 17
(CH
F m
illio
n)
4.50 4.50
4.25 4.25
4.00
4.50
4.25
4.00 4.00
3.92 3.94 3.91 3.72 3.69
3.79 3.68
3.45
3.59
2.00
2.50
3.00
3.50
4.00
4.50
5.00
(Net D
eb
t/A
dj. E
BIT
DA
)
Threshold Actual
• Proceeds from HUD IPO: USD 714
million in Feb 2018
• Proforma leverage of 2.9x
• Treasury shares of CHF 112 million
• BoD to make proposal for upcoming
AGM to return cash to shareholders
30_ 2017 Full Year Results Presentation
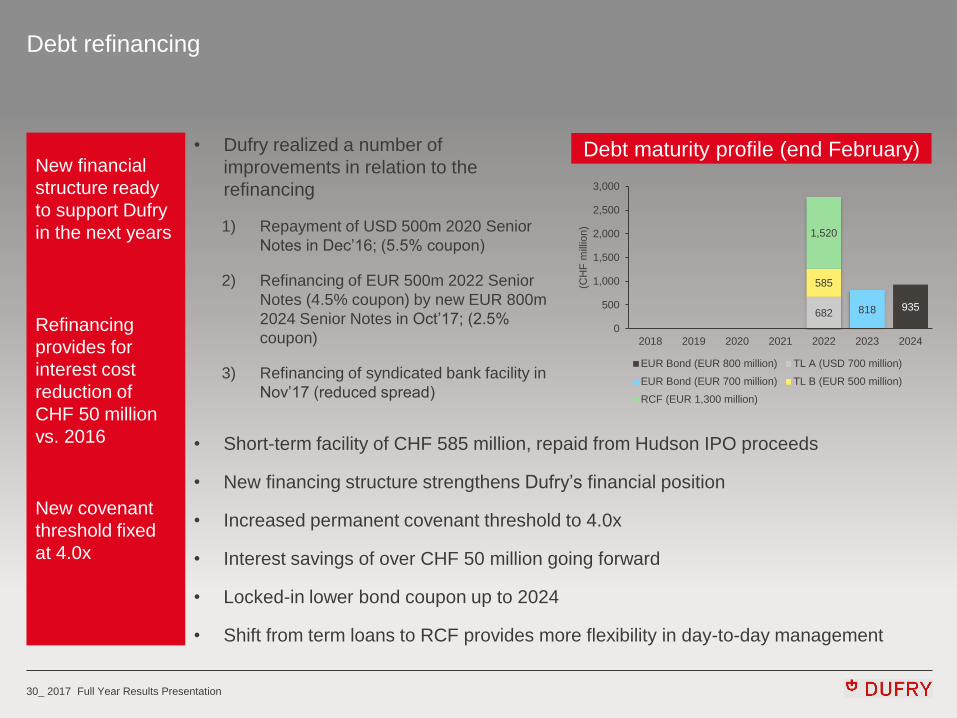
Debt refinancing
New covenant
threshold fixed
at 4.0x
New financial
structure ready
to support Dufry
in the next years
Refinancing
provides for
interest cost
reduction of
CHF 50 million
vs. 2016
Debt maturity profile (end February) • Dufry realized a number of
improvements in relation to the
refinancing
1) Repayment of USD 500m 2020 Senior
Notes in Dec’16; (5.5% coupon)
2) Refinancing of EUR 500m 2022 Senior
Notes (4.5% coupon) by new EUR 800m
2024 Senior Notes in Oct’17; (2.5%
coupon)
3) Refinancing of syndicated bank facility in
Nov’17 (reduced spread)
935 682 818
585
1,520
0
500
1,000
1,500
2,000
2,500
3,000
2018 2019 2020 2021 2022 2023 2024
(CH
F m
illio
n)
EUR Bond (EUR 800 million) TL A (USD 700 million)
EUR Bond (EUR 700 million) TL B (EUR 500 million)
RCF (EUR 1,300 million)
• Short-term facility of CHF 585 million, repaid from Hudson IPO proceeds
• New financing structure strengthens Dufry’s financial position
• Increased permanent covenant threshold to 4.0x
• Interest savings of over CHF 50 million going forward
• Locked-in lower bond coupon up to 2024
• Shift from term loans to RCF provides more flexibility in day-to-day management
31_ 2017 Full Year Results Presentation
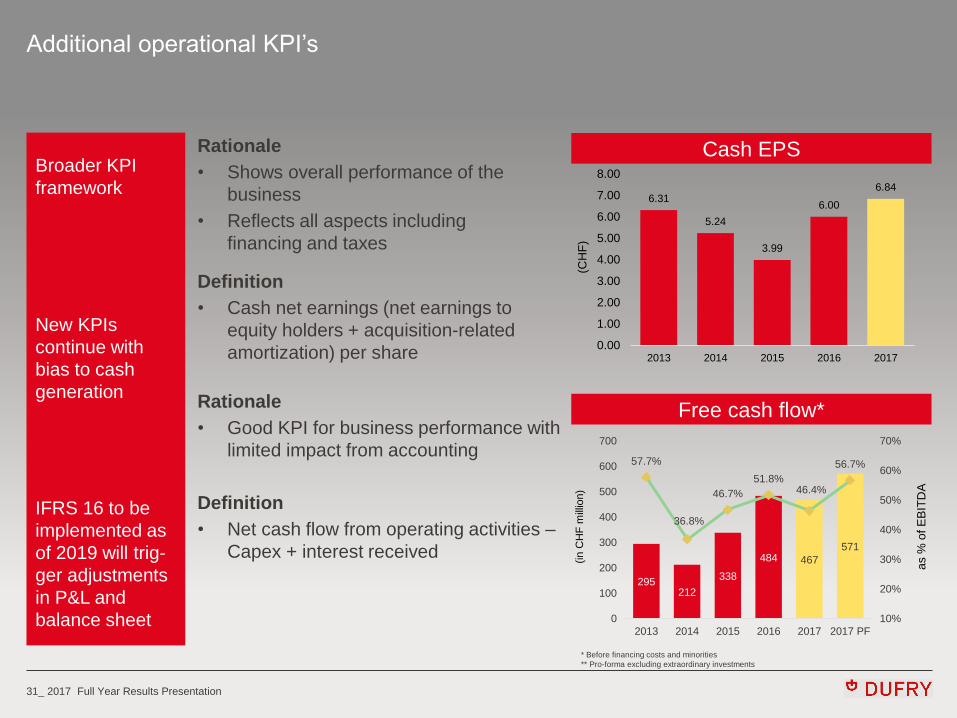
Additional operational KPI’s
IFRS 16 to be
implemented as
of 2019 will trig-
ger adjustments
in P&L and
balance sheet
Broader KPI
framework
New KPIs
continue with
bias to cash
generation
Cash EPS Rationale
• Shows overall performance of the
business
• Reflects all aspects including
financing and taxes
Definition
• Cash net earnings (net earnings to
equity holders + acquisition-related
amortization) per share
Free cash flow*
6.31
5.24
3.99
6.00
6.84
0.00
1.00
2.00
3.00
4.00
5.00
6.00
7.00
8.00
2013 2014 2015 2016 2017
(CH
F)
* Before financing costs and minorities
** Pro-forma excluding extraordinary investments
Rationale
• Good KPI for business performance with
limited impact from accounting
Definition
• Net cash flow from operating activities ‒
Capex + interest received
295 212
338
484 467
571
57.7%
36.8%
46.7%
51.8% 46.4%
56.7%
10%
20%
30%
40%
50%
60%
70%
0
100
200
300
400
500
600
700
2013 2014 2015 2016 2017 2017 PF
(in
CH
F m
illio
n)
as %
of
EB
ITD
A
32_ 2017 Full Year Results Presentation
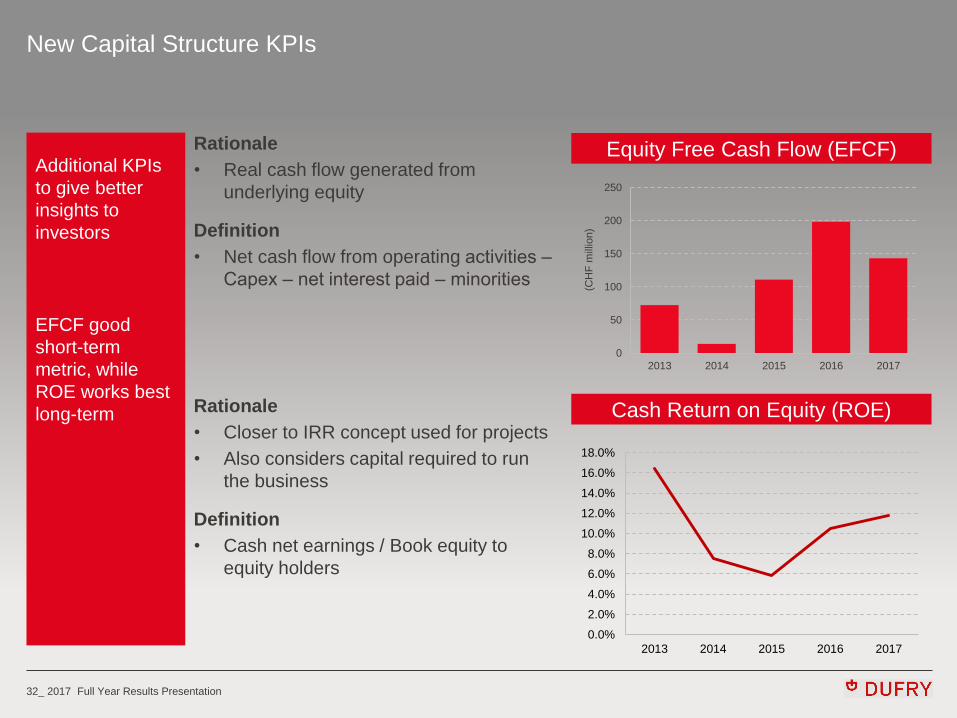
New Capital Structure KPIs
Additional KPIs
to give better
insights to
investors
EFCF good
short-term
metric, while
ROE works best
long-term
Equity Free Cash Flow (EFCF) Rationale
• Real cash flow generated from
underlying equity
Definition
• Net cash flow from operating activities ‒
Capex ‒ net interest paid ‒ minorities
Cash Return on Equity (ROE) Rationale
• Closer to IRR concept used for projects
• Also considers capital required to run
the business
Definition
• Cash net earnings / Book equity to
equity holders
0
50
100
150
200
250
2013 2014 2015 2016 2017
(CH
F m
illio
n)
0.0%
2.0%
4.0%
6.0%
8.0%
10.0%
12.0%
14.0%
16.0%
18.0%
2013 2014 2015 2016 2017
33_ 2017 Full Year Results Presentation
CONCLUSION 3

34_ 2017 Full Year Results Presentation
Conclusion
• Successful 2017: Targets set for the year achieved:
• Sales & organic growth acceleration
• EBITDA for the first time above CHF 1 billion
• Cash generation at high levels and ongoing deleveraging
• Considerable increase of cash EPS
• Priorities set for 2018
• New organization with new, reduced Global Executive Committee and new Divisional
Committee in place and operational
• Implementation of new business operating model (BOM) on track; full implementation by end
2018
• Drive new strategic initiatives to expand business across sectors and channels
• Accelerate implementation of customer focused and digital initiatives to drive sales
• Focus on cash generation and deleveraging
• Return cash to shareholders – proposal for AGM
Targets for 2017
achieved
Priorities for
2018 set
Start returning
cash to
shareholders
Thank you