Embed Size (px)
Citation preview


FY 2017 ANNUAL URBAN RENEWAL REPORT TAX INCREMENT FINANCING (TIF)
FISCAL SERVICES DIVISION In consultation with
IOWA DEPARTMENT OF MANAGEMENT FEBRUARY 15, 2018

I o w a F Y 2 0 1 7 A n n u a l U r b a n R e n e w a l R e p o r t P a g e | 1
Introduction House File 2460 (Tax Increment Finance Reporting Act of 2012) established new Urban Renewal and Tax Increment Financing (TIF) reporting requirements for counties, cities, and Rural Improvement Zones with Urban Renewal Areas in place during FY 2012 and subsequent fiscal years.
Tax increment financing is a financing mechanism for urban renewal. It involves dividing the property taxes paid from property within a designated area between the traditional taxing authorities (counties, cities, schools, etc.) and the taxing authority that created the TIF area.
The reporting requirements in HF 2460 generally relate to the property tax implications of TIF:
• Information on the amount of property tax revenue diverted to TIF.
• Property tax rebates paid with TIF funds in the report fiscal year and planned for future fiscal years.
• Local government debt to be repaid with future TIF revenue.
• TIF Special Revenue Fund income, expenses, and balances.
The requirements also include:
• Reporting on characteristics of each TIF Taxing District and Urban Renewal Area.
• Low and moderate income housing financial statistics.
• Data on development agreements that include job requirements and TIF expenditures.
• A financial analysis of any public buildings proposed for renovation or construction paid in whole or in part with TIF funding.
In addition, local governments must provide copies of maps, ordinances, and adopted plans in place for each Urban Renewal Area.
Reporting must be submitted electronically pursuant to instructions prescribed by the Department of Management (DOM) in consultation with the Legislative Services Agency (LSA). House File 2460 further required the LSA, in consultation with the DOM, to deliver an annual report to the Governor and the General Assembly summarizing and analyzing the information submitted in the local government reports. This document serves as the required annual report. Appendix A to this document provides basic information on TIF and a brief history of TIF reporting requirements.
The website for local government data entry, as well as for public access to the data, is found at: www.legis.iowa.gov/tif/la. See Appendix B for a screenshot of the urban renewal reporting and public access website.

I o w a F Y 2 0 1 7 A n n u a l U r b a n R e n e w a l R e p o r t P a g e | 2
Local Government Responses For FY 2017, 478 cities, counties, and Rural Improvement Zones had a total of 1,052 Urban Renewal Areas either on file with the DOM or reported as additional areas during this year’s TIF reporting process.1 A total of 16 local governments with $0.1 million of budgeted TIF revenue for FY 2017 had not concluded the reporting process as of January 30, 2018. Eleven of the 16 local governments that had not finished the reporting process did not receive any TIF revenue in FY 2017. Local governments with Urban Renewal Areas are not allowed to certify their budgets for the upcoming fiscal year without first completing the most recent urban renewal report. For last year’s reporting cycle, a total of 18 local governments had not submitted completed reports in time for the annual report process. 2
Financial Summary Local governments were asked to report FY 2017 revenue, expenditure, and fund balance information for all Urban Renewal Areas. For each local government, the amounts for all areas should sum to the revenue, expenditure, and balances of that local government’s TIF Special Revenue Fund. Table 1 presents total balance, revenue, and expenditure information across all TIF Special Revenue Funds as reported by local governments. • Beginning Balance — Across all reporting entities, the beginning balance in TIF
Special Revenue Funds totaled $156.3 million, an increase of $27.0 million compared to the FY 2016 total beginning balance. The beginning balance for FY 2017 was $9.7 million above the ending balance for FY 2016. This discrepancy is likely the result of differences among the entities reporting and not reporting across the years, combined with audit and other math adjustments made after the FY 2016 annual report was submitted. At $156.3 million, the beginning balance is an amount equal to 41.5% of reported FY 2017 TIF Special Revenue Fund revenue.
• TIF Property Tax Revenue — Reported TIF property tax revenue for FY 2017 across all reporting entities totaled $310.4 million. The DOM property tax and local government budget system indicates that FY 2017 TIF property tax revenue should total $326.5 million, indicating that at least $16.1 million (4.9%) of FY 2017 TIF property tax revenue was not reported.
• Interest — Interest on balances held within an Urban Renewal Special Revenue Fund is to be deposited to that Fund and used to repay TIF debt. The FY 2017 total interest reported across all entities was $6.3 million, $2.1 million higher than the $4.2 million reported the previous year. However, the destination of Fund balance interest is a potential issue. There were 279 entities with beginning balances of $10,000 or greater for FY 2017, but only 121 of those reported TIF interest for the year. Of the 29 entities with more than a $1.0 million beginning balance, six reported no interest deposited to their TIF Special Revenue Funds in FY 2017. Those six local governments and their reported TIF Revenue Fund beginning balances include:
• Hardin County ($1.8 million).
1 Although the reporting requirements center on the financial implications of TIF, Urban Renewal Areas that do not utilize TIF may also be subject to the reporting requirements. Urban Renewal Areas that have not yet utilized TIF revenue are not included in the DOM Property Valuation System. 2 Although 18 local governments had not filed FY 2016 TIF reports in time for last year’s annual report, all local governments filed reports in time for certification of their FY 2018 budgets.

I o w a F Y 2 0 1 7 A n n u a l U r b a n R e n e w a l R e p o r t P a g e | 3
• Tiffin ($1.7 million). • Dyersville ($1.6 million). • Polk City ($1.4 million). • Windsor Heights ($1.4 million). • Blue Grass ($1.2 million).
• Property Tax Replacement Claims — Legislation enacted in 2013 (SF 295 — Property Tax Modifications Act) reduced the percentage of commercial and industrial property value that is subject to property tax from 100.0% to 90.0%. That legislation created a State General Fund appropriation to reimburse local governments for the associated property tax revenue reduction. The LSA analysis of DOM property tax rate and valuation files for TIF increment districts indicates that the State General Fund TIF reimbursement for FY 2017 should have totaled $26.7 million. However, entities reported just 53.6% of that amount ($14.3 million) in State reimbursements, indicating that in some instances reimbursement amounts are either unreported, utilized outside of TIF, or incorrectly reported as another revenue source to the TIF Special Revenue Fund.
• Asset Sales and Repayments — Proceeds from the sale of assets purchased with TIF funds and from other reimbursements and repayments are to be deposited to the TIF Special Revenue Fund and used to repay TIF debt.
• Rebates — Property tax rebates paid from TIF revenue totaled $67.0 million in FY 2017, up from $63.3 million for FY 2016.
• Nonrebate Expenditures — Nonrebate expenditures represent the repayment of TIF indebtedness. A total of $303.8 million in nonrebate TIF debt was repaid in FY 2017.
• Returned to Property Tax System – Nine local governments reported a total of $0.3 million in excess TIF Special Revenue Funds being returned to the property tax system in FY 2017. Money returned to the property tax system in this manner is distributed to the regular property tax levy authorities.
• Ending Balance — The combined balance of all TIF Special Revenue Funds grew $14.9 million during FY 2017, compared to the reported ending balance for FY 2016.

I o w a F Y 2 0 1 7 A n n u a l U r b a n R e n e w a l R e p o r t P a g e | 4
Debt The survey of local governments required information on all outstanding debts at the beginning of FY 2017 that were to be paid in FY 2017 and future fiscal years with TIF property tax revenue. A total of 402 local governments reported a total of 3,122 debts outstanding (excludes any debts reported as zero) totaling $3.205 billion. Some entities reported debt repayments extending more than 30 years. Just over 50.0% of the debt repayment relates to debt schedules that extend beyond FY 2027. Table 2 provides a breakdown of the total TIF debt reported by all local governments.
FY 2012 FY 2013 FY 2014 FY 2015 FY 2016 FY 2017Beginning Balance 104.5$ 101.9$ 99.5$ 107.7$ 129.3$ 156.3$
TIF Property Tax Revenue 274.2 293.9 288.6 304.2 295.2 310.4Interest 6.4 2.9 1.0 3.3 4.2 6.3
Property Tax Replacement Claims 0.0 0.0 0.0 2.6 14.8 14.3Asset Sales & Repayments 19.6 31.5 33.6 19.1 19.1 45.3
Total Revenue 300.2$ 328.3$ 323.2$ 329.2$ 333.3$ 376.3$
Rebates 61.6 69.8 62.2 60.1 63.3 67.0Nonrebate Expenditures 229.1 264.0 249.4 256.5 252.5 303.8
Returned to Prop. Tax System 0.1 0.1 0.3 0.9 0.2 0.3Total Expenditures 290.8$ 333.9$ 311.9$ 317.5$ 316.0$ 371.1$
Ending Balance 113.9$ 96.3$ 110.8$ 119.4$ 146.6$ 161.5$
Table 1Financial Summary – TIF Special Revenue Funds
(in Millions)
Fiscal Year of Final Debt Payment
Millions of Dollars
% of Total
FY 2017 77.7$ 2.8%FY 2018 - FY 2022 565.1 16.7%FY 2023 - FY 2027 884.8 28.9%FY 2028 - FY 2032 803.9 23.9%FY 2033 - FY 2037 529.6 14.0%FY 2038 & After 344.2 13.7%Total 3,205.3$ 100.0%
Table 2TIF Debt Reported – FY 2017
I o w a F Y 2 0 1 7 A n n u a l U r b a n R e n e w a l R e p o r t P a g e | 5
The TIF debt was reported in six categories (see Table 3): • General Obligation Bonds — Bonds that are the obligation of the local government.
These bonds are backed by unlimited property tax authority. • Internal Loans — Money owed to one of the funds of the local government itself.
Generally, the debt is created when the local government pays a TIF expenditure from existing funds, and the debt is retired when TIF funds are transferred to reimburse the original funding source.
• Other Debt — Debt that is owed to other entities that is not bond debt, such as bank loans.
• Rebates — Debt that is owed as part of a property tax rebate or development agreement between the local government and property owners. For the purposes of the annual urban renewal report, the local governments were required to report all agreements with the assumption that all future rebate payments will be made. For instances where the value of the rebate for future years is not known, best estimates are to be used.
• TIF Revenue Bonds — Bonds that are the obligation of the local government, but are only repayable from the specific TIF revenue pledged to the bonds. If the revenue from TIF is insufficient, the debt may not be fully repaid.
• Low and Moderate Income (LMI) Housing — Iowa Code section 403.22 requires local government urban renewal projects to include assistance for low-income and moderate-income housing, if the project itself is in an economic development Urban Renewal Area and if the project provides or aids in the provision of public improvements related to housing and residential development. The amount of required LMI assistance varies by city population. The Iowa Code does not specify when the expenditure on low-income and moderate-income housing assistance must occur. Therefore, local governments that are required to expend money on LMI housing, but have yet to do so, reflect the obligation as an outstanding debt.

I o w a F Y 2 0 1 7 A n n u a l U r b a n R e n e w a l R e p o r t P a g e | 6
Annual appropriation debt differs from ordinary indebtedness. While ordinary indebtedness requires the periodic repayment of all principal and interest from the funding source pledged as the repayment source, annual appropriation debt documents specifically state that the local government reserves the right to not appropriate funds to make one or more debt payments. The documents that create the debt do not give the debt holder recourse to demand payment should the nonappropriation option be exercised. On a year-to-year basis, payments are at the discretion of the governing board or council. As indicated in Table 4, 39.3% of TIF debt statewide is reported as annual appropriation debt. Local governments are required to report annual appropriation debt with the assumption that all annual payments will be made by future boards and councils.
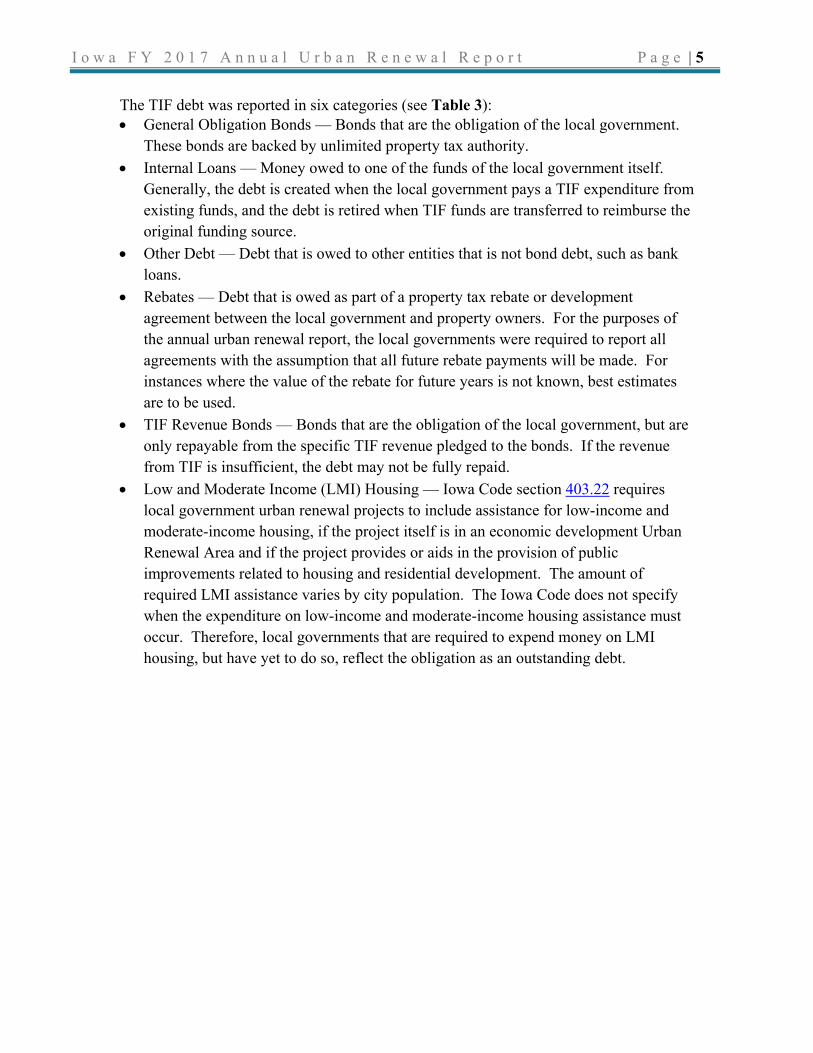
A total of 402 local governments reported 3,122 debt instances. The 10 local governments with the largest dollar amount of TIF debt are listed in Table 5, along with the final fiscal year for their longest debt schedule. The 10 local governments listed in Table 5 represent 51.1% of all TIF debt reported. To provide perspective on the size of each city’s TIF debt, the right two columns of Table 5 provide the taxed value of the city for property tax purposes and the TIF debt as a percentage of the taxed value of the city.
Debt Type Principal Interest Debt % of TotalGeneral Obligation Bonds 1,552.0$ 347.1$ 1,899.1$ 59.2%Internal Loans 141.5 1.5 143.0 4.5%Other Debt 142.5 20.7 163.2 5.1%Rebates 699.2 2.7 701.9 21.9%TIF Revenue Bonds 165.0 118.0 283.0 8.8%Low and Mod. Income Housing 14.9 0.2 15.1 0.5%Total 2,715.1$ 490.2$ 3,205.3$ 100.0%
Table 3Reported Debt by Debt Type – FY 2017
(Dollars in Millions)
Appropriation Category Principal Interest Debt % of TotalConventional Debt 1,655.5$ 291.5$ 1,947.0$ 60.7%Annual Appropriation Debt 1,059.6 198.7 1,258.3 39.3%Total 2,715.1$ 490.2$ 3,205.3$ 100.0%
Table 4Debt by Appropriation Category – FY 2017
(Dollars in Millions)
I o w a F Y 2 0 1 7 A n n u a l U r b a n R e n e w a l R e p o r t P a g e | 7
The 10 cities represent 36.1% of the taxed value of all Iowa cities, and 56.7% of all reported FY 2017 city TIF debt.
Bond Debt
General Obligation Bond Debt — Local governments reported 1,027 separate general obligation bond debts, with debt payments totaling $1.899 billion and the longest payment schedule extending through FY 2043. The payment schedules of 54.8% of the reported debt extend to FY 2028 and beyond. The largest single bond debt listed was by the city of Cedar Rapids for $72.3 million. This debt has a payment schedule that lasts through FY 2042 and it is not listed as an annual appropriation debt. Urban Renewal and Tax Increment Financing Revenue Bond Debt — Local governments reported 92 separate TIF revenue bond debts, with debt payments totaling $283.0 million and the longest payment schedule extending through FY 2047. The payment schedules of 86.6% of the reported debt extend to FY 2028 and beyond. The largest single bond debt listed was by the city of Altoona for $110.6 million. This debt has a payment schedule that lasts through FY 2043 and is listed as an annual appropriation debt.
Internal Loan Debt Local governments reported 647 internal loan debts totaling $143.0 million, with eight loans extending past FY 2040. The city of Cedar Falls has the single largest internal loan debt. This $15.8 million debt was incurred in FY 2009 and has a listed final payment year of FY 2022. Of all internal loan debt, 21.5% has a payment schedule extending to FY 2028 or longer.
Other Debt Local governments reported 211 debts categorized as “other,” with future debt payments totaling $163.2 million. The largest single loan in this category is a $54.6 million annual appropriation debt listed by the city of Coralville. This debt has a payment schedule
Local GovernmentConventional
Debt
Annual Appropriation
DebtTotal Debt
Latest Repayment
Date Reported
Total FY 17 Taxable
Value of City
TIF Debt as a % of City
Taxed Value
Coralville 104.2$ 290.2$ 394.4$ FY 2047 1,600.9$ 24.6%Altoona 32.0 115.5 147.5 FY 2043 926.5 15.9%Dubuque 109.9 21.2 131.1 FY 2045 2,729.0 4.8%Des Moines 139.8 206.4 346.2 FY 2042 7,531.7 4.6%Sioux City 101.2 0.0 101.2 FY 2033 2,858.4 3.5%Cedar Rapids 175.5 0.0 175.5 FY 2043 6,314.5 2.8%Waterloo 66.4 0.0 66.4 FY 2038 2,497.0 2.7%West Des Moines 94.5 21.6 116.1 FY 2031 4,774.3 2.4%Ankeny 61.0 7.9 68.9 FY 2030 2,901.2 2.4%Davenport 43.5 47.7 91.2 FY 2037 4,211.0 2.2%
TIF Debt Reported – FY 2017(Dollars in Millions)
Table 5

I o w a F Y 2 0 1 7 A n n u a l U r b a n R e n e w a l R e p o r t P a g e | 8
ending in FY 2025. Of all outstanding debt classified as other debt, 18.8% has a payment schedule extending to FY 2028 or longer.
Rebate Debt Local governments reported 1,090 separate rebate agreements with rebate debt outstanding. The rebate debt totals $701.9 million, with the longest rebate agreement extending through FY 2042. Of all rebate agreement debt, 46.7% has a payment schedule extending to FY 2028 or longer. The largest rebate agreement ($20.4 million) is between the city of Des Moines and Nationwide Insurance. The agreement was entered into in 2006 and extends through FY 2031.
Low and Moderate Income Housing Debt A total of 54 local governments reported 80 separate debts associated with LMI obligations. The LMI debt obligations total $15.1 million. A total of $7.0 million (46.5%) of this LMI debt carries an incurred year of 2008 or earlier.
FY 2017 Rebate Expenditures A total of 225 local governments reported $67.0 million in rebate payments issued from TIF revenue to taxpayers during FY 2017. Eighteen cities issued 66.4% of the FY 2017 rebated tax dollars. The list of local governments rebating $1.0 million or more is found in Table 6.

I o w a F Y 2 0 1 7 A n n u a l U r b a n R e n e w a l R e p o r t P a g e | 9
Table 7 provides a list of companies and entities receiving $1.0 million or more in TIF-financed property tax rebates in FY 2017, as reported by the local governments. The largest single FY 2017 rebate entity was $3.4 million to DuPont Pioneer.
Local GovernmentTax Rebate
Total
# of Reported Rebates
DES MOINES 14.3$ 39 DUBUQUE 3.6 40 CEDAR RAPIDS 2.6 17 NORWALK 2.5 9 WEST DES MOINES 2.5 5 JOHNSTON 2.2 11 CORALVILLE 2.2 10 LE CLAIRE 1.8 35 CLINTON 1.6 3 DAVENPORT 1.5 10 WATERLOO 1.4 33 NEVADA 1.3 5 BETTENDORF 1.3 19 HUXLEY 1.2 13 ALTOONA 1.2 13 COUNCIL BLUFFS 1.2 9 MUSCATINE 1.1 9 NORTH LIBERTY 1.0 3 207 Other Local Governments 22.5 666 Total 67.0$ 949
Table 6FY 2017 Local Government Rebate Totals
(Dollars in Millions)

I o w a F Y 2 0 1 7 A n n u a l U r b a n R e n e w a l R e p o r t P a g e | 10
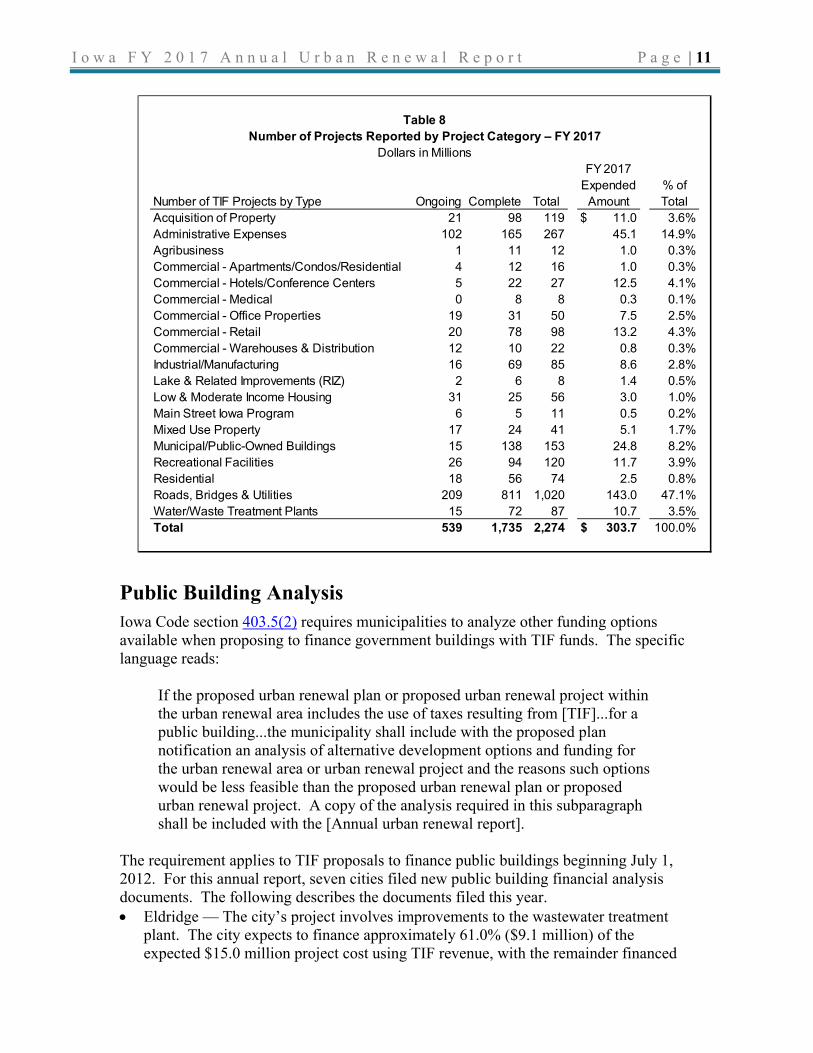
Nonrebate Projects Local governments reported a total of 2,274 nonrebate projects financed through TIF Special Revenue Funds in FY 2017. Local governments were required to categorize projects according to the expenditure type and also specify whether the project was physically complete by the end of FY 2017. Of those projects, 1,735 were listed as physically complete and 539 projects were in progress. Table 8 provides a breakdown of projects by number and by FY 2017 expenditure amount. Note that the expenditure amounts represent the payments made in FY 2017 and do not reflect the entire cost of the projects. The category of Roads, Bridges, and Utilities represents 44.9% of the number of projects and 47.1% of project expenditures for the year. As a percent of nonrebate expenditures, the second most common category is administrative expenses (14.9%), followed by public-owned buildings (8.2%).
Rebated To:Rebate Amount
Reported % of Total LocationDuPont Pioneer 3.4$ 5.1% Johnston/Nevada/Spencer/Dallas CenterNationwide Mutual Insurance Company 2.3 3.4% Des MoinesCity of Des Moines 2.2 3.3% Des MoinesUnited Properties 2.2 3.3% NorwalkWellmark 1.6 2.4% Des MoinesCitizens First Bank c/o Valley Bluff 1.3 1.9% ClintonWells Fargo Financial 1.2 1.8% Des MoinesDavis Brown 1.2 1.8% Des MoinesMicrosoft 1.2 1.8% West Des Moines928 Other Rebate Agreements 50.4 75.2% VariousTotal 67.0$ 100.0%
(Dollars in Millions)
Table 7FY 2017 Rebates by Entity
I o w a F Y 2 0 1 7 A n n u a l U r b a n R e n e w a l R e p o r t P a g e | 11
Public Building Analysis Iowa Code section 403.5(2) requires municipalities to analyze other funding options available when proposing to finance government buildings with TIF funds. The specific language reads:
If the proposed urban renewal plan or proposed urban renewal project within the urban renewal area includes the use of taxes resulting from [TIF]...for a public building...the municipality shall include with the proposed plan notification an analysis of alternative development options and funding for the urban renewal area or urban renewal project and the reasons such options would be less feasible than the proposed urban renewal plan or proposed urban renewal project. A copy of the analysis required in this subparagraph shall be included with the [Annual urban renewal report].
The requirement applies to TIF proposals to finance public buildings beginning July 1, 2012. For this annual report, seven cities filed new public building financial analysis documents. The following describes the documents filed this year. • Eldridge — The city’s project involves improvements to the wastewater treatment
plant. The city expects to finance approximately 61.0% ($9.1 million) of the expected $15.0 million project cost using TIF revenue, with the remainder financed
FY 2017Expended % of
Number of TIF Projects by Type Ongoing Complete Total Amount TotalAcquisition of Property 21 98 119 11.0$ 3.6%Administrative Expenses 102 165 267 45.1 14.9%Agribusiness 1 11 12 1.0 0.3%Commercial - Apartments/Condos/Residential 4 12 16 1.0 0.3%Commercial - Hotels/Conference Centers 5 22 27 12.5 4.1%Commercial - Medical 0 8 8 0.3 0.1%Commercial - Office Properties 19 31 50 7.5 2.5%Commercial - Retail 20 78 98 13.2 4.3%Commercial - Warehouses & Distribution 12 10 22 0.8 0.3%Industrial/Manufacturing 16 69 85 8.6 2.8%Lake & Related Improvements (RIZ) 2 6 8 1.4 0.5%Low & Moderate Income Housing 31 25 56 3.0 1.0%Main Street Iowa Program 6 5 11 0.5 0.2%Mixed Use Property 17 24 41 5.1 1.7%Municipal/Public-Owned Buildings 15 138 153 24.8 8.2%Recreational Facilities 26 94 120 11.7 3.9%Residential 18 56 74 2.5 0.8%Roads, Bridges & Utilities 209 811 1,020 143.0 47.1%Water/Waste Treatment Plants 15 72 87 10.7 3.5%Total 539 1,735 2,274 303.7$ 100.0%
Table 8Number of Projects Reported by Project Category – FY 2017
Dollars in Millions

I o w a F Y 2 0 1 7 A n n u a l U r b a n R e n e w a l R e p o r t P a g e | 12
with a combination of property tax debt service revenue, local option sales tax, and sewer system fees. The city is exploring available grants to help finance the project. The city financial analysis also considered and rejected fully funding the project with a combination of the city debt service levy, local option sales tax, and sewer system user fees. This option was rejected citing already-high city sewer fees and the benefit received by residents of the county and school district through the operation of the city wastewater treatment plant.
• Grinnell — If approved by the city council, the city intends to use TIF revenue for the purchase, construction, and/or renovation of four building projects. The city analysis cites the benefit received by residents of the county and patrons of the school as the basis for using TIF financing for the projects. In addition to TIF, the city intends to explore the use of grants, utility revenues, user fees, donations, bonds, local option sales tax revenue, and hotel and motel tax revenue to finance the projects. The projects are as follows:
• Veterans Memorial Building — The underutilized building will be renovated to provide a downtown venue for weddings, social events, and meetings. The project cost is up to $500,000.
• Grinnell Regional Airport — Building-related expenses will be funded with TIF. The project cost is up to $500,000.
• New Water Tower — The city cites inadequate water supply and pressure for fire suppression and business development. The project cost is up to $1.0 million.
• Transportation Museum — Up to $4.5 million in TIF revenue is budgeted to assume ownership and assist with the redevelopment of a foreclosed museum. The city may use a portion of the building for city offices.
• Lake Mills — The city proposes to use TIF revenue to repaint the inside of the water tower and to replace and construct structures at the municipal pool. The total cost is estimated at $80,000. The city’s financial alternatives analysis explored local option sales tax (already committed to other projects), the city general levy (at its maximum), city reserves (unsound fiscal practice), city capital improvement (a successful referendum is not feasible at this time), the debt service levy (undue burden to citizens), swimming pool revenue (the pool does not make a profit), and utility surpluses (not available).
• Sheldon — The proposed city project is a regional events center. The building will be used to support tourism activities and to provide a venue for receptions, conventions, and meetings. The analysis cites the regional benefit of the facility as the rationale for TIF financing. Besides TIF revenue, the city analysis mentions the potential for using any available federal, state, or local grants. The project is expected to cost $3.5 million to $4.5 million.
• Tipton — Improvements to the Tipton city hall are budgeted at up to $50,000. The project will be financed through an internal loan that is repaid with TIF revenue. The city’s alternatives analysis explored local option sales tax (already committed to other projects), the city general levy (at its maximum), city reserves (unsound fiscal practice), city capital improvements levy (a successful referendum is not feasible at this time), the debt service levy (undue burden to citizens), and utility surpluses (not available).
I o w a F Y 2 0 1 7 A n n u a l U r b a n R e n e w a l R e p o r t P a g e | 13
• West Bend — The city reports two projects that are expected to utilize TIF revenue. The city’s financial alternatives analysis explored local option sales tax (already committed to other projects), the city general levy (at its maximum), city reserves (unsound fiscal practice), city capital improvement and debt service levies (a successful referendum is not feasible at this time), and utility surpluses (not available). The city has applied for grants and undertaken fundraising to help finance one or both of the projects. The projects are as follows:
• The city will construct a new fire station at a TIF revenue cost not to exceed $1.1 million.
• The city will replace the municipal swimming pool and renovate the bath house at a TIF revenue cost not to exceed $2.0 million.
• Winterset — The city has budgeted up to $325,000 to replace the heating, ventilation, and air conditioning system at the city hall. The city’s financial alternatives analysis explored local option sales tax (already committed to other projects), the city general levy (at its maximum), city reserves (unsound fiscal practice), city capital improvement levy (a successful referendum is not feasible at this time), the debt service levy (undue burden to citizens), and utility surpluses (not available).
Combined, the projects that were reported during the FY 2017 cycle total $23.7 million in future TIF revenue. Documents filed with the State in compliance with the public building analysis requirements are available on the TIF website.
Low and Moderate Income (LMI) Housing Iowa’s TIF enabling legislation requires that local governments providing TIF-financed public improvements related to housing or residential development also expend funds assisting LMI housing.3 The LMI housing requirement is a percentage of TIF expenditures equal to the countywide percentage of that population that falls into the LMI category. The specified percentage varies depending on the population of the municipality. Municipalities with a population of 5,000 or less may not require any set-aside, while municipalities with a population exceeding 15,000 require a set-aside of at least 10.0% and often higher. The TIF report project asked local governments to report: • The FY 2017 expenditures for public infrastructure related to housing (expenditures
that trigger the LMI set-aside). • The FY 2017 expenditures that satisfy FY 2017 or previous year LMI set-aside
expenditure requirements. • Outstanding LMI financial obligations that must be satisfied in future fiscal years.
Although the law requires LMI housing expenditures in some TIF circumstances, it does not require that the expenditures occur within the same year the requirement is triggered. Therefore, a build-up of required LMI set-aside balance may develop.
A total of 31 local governments reported $1.7 million in TIF Special Revenue Fund expenditures related to low and moderate income housing during FY 2017.
3 The LMI requirement only applies to economic development Urban Renewal Areas. Slum and/or blight urban renewal areas do not have an LMI requirement.
I o w a F Y 2 0 1 7 A n n u a l U r b a n R e n e w a l R e p o r t P a g e | 14
Four counties and 50 cities reported a total of $15.1 million in LMI financial obligations that must be satisfied in future fiscal years. Six local governments, Stuart, Le Claire, Spirit Lake, DeWitt, Winterset, and Milford, represent 60.9% of the total outstanding LMI obligation.
Jobs Development Agreements All local governments that have entered into development agreements with TIF funding and job creation requirements were asked to report specific information related to those agreements. A total of 71 local governments reported 270 development agreements in place in FY 2017. Those agreements required a total of 33,299 jobs. Of that total, 73.5% represented the job totals for seven cities (Des Moines, Dubuque, Davenport, West Des Moines, Sioux City, Coralville, and Ankeny). Jobs agreements totaling at least 1,000 jobs include: • Nationwide Insurance (4,421 jobs, Des Moines). • Wells Fargo (3,765 jobs, Des Moines). • Wellmark (1,987 jobs, Des Moines). • Athene/Aviva (1,074 jobs, West Des Moines). • Seaboard Triumph Foods (1,110 jobs, Sioux City).
The reporting requirements also include statistics related to the annual total salary required and public and private capital investment involved in the project. However, while all but nine projects contained an entry for the number of jobs associated with the project, 161 of the 270 development agreements did not report annual wage requirements. Private capital investment for the 260 projects reporting a number totals $4.843 billion. In total, 104 development projects provided information on jobs, wages, and private capital investment. For those 104 projects, required jobs equal 13,336, annual wages equal $531.5 million, and private capital investment equal $1.548 billion. This equates to an average of $116,113 in capital investment and $39,854 in average wages per required job. In addition, the report allowed for the reporting of other governmental financial incentive programs that also assisted in financing the project. Of the 270 development agreements listed, 164 projects include at least one other state or local financial assistance program. Two projects, Nationwide Insurance in Des Moines and IBM in Dubuque, recorded additional government funding from six other State, local, and federal programs. Across all reported projects, the most popular additional programs were the Iowa Economic Development Authority High Quality Jobs Program, the Rebuild Iowa’s Sound Economy (RISE) Program, community college job training through Iowa Code chapter 260E, local property tax abatement, and the Targeted Jobs Withholding Tax Credit Pilot Project. Local governments were not required or asked to report the dollar value of assistance provided through other governmental financial assistance programs.
I o w a F Y 2 0 1 7 A n n u a l U r b a n R e n e w a l R e p o r t P a g e | 15
TIF Taxing District Information For the purposes of this report, a TIF Taxing District is the combination of properties that make up the base district and the increment district for a particular TIF. The FY 2017 DOM dataset contains a total of 3,532 city, county, and Rural Improvement Zone TIF Taxing Districts. The reporting requirements for each TIF Taxing District include: • Confirmation of the TIF base year. • The fiscal year TIF revenue was first received for the District. • Whether the District is subject to a statutory end date, and if so, the fiscal year the
District will end. • Whether the District is established on a finding of slum, blight, or economic
development conditions, or a combination of those conditions. A date is required for each type of affirmative finding.
• Confirmation of the Frozen Base Value for the District. • Unused increment value. Using the Frozen Base Value and the value of the TIF
increment, the TIF reporting system calculates the value of any unused increment taxable value and unused increment tax dollars. Using the assessed value of the District and the Frozen Base Value, along with the value of rollbacks and military exemptions, the system calculates the maximum increment for the District. The system then subtracts the actual increment used from the maximum to determine if there is any unused increment value.
• The TIF property tax dollars received by the District in FY 2017.
The following statistics related to the TIF area designation are based on the TIF Districts that reported through the FY 2017 TIF annual report process. • TIF Taxing District designation:
• Slum, Blight, or Both = 198 (5.6%). • Economic Development and Slum/Blight = 366 (10.4%). • Economic Development Only = 2,263 (64.1%). • No designation entered = 705 (20.0%).
• Total FY 2017 TIF property tax revenue received, as reported by local governments through the TIF annual report, totals $310.4 million. The budgeted FY 2017 TIF property tax revenue for all city, county, and Rural Improvement Zone TIF Taxing Districts is $326.5 million, making the reported number 95.1% of the expected total. The reporting percentage was 95.6% for the FY 2012 report, 99.0% for FY 2013, 98.9% for FY 2014, 97.1% for the FY 2015 report, and 94.5% for the FY 2016 report.
• Total FY 2017 TIF commercial and industrial property tax reimbursement claim revenue received, as reported by local governments through the TIF annual report, totals $14.3 million. Budgeted FY 2017 TIF property tax reimbursement revenue for all city, county, and Rural Improvement Zone TIF Taxing Districts is $26.7 million,
I o w a F Y 2 0 1 7 A n n u a l U r b a n R e n e w a l R e p o r t P a g e | 16
making the reported number 53.6% of the expected total. The reporting percentage was 20.5% for FY 2015, the first year the reimbursement revenue was available, and 56.9% for FY 2016.
• Across all city, county, and Rural Improvement Zone TIF Taxing Districts contained in the DOM property tax database: • 1,703 utilize some or all of the available increment as follows:
• 944 (26.5%) utilize 100.0% of the available increment. • 691 (19.4%) use some, but not all of the available increment. • 68 (1.9%) utilize increment value in excess of the calculated maximum.
• 577 (16.2%) do not use any of the available increment. • 1,277 (36.0%) have no increment available. • The total unused increment equals $10.7 billion of taxed value.
Public Access to the TIF Dataset The electronic format chosen for the TIF reporting project is advantageous to allowing public access to the data reported by local governments. To view and download the information, a user may access the TIF website located at www.legis.iowa.gov/tif/la and click on the red box titled “Public TIF Reports Page.” See Appendix B for a screen shot of the urban renewal reporting and public access website. From there, the website takes the user to a list of all local governments with Urban Renewal Areas listed in the DOM property tax system. Access to the FY 2012 through FY 2017 reports is provided through tabs near the top of the page. Counties are listed first, followed by cities, and then Rural Improvement Zones. All levy authorities are listed in alphabetical order within those categories. An alphabetical filter near the top provides access to local governments by the first letter of their name. The following is the type of information available through the website: • For each local government with an approved report, a link on the right allows access
to a PDF version of the report. • On the same line and between the name of the local government and the report name,
there is a red triangle. Clicking here provides access to PDF copies of the urban renewal plans, maps, and ordinances provided by that local government.
• At the very top of the page are two links to Excel-based tools for data access. The left link provides a tool to compare one local government to another on significant TIF-related variables. The right link provides access to an Excel query tool that allows the user to search and retrieve information for a single local government or for all local governments.

I o w a F Y 2 0 1 7 A n n u a l U r b a n R e n e w a l R e p o r t P a g e | 17
TIF Report Project – FY 2017 Summary For the FY 2017 report, 476 local governments filed urban renewal reports with the State by January 30, 2018, 96.8% of the expected 492 local governments. Highlighted findings from the FY 2017 report include: • While the FY 2017 reporting project had an excellent response rate, a few local
governments have not submitted a report. Any local government that is subject to the reporting requirement will not be able to certify its FY 2019 budget until an Urban Renewal report has been filed with the DOM. All local governments that had not filed the required information in time for last year’s report did file in time for FY 2019 budget certification.
• Local governments have a total of $161.5 million in TIF Special Revenue Fund balances at the end of FY 2017. That amount represents 42.9% of FY 2017 TIF revenue. The balance may only be expended on eligible urban renewal activities, or else it must be returned to the county for distribution to the regular local government property tax system.
• Reported TIF property tax revenue totals $310.4 million in property tax and $14.3 million in property tax replacement claims. Respectively, the amounts are 95.1% and 53.6% of the expected total, based on budgets filed with the DOM at the beginning of the fiscal year. Combined, the difference between what was expected as revenue ($353.2 million) and what was reported ($324.7 million) equals $28.5 million.
• Expenditures from TIF Special Revenue Funds on property tax rebates and debt payments total $370.8 million, an increase of 17.4% compared to FY 2016.
• Unused TIF Special Revenue Fund revenue totaling $0.3 million was returned to the local property tax system.
• Local governments reported a total of $3.205 billion in outstanding debt that they expect to repay with future TIF revenue. The amount is an increase of $122.0 million from the FY 2016 reported debt and represents 9.8 years of TIF property tax revenue at the budgeted FY 2017 TIF property tax revenue level ($326.5 million).
• Just over 50.0% of the reported outstanding TIF debt has a repayment schedule that extends beyond FY 2027.
• 68.0% of all outstanding TIF debt is bond debt (general obligation and TIF revenue bonds) and another 21.9% is future tax rebates.
• Annual appropriation debt represents 39.3% of reported debt. • $67.0 million in property tax rebates were paid with TIF funds in FY 2017. • $303.8 million in TIF funds were used on nonrebate expenditures (debt repayments). • Of the $303.8 million, 47.1% was associated with bridge, road, and utility projects;
14.9% with administrative expenses; and 8.2% with public buildings. • Four counties and 50 cities reported a total of $15.1 million in LMI financial
obligations that must be satisfied in future fiscal years. • A total of 71 local governments reported a total of 270 development agreements in
place in FY 2017. Those agreements require the creation or retention of 33,299 jobs. Most projects financed with TIF revenue do not have specific job creation agreements.
• Less than 20.0% of TIF Taxing Districts were created with slum and/or blighted conditions as a reason for the need to create the District. The majority (64.1%) of TIF

I o w a F Y 2 0 1 7 A n n u a l U r b a n R e n e w a l R e p o r t P a g e | 18
Taxing Districts in Iowa were created on the exclusive finding of economic development need.
• Seven cities filed public building financial analyses through the FY 2017 TIF reporting system. Over five years, a total of 27 cities have reported public building projects that are expected to utilize TIF revenue.
LSA STAFF CONTACT: Jeff Robinson (515.281.4614) [email protected]
I o w a F Y 2 0 1 7 A n n u a l U r b a n R e n e w a l R e p o r t P a g e | 19
APPENDIX A TIF History and Background
Basic Urban Renewal and TIF History • Commonly referred to by its acronym of “TIF” but officially part of Iowa’s “urban
renewal” law, property tax TIF is simply a financing option for urban renewal activities that utilize property tax revenue to address slum and blight conditions and/or promote economic development.
• Authorization for urban renewal activities is found in Iowa Code chapter 403. This Iowa Code chapter was enacted in 1957 (SF 184).
• Tax increment financing was added as a financing mechanism for Urban Renewal in 1969 (HF 562).
• Cities and counties may establish TIF areas. • Rural Improvement Zones (Iowa Code chapter 357H) – A Rural Improvement Zone
(RIZ) is an area designated by a county around a private development lake. Tax increment financing funds may be collected and utilized for development projects within the RIZ.
• Three versions of Iowa tax increment financing that are not covered by the reporting requirement include: • Community College Job Training (Iowa Code chapter 260E) — Allows a
community college, in conjunction with a qualified employer, to utilize income tax withholding to finance job training for the employer.
• Local Option Sales Tax TIF (Iowa Code section 423B.10) — Allows cities to capture and utilize local option sales tax revenue for development activities within an Urban Renewal Area.
• Targeted Jobs Withholding Tax TIF (Iowa Code section 403.19A) — Allows specific cities to utilize income tax withholding from qualified jobs within an Urban Renewal Area to finance development activities.
Basic Urban Renewal and TIF Process • Municipalities designate a specific geographic area (or areas) as an Urban Renewal
Area. • Urban Renewal Areas are designated as either “slum and/or blighted” or as
“economic development.” They may also receive more than one designation. • The municipality generally does not need the permission of the other taxing
authorities to establish a TIF Taxing District. • A tax “base” is established for the area to account for the assessed value prior to the
designation. The tax revenue from the base value remains with the traditional taxing authorities. However, under certain circumstances (usually the impact of taxable value rollbacks), the base value declines and in some instances goes to zero, leaving the traditional taxing authorities with no revenue from the entire TIF District.

I o w a F Y 2 0 1 7 A n n u a l U r b a n R e n e w a l R e p o r t P a g e | 20
• In future years, any increased assessed value above the base is referred to as “increment” value. The TIF authority may access the taxes generated from the increment value. If the TIF authority accesses the increment revenue, that revenue does not go to the traditional taxing authorities.
• Debt levies, the school Physical Plant and Equipment Levy (PPEL), and (for FY 2014 and after) the Instructional Support Levy (ISL) are not included in the division of revenue.
• The TIF authority is not required to access the entire increment value. • The increment is not limited to new construction value. The increment also includes
any increased value due to revaluation of existing property, including the common impact of property value inflation.
• Once designated, the geographic area of the TIF District may be amended by the municipality.
• Urban Renewal Areas created prior to 1995 and any Area created on a finding of slum or blight are not required to expire. Since 1995, Economic Development Areas are limited to 20 years in duration, but only if they are not also designated slum or blighted.
• Through the action of the school aid formula, TIF creates a direct impact on the State General Fund. The taxable value in TIF increment areas is not included in the school aid calculation. Therefore, the property tax portion of school finance is lower and the State General Fund portion is higher than would otherwise be the case. For FY 2017, the direct General Fund impact was an increase in the State School Aid appropriation of $58.5 million.
• Local government TIF projects also receive State money through the State General Fund appropriation for commercial and industrial property tax replacement. For FY 2017, the portion of that appropriation that went to TIF financing was approximately $26.7 million. Unlike the school aid impact described above, the TIF increment designation does not increase the overall General Fund appropriation, as the commercial and industrial property tax value would be reimbursed by the State with or without the TIF increment designation.
Previous TIF Reporting Requirements • In 1999, the General Assembly (HF 776) enacted language requiring municipalities to
report TIF activity annually to the State. The report included detailed information on each TIF area and the associated projects.
• In 2003 (SF 453), the 1999 reporting requirements were removed and replaced by a semiannual report detailing outstanding TIF obligations. Debt reports were filed in 2003 and 2005.
• In HF 2777, the 2006 General Assembly enacted language requiring more detailed accounting of TIF revenue and expenditures. The report was made part of the budget documents and budget process.
• In HF 2460, the 2012 General Assembly replaced the budget process reporting with the required reporting that is the subject of this annual report.
• Previous LSA documents on the topic of TIF include: • FY 2012 Through FY 2017 Annual LSA TIF Reports

I o w a F Y 2 0 1 7 A n n u a l U r b a n R e n e w a l R e p o r t P a g e | 21
• 2005 TIF Debt Report • 2003 City TIF Report • 2003 County TIF Report • 1997 TIF Report • 1993 TIF Report
FY 2017 TIF Statistics4 • For FY 2017, there were 855 active Urban Renewal areas in Iowa (they have a base
value, increment value, or both). Another 197 Areas are in the database but do not have taxable value.
• Of the 855 active Urban Renewal Areas, 166 Areas did not have an increment value, so they did not generate TIF revenue in FY 2017.
• Of the 689 Areas that did generate TIF revenue, 140 did not have a base taxable value, meaning that with the exception of TIF-exempt debt levies, the entire property tax revenue generated by the Area went to TIF.
• The largest active FY 2017 Urban Renewal Area in the state by taxable value was the Metro Center Merged Area in downtown Des Moines. That area generated $24.7 million in TIF revenue in FY 2017. A total of 76 Urban Renewal Areas generated $1.0 million or more in FY 2017 TIF increment revenue
• While in general, property tax revenue generated from the tax increment value is TIF revenue and therefore not shared with the traditional taxing bodies, debt levies and two school finance levies are exempt from TIF diversion. Across all TIF increments in FY 2017, 16.4% of all increment property tax revenue5 was not diverted to TIF but instead was remitted to the traditional taxing bodies as a result of the exempt levies.
• A total of 393 local governments6 received TIF revenue in FY 2017, including: • 337 cities • 50 counties • One community college • Five Rural Improvement Zones
The following chart depicts the amount of property tax dollars statewide that financed TIF from FY 1982 through FY 2017 (bars, left axis). The TIF finance total reached $100.0 million by FY 2000, $191.0 million by FY 2005, $272.0 million by FY 2010, and $326.6 million in FY 2017. In addition to the property tax dollars, TIF now also receives commercial and industrial property tax replacement payments from the State General Fund. Statewide, the reimbursement payments for TIF Districts totaled $12.6 million in FY 2015, $26.0 million in FY 2016, and $26.7 million in FY 2017.
4 The FY 2017 TIF statistics presented in this portion of the report are from the DOM Property Valuation System and not from the TIF Annual Urban Renewal Report. 5 For FY 2017, TIF increments generated a total of $390.7 million in property tax revenue. Of that amount, $326.6 million (83.6%) was used to finance TIF, and $64.1 million (16.4%) was directed to local government levies that are exempt from TIF. 6 There are a total of 484 local governments with TIF Taxing Districts in the DOM Property Valuation System. However, 91 of those had no TIF increment value so received no TIF revenue in FY 2017.

I o w a F Y 2 0 1 7 A n n u a l U r b a n R e n e w a l R e p o r t P a g e | 22
The black line (right axis) depicts the percentage of all property taxes paid in the State, including the State reimbursement for commercial and industrial property taxes that financed TIF from FY 1982 through FY 2017. The graph shows that a significant change in the slope of the line started in FY 1994, and that the increase was fairly consistent, reaching 6.2% in FY 2009. In the following five fiscal years, the percentage growth in tax dollars supporting TIF grew more slowly than the overall property tax base, a situation that resulted in a modest decrease in the percentage of total property tax dollars dedicated to TIF (5.8% in FY 2014). This decline was the result of acceleration in the taxable value growth of agricultural and residential property, two classes of property that are not a significant part of TIF finance. By FY 2017, the portion of the overall tax base devoted to TIF finance reached an all-time high of 6.3%. Green bar segments depicted for FY 2015 through FY 2017 represent commercial and industrial property tax replacement claims directed to local government TIF accounts.
Table 9 provides a breakdown of FY 2017 property tax revenue by property tax class, with tax payments divided into the amount that goes to regular local government finance, and the amount that is devoted to TIF. Statewide, 21.6% of all property tax paid on industrial property, and 16.7% on commercial property, is devoted to TIF. Inclusion of the State reimbursement for the 10.0% rollback for commercial and industrial property (discussed below) brings the overall TIF portion of the property tax revenue stream to 6.3%.

I o w a F Y 2 0 1 7 A n n u a l U r b a n R e n e w a l R e p o r t P a g e | 23
TIF Impact on the State General Fund Tax increment financing directly impacts the State General Fund through the following two appropriations: • Property Tax Replacement Claims — Modifications to Iowa’s property tax system
enacted in 2013 (SF 295) resulted in a State General Fund commitment to replace property tax revenue reductions associated with commercial and industrial taxable value reductions mandated in that Act. A portion of the value for those two property classes is located within TIF increments. State General Fund reimbursement for property included within TIF Increment Areas totaled approximately $12.6 million in FY 2015, $26.0 million in FY 2016, and $26.7 million in FY 2017.
• School Finance — Iowa’s method of financing K-12 education requires a combination of property tax and State General Fund money. One portion of property tax financing for schools requires all taxed property value in the State to contribute a base $5.40 per $1,000 of value to school finance. While all taxed value within a TIF increment is assessed this base $5.40 levy, the money raised does not go to finance schools but instead is paid to the local government that created the TIF District. The TIF increment money raised by the $5.40 that does not go to school finance is replaced, dollar-for-dollar, by State General Fund money through action of Iowa’s school funding formula. For FY 2017, the statewide total State General Fund backfill of the $5.40 levy totaled $58.5 million, a $3.0 million increase from the FY 2016 level. The FY 1992 through FY 2017 history of the backfill amount is depicted in the following graph.
Class
Total Property
Tax
Regular Property
Tax
TIF Increment
Property Tax
% of Property Tax
Dedicated to TIF
Residential 2,863.3$ 2,788.2$ 75.1$ 2.6%Agricultural 788.3 787.1 1.2 0.2%Commercial 1,125.5 937.6 187.9 16.7%Multiresidential 155.1 145.5 9.6 6.2%Industrial 244.4 191.6 52.8 21.6%Other 286.9 286.9 0.0 0.0%Total Property Tax 5,463.5$ 5,136.9$ 326.6$ 6.0%
Prop. Tax Replacement 152.2$ 125.5$ 26.7$ 17.5%
Total 5,615.7$ 5,262.4$ 353.3$ 6.3%
FY 2017 Property Tax(Dollars in Millions)
Table 9

I o w a F Y 2 0 1 7 A n n u a l U r b a n R e n e w a l R e p o r t P a g e | 24

I o w a F Y 2 0 1 7 A n n u a l U r b a n R e n e w a l R e p o r t P a g e | 25
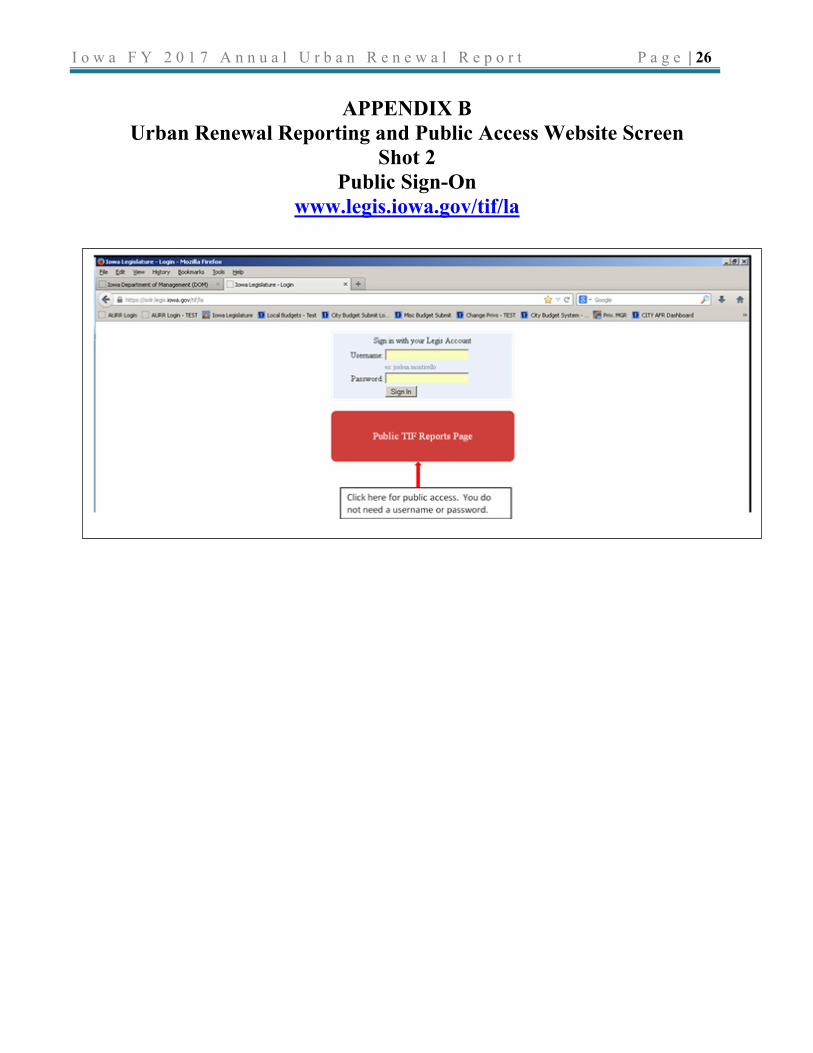
APPENDIX B Urban Renewal Reporting and Public Access
Website Screen Shot 1
dom.iowa.gov/citizens
Source: Department of Management
I o w a F Y 2 0 1 7 A n n u a l U r b a n R e n e w a l R e p o r t P a g e | 26
APPENDIX B Urban Renewal Reporting and Public Access Website Screen
Shot 2 Public Sign-On
www.legis.iowa.gov/tif/la

I o w a F Y 2 0 1 7 A n n u a l U r b a n R e n e w a l R e p o r t P a g e | 27
APPENDIX B Urban Renewal Reporting and Public Access
Website Screen Shot 3 www.legis.iowa.gov/tif/public