Embed Size (px)
Citation preview

FY 2015 REVENUE ESTIMATES
ILLINOIS DEPARTMENT OF REVENUE
1

REVENUE SUMMARY
2

INDIVIDUAL INCOME TAXESILLINOIS DEPARTMENT OF REVENUE
3

Individual Income Tax YTD Performance
IIT performance, through January ($ in millions)
FY2014 FY2013 $ Difference % Difference
Total IIT revenue $10,064 $9,704 $360 3.7%
FY2014 HR389 Enacted ($17,763) $ Difference % Difference
Total IIT revenue $10,064 $9772 $292 3.0%
4

FY 2014 Individual Income Tax (IIT)
• Withholding receipts are as forecast.
• Non-withholdings are nearly $300 million above forecast.
• Recommended FY14 IIT receipts revision: From $17,713M ($16,030M net) to $18,013M ($16,301M net).
5

Illinois: Projected growth of key variables (as of Jan/2014 Global Insight data update)
Fiscal Year FY13 FY14 FY15
Employment (total non-farm)1.0% 1.1% 1.6%
Wages & Salaries3.1% 3.2% 4.8%
Dividends, interest and rents5.0% 5.1% 6.0%
SP50015.4% 18.1% 4.6%
Housing starts20.9% 34.0% 35.9%
Home price (existing median)1.6% 10.0% 3.1%
Personal Income3.1% 3.3% 4.6%
Unemployment rate9.0% 8.7% 7.8%
6

7
Individual Income Tax FY 13 – FY 15($ millions)
FY 13 FY 14 (HR386)FY 14
RecommendedFY 15 forecast
Gross Receipts -
base rate$10,994 $10,628 $10,828 $11,259
Gross Receipts from rate
increase$7,330 $7,085 $7,185 $5,734
Total Gross Receipts $18,324 $17,713 $18,013 $16,993
Refund Fund Deposit $1,785 $1,683 $1,711 $1,699
Net Receipts $16,539 $16,030 $16,301 $15,294
Deposit into special
revenue funds$0 $0 $0 $449
Net Receipts after special
revenue funds deposit$16,539 $16,030 $16,301 $14,884
Starting February 1, 2015 1/30th of net tax receipts from individuals is deposited into both the Fund for the Advancement of Education and the Commitment to Human Services fund.FY15 receipts include $125 million that due to accounting changes will be counted as IIT instead of CIT.The split between 3% rate and receipts from tax rate increase is estimated.FY15 Refund Fund Diversion Rate increases from 9.5% to 10%.

Accounting Changes
• There is a $125M positive impact to the Individual Income Tax with a corresponding $125M negative impact to Corporate Income Tax related to PA 98-0478, which streamlines the pass-through entity withholding voucher (the IL-1000 and the IL-1023C).
• The current voucher has a mix of Individual Income Tax, Corporate Income Tax and PPRT liabilities so IDOR doesn’t know what tax the payment is intended to pay until the entity files return. All of the money is counted as CIT/PPRT when received. At the end of the year an accounting adjustment refund fund diversions.
• The new law allows IDOR to streamline the forms and create new payment vouchers that will have the taxpayers make separate payments for IIT and CIT/PPRT liabilities.
• The new payment vouchers allow the Department to allocate the right amounts when they are received. The new forms will be required for tax periods ending on or after December 31, 2014. The impact is in FY 2015. IIT revenues will increase with a equal decrease in CIT revenues.
• GRF will receive the same amount of money, this really only impacts what we call the money.
8

Non-Withholdings receipts (Gross)• Non-Withholdings revenue spiked in FY13 due to the “April surprise” in which taxpayers realized capital gains in anticipation of the increase in federal capital gains tax rate. In FY14 non-withholdings revenue decreases compared with prior fiscal year, because the one time FY13 surge will not recur.• FY15 non-withholdings are $172 million higher than expected at the 3.75% rate because we expect taxpayers manage their risk and avoid paying a penalty by making their estimated at the 5% rate. This implies FY16 will be $172 million lower than expected because of decreased final payments and increased refunds demand.
$3,238
$4,208
$3,530
$3,959
$1,500
$2,000
$2,500
$3,000
$3,500
$4,000
$4,500
FY12 FY13 FY14 FY15
Non-withholding receipts
9

Withholdings receipts (Gross)
• Withholding collections are forecast to rise 2.6% in FY14. • In FY15 Withholdings revenue will fall 10% compared with FY14 because the second half of FY15 collections will be at the lower 3.75% rate.
$13,762
$14,116
$14,482
$13,034
$12,000
$12,500
$13,000
$13,500
$14,000
$14,500
$15,000
FY12 FY13 FY14 FY15
Withholding receipts
10

10,219
$9,430
$12,302
$17,000
$18,324$18,013
$16,993
$5,000
$7,000
$9,000
$11,000
$13,000
$15,000
$17,000
$19,000
FY09 FY10 FY11 FY12 FY13 FY14 FY15
IIT Revenue history and forecastFY09 - FY15 ($ millions)
11

CORPORATE INCOME TAXESILLINOIS DEPARTMENT OF REVENUE
12

Corporate Income Tax FY14
• A year ago corporate profits were expected to decline 4.1 percent in FY14.
• The April Surprise was expected to impact on FY14 corporate income tax receipts by $125M due to large capital gains realization by trusts trying to avoid higher federal tax rates in 2013.
• Rather than declining, corporate profits are up. IHS Economics expects profits to end the fiscal year 6.2 percent FY2013.
• Strong profits have driven estimated payments to be higher than expected.
13

Corporate Income Tax Performance Year to Date
CIT Gross Receipts, Through January Performance (millions)
FY2014 FY2013 $ Difference % Difference
CIT Gross Receipts $1,680.7 $1,512.8 $168.0 11.1
FY2014 HR389 Forecast $ Difference % Difference
CIT Gross Receipts $1,680.7 $1,375.0 $305.7 22.2
14

Corporate Income Tax FY14
• FY14 recommended CIT forecast of $3,830 million gross, 4.1% above FY13 actual receipts
• $3,317 million net of refunds, 13.4% refund rate.
• Recommended forecast is $439 million above HR389
15
Corporate Income Tax FY12- FY15
16
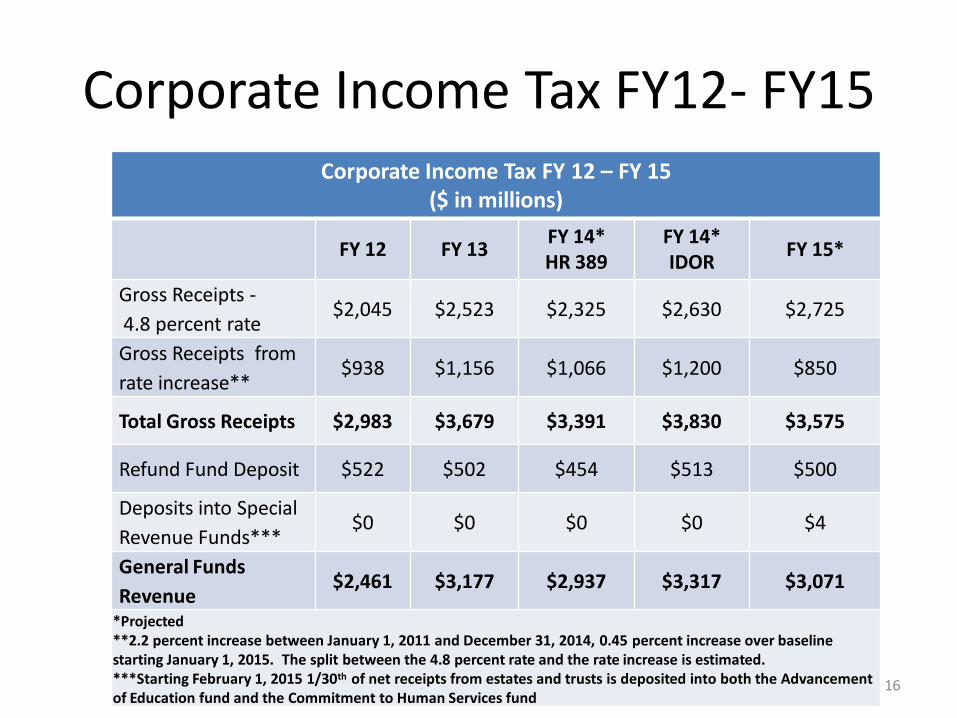
Corporate Income Tax FY 12 – FY 15($ in millions)
FY 12 FY 13FY 14*HR 389
FY 14*IDOR
FY 15*
Gross Receipts -
4.8 percent rate$2,045 $2,523 $2,325 $2,630 $2,725
Gross Receipts from
rate increase**$938 $1,156 $1,066 $1,200 $850
Total Gross Receipts $2,983 $3,679 $3,391 $3,830 $3,575
Refund Fund Deposit $522 $502 $454 $513 $500
Deposits into Special
Revenue Funds***$0 $0 $0 $0 $4
General Funds
Revenue$2,461 $3,177 $2,937 $3,317 $3,071
*Projected**2.2 percent increase between January 1, 2011 and December 31, 2014, 0.45 percent increase over baseline starting January 1, 2015. The split between the 4.8 percent rate and the rate increase is estimated.***Starting February 1, 2015 1/30th of net receipts from estates and trusts is deposited into both the Advancement of Education fund and the Commitment to Human Services fund

Corporate Income Tax FY15
17
• FY 15 gross receipts are forecast at $3,575 million, $255 million lower than FY14. Net of refunds, forecast is $3,071 million. We recommend a refund rate of 14.0% in FY15.
• Corporate profits are expected to rise in fiscal year 2015. IHS Economics predicts growth of 4.0%. Moody’s Analytics forecast 7.3% growth.
BUT:• Lower tax rate of 5.25% leads to lower estimated payments at the end of FY15. Final and extension payments made in Spring 2015 will be at 7.0% rate.
• Also, CIT will be reduced by $125 million in FY15 due to accounting changes at IDOR. Reduction will be offset by an increase in Individual Income Tax (IIT).
• Certain IIT payments are paid on CIT forms, counted as CIT. Payments are adjusted at year-end for fund distributions. A new form will separate IIT payments up front, reducing CIT and increasing IIT in FY15.
18
$1,527
$1,279
$1,043
$1,011 $1,154
$1,548
$1,784
$2,121 $2,201 $2,073
$1,649
$1,984
$2,983
$3,679
$3,830
$3,525
$0
$500
$1,000
$1,500
$2,000
$2,500
$3,000
$3,500
$4,000
$4,500
FY00 FY01 FY02 FY03 FY04 FY05 FY06 FY07 FY08 FY09 FY10 FY11 FY12 FY13 FY14 FY15
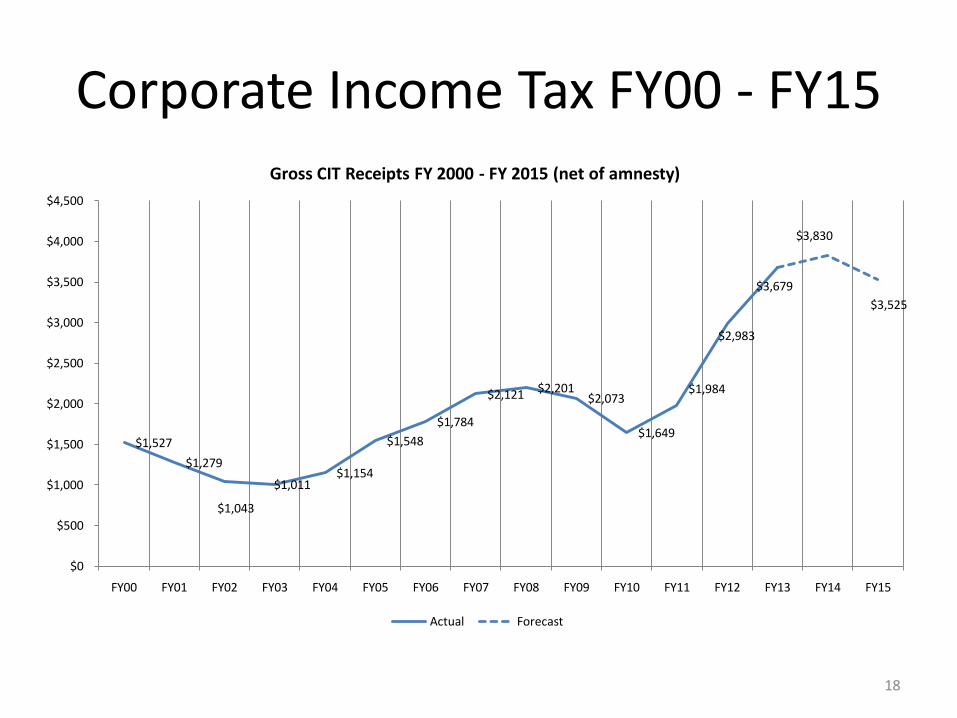
Gross CIT Receipts FY 2000 - FY 2015 (net of amnesty)
Actual Forecast
Corporate Income Tax FY00 - FY15

Gross CIT Receipts - Fiscal Years 2000 to 2015 ($ in millions, all totals net of amnesty payments)
Fiscal Year Receipts % Change vs. Prior
FY00 $1,527
FY01 $1,279 -16.3%
FY02 $1,043 -18.5%
FY03 $1,011 -3.0%
FY04 $1,154 14.1%
FY05 $1,548 34.2%
FY06 $1,784 15.3%
FY07 $2,121 18.8%
FY08 $2,201 3.8%
FY09 $2,073 -5.8%
FY10 $1,649 -20.4%
FY11 $1,984 20.3%
FY12 $2,983 50.4%
FY13 $3,679 23.3%
FY14 $3,830 4.1%
FY15 $3,525 -8.0%
19

SALES TAXESILLINOIS DEPARTMENT OF REVENUE
20

Sales & Use Tax PerformanceGeneral Revenue Funds (GRFs) Receipts
Sales & Use Tax - July through January Performance ($ in millions)
FY2014 FY2013 $ Difference % Difference
GRFs Receipts $4,566.7 $4,337.3 $229.4 5.3%
FY2014 HR389 Enacted ($7,348) $ Difference % Difference
GRFs Receipts $4,566.7 $4,333.5 $233.2 5.4%
21

Sales and Use Tax GRFs Receipts - Fiscal Years 2000 to 2015 ($ in millions, all totals net of amnesty payments)
Fiscal Year Receipts % Change vs. Prior
FY00 $6,027
FY01 $5,958 -1.1%
FY02 $6,051 1.6%
FY03 $6,059 0.1%
FY04 $6,331 4.5%
FY05 $6,595 4.2%
FY06 $7,092 7.5%
FY07 $7,136 0.6%
FY08 $7,215 1.1%
FY09 $6,773 -6.1%
FY10 $6,308 -6.9%
FY11 $6,669 5.7%
FY12 $7,226 8.4%
FY13 $7,354 1.8%
FY14 $7,610 3.5%
FY15 $7,810 2.6%
22

$6,027$5,958
$6,051 $6,059
$6,331
$6,595
$7,092$7,136
$7,215
$6,773
$6,308
$6,669
$7,226
$7,354
$7,610
$7,810
FY00 FY01 FY02 FY03 FY04 FY05 FY06 FY07 FY08 FY09 FY10 FY11 FY12 FY13 FY14 FY15
GRF Sales & Use Tax Receipts - Fiscal Years 2000 to 2015 ($ in millions)
GRF Sales & Use Tax Receipts

PUBLIC UTILITIESILLINOIS DEPARTMENT OF REVENUE
24

Public Utility Taxes FY12- FY15
25
Public Utilities Taxes FY 12 – FY 15($ in millions)
FY 12 FY 13FY14
HR389FY 14
RevisedFY 15*
Telecom $460 $491 $490 $430 $450
Electricity $390 $398 $387 $409 $413
Natural Gas $145 $144 $155 $167 $168
Total $995 $1,033 $1,032 $1,006 $1,031
*Projected

Reasons for FY 14 Revisions
26
• Telecom
– Greater than expected decline in the tax base. ($25 million)
– Credit Memo to Telecom Companies for tax charged to their customers on non taxable internet access products. ($35 million)
• Natural Gas and Electricity
– More heating days than last winter

FY 15 Forecast
• Telecom
– The credit memo was a one time event so it is added back for FY15.
– The tax base will continue eroding as consumers abandon landlines.
• Natural Gas and Electric
– Natural gas will be about the same as FY14.
– Electricity consumption is expected to grow 1%.
27

RIVERBOAT GAMING AND LOTTERYILLINOIS DEPARTMENT OF REVENUE
28

Riverboat Casino Gaming
Calendar YTD December ($ in millions)
FY 2012 FY 2013 % Change
Table AGR $239.2 $246 3.0%
EGD AGR $1266.9 $1,190 -6.0%
Total AGR $1506.1 $1436.6 -4.6%
29

Riverboat Casino Gaming
FY 2013 FY 2014 FY 2015*
Actual HR 389 Revision Recommended
AGR and Admission Tax $345 $356 $356 $334
Rivers Casino License $14 $10 $10 $10Dilution from Video Gaming (5% Less than FY13) -$29
Total General Funds from Gaming $359 $366 $337 $344
* 2% growth in AGR and Admissions
30

Lottery
• Inflation assumption 2%
• $669M in FY14 increases to $682M in FY15
31