Embed Size (px)
Citation preview

FY 2015 Presentation

DISCLAIMER
2
This document has been prepared by AEDES SIIQ S.p.A. (the ‘Company’) solely for the purposes of thispresentation. This document may not be reproduced or distributed in whole or in part by any other personwith any way than the Company. The Company takes no responsibility for the use of this document by anyperson and for any purposes. The information contained in this document has not been subject toindependent verification and no representation, warranty or undertaking, express or implied, is made as tothe accuracy, completeness or correctness of the information or opinions contained herein. This presentationmay contain forwards-looking information and statements about the Company. Forward-looking statementsare statements that are not historical facts. These statements include financial projections and estimates andtheir underlying assumptions, statements regarding plans, objectives and expectations with respect to futureoperations, products and services, and statements regarding plans, performance. In any case, investors andholders of the Company are cautioned that forward-looking information and statements are subject to variousrisk and uncertainties many of which are difficult to predict and subject to an independent evaluation by theCompany; that could cause actual results and developments to differ materially from those expressed in, orimplied or projected by, the forward-looking statements. No representation, warranty or undertaking is madeby the Company in order to the implementation of these forward – looking statements. These risks anduncertainties include, but are not limited to, those contained in this presentation. Except as required byapplicable law, the Company does not undertake any obligation to update any forward-looking information orstatements. Neither the Company, its shareholders, its advisors or representatives nor any other person shallhave any liability whatsoever for any loss arising from any use of this document or its contents or otherwisearising in connection with this document. This document does not constitute an offer to sell or an invitation orsolicitation of an offer to subscribe for or purchase any securities, and this shall not form the basis for or beused for any such offer or invitation or other contract or engagement in any jurisdiction. Under allcircumstances the user of this document shall solely remain responsible for his/her own assumptions,analyses and conclusions.

INDEX
3
Corporate Overview
Aedes’ Portfolio
Investment Opportunities
Achievement 2015
Financial Results: FY 2015
4
Corporate Overview
COMPANY OVERVIEW
5
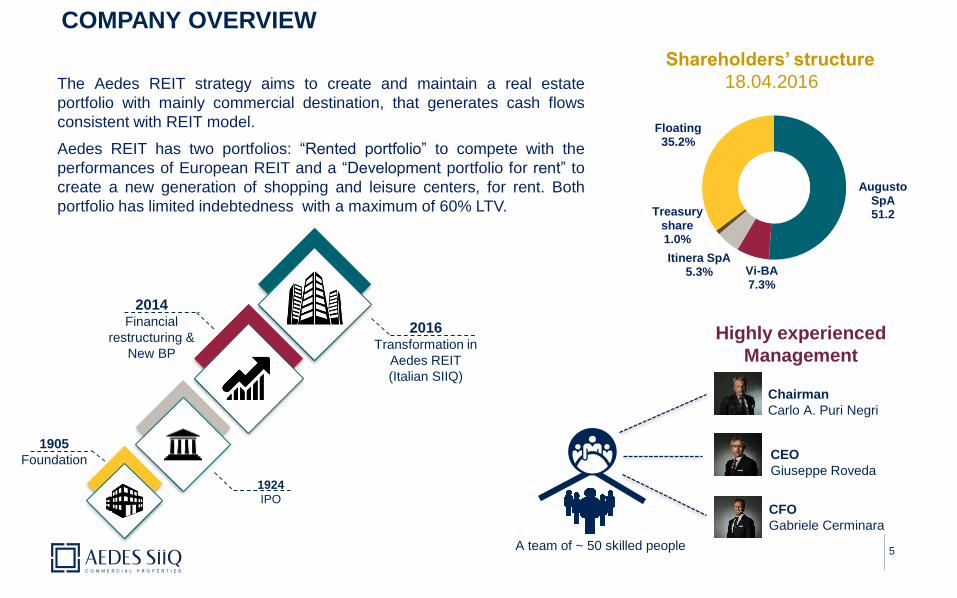
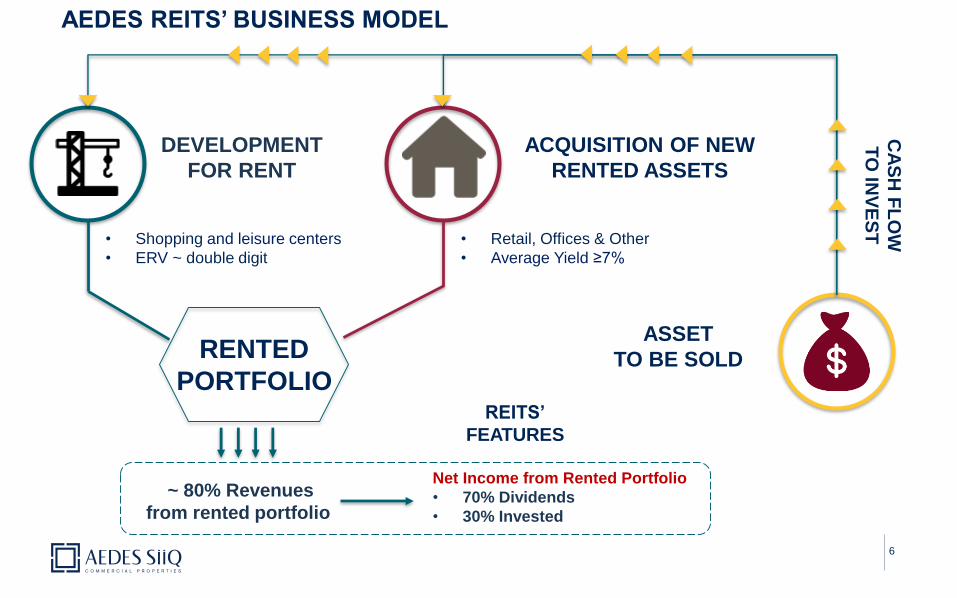
The Aedes REIT strategy aims to create and maintain a real estate
portfolio with mainly commercial destination, that generates cash flows
consistent with REIT model.
Aedes REIT has two portfolios: “Rented portfolio” to compete with the
performances of European REIT and a “Development portfolio for rent” to
create a new generation of shopping and leisure centers, for rent. Both
portfolio has limited indebtedness with a maximum of 60% LTV.
Augusto SpA51.2
Vi-BA 7.3%
Itinera SpA5.3%
Treasury share1.0%
Floating35.2%
Shareholders’ structure
18.04.2016
1924
IPO
2016Transformation in
Aedes REIT
(Italian SIIQ)
1905
Foundation
2014Financial
restructuring &
New BP
A team of ~ 50 skilled people
Chairman
Carlo A. Puri Negri
CEO
Giuseppe Roveda
Highly experienced
Management
CFO
Gabriele Cerminara
AEDES REITS’ BUSINESS MODEL
6
• Retail, Offices & Other
• Average Yield ≥7%
• Shopping and leisure centers
• ERV ~ double digit
DEVELOPMENT
FOR RENT
ACQUISITION OF NEW
RENTED ASSETS
~ 80% Revenues
from rented portfolio
Net Income from Rented Portfolio
• 70% Dividends
• 30% Invested
ASSET
TO BE SOLD
REITS’
FEATURES
RENTED
PORTFOLIO
CA
SH
FL
OW
TO
INV
ES
T

MARKET REAL ESTATE SCENARIO
7
CAPITAL INCREASE IN RE
+ High Liquidity
+ Financial market volatility
REVENUES GROWTH IN RE
2016 FORECAST
REVENUES IN RE
1.7%2.6%
1.9%
5.6%
5.9%**6.0%**
4.8%
10.5%
2.7%3.6%
Var.% 2015/2014
Var.% 2016***/2015
Source: Scenari Immobiliari Outlook 2016
* Revenues data: the amount of money exchanged in RE transactions. In the case of tertiary sector it means the market value of the asset, even if rented.
**Data are available for England and not only for the whole of Great Britain (England, Scotland, Wales)
***Estimates to Year end
• In 2015 Revenues* of the five major European
countries (England, Germany, France, Spain, Italy)
had an increase of 3.1%,
• In 2015, in Italy, Revenues raised of about 2.7%

8
Aedes’ Portfolio

€/000Consolidated
pro-quota
Not consolidated
Funds & JV
Total
pro-quota
Portfolio
GLA
sqm
Building
permits
sqm
Passing
Yield
%
ERV
%
LTV
Ratio
Retail Rented 31,200 56,542 87,742 56,481 6.8% 7.8% 57.7%
Retail Development for Rent 109,133 15,982 125,115 4,469 251,868 20.3%
Total Retail Portfolio 140,333 72,524 212,857 60,950 251,868 35.7%
Office Rented 99,093 1,580 100,673 72,094 6.4% 7.6% 62.0%
Office Development for Rent 660 660 32,000 0.0%
Total Office Portfolio 99,753 1,580 101,333 72,094 32,000 61.6%
Total Other Uses Portfolio 1,200 3,904 5,104 4,303 6.4% 8.0% 44.0%
SUB TOTAL PORTFOLIO RENTED/FOR RENT 241,286 78,009 319,295 137,347 283,868 44.1%
Assets to be sold 30,815 15,583 46,398 30,001 50.1%
Lands to be sold 26,281 20,443 46,724 4,688 218,975 74.6%
SUB TOTAL PORTFOLIO TO BE SOLD 57,096 36,026 93,122 34,689 218,975 62.4%
TOTAL PORTFOLIO 298,382 114,035 412,417 172,036 502,843 48.2%
9
GAV PORTFOLIO BY USE – 31.12.2015
Minorities
Petrarca Fund (35%) 20,479
Praga France Sarl (25%) 2,448
TOTAL CONSOLIDATED PORTFOLIO 321,308 Office Portfolio24.6%
Retail Portfolio51.6%Other Uses
1.2%
Assets to be sold22.6%
GAV % on Total Portfolio

GAV PORTFOLIO BY TYPE – 31.12.2015
10
€/000Consolidated
pro-quota
Not consolidated
Funds & JV
Total
pro-quota
Portfolio
GLA
sqm
Building
permits
sqm
Passing
Yield
%
ERV
%
LTV
Ratio
Retail 31,200 56,542 87,742 56,481 6.8% 7.8% 57.7%
Office 99,093 1,580 100,673 72,094 6.4% 7.6% 62.0%
Other uses 1,200 3,904 5,104 4,303 6.4% 8.0% 44.0%
Rented Assets 131,493 62,027 193,520 132,878 59.6%
Retail Development for Rent 109,133 15,982 125,115 4,469 251,868 20.3%
Office Development for Rent 660 0 660 32,000 0.0%
Development for Rent 109,793 15,982 125,775 4,469 283,868 20.2%
SUB TOTAL PORTFOLIO RENTED/FOR RENT 241,286 78,009 319,295 137,347 283,868 44.1%
Assets to be sold 30,815 15,583 46,398 30,001 50.1%
Lands to be sold 26,281 20,443 46,724 4,688 218,975 74.6%
SUB TOTAL PORTFOLIO TO BE SOLD 57,096 36,026 93,122 34,689 218,975 62.4%
TOTAL PORTFOLIO 298,382 114,035 412,417 172,036 502,843 48.2%
Rented Assets46.9%
Development for Rent30.5%
Assets to be sold22.6%
GAV % on Total Portfolio
Minorities
Petrarca Fund (35%) 20,479
Praga France Sarl (25%) 2,448
TOTAL CONSOLIDATED PORTFOLIO 321,308

RENTED ASSETS – 31.12.2015 1/2
11
72%
7%
20%
NORD
SUD
CENTRO
Retail45.3%
Office52.0%
Other uses2.6%
Consolidated pro-quota67.9%
Funds & JV32.1%
€/000Consolidated
pro-quota
Not consolidated
Funds & JV
Total
pro-quota
Portfolio
GLA
sqm
Passing
Yield
%
ERV
%
LTV
Ratio
Retail 31,200 56,542 87,742 56,481 6.8% 7.8% 57.7%
Office 99,093 1,580 100,673 72,094 6.4% 7.6% 62.0%
Other uses 1,200 3,904 5,104 4,303 6.4% 8.0% 44.0%
Rented Assets 131,493 62,027 193,520 132,878 59.6%

RENTED ASSETS 2/2
12
• Location: Catania, Via Etnea 116-124
• Total GLA: 7,935 sqm
• Fair Value 31/12/2015: €18.6 mln
• Location: Milano, via Agnello 12
• Total GLA: 4,406 sqm
• Fair Value 31/12/2015: €40.1 mln
• Location: Milano, via San Vigilio 1
• Total GLA: 9,793 sqm
• Fair Value 31/12/2015: €23.1 mln
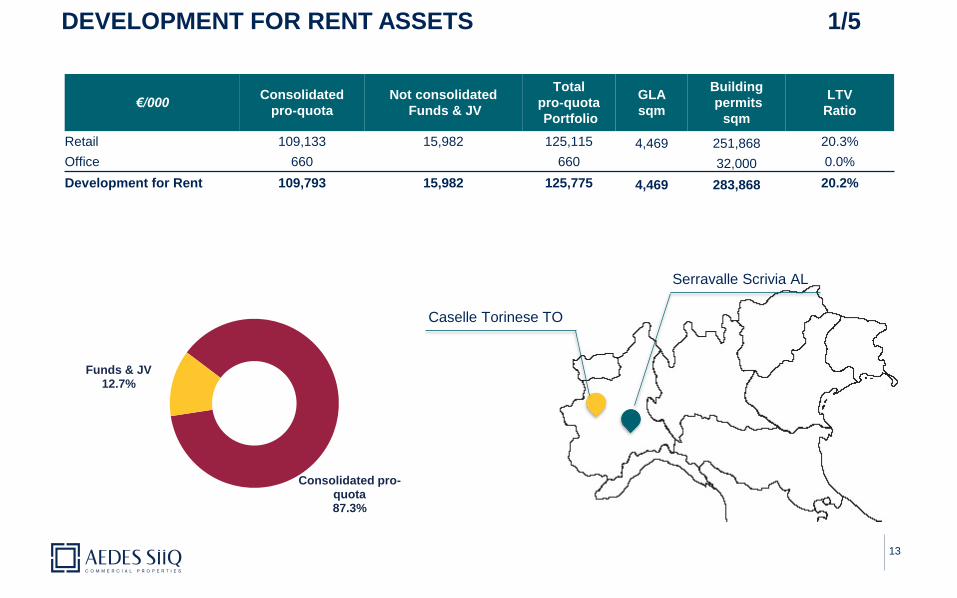
DEVELOPMENT FOR RENT ASSETS 1/5
13
€/000Consolidated
pro-quota
Not consolidated
Funds & JV
Total
pro-quota
Portfolio
GLA
sqm
Building
permits
sqm
LTV
Ratio
Retail 109,133 15,982 125,115 4,469 251,868 20.3%
Office 660 660 32,000 0.0%
Development for Rent 109,793 15,982 125,775 4,469 283,868 20.2%
Consolidated pro-quota87.3%
Funds & JV12.7%
Caselle Torinese TO
Serravalle Scrivia AL

14
DEVELOPMENT FOR RENT ASSETS - SERRAVALLE OUTLET 2/5
SERRAVALLE OUTLET VILLAGE PHASE 6
• Joint Venture with European Outlet Mall Fund (49.9%)
• Opening scheduled for September 2016
• Total GLA: 5,299 sqm
• Fair Value 31/12/2015: €31.9 mln
SERRAVALLE OUTLET VILLAGE PHASE 7
• It’s an extension of Serravalle outlet village phase 6
• Total GLA: 9,909 sqm*
• Fair Value 31/12/2015 : €16.1 mln
*of which Praga Business Praga total GLA 4,361 sqm

15
DEVELOPMENT FOR RENT ASSETS - SERRAVALLE RETAIL PARK 3/5
SERRAVALLE RETAIL PARK
• Total GLA: 19,035 sqm
• Fair Value 31/12/2015: €15.4 mln

16
DEVELOPMENT FOR RENT ASSETS - ROERO 4/5
ROERO PHASE C
• Extension of Roero Center - Phase B (Rented portfolio)
• Total GLA : 6,400 sqm
• Fair Value 31/12/2015: €1.8 mln
Roero Center - Phase B
(Rented Portfolio) Roero Center - Phase C

17
DEVELOPMENT FOR RENT ASSETS - CASELLE 5/5
CASELLE DESIGNER VILLAGE
• It’s a shopping and leisure centers project close to Turin Airport
• Total GLA : 153,000 sqm
• Fair Value 31/12/2015: €60.5 mln

18
Investment Opportunities
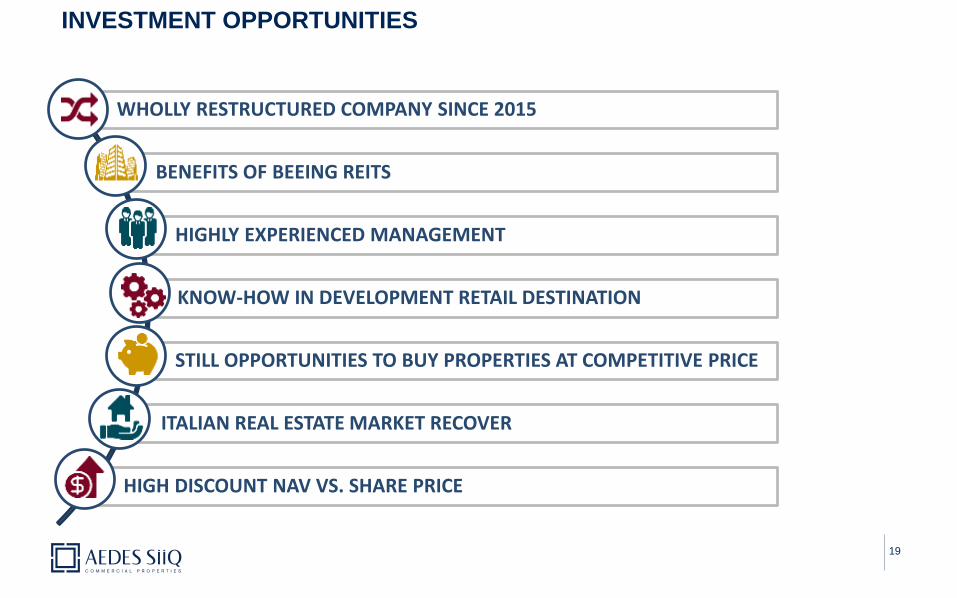
INVESTMENT OPPORTUNITIES
19
WHOLLY RESTRUCTURED COMPANY SINCE 2015
BENEFITS OF BEEING REITS
HIGHLY EXPERIENCED MANAGEMENT
KNOW-HOW IN DEVELOPMENT RETAIL DESTINATION
STILL OPPORTUNITIES TO BUY PROPERTIES AT COMPETITIVE PRICE
ITALIAN REAL ESTATE MARKET RECOVER
HIGH DISCOUNT NAV VS. SHARE PRICE

20
Achievements 2015

ACHIEVEMENT 2015 – CORPORATE ACTIVITIES
21
June 25th, 2015 - Capital increase of €40 mln equal to 100% of the shares offered
September 17th, 2015 – Shareholders resolution to buy-back for 18 months up to 10% of the share capital
September 17th, 2015 – Changes in by law to transform in REIT (SIIQ) status
October 1st, 2015 - No longer subject to the Black List of CONSOB
November 2nd, 2015 - Intermonte SIM S.p.A. named Financial Intermediary and Specialist for Aedes
shares

ACHIEVEMENT 2015 - OPERATING ACTIVITIES
22
March 17th, 2015 – purchase of a fully leased retail asset in Catania for € 18.8 mln;
April 9th, 2015 – fulfilment of the debt restructuring and release of any commitment of Aedes against
previous lenders;
May 8th, 2015 – collection of €28.3 mln from the sale of an asset to Shangri-La (Hotel);
June 9th, 2015 – JV with TH Real Estate for widening of the Serravalle Designer Outlet;
July 29th, 2015 - merger of Praga Real Estate Holding S.p.A.;
September 15th, 2015 - Purchase of 50% of "Petrarca" fund and consolidation of €58 mln of assets and
€3.5 mln of rents;
December 23th, 2015 – Purchase of 39% of Aedes Real Estate SGR S.p.A. at €2.7 mln, arriving to 95%;
December 29th, 2015 – Sale of the listed company Nova Re S.p.A. at €2.8mln with a margin of €2.6 mln;

23
Financial Results FY2015

(250)
(23)
506
2012 2013 2014 2015
Net Profit/Loss
24
FINANCIAL RESULTS: FY 2015
Rent income to € 7.4 million from € 10.7 million at December
31, 2014. The decrease (- € 3.3 million) is the result of sales or
contributions, as part of the restructuring of the end of 2014. At
the end of 2015, due to the properties acquired at the end of
2015, the Group has lease contracts on an annual basis for a
total of € 10.0 million, and considering the acquisition of the first
quarter the total rent would be €13.6 million on annual basis.
Revenues from services to € 13.9 million, compared to € 7.9
million at 31 December 2014. The increase was attributable to
revenue from Prague Construction Srl, which performs general
contractor, mainly to associated companies.
EBITDA was positive for € 6.4 million, an improvement of € 7.8
million compared to a negative EBITDA of € 1.4 million at 31
December 2014.
Net Income for the period, net of restructuring revenues
amounted to € 4.4 million compared to an operating loss of €
24.1 million in 2014. The profit including restructuring income of
€ 1.7 million is amounting to € 6.1 million compared to a net
profit of € 49.8 million in 2014 including restructuring income of
€ 73.9 million.
€Mln
€/000 FY2015 FY2014
Net rent income 7,425 10,719
Net service revenues 13,903 7,888
Other income 20,819 23,769
Total revenues 42,147 42,376
Total Costs (35,750) (43,779)EBITDA 6,397 (1,403)
EBIT (with no recurring revenues) 10,116 49,081
EBT 6,966 43,566
Taxes (846) 6,222
Net income/(loss) 6,120 49,788
of which Minorities (946) 723
of which Net income of the Group 5,174 50,511

25
€/000 FY2015 FY2014
Fixed capital 326,325 165,018
Net working capital 55,498 215,338
Invested capital 381,823 380,356
Equity 275,320 238,916
NFP 95,949 124,112
The fixed capital amounted to € 326.3 million (€ 165.0 million
at the end of 2014), and consists of:
• Real estate investments and other assets for € 269.9
million;
• Capital investments in associated companies and joint
ventures for € 53.0 million;
• Other assets Financial assets for € 2.1 million;
• Intangible assets for € 1.3 million
The invested capital at 31 December 2015 amounted to €
381.8 million versus € 380.4 million at the end of 2014. In line
with the strategic guidelines of the Group, on 31 December
2015 it was decided to re-classification of all real estate,
owned by the subsidiary companies that have acquired the
status of SIINQ, for developing and making income from
inventories to investment property item. Such reclassifications
had no effect in terms of increase in value, because,
Properties under development are stated at cost until their fair
value cannot be measured reliably on an ongoing basis.
€Mln
FINANCIAL RESULTS: FY 2015
(434) (430)
(124) (96)
37 12
239 275
2012 2013 2014 2015
NFP Equity
26
€Mln
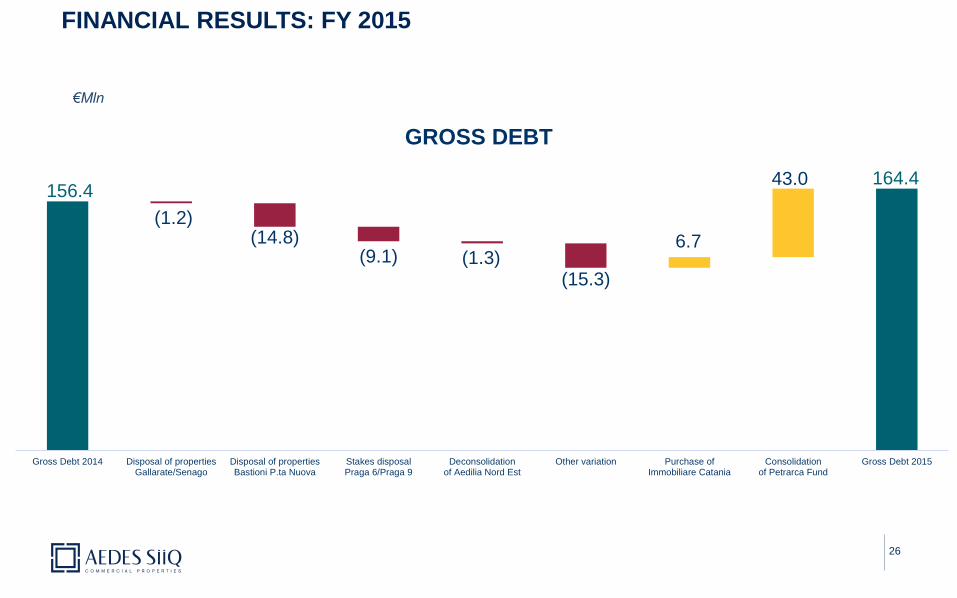
FINANCIAL RESULTS: FY 2015
156.4164.4
(1.2)(14.8)
(9.1) (1.3)(15.3)
6.7
43.0
Gross Debt 2014 Disposal of propertiesGallarate/Senago
Disposal of propertiesBastioni P.ta Nuova
Stakes disposalPraga 6/Praga 9
Deconsolidationof Aedilia Nord Est
Other variation Purchase ofImmobiliare Catania
Consolidationof Petrarca Fund
Gross Debt 2015
GROSS DEBT

NAV
27
(€/mln)Accounting
MethodBook value Market value Capital gain
Rented assets IAS 40 – Fair Value 150.8 150.8
Development for Rent IAS 40 – Book Value 109.3 109.8 0.5
To Be Sold IAS 2 60.6 60.7 0.1
Total Consolidated Group 320.8 321.3 0.6
Pro quota Assets in funds and JVs IAS 40 – Fair Value 23.6 23.6
Pro quota Development for Rent in funds and JVs IAS 40 – Book Value 8.8 16 7.2
Pro quota in To Be Sold in funds and JVs IAS 2 9.5 11.8 2.3
Total Funds and JVs 41.9 51.4 9.5
Total 362.7 372.7 10.1
Minority interest
Equity of Grout at Book value 269.1
Net Asset Value 279.1
NAV Per share (€) 0.87
Cushman & Wakefield LLP is the primary independent expert that estimated the Aedes’ real estate portfolio.
28
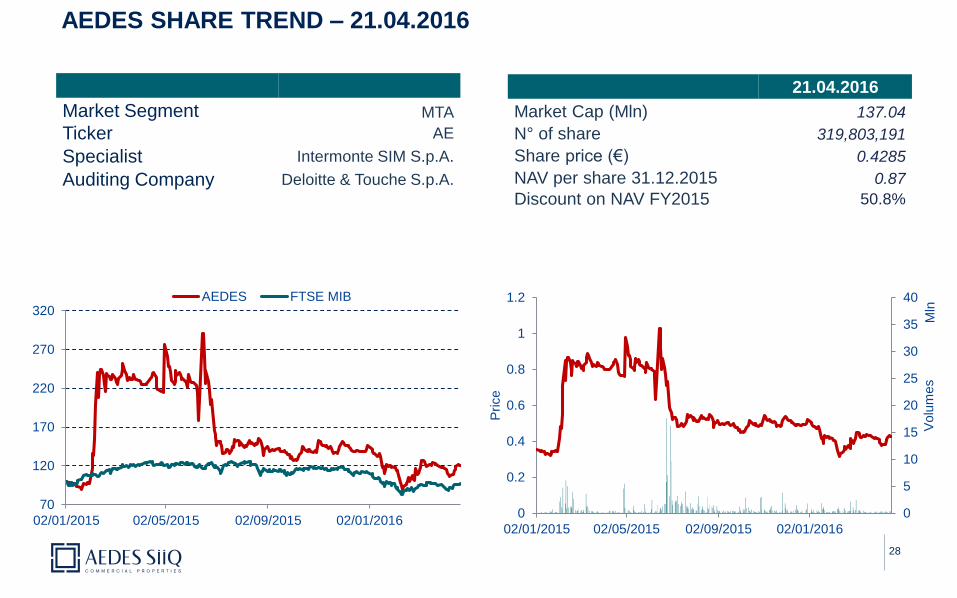
AEDES SHARE TREND – 21.04.2016
21.04.2016
Market Cap (Mln) 137.04
N° of share 319,803,191
Share price (€) 0.4285
NAV per share 31.12.2015 0.87
Discount on NAV FY2015 50.8%
Market Segment MTA
Ticker AE
Specialist Intermonte SIM S.p.A.
Auditing Company Deloitte & Touche S.p.A.
70
120
170
220
270
320
02/01/2015 02/05/2015 02/09/2015 02/01/2016
AEDES FTSE MIB
0
0.2
0.4
0.6
0.8
1
1.2
0
5
10
15
20
25
30
35
40
02/01/2015 02/05/2015 02/09/2015 02/01/2016
Price
Volu
mes
Mln

2016 EVENTS
29
Exhibitions where you can find us
11st May 1Q 2016
3rd August 1H 2016
November Business Plan
9th November 3Q 2016
March 2017 FY2016

30
SUBJECTIVE
REQUIREMENTS
Company organized as S.p.A.
Residing in the Italian territory or in one of the EU Member States
Listed on Italian regulated markets
STATUTORY
REQUIREMENTS
The Statute of the REIT must provide:
Rules on investments
Limits on the concentration of investment risks and the counterparty
maximum financial leverage permitted, on an individual and group level
STRUCTURE
PARTICIPATORY
REQUIREMENTS
No shareholder should have directly or indirectly more than 60% of the voting rights in the
ordinary and profit-sharing rights
At least 25% of the shares must be held by shareholders who do not own directly or indirectly
more than by 2% of the voting rights in the ordinary and profit-sharing rights. This threshold does
not apply to companies already listed
OBJECTIVE
REQUIREMENTS
The SIIQ are required in prevailing carrying the property leasing activities, condition verified by
two indices:
Asset test: land and buildings held as property or other real right allocated to it, represent at
least 80% of the assets
Profit test: in each financial year, revenues emanating from it represent at least 80% of the
positive components of the income statement
Requirement in each year, to distribute to shareholders at least 70% of net income arising from
property leasing and the possession of the investments (including those in real estate funds)
Distribution requirement, within 2 years following the realization, 50% of capital gains realized on
the leased property and equity investments in SIIQ, SIINQ and qualified real estate funds
REITS STATUS SINCE JANUARY 2016
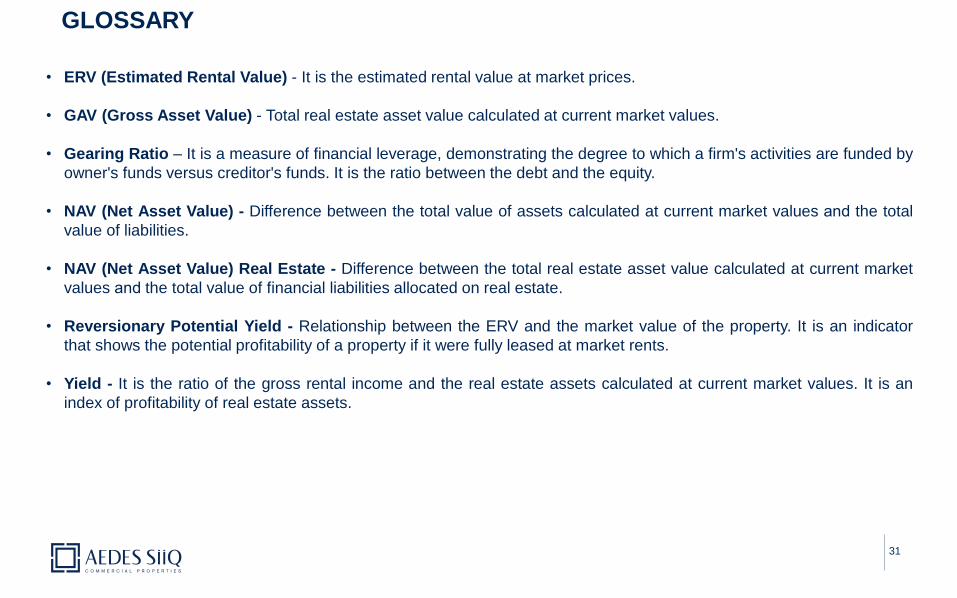
GLOSSARY
31
• ERV (Estimated Rental Value) - It is the estimated rental value at market prices.
• GAV (Gross Asset Value) - Total real estate asset value calculated at current market values.
• Gearing Ratio – It is a measure of financial leverage, demonstrating the degree to which a firm's activities are funded by
owner's funds versus creditor's funds. It is the ratio between the debt and the equity.
• NAV (Net Asset Value) - Difference between the total value of assets calculated at current market values and the total
value of liabilities.
• NAV (Net Asset Value) Real Estate - Difference between the total real estate asset value calculated at current market
values and the total value of financial liabilities allocated on real estate.
• Reversionary Potential Yield - Relationship between the ERV and the market value of the property. It is an indicator
that shows the potential profitability of a property if it were fully leased at market rents.
• Yield - It is the ratio of the gross rental income and the real estate assets calculated at current market values. It is an
index of profitability of real estate assets.

CONTACT
32
CFO
Gabriele Cerminara
Aedes Siiq S.p.A.
Via Morimondo 26 - Milano
Tel. +39 02 62439253
IR Consultant
Silvia di Rosa
CDR Communication S.r.l.
Viale Andrea Doria 15 - Milano
Tel. +39 335 7864209
https://www.facebook.com/aedessiiq/
https://twitter.com/aedes_siiq
https://www.linkedin.com/company/aedes
www.aedes-siiq.com


![Potential of Aedes albopictus and Aedes aegypti (Diptera ...mosquitoes, Aedes aegypti [3] or potentially, Aedes albopictus [4,5]. Indeed, between 2015 and 2016 in Central Africa, major](https://img.pdfslide.us/doc/110x75/60e30e3483720c1b6128c2b9/potential-of-aedes-albopictus-and-aedes-aegypti-diptera-mosquitoes-aedes-aegypti.jpg)