Embed Size (px)
Citation preview

fy 2015 AnnuAl perforMAnce plAn
FY 2015 APP Summary
A Readerrsquos Guide to the SECrsquos Performance Information
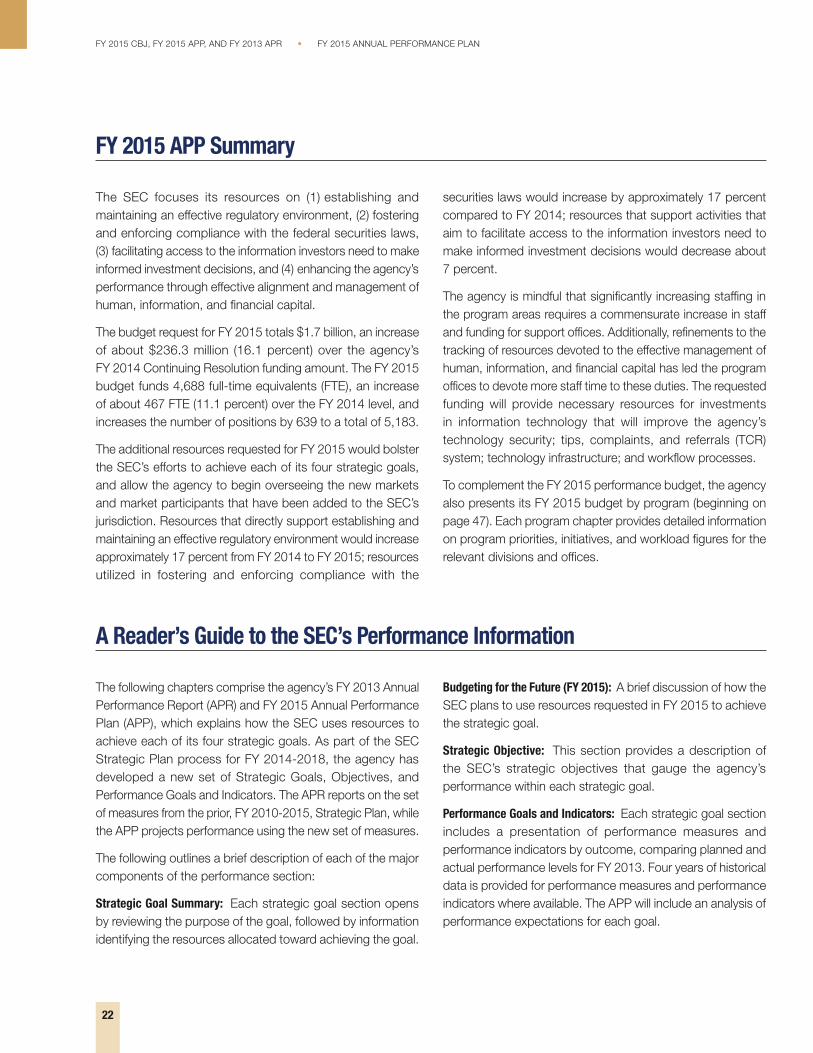
The SEC focuses its resources on (1) establishing and maintaining an effective regulatory environment (2) fostering and enforcing compliance with the federal securities laws (3) facilitating access to the information investors need to make informed investment decisions and (4) enhancing the agencyrsquos performance through effective alignment and management of human information and financial capital
The budget request for FY 2015 totals $17 billion an increase of about $2363 million (161 percent) over the agencyrsquos FY 2014 Continuing Resolution funding amount The FY 2015 budget funds 4688 full-time equivalents (FTE) an increase of about 467 FTE (111 percent) over the FY 2014 level and increases the number of positions by 639 to a total of 5183
The additional resources requested for FY 2015 would bolster the SECrsquos efforts to achieve each of its four strategic goals and allow the agency to begin overseeing the new markets and market participants that have been added to the SECrsquos jurisdiction Resources that directly support establishing and maintaining an effective regulatory environment would increase approximately 17 percent from FY 2014 to FY 2015 resources utilized in fostering and enforcing compliance with the
The following chapters comprise the agencyrsquos FY 2013 Annual Performance Report (APR) and FY 2015 Annual Performance Plan (APP) which explains how the SEC uses resources to achieve each of its four strategic goals As part of the SEC Strategic Plan process for FY 2014-2018 the agency has developed a new set of Strategic Goals Objectives and Performance Goals and Indicators The APR reports on the set of measures from the prior FY 2010-2015 Strategic Plan while the APP projects performance using the new set of measures
The following outlines a brief description of each of the major components of the performance section
Strategic Goal Summary Each strategic goal section opens by reviewing the purpose of the goal followed by information identifying the resources allocated toward achieving the goal
securities laws would increase by approximately 17 percent compared to FY 2014 resources that support activities that aim to facilitate access to the information investors need to make informed investment decisions would decrease about 7 percent
The agency is mindful that significantly increasing staffing in the program areas requires a commensurate increase in staff and funding for support offices Additionally refinements to the tracking of resources devoted to the effective management of human information and financial capital has led the program offices to devote more staff time to these duties The requested funding will provide necessary resources for investments in information technology that will improve the agencyrsquos technology security tips complaints and referrals (TCR) system technology infrastructure and workflow processes
To complement the FY 2015 performance budget the agency also presents its FY 2015 budget by program (beginning on page 47) Each program chapter provides detailed information on program priorities initiatives and workload figures for the relevant divisions and offices
Budgeting for the Future (FY 2015) A brief discussion of how the SEC plans to use resources requested in FY 2015 to achieve the strategic goal
Strategic Objective This section provides a description of the SECrsquos strategic objectives that gauge the agencyrsquos performance within each strategic goal
Performance Goals and Indicators Each strategic goal section includes a presentation of performance measures and performance indicators by outcome comparing planned and actual performance levels for FY 2013 Four years of historical data is provided for performance measures and performance indicators where available The APP will include an analysis of performance expectations for each goal
22
FY 2015 CBJ FY 2015 APP AND FY 2013 APR bull FY 2015 ANNUAL PERFORMANCE PLAN
Verification and Validation of Performance Data
The SECrsquos programs require accurate data to properly assess program performance and to make good management decisions Data verification and validation is used to evaluate whether data has been generated according to specifications satisfy acceptance criteria and are appropriate and consistent with their intended use Data verification is a systematic process for evaluating performance and compliance of a set of data when compared to a set of standards to ascertain its completeness correctness and consistency using the methods and criteria defined in the project documentation Data validation follows the data verification process and uses information from the project documentation to ascertain the usability of the data in light of its measurement quality objectives and to ensure that results obtained are scientifically defensible
The SEC ensures that the performance data presented in this report is complete reliable and accurate based upon the following assessment steps
(1) The agency develops performance measures through its strategic planning process
(2) The SECrsquos divisions and offices perform the following steps to ensure that data used in the calculation of performance measures is accurate and reliable including adequately documenting
uuthe sources of the underlying data elements and the procedures used to gather the data
uuthe procedures used to obtain assurance as to the accuracy and reliability of the data
uuthe data definitions for reference documenting and explaining the measure calculations
(3) The divisions and offices calculate and report the performance measures to the Office of Financial Management and the measures are approved by division directors and office heads This process ensures that the data used in the calculation of performance measures is accurate and reliable and that internal control is maintained through the approval process
23
FY 2015 ANNUAL PERFORMANCE PLAN bull FY 2015 CBJ FY 2015 APP AND FY 2013 APR
Performance Summary by Strategic Goal
Strategic Goal 1 Establish and Maintain an Effective Regulatory Environment
During FY 2015 the SEC plans to pursue a vigorous investor-focused rulemaking agenda that will help protect investors and ensure that markets operate fairly In FY 2015 the agency is requesting a total of $9373 million and 2668 FTEs toward achieving results in establishing an effective regulatory environment
Budgeting for the Future (FY 2015)
In FY 2014 and FY 2015 SEC staff will continue implementing new rules required under the Dodd-Frank Act and the Jumpstart Our Business Startups (JOBS) Act designed by Congress to give entrepreneurs greater access to early-stage capital
SECrsquos rulemaking agenda places priority on investor protection market stability and capital formation
In FY 2014 and FY 2015 TM will continue significant rulemaking efforts to implement key areas of the Dodd-Frank Act including (1) creation of a new regulatory structure for over-the-counter (OTC) derivatives (2) the substantially expanded regulation of NRSROs (3) the regulation and examination of new clearing agencies and new clearing agency activities including interagency coordination with respect to those agencies deemed to be systemically significant (4) implementation of a new regulatory regime for municipal advisors (5) restrictions on
certain conflicts of interest arising in connection with activities involving asset-backed securities (ABS) and (6) new rules relating to the cross-border implementation of rules under Title VII of the Dodd-Frank Act
CF plans to devote significant staff resources to rulemaking and interpretive guidance including to prepare any remaining rules to implement the Dodd-Frank Act and JOBS Act consider the impact of SEC rules and regulations on small business capital formation review the accredited investor definition in Regulation D and continue efforts to modernize and simplify disclosure requirements
In FY 2014 and FY 2015 IM also will undertake several rulemaking initiatives The SEC plans to continue work to evaluate options on money market fund reform and develop a recommendation to the Commission for final rule amendments that were proposed in FY 2013 In addition IM expects to recommend that the Commission issue a proposal to improve the reporting of information about fund operations and portfolio holdings and adopt rule and form changes regarding the general solicitation of hedge and other private funds
TM IM and CF remain committed to exceeding timeliness goals in responding to written requests for no-action letters exemptive applications and written interpretive requests (Performance Goal 131)
Strategic Objective 11 The SEC establishes and maintains a regulatory environment that promotes high-quality disclosure financial reporting and governance and prevents abusive practices by registrants financial intermediaries and other market participants
Goal Leader(s) Director Office of Investor Education and Advocacy
PERFORMANCE INDICATOR (PROCESS) 111 Number of investor testing research projects
Description This metric tracks the number of research initiatives used to gather feedback from investors on the usefulness of disclosures and other input on SEC rulemaking
Fiscal Year FY 2008 FY 2009 FY 2010 FY 2011 FY 2012 FY 2013 Actual
Number of projects 1 0 0 2 2 0
Responsible DivisionOffice Office of Investor Education and Advocacy
Data Source Microsoft Office Suite Tools
24
FY 2015 CBJ FY 2015 APP AND FY 2013 APR bull FY 2015 ANNUAL PERFORMANCE PLAN
FY 2015 ANNUAL PERFORMANCE PLAN bull FY 2015 CBJ FY 2015 APP AND FY 2013 APR
Strategic Objective 12 The SEC promotes capital markets that operate in a fair efficient transparent and competitive manner fostering capital formation and innovation
Goal Leader(s) Director Division of Trading and Markets
PERFORMANCE GOAL 121 Time to complete SEC review of SRO rules that are subject to SEC approval
Description The SEC reviews SRO rule proposals for consistency with the Exchange Act standards of investor protection fair and orderly operation of the markets and market structure as well as other statutory requirements This metric gauges the timeliness of those reviews
FY 2013 FY 2013 FY 2014 FY 2015 Fiscal Year FY 2008 FY 2009 FY 2010 FY 2011 FY 2012 Plan Actual Estimate Request
Within 45 days Prior-year data 99 82 75 70 74 70 70
not available
Responsible DivisionOffice Division of Trading and Markets
Data Source SRO Rule Tracking System (SRTS)
PERFORMANCE INDICATOR (PROCESS) 121 Percentage of SRO rule filings that are submitted for immediate effectiveness
Description This indicator gauges the proportion of SRO rule proposals that can be submitted for immediate effectiveness without Commission approval
FY 2013 Fiscal Year FY 2008 FY 2009 FY 2010 FY 2011 FY 2012 Actual
Percentage Prior-year data 69 77 72 78
not available
Responsible DivisionOffice Division of Trading and Markets
Data Source SRO Rule Tracking System (SRTS)
PERFORMANCE INDICATOR (PROCESS) 122 Percentage of transaction dollars settled on time each year
Description This indicator measures the efficiency of the US clearance and settlement system for equity securities
FY 2013 Fiscal Year FY 2008 FY 2009 FY 2010 FY 2011 FY 2012 Actual
Percentage 99 99 99 99 99 98
Responsible DivisionOffice Division of Trading and Markets
Data Source National Securities Clearing Corporation
25
FY 2015 CBJ FY 2015 APP AND FY 2013 APR bull FY 2015 ANNUAL PERFORMANCE PLAN
PERFORMANCE INDICATOR (PROCESS) 123 Percentage of market outages at SROs and electronic communications networks (ECNs)
that are corrected within targeted timeframes
Description Market outages reflect problems in the systems underlying the securities markets that could have an adverse effect on the marketsrsquo ability to function as required The SEC assesses the reliability and resiliency of these systems to minimize the number and duration of outages This metric gauges how quickly outages are resolved so that market activity can resume
FY 2013 Fiscal Year FY 2008 FY 2009 FY 2010 FY 2011 FY 2012 Actual
Within 2 hours 84 87 74 88 71 80
Within 4 hours 96 98 85 94 89 86
Within 24 hours 100 98 100 100 100 98
Responsible DivisionOffice Division of Trading and Markets
Data Source ECN outage data is derived from SROs
Strategic Objective 13 The SEC adopts and administers regulations and rules that are informed by robust economic analysis and public comment and that enable market participants to understand their obligations under the securities laws
Goal Leader(s) Director Division of Trading and Markets Director Division of Corporation Finance Director Division of Investment Management
PERFORMANCE GOAL 131 Length of time to respond to written requests for no-action letters (NAL) exemptive applications and written interpretive requests
Description The SEC staff responds to requests for guidance from individuals and market participants about specific provisions of the federal securities laws These queries may seek interpretations of the securities laws or regulations or assurances that no enforcement action will be taken if the individual or market participant engages in a specified activity The staff also reviews applications for exemptions from the securities laws Written responses to such requests for guidance when provided generally are publicly available as are applications and related notices and orders when issued This metric gauges the timeliness of initial comments issued by the Divisions of Trading and Markets Investment Management and Corporation Finance
FY 2013 FY 2013 FY 2014 FY 2015 Fiscal Year FY 2008 FY 2009 FY 2010 FY 2011 FY 2012 Plan Actual Estimate Request
Trading and Markets No-action letters exemptive applications and written interpretive requests (combined figure)
Percentage within required timeframe 63 70 91 985 89 85 93 85 85
Responsible DivisionOffice Division of Corporation Finance
Data Source TM Request Tracking Log
Investment Management
No-action letters and interpretive 98 100 100 100 100 90 100 90 90
requests
Exemptive applications 81 95 100 100 100 80 99 80 80
Responsible DivisionOffice Division of Investment Management
Data Source OCC Letter Log OICR and OIP Applications Tracking Systems (Access) Excel spreadsheet
Corporation Finance
No-action letters and interpretive 66 85 97 97 98 90 98 90 90
requests
Shareholder proposals 100 100 100 100 100 100 100 100 100
Responsible DivisionOffice Division of Corporation Finance
Data Source Division No-Action Letter database and Division Shareholder Proposal database
26
FY 2015 ANNUAL PERFORMANCE PLAN bull FY 2015 CBJ FY 2015 APP AND FY 2013 APR
PERFORMANCE GOAL 132 Timeliness of responses to requests for informal guidance received by the Trading and Markets dedicated hotline or email box
Description The Division of Trading and Markets maintains a dedicated phone line and an email account to provide market participants with avenues to request information and informal guidance regarding the Exchange Act and rules thereunder This metric will reflect the timeliness of the staffrsquos responses to these requests
FY 2013 FY 2013 FY 2014 FY 2015 Fiscal Year FY 2008 FY 2009 FY 2010 FY 2011 FY 2012 Plan Actual Estimate Request
Respond to or refer inquiries within Prior-year data not available NA NA 95 95
2 weeks
Responsible DivisionOffice Division of Trading and Markets
Data Source Division of Trading and Markets Office of Interpretation and Guidance (OIG) Log and email box
PERFORMANCE INDICATOR (CONTEXTUAL) 131 Number of published economic reports
Description This indicator gauges the number of economic reports that staff of the Division of Economic and Risk Analysis publishes annually on the SECrsquos website
FY 2013 Fiscal Year FY 2008 FY 2009 FY 2010 FY 2011 FY 2012 Actual
Number of reports NA NA NA NA NA
Responsible DivisionOffice Division of Economic Research and Analysis
Data Source DERA economists produce research for publication in leading academic journals including the top accounting and finance journals such as the Journal of Accounting and Economics the Journal of Financial Economics and the Review of Financial Studies DERArsquos site on SEC gov includes citations of all published and forthcoming research written by DERA staff
PERFORMANCE INDICATOR (PROCESS) 132 Number of amendments to national securities exchange registrations (Form 1)
Description This indicator provides information about the volume of material filed with the SEC that involves amendments to exchange registrations
FY 2013 Fiscal Year FY 2008 FY 2009 FY 2010 FY 2011 FY 2012 Actual
Number of amendments Prior-year data not available NA
Responsible DivisionOffice Division of Trading and Markets
Data Source Manual spreadsheets
PERFORMANCE INDICATOR (PROCESS) 133 Number of Alternative Trading System registrations (Form ATS)
Description This indicator provides information about the volume of material filed with the SEC that involves filings related to ATS registrations
FY 2013 Fiscal Year FY 2008 FY 2009 FY 2010 FY 2011 FY 2012 Actual
Number of registrations Prior-year data not available NA
Responsible DivisionOffice Division of Trading and Markets
Data Source Manual spreadsheets
11
27
FY 2015 CBJ FY 2015 APP AND FY 2013 APR bull FY 2015 ANNUAL PERFORMANCE PLAN
PERFORMANCE INDICATOR (PROCESS) 134 Number of new investment product submissions
Description This indicator provides information about the volume of material filed with the SEC that involves new product submissions pursuant to Rule 19b-4(e) of the Exchange Act
FY 2013 Fiscal Year FY 2008 FY 2009 FY 2010 FY 2011 FY 2012 Actual
Number of submissions Prior-year data not available NA
Responsible DivisionOffice Division of Trading and Markets
Data Source Manual spreadsheets
Strategic Objective 14 The SEC engages with a multitude of stakeholders to inform and enhance regulatory activities domestically and internationally
Goal Leader(s) Director Office of International Affairs
PERFORMANCE GOAL 141 Super visory cooperation requests from foreign authorities for SEC assistance and SEC requests for assistance on supervisory cooperation from foreign authorities
Description The SEC makes requests to foreign authorities for supervisory cooperation assistance and responds to such requests from foreign regulators through both formal mechanisms such as supervisory memoranda of understanding and on an ad hoc basis
FY 2013 FY 2013 FY 2014 FY 2015 Fiscal Year FY 2008 FY 2009 FY 2010 FY 2011 FY 2012 Plan Actual Estimate Request
Supervisory cooperation requests Prior-year data not available NA 118 NA NA
from foreign authorities
SEC requests for assistance on supervisory cooperation from Prior-year data not available NA 25 NA NA foreign authorities
Responsible DivisionOffice Office of International Affairs
Data Source International Program Oversight Database and Business Objects reports
PERFORMANCE GOAL 142 Number of non-US regulators trained
Description This metric shows the reach of the SECrsquos technical assistance programs for regulators around the world The SEC conducts these training sessions to assist countries in developing and maintaining robust protections for investors and promoting cross-border enforcement and supervisory assistance
FY 2013 FY 2013 FY 2014 FY 2015 Fiscal Year FY 2008 FY 2009 FY 2010 FY 2011 FY 2012 Plan Actual Estimate Request
Number of non-US regulators Prior-year data not 1997 1765 1785 1370 1716 1400 1400
available
Responsible DivisionOffice Office of International Affairs
Data Source International Program Oversight Database and Business Objects reports
28
Strategic Goal 2 Foster and Enforce Compliance with the Federal Securities Laws
In FY 2015 the agency is requesting a total of 502 FTE for Goal 2 The additional resources will allow the SEC to continue building out the agencyrsquos new responsibility areas and begin addressing the disparity between the number of exam staff and the growing number and complexity of registered firms Additionally the Commission will be able to take prompt action to halt misconduct sanction wrongdoers effectively and return funds to harmed investors In all the agency plans to devote approximately $1802 million to enforcing compliance with the federal securities laws
Budgeting for the Future (FY 2015)
In FY 2015 the SEC will continue to make improvements to its National Examination and Enforcement programs These improvements include hiring staff with new skill sets enhancing their technologies streamlining processes expanding the SECrsquos training programs improving the processing of the thousands of tips the agency receives annually and improving risk assessment techniques These and other significant efforts contribute to the agencyrsquos objective of creating an enduring structure for improved protection of investors and markets
In FY 2015 the National Examination program will continue its focus on high-risk entities and activities Additional staff will among other things improve risk assessment and surveillance functions and continue to address the disparity between the number of staff and the size and complexity of regulated entities The staff will perform targeted sweep and cause examinations including examinations over new or expanded areas of the agencyrsquos jurisdiction
The Enforcement program plans to build on significant changes implemented in prior fiscal years and will work to meet new challenges expected in FY 2015 In order to effectively meet these challenges the Enforcement program is aggressively adopting new methods initiatives and organizational reforms to ensure the best possible use of available resources to strengthen investor confidence in the US financial markets and to send a strong message of deterrence to would-be violators of the securities laws
To improve the quality and efficiency of its investigations the SEC has put seasoned investigators on the front lines created specialized units focused on specific programmatic priorities enhanced case management systems and increased coordination efforts with other offices and divisions in the agency and other regulators In FY 2015 the SEC plans to obtain relief on one or more claims from approximately 92 percent of enforcement actions (Performance Goal 231) The SEC has implemented controls and strategies to resolve actions on a favorable basis while at the same time it will not hesitate to file matters on a contested basis where a favorable settlement was unavailable before filing The agency also plans to reduce in FY 2015 the average number months between the opening of an investigation and the commencement of an enforcement action arising out of that investigation (Performance Goal 233)
Under the Sarbanes-Oxley Act of 2002 the SEC can use Fair Funds to redirect penalties collected from securities law violators to the victims of their wrongdoing The SEC is committed to the timely collection and distribution of penalties and disgorgement funds and has adopted a variety of new measures for monitoring its progress (Performance Goal 235)
29
FY 2015 ANNUAL PERFORMANCE PLAN bull FY 2015 CBJ FY 2015 APP AND FY 2013 APR
FY 2015 CBJ FY 2015 APP AND FY 2013 APR bull FY 2015 ANNUAL PERFORMANCE PLAN
Strategic Objective 21 The SEC fosters compliance with the federal securities laws
Goal Leader(s) Director Office of Compliance Inspections and Examinations
PERFORMANCE GOAL 211 Number of industr y outreach and education programs targeted to areas identified as raising particular compliance risks
Description Targeted communication with industry participants on topics shaping the examination program is intended to enhance compliance practices and prevent violations before they occur This metric identifies the number of major outreach efforts conducted including the SECrsquos national and regional compliance outreach events published risk alerts and other educational programs and initiatives
FY 2013 FY 2013 FY 2014 FY 2015 Fiscal Year FY 2008 FY 2009 FY 2010 FY 2011 FY 2012 Plan Actual Estimate Request
Number of major outreach efforts Prior-year data 6 5 12 14 15 16
not available
Responsible DivisionOffice Office of Compliance Inspections and Examinations
Data Source Internal tracking although the events noted above are referenced in the SECrsquos website
PERFORMANCE GOAL 212 Percentage of firms receiving deficiency letters that take corrective action in response to all exam findings
Description At the conclusion of examinations the staff communicates identified deficiencies to registrants in the form of a deficiency letter Registrants are then given a chance to respond to staff findings and often take action to remedy any problems and potential risks including monetary compensation to clients and enhancements to disclosures policies and procedures Most often registrants respond that they have corrected the deficiencies and implemented measures to prevent recurrence
FY 2013 FY 2013 FY 2014 FY 2015 Fiscal Year FY 2008 FY 2009 FY 2010 FY 2011 FY 2012 Plan Actual Estimate Request
Percentage 93 94 90 93 92 93 86 87 88
Responsible DivisionOffice Office of Compliance Inspections and Examinations
Data Source Tracking and Reporting Exam National Documentation System (TRENDS)
Strategic Objective 22 The SEC promptly detects and deters violations of the federal securities laws
Goal Leader(s) Director Office of Compliance Inspections and Examinations
PERFORMANCE GOAL 221 Percentage of investment advisers investment companies and broker-dealers examined during the year
Description This metric indicates the number of registrants examined by the SEC or an SRO as a percentage of the total number of registrants This metric includes all types of examinations risk priority examinations cause inspections to follow up on tips and complaints limited-scope special inspections to probe emerging risk areas oversight examinations of broker-dealers to test compliance and the quality of examinations by FINRA
FY 2013 FY 2013 FY 2014 FY 2015 Fiscal Year FY 2008 FY 2009 FY 2010 FY 2011 FY 2012 Plan Actual Estimate Request
Investment advisers 14 10 9 8 8 10 9 9 12
Investment companies 23 29 10 13 12 14 11 12 15
Broker-dealers (exams by SEC 57 54 44 58 49 50 46 48 50
and SROs)
Responsible DivisionOffice Office of Compliance Inspections and Examinations
Data Source Tracking and Reporting Exam National Documentation System (TRENDS) (IA IC and BD SEC data) and SRO Databases (BD SRO Data)
17
30
FY 2015 ANNUAL PERFORMANCE PLAN bull FY 2015 CBJ FY 2015 APP AND FY 2013 APR
PERFORMANCE GOAL 222 Percentage of compliance exams that are timely concluded in accordance with the Office of Compliance Inspections
and Examinationrsquos (OCIE) statutory deadline
Description The staff conducts examinations each year of registered entities including investment advisers investment company complexes transfer agents and broker-dealers The staff strives to complete its examinations and communicate findings in the most efficient and effective manner and within its statutory deadline This metric reflects the percentage of examinations concluded within the statutory deadline
FY 2013 FY 2013 FY 2014 FY 2015 Fiscal Year FY 2008 FY 2009 FY 2010 FY 2011 FY 2012 Plan Actual Estimate Request
Percentage Prior-year data NA NA NA 100 100 100 100
not available
Responsible DivisionOffice Office of Compliance Inspections and Examinations
Data Source Tracking and Reporting Exam National Documentation System (TRENDS)
PERFORMANCE GOAL 223 Number of joint exams information sharing agreements and formal meetings with other regulators
Description The SEC attempts to coordinate and collaborate with other regulators on areas of mutual interest This helps to ensure that all regulators are informed of on-going risks and issues related to broad market practices as well as specific entities of mutual interest This cooperation is critical to the exam program to ensure that certain higher risk firms and activities are addressed in the most efficient and effective manner This metric tracks critical cooperation activities that are occurring between the SECrsquos exam program and other regulators
FY 2013 FY 2013 FY 2014 FY 2015 Fiscal Year FY 2008 FY 2009 FY 2010 FY 2011 FY 2012 Plan Actual Estimate Request
Number of joint exams active sharing Prior-year data not available NA NA 85 100
agreements and formal meetings
Responsible DivisionOffice Office of Compliance Inspections and Examinations
Data Source Various (including internal tracking and TRENDS)
PERFORMANCE INDICATOR (CONTEXTUAL) 221 Percentage of exams that identify deficiencies the percentage that result in a ldquosignificant findingrdquo
and the percentage referred to the Division of Enforcement
Description Examiners find a wide range of deficiencies during examinations Some of the deficiencies are more technical in nature such as failing to include all information that is required to be in a record However other deficiencies may cause harm to customers or clients of a firm have a high potential to cause harm or reflect recidivist misconduct The latter deficiencies are among those categorized as ldquosignificantrdquo This indicator identifies the percentage of exams that identified deficiencies that resulted in significant deficiency findings and that were referred to Enforcement
FY 2013 Fiscal Year FY 2008 FY 2009 FY 2010 FY 2011 FY 2012 Actual
Percentage that identify deficiencies Prior-year data 72 82 80 80
not available
Percentage that result in a ldquosignificant findingrdquo Prior-year data 42 42 42 35
not available
Percentage referred to the Division of Enforcement Prior-year data not available 13
Responsible DivisionOffice Office of Compliance Inspections and Examinations
Data Source Tracking and Reporting Exam National Documentation System (TRENDS)
31
PERFORMANCE INDICATOR (OUTPUT) 222 Number of cause exams that result from tips complaints and referrals
Description Analysis of a tip can support the request for a cause exam This indicator would identify the number of SEC cause exams that result from tips collected through outreach efforts
Fiscal Year FY 2008 FY 2009 FY 2010 FY 2011 FY 2012 FY 2013 Actual
Number of cause exams Prior-year data not available
NA NA NA 222
Responsible DivisionOffice Office of Compliance Inspections and Examinations
Data Source Tracking and Reporting Exam National Documentation System (TRENDS)
PERFORMANCE INDICATOR (OUTPUT) 223 Number of rule-making initiatives assisted by the National Exam Program
Description The examination program interacts with registrants on a regular basis and this work provides critical feedback to ensuring effective and practical rulemaking and policy efforts This indicator tracks how frequently the examination program assists with rulemaking initiatives
Fiscal Year FY 2008 FY 2009 FY 2010 FY 2011 FY 2012 FY 2013 Actual
Number of rule-making initiatives assisted by the NEP Prior-year data not available NA
Responsible DivisionOffice Office of Compliance Inspections and Examinations
Data Source Internal tracking
PERFORMANCE INDICATOR (OUTPUT) 224 Number of investigations or inquiries originating from a tip or complaint
Description Analysis of a tip or complaint can result in the need for further enforcement investigation The indicator identifies the volume of SEC investigations that result from tips and complaints received by the SEC
Fiscal Year FY 2008 FY 2009 FY 2010 FY 2011 FY 2012 FY 2013 Actual
Number of investigations Prior-year data not available
303 349 296 289
Responsible DivisionOffice Division of Enforcement
Data Source HUB case management and tracking system for the Division of Enforcement
PERFORMANCE INDICATOR (OUTPUT) 225 SEC investigations in which requests for access to information were granted by the SEC to other authorities
such as SROs or other state federal and foreign enforcement authorities
Description The SEC works closely with other regulators and authorities This measure identifies the number of investigations in which the SEC granted one or more authorities access to information concerning an investigation during the fiscal year This may include requests for access to SEC investigative files concerning investigations that the SEC continues to pursue as well as those in which the SEC has completed its investigation
Fiscal Year FY 2008 FY 2009 FY 2010 FY 2011 FY 2012 FY 2013 Actual
Number of investigations Prior-year data not available
492 586 515 504
Responsible DivisionOffice Division of Enforcement
Data Source HUB case management and tracking system for the Division of Enforcement
32
FY 2015 CBJ FY 2015 APP AND FY 2013 APR bull FY 2015 ANNUAL PERFORMANCE PLAN
FY 2015 ANNUAL PERFORMANCE PLAN bull FY 2015 CBJ FY 2015 APP AND FY 2013 APR
PERFORMANCE INDICATOR (OUTPUT) 226 Requests from foreign authorities for SEC assistance and SEC requests for assistance from foreign authorities
Description Each year the SEC makes hundreds of requests for enforcement assistance to foreign regulators while responding to hundreds of such requests from other nations To facilitate this type of assistance and encourage other countries to enact laws necessary to allow regulators to cooperate with their foreign counterparts the SEC has entered into bilateral information sharing arrangements as well as the Multilateral Memorandum of Understanding an information-sharing arrangement negotiated through the International Organization of Securities Commissions (IOSCO)
FY 2013 Fiscal Year FY 2008 FY 2009 FY 2010 FY 2011 FY 2012 Actual
Number of requests from foreign authorities 414 408 457 492 450
Number of SEC requests 594 774 605 772 718
Responsible DivisionOffice Office of International Affairs
Data Source International Program Oversight Database and Business Objects reports
Strategic Objective 23 The SEC prosecutes violations of federal securities laws and holds violators accountable through appropriate sanctions and remedies
Goal Leader(s) Director Division of Enforcement
PERFORMANCE GOAL 231 Percentage of enforcement actions in which the Commission obtained relief on one or more claims
Description This metric identifies as to all parties to enforcement actions that were resolved in the fiscal year the percentage against whom the Commission obtained a judgment or order entered on consent a default judgment a judgment of liability on one or more charges andor the imposition of monetary or other relief
FY 2013 FY 2013 FY 2014 FY 2015 Fiscal Year FY 2008 FY 2009 FY 2010 FY 2011 FY 2012 Plan Actual Estimate Request
Percentage 92 92 92 93 89 92 93 92 92
Responsible DivisionOffice Division of Enforcement
Data Source HUB case management and tracking system for the Division of Enforcement
PERFORMANCE GOAL 232 Percentage of first enforcement actions filed within two years of the opening of an investigation
Description This metric concerns the pace of investigations that lead to the filing of enforcement actions Specifically this metric captures the rate at which the first enforcement action arising out of an investigation was filed within two years of the opening of the investigation If the investigation was preceded by a matter under inquiry the metric draws on the date of the opening of the matter under inquiry In conducting investigations the Enforcement program continually strives to balance the need for complete effective and fair investigations with the need to file enforcement actions in as timely a manner as possible
FY 2013 FY 2013 FY 2014 FY 2015 Fiscal Year FY 2008 FY 2009 FY 2010 FY 2011 FY 2012 Plan Actual Estimate Request
Percentage 62 70 67 61 63 65 58 65 65
Responsible DivisionOffice Division of Enforcement
Data Source HUB case management and tracking system for the Division of Enforcement
508
717
33
FY 2015 CBJ FY 2015 APP AND FY 2013 APR bull FY 2015 ANNUAL PERFORMANCE PLAN
PERFORMANCE GOAL 233 Average months between opening a matter under inquiry or an investigation and commencing an enforcement action
Description This metric captures the average number of months between the opening of an investigation and the filing of the first enforcement action arising out of that investigation If the investigation was preceded by a matter under inquiry the metric draws on the date of opening of the matter inquiry In conducting investigations the enforcement program continually strives to balance the need for complete effective and fair investigation with the need to file enforcement actions in as timely a manner as possible While not all investigations result in the filing of enforcement actions this metric provides information concerning the pace of investigations that do lead to such actions and supplements the previous goal which measures the percentage of first enforcement actions filed within two years
FY 2013 FY 2013 FY 2014 FY 2015 Fiscal Year FY 2008 FY 2009 FY 2010 FY 2011 FY 2012 Plan Actual Estimate Request
Months Prior-year data not available 22 21 20 21 20 20
Responsible DivisionOffice Division of Enforcement
Data Source HUB case management and tracking system for the Division of Enforcement
PERFORMANCE GOAL 234 Percentage of debts where either a payment has been made or a collection activity has
been initiated within 180 days of the due date of the debt
Description The SEC can seek a wide range of remedies for failure to comply with the securities laws These remedies include civil monetary penalties and disgorgement When the remedies are imposed by the SEC or the Federal district court payments must be made by a certain date This metric identifies the percentage of debts where debtors have made payments or the SEC has initiated a collection activity within 180 days of the due date Such collection activities include among other things demand letters negotiation of payment plans enforcing the payment of the debt through the courts or other judicial remedies
FY 2013 FY 2013 FY 2014 FY 2015 Fiscal Year FY 2008 FY 2009 FY 2010 FY 2011 FY 2012 Plan Actual Estimate Request
Percentage 88 90 86 91 92 92 95 95 95
Responsible DivisionOffice Division of Enforcement
Data Source DELPHI
PERFORMANCE GOAL 235 Percentage of Fair Fund and disgorgement fund plans that have distributed 80 percent of the available
funds for distribution within twenty four (24) months of the approval of the distribution plan
Description In addition to other types of relief the SEC may seek orders requiring parties to disgorge any money obtained through wrongdoing The SEC also is empowered to seek civil penalties for violations of the securities laws Where appropriate the SEC has sought to return disgorged funds to harmed investors and as a result of the Fair Funds provisions of the Sarbanes-Oxley Act and the Dodd-Frank Act to combine amounts paid as penalties with disgorged funds or to create a Fair Fund from penalties only to reduce losses to injured parties and to maximize funds available for distribution This metric identifies the percentage of distribution plans that reached a critical mass during the fiscal year and within twenty four (24) months of the approval of the distribution plan The distribution plan includes the timeline and procedures required to return the funds to injured investors This reflects Commission-wide efforts to implement plans to return money to investors quickly Any funds not returned to investors are sent to the US Treasury or the Investor Protection Fund established pursuant to Section 21F(g) of the Securities Exchange Act of 1934 Neither disgorgement nor penalties are used for the SECrsquos own expenses
FY 2013 FY 2013 FY 2014 FY 2015 Fiscal Year FY 2008 FY 2009 FY 2010 FY 2011 FY 2012 Plan Actual Estimate Request
Percentage Prior-year data not available 80 80 73 78 82
Responsible DivisionOffice Division of Enforcement
Data Source HUB case management and tracking system for the Division of Enforcement and Distributions Management System
34
PERFORMANCE INDICATOR (CONTEXTUAL) 232 Total amount distributed within the fiscal year and the number of Fair Funds from which those distributions came
Description In its enforcement actions the SEC may seek to return funds to harmed investors through disgorgement of ill-gotten gains or through the Fair Funds provision of the Sarbanes-Oxley Act This provision permits the SEC to combine amounts paid as penalties with disgorged funds or to create a Fair Fund from penalties only to reduce losses to injured parties This reflects the SECrsquos efforts to return funds to injured investors This indicator identifies the total amount distributed within the fiscal year and the number of Fair Funds from which those distributions came This indicator may increase or decrease in dollar amount and number of distribution funds based on the number of SEC enforcement actions brought involving distributions amounts ordered and paid in those actions and other factors Due to the variation in reporting timelines established for each individual distribution reported amounts are based on the agencyrsquos best available information Reported amounts do not include those funds distributed through receiverships Any funds not returned to investors are sent to the US Treasury or the Investor Protection Fund established pursuant to Section 21F(g) of the Securities Exchange Act of 1934 Neither disgorgement nor penalties are used for the Commissionrsquos own expenses
Fiscal Year FY 2008 FY 2009 FY 2010 FY 2011 FY 2012 FY 2013 Actual
Amount distributed (in millions) Prior-year data not available 815 251
Number of Fair Funds Prior-year data not available 31 22
Responsible DivisionOffice Division of Enforcement
Data Source HUB case management and tracking system for the Division of Enforcement Distributions Management System
PERFORMANCE INDICATOR (CONTEXTUAL) 231 Percentage of filed enforcement actions reflecting characteristics that present enhanced risk to investors and markets as
measured by the nature of the investigation conduct parties and impact
Description This indicator assesses the quality of the cases filed by the Division of Enforcement The indicator focuses on cases filed by the SEC that involve factors reflecting enhanced risk to investors and markets Such cases may involve (i) those identified through risk analytics and cross-disciplinary initiatives to reveal difficult-to-detect or early stage misconduct thus minimizing investor loss and preventing the spread of unlawful conduct and practices (ii) particularly egregious or widespread misconduct and investor harm (iii) vulnerable victims (iv) a high degree of scienter (v) involvement of individuals occupying substantial positions of authority or having fiduciary obligations or other special responsibilities to investors (vi) involvement of recidivists (vii) high amount of investor loss prevented (viii) misconduct that is difficult to detect due to the complexity of products transactions and practices (ix) use of innovative investigative or analytical techniques (x) effective coordination with other law enforcement partners andor (xi) whether the matter involves markets transactions or practices identified as an enforcement priority or that advances the programmatic priorities of other SEC Divisions or Offices
Fiscal Year FY 2008 FY 2009 FY 2010 FY 2011 FY 2012 FY 2013 Actual
Percentage Prior-year data not available NA NA
Responsible DivisionOffice Division of Enforcement
Data Source HUB case management and tracking system for the Division of Enforcement
35
FY 2015 ANNUAL PERFORMANCE PLAN bull FY 2015 CBJ FY 2015 APP AND FY 2013 APR
PERFORMANCE INDICATOR (OUTPUT) 233 Percent of enforcement actions filed that arose out of national priority investigations
Description The Division of Enforcement conducts many enforcement actions each year that can be characterized as high impact and of national priority High impact or national priority investigations include those investigations which are significant for one or more of the following reasons ndashthe matter (i) presents an opportunity to send a particularly strong and effective message of deterrence including with respect to markets products and transactions that are newly developing or that are long established but which by their nature present limited opportunities to detect wrongdoing and thus to deter misconduct (ii) involves particularly egregious or extensive misconduct (iii) involves potentially widespread and extensive harm to investors (iv) involves misconduct by persons occupying positions of substantial authority or responsibility or who owe fiduciary or other enhanced duties and obligations to a broad group of investors or others (v) involves potential wrongdoing as prohibited under newly-enacted legislation or regulatory rules (vi) concerns potential misconduct that occurred in connection with products markets transactions or practices that pose particularly significant risks for investors or a systemically important sector of the market (vii) involves a substantial number of potential victims and or particularly vulnerable victims (viii) involves products markets transactions or practices that the Enforcement Division has identified as priority areas (ie conduct relating to the financial crisis fraud in connection with mortgage-related securities financial fraud involving public companies whose stock is widely held misconduct by investment advisers and matters involving priorities established by particular regional offices or the specialized units) andor (ix) provides an opportunity to pursue priority interests shared by other law enforcement agencies on a coordinated basis
Fiscal Year FY 2008 FY 2009 FY 2010 FY 2011 FY 2012 FY 2013 Actual
Percentage Prior-year data not available 10 20 15
Responsible DivisionOffice Division of Enforcement
Data Source HUB case management and tracking system for the Division of Enforcement
PERFORMANCE INDICATOR (CONTEXTUAL) 234 Criminal actions related to conduct under investigation by the SEC
Description In some instances conduct may involve both civil and criminal violations and may be investigated by both the SEC and the criminal authorities This indicator identifies the number of criminal actions that are related to conduct under investigation by the SEC
Fiscal Year FY 2008 FY 2009 FY 2010 FY 2011 FY 2012 FY 2013 Actual
Number of criminal investigations Prior-year data not available
139 134 126 126
Responsible DivisionOffice Division of Enforcement
Data Source HUB case management and tracking system for the Division of Enforcement
PERFORMANCE INDICATOR (OUTPUT) 235 Disgorgement and penalties ordered and the amounts collected
Description In addition to other types of relief the SEC may seek orders requiring parties to disgorge any money obtained through wrongdoing The SEC is also empowered to seek civil penalties for violations of the securities laws In some cases the SEC will seek to obtain large monetary sanctions even in instances where the prospects of collecting on a judgment are slight The rationale for seeking monetary relief in these circumstances is that such relief even when likely uncollectible might become collectible in the future based on the defendantrsquos changed circumstances and also because such relief can serve to deter others from violating the securities laws Where appropriate the SEC has sought to return disgorged funds to harmed investors Funds not returned to investors are sent to the Treasury or the Investor Protection Fund established pursuant to Section 21F(g) of the Securities Exchange Act of 1934 This indicator lists disgorgement and penalties ordered as a result of SEC cases and the amounts collected in those actions This indicator could increase or decrease based on various factors
Fiscal Year FY 2008 FY 2009 FY 2010 FY 2011 FY 2012 FY 2013 Actual
Ordered amounts (in millions) 1030 2442 2846 2806 3104 3424
Collected amounts (in millions) 521 1694 1775 1281 1048 1603
Responsible DivisionOffice Division of Enforcement
Data Source DELPHI
36
FY 2015 CBJ FY 2015 APP AND FY 2013 APR bull FY 2015 ANNUAL PERFORMANCE PLAN
FY 2015 ANNUAL PERFORMANCE PLAN bull FY 2015 CBJ FY 2015 APP AND FY 2013 APR
Strategic Goal 3 Facilitate Access to the Information Investors Need to Make Informed Investment Decisions
The agency is requesting in FY 2015 a total of $2226 million and 651 FTEs towards achieving results in Strategic Goal 3
Budgeting for the Future (FY 2015)
An educated investing public ultimately provides the best defense against fraud and costly mistakes The federal securities laws place great emphasis on assuring that corporations investments companies and other entities provide investors with timely clear complete and accurate financial and non-financial information allowing investors to make wise investment decisions As part of its disclosure program CF and IM will continue in FY 2015 to meet the requirements of the Sarbanes-Oxley Act (Performance Goal 311) Accordingly CF and IM strive to review disclosures made by certain public issuers including issuersrsquo financial statements no less frequently than once every three years Additionally CF staff will strive to issue comments on a timely basis allowing companies seeking to raise capital by building offering schedules around the 30-day standard (Performance Goal 312) and IM will aim to exceed timeliness targets for
reviewing investment company disclosures (Performance Goal 313) Also in FY 2015 CF will continue to improve the quality of information provided to investors by focusing on disclosure by companies of the information most material to investment decision-making
OIEA responds to investment-related complaints and questions from tens of thousands of investors each year In FY 2015 staff is expected to close approximately 60 percent of complaints and inquiries within seven days and about 90 percent within 30 days (Performance Goal 322) The seven-day target has been adjusted to reflect new workload demands In FY 2015 OIEA will continue to refine internal processes and promote staff training to resolve matters OIEA expects to increase of the number of visitors to its investor education web pages by using social media technologies and partnering with the SECrsquos regional offices other federal and state agencies financial industry associations consumer groups and educational organizations on investor education programs OIEA also will continue to participate in a significant number of in-person outreach events in FY 2015 (Performance Goal 321)
Strategic Objective 31 The SEC works to ensure that investors have access to high-quality disclosure materials that facilitate informed investment decision-making
Goal Leader(s) Director Division of Trading and Markets Director Division of Corporation Finance Director Division of Investment Management
PERFORMANCE GOAL 311 Percentage of public companies and investment companies with disclosures reviewed each year
Description The Sarbanes-Oxley Act requires that the SEC review at least once every three years the disclosures of all companies and investment company portfolios reporting under the Exchange Act These reviews help improve the information available to investors and may identify possible violations of the federal securities laws This metric gauges the number of public companies and investment companies reviewed each year
FY 2013 FY 2013 FY 2014 FY 2015 Fiscal Year FY 2008 FY 2009 FY 2010 FY 2011 FY 2012 Plan Actual Estimate Request
Division of Corporation Finance
Corporations 39 40 44 48 48 33 52 33 33
Responsible DivisionOffice Division of Corporation Finance
Data Source Electronic Data Gathering Analysis and Retrieval (EDGAR)Filing Activity Tracking System (FACTS)
Division of Investment Management
Investment Company Portfolios 36 35 35 33 36 33 34 33 33
Responsible DivisionOffice Division of Investment Management
Data Source Microsoft Office Suite Tools
37
FY 2015 CBJ FY 2015 APP AND FY 2013 APR bull FY 2015 ANNUAL PERFORMANCE PLAN
PERFORMANCE GOAL 312 Time to issue initial comments on Securities Act filings
Description The target of 30 days or less has become a de facto industry standard for the maximum time to receive initial comments
FY 2013 FY 2013 FY 2014 FY 2015 Fiscal Year FY 2008 FY 2009 FY 2010 FY 2011 FY 2012 Plan Actual Estimate Request
Days 252 253 241 244 249 lt30 256 lt30 lt30 days days days days days days days days days
Responsible DivisionOffice Division of Corporation Finance
Data Source FACTS
PERFORMANCE GOAL 313 Percentage of investment company disclosure reviews for which initial comments are completed within timeliness goals
Description For initial registration statements the SECrsquos goal is to issue initial comments within 30 days after they are filed (60 days for registration statements of insurance product separate accounts and related mutual funds) The SEC also aims to comment on post-effective amendments within 45 days and preliminary proxy statements within 10 days after they are filed
FY 2013 FY 2013 FY 2014 FY 2015 Fiscal Year FY 2008 FY 2009 FY 2010 FY 2011 FY 2012 Plan Actual Estimate Request
Initial registration statements 95 95 93 92 96 85 98 85 85
Post-effective amendments 97 97 94 94 95 90 99 90 90
Preliminary proxy statements 99 99 99 98 100 99 98 99 99
Responsible DivisionOffice Division of Investment Management
Data Source Electronic Data Gathering Analysis and Retrieval (EDGAR)
PERFORMANCE INDICATOR (CONTEXTUAL) 311 Total digital audience including website social media and mobile media
Description Digital media has become the dominant channel for investors seeking to access information These statistics will help evaluate the extent to which investors are turning to the SEC identify the channels they use and quantify the amount of information they receive
FY 2013 Fiscal Year FY 2008 FY 2009 FY 2010 FY 2011 FY 2012 Actual
SECgov page views Prior-year data not available 372B
Social media followers 0 1608 83141 193837 236700 258733
Total emailmobile subscriptions Prior-year data not available 519602 631839 740318
Total email bulletins sent NA 875518 1280M 2397M 3344M 4085M
Total mobile bulletins sent NA 6001 62324 107848 150303 238815
Responsible DivisionOffice Office of Public Affairs
Data Source Akamai Technologies Google Analytics GovDelivery Hootsuite Social Media Channels
38
rsquo
FY 2015 ANNUAL PERFORMANCE PLAN bull FY 2015 CBJ FY 2015 APP AND FY 2013 APR
Strategic Objective 32 The SEC works to understand investor needs and educate investors so they are better prepared to make informed investment decisions
Goal Leader(s) Director Office of Investor Education and Advocacy
PERFORMANCE GOAL 321 Number of page views of online investor education content and number of in-person events
including those with specifically targeted communities and organizations
Description The Office of Investor Education and Advocacy (OIEA) initiates investor education campaigns on key strategies for making informed investment decisions including publicizing online resources for researching investment professionals and investments understanding fees and identifying fraud OIEA staff also participates in in-person events for investors generally and those targeted to specific investors such as seniors service members and other affinity groups This metric tracks page views of SEC online investor education materials and the number of investor events in which OIEA staff participated
FY 2013 FY 2013 FY 2014 FY 2015 Fiscal Year FY 2008 FY 2009 FY 2010 FY 2011 FY 2012 Plan Actual Estimate Request
Number of page views Prior-year data not available 15 121 15 20
Number of ldquoin-personrdquo events Prior-year data not available 50 52 50 50
Responsible DivisionOffice Office of Investor Education and Advocacy
Data Source Microsoft Office Suite Tools
PERFORMANCE GOAL 322 Timeliness of responses to investor contacts
Description OIEA serves the tens of thousands of investors each year who contact the SEC with investment-related complaints and questions The staff aims to close out as many new investor assistance matters as possible within seven and thirty business days
FY 2013 FY 2013 FY 2014 FY 2015 Fiscal Year FY 2008 FY 2009 FY 2010 FY 2011 FY 2012 Plan Actual Estimate Request
Closed within 7 days 78 70 72 67 54 50 62 60 60
Closed within 30 days 88 90 93 92 93 90 93 90 90
Responsible DivisionOffice Office of Investor Education and Advocacy
Data Source Internal log using IRIS data
PERFORMANCE GOAL 323 Customer satisfaction rating of OIEA s online investor education resources
Description This metric gauges the effectiveness helpfulness and usability of OIEArsquos online investor education resources
FY 2013 FY 2013 FY 2014 FY 2015 Fiscal Year FY 2008 FY 2009 FY 2010 FY 2011 FY 2012 Plan Actual Estimate Request
Satisfaction index Benchmark Benchmark score for score for
Prior-year data not available NA 81 federal federal government government
websites websites
Responsible DivisionOffice Office of Investor Education and Advocacy
Data Source ForeSee results online portal
39
FY 2015 CBJ FY 2015 APP AND FY 2013 APR bull FY 2015 ANNUAL PERFORMANCE PLAN
PERFORMANCE GOAL 324 Number of new investor education materials designed specifically to help investors protect themselves from fraud
Description Through OIEA and often in conjunction with other organizations the staff issues Investor Alerts and other forms of educational material that inform investors about different permutations of fraud new investment products and other topical issues This metric measures the number of new investor education materials issued by OIEA
FY 2013 FY 2013 FY 2014 FY 2015 Fiscal Year FY 2008 FY 2009 FY 2010 FY 2011 FY 2012 Plan Actual Estimate Request
Number of education materials Prior-year data 16 24 24 26 26 26
not available
Responsible DivisionOffice Office of Investor Education and Advocacy
Data Source wwwsecgov and wwwinvestorgov
PERFORMANCE INDICATOR (PROCESS) 321 Number of investor testing research projects
Description This indicator tracks the number of research initiatives used to gather feedback from investors on the usefulness of disclosures and other input on SEC rulemaking
FY 2013 Fiscal Year FY 2008 FY 2009 FY 2010 FY 2011 FY 2012 Actual
Number of projects 1 0 0 2 2
Responsible DivisionOffice Office of Investor Education and Advocacy
Data Source Microsoft Office Suite Tools
PERFORMANCE INDICATOR (PROCESS) 322 Number of sets of recommendations prepared by the investor advisor y committee
Description This indicator tracks the recommendations from the Investor Advisory Committee regarding investorsrsquo perspectives and priorities
FY 2013 Fiscal Year FY 2008 FY 2009 FY 2010 FY 2011 FY 2012 Actual
Number of sets of recommendations Prior-year data not available 0 4
Responsible DivisionOffice Office of Investor Education and Advocacy
Data Source wwwsecgov
26
0
40
Strategic Goal 4 Enhance the Commissionrsquos Performance through Effective Alignment and Management of Human Information and Financial Capital During FY 2015 the agency will continue to focus on recruiting and retaining high-performing staff and updating the expertise of SEC employees so they are abreast of the latest developments in the securities markets Furthermore the SEC will continue to strengthen internal controls The agency is requesting a total of $3599 million and 867 FTEs in FY 2015 to achieve results in Strategic Goal 4
Budgeting for the Future (FY 2015)
The investing public and the securities markets are best served by an efficient effective and agile SEC In FY 2015 the agency will continue to take steps to become a more effective regulator of the US financial markets by making sound investments in human capital and new technologies and enhancing internal controls
The planned investment in the SEC University for FY 2015 principally supports training and development for employees directly involved in examinations investigations fraud detection litigation and other core mission responsibilities of the agency The SEC University will provide specialized in-depth training concerning changing market conditions analytics and forensics and the agencyrsquos new responsibility areas The investment also will fund employees for certain specialized financial certifications and regulatory credentials as well as the advanced continuing education required for maintaining legal and financial credentials
To maintain mission effectiveness it is essential that attrition in the leadership ranks is quickly addressed by having a highly qualified and diverse pool of candidates ready to assume those
critical roles (Performance Goal 415) The Office of Human Resourcesrsquo (OHR) Workforce Planning has completed building the foundational database necessary to conduct succession planning A subset of this team has begun benchmarking succession planning approaches used by other Federal agencies and will develop and implement a program at the SEC by the end of FY 2014 The first measure is expected by September 30 2014
Leveraging modern reliable and innovative technologies together with predictive analytics will transform the way the SEC performs its mission and provide a proactive view into how technology impacts capital markets The SEC will derive significant and measurable performance improvements in core operations and increase value for users through the use of automated enterprise processes
The continuing implementation of OITrsquos Technology Transformation Plan (ldquoWorking Smarterrdquo) in FY 2015 will support vital technology initiatives It will ensure the SECrsquos business processes are streamlined integrated and implemented using the best technology available
While the SEC has made significant strides in its multi-year path towards a strong sustainable internal control posture the agency will continue to dedicate its energies towards remediating the significant deficiency in information security During FY 2015 OFM will work closely with the Department of Transportationrsquos Federal Shared Services Provider (FSSP) to implement its software upgrade and refine the new Federal government-wide travel management system
41
FY 2015 ANNUAL PERFORMANCE PLAN bull FY 2015 CBJ FY 2015 APP AND FY 2013 APR
FY 2015 CBJ FY 2015 APP AND FY 2013 APR bull FY 2015 ANNUAL PERFORMANCE PLAN
Strategic Objective 41 The SEC promotes a results-oriented work environment that attracts engages and retains a technically proficient and diverse workforce including leaders who provide motivation and strategic direction
Goal Leader(s) Director Office of Human Resources Director Office of Minority and Women Inclusion
PERFORMANCE GOAL 411 Turnover
Description When employee morale and engagement are high high-performing employees tend to remain in the organization Although turnover can fluctuate based on a variety of factors the SEC aims to keep its turnover rate relatively low below 8 per year
FY 2013 FY 2013 FY 2014 FY 2015 Fiscal Year FY 2008 FY 2009 FY 2010 FY 2011 FY 2012 Plan Actual Estimate Request
Percent turnover 62 37 5 64 658 lt8 658 lt8 lt8
Responsible DivisionOffice Office of Human Resources
Data Source The National Business Center at Department of Interior (DOI)
PERFORMANCE GOAL 412 Expanding staff expertise
Description Internal training and hiring programs are designed to help the agency recruit and develop a diverse and qualified staff with the key skills industry knowledge and expertise to support the SEC mission In particular there is a need to train examiners attorneys economists and other experts for subject matter expertise relevant to the marketplace and investment and trading practices This metric tracks whether certain areas requiring significant training are being addressed The agency will track the number of SEC staff participants in mission-focused training and development programs and will report on specific items through the use of post-course evaluations to assess the impact and results of this training on a five-point scale
FY 2013 FY 2013 FY 2014 FY 2015 Fiscal Year FY 2008 FY 2009 FY 2010 FY 2011 FY 2012 Plan Actual Estimate Request
Mission-focused training attendance Prior year data not available NA NA 12000 12120
Post-course evaluations of mission-Prior year data not available NA NA 45 45
focused training
Responsible DivisionOffice Office of Human Resources
Data Source Course Attendance Identified in LEAP (Instructor-led courses only) and End of Course Evaluation Report Summary provided by Metrics that Matter
PERFORMANCE GOAL 413 Number of diversity-related partnershipsalliances
Description Increased numbers of diversity-related partnerships or alliances with professional associations and educational organizations provide opportunities to educate students about the SECrsquos work and to recruit career professionals from all segments of society The SEC will track the number of partnerships andor alliances with diverse professional associations and educational organizations
FY 2013 FY 2013 FY 2014 FY 2015 Fiscal Year FY 2008 FY 2009 FY 2010 FY 2011 FY 2012 Plan Actual Estimate Request
Number of partnershipsalliances Prior-year data 2 10 12 15 13 15
not available
Responsible DivisionOffice Office of Minority Women and Inclusion
Data Source Office of Minority Women and Inclusion Internal Records and Section 342 of DFA
15
42
FY 2015 ANNUAL PERFORMANCE PLAN bull FY 2015 CBJ FY 2015 APP AND FY 2013 APR
PERFORMANCE GOAL 414 Sur vey rankings
Description Annual and other rankings together with other metrics and indicators of federal government agencies will be used as one kind of metric to determine the SECrsquos overall success in improving employee morale and employee engagement
FY 2013 FY 2013 FY 2014 FY 2015 Fiscal Year FY 2008 FY 2009 FY 2010 FY 2011 FY 2012 Plan Actual Estimate Request
Best Places to Work ranking Ranked Ranked Ranked Ranked Ranked Ranked Ranked Ranked Ranked 3 11 24 27 19 20 15 5 5
Average of employee engagement Prior-year data not available NA 61 75 75
and global satisfaction index
Responsible DivisionOffice Office of Human Resources
Data Source Annual Partnership for Public Service calculated ranking based on Annual Employee Viewpoint Survey (EVS) administered by OPM and Average of Employee Engagement and Global Satisfaction Index from OPM Employee Viewpoint Survey (EVS)
PERFORMANCE GOAL 415 Bench strength
Description To maintain mission effectiveness it is essential that attrition in the leadership ranks is quickly addressed by having a highly qualified and diverse pool of candidates ready to assume those critical roles Success is measured by the percentage of key leadership positions for which the SEC has identified a pool of qualified candidates
FY 2013 FY 2013 FY 2014 FY 2015 Fiscal Year FY 2008 FY 2009 FY 2010 FY 2011 FY 2012 Plan Actual Estimate Request
Data point under development NA NA NA NA NA NA NA TBD TBD
Responsible DivisionOffice Office of Human Resources
Data Source TBD
Strategic Objective 42 The SEC encourages a collaborative environment across divisions and offices and leverages technology and data to fulfill its mission more effectively and efficiently
Goal Leader(s) Director Office of Information Technology
PERFORMANCE GOAL 421 Ensure SECrsquos systems and applications are available
Description The SEC aims to enhance its computing infrastructure to eliminate down time if systems at one site fail among other objectives This metric will capture the percentage of systems and applications that can fail over within 8 hours
FY 2013 FY 2013 FY 2014 FY 2015 Fiscal Year FY 2008 FY 2009 FY 2010 FY 2011 FY 2012 Plan Actual Estimate Request
Percentage of servers virtualized NA 12 22 38 79 85 93 94 95
Percentage fail over within 8 hours NA NA NA NA NA NA NA 100 100
Responsible DivisionOffice Office of Information Technology
Data Source OIT Network Operations Center (NOC) ndash automated network monitoring tools
43
FY 2015 CBJ FY 2015 APP AND FY 2013 APR bull FY 2015 ANNUAL PERFORMANCE PLAN
PERFORMANCE GOAL 422 Equip the SEC with an enhanced technology infrastructure to support enterprise infrastructure
Description The SEC aims to promote collaboration and information sharing across the enterprise To improve efficiency and knowledge management the SEC will consolidate and centralize its collaborative technologies to a commonly used enterprise set by 2020 This metric will measure the percentage of the SECrsquos offices and divisions that utilize centralized enterprise collaboration solutions
FY 2013 FY 2013 FY 2014 FY 2015 Fiscal Year FY 2008 FY 2009 FY 2010 FY 2011 FY 2012 Plan Actual Estimate Request
Number of enterprise solutions Prior-year data not 10 20 25 30 30 35 40
available
Responsible DivisionOffice Office of Information Technology
Data Source Approved software applications list
PERFORMANCE GOAL 423 Expand the SECrsquos video teleconferencing (VTC) capabilities to support an increasingly geographically dispersed workforce
Description The SEC seeks to develop a state of the art video teleconference solution that allows users to conduct a videoteleconference meeting between HQ regional offices and multiple endpoints simultaneously collaborate and share presentation materials and use VoIP technology to host video teleconferences from their officesworkspaces with other SEC users or conference rooms This metric will measure the average ldquouptimerdquo or availability of all VTC systems
FY 2013 FY 2013 FY 2014 FY 2015 Fiscal Year FY 2008 FY 2009 FY 2010 FY 2011 FY 2012 Plan Actual Estimate Request
Availability rate for VTC solutions Prior-year data not available 75 80 9999 9999
Responsible DivisionOffice Office of Information Technology
Data Source Telecommunications monitoring system
PERFORMANCE GOAL 424 Pursue continuous technology cost reductions and efficiencies
Description Recent technology enhancements ndash eg data center consolidation virtualization and maintenance contract reductions ndash are producing technical efficiencies and cost savings This metric will measure the amount of these costs savings
FY 2013 FY 2013 FY 2014 FY 2015 Fiscal Year FY 2008 FY 2009 FY 2010 FY 2011 FY 2012 Plan Actual Estimate Request
Percent reduction in operational run 1-3 187 1 2 cost leveraging technology and cost cost reduction reduction process efficiencies
Prior-year data not available reduction in steady
reduction in steady
in run costs
in run costs
state run state run costs costs1
Responsible DivisionOffice Office of Information Technology
Data Source OIT Network Operations Center (NOC)
The higher than expected FY 2013 actual of 187 percent is due to one-time technologies enhancements resulting from the data consolidation and virtualization 1
44
FY 2015 ANNUAL PERFORMANCE PLAN bull FY 2015 CBJ FY 2015 APP AND FY 2013 APR
PERFORMANCE GOAL 425 Enhance the SECrsquos enterprise data warehouse infrastructure and performance
Description The Enterprise Data Warehouse (EDW) infrastructure will enable the provisioning of data to Commission staff for search and analysis through a virtual data warehouse platform This metric will measure the availability of EDW and data sources
FY 2013 FY 2013 FY 2014 FY 2015 Fiscal Year FY 2008 FY 2009 FY 2010 FY 2011 FY 2012 Plan Actual Estimate Request
Availability rate for the EDW infrastructure components in Prior-year data not available NA NA 99 99 production
Responsible DivisionOffice Office of Information Technology
Data Source OIT Network Operations Center (NOC) ndash automated network monitoring tools
Strategic Objective 43 The SEC maximizes the use of agency resources by continually improving agency operations and bolstering internal controls
Goal Leader(s) Chief Financial Officer Chief Operations Officer
PERFORMANCE GOAL 431 Financial audit results
Description Under the Accountability of Taxpayer Dollars Act of 2002 the agency is required to meet all proprietary and budgetary accounting guidelines for federal agencies and to undergo annual audits The SECrsquos audits are conducted by the Government Accountability Office
FY 2013 FY 2013 FY 2014 FY 2015 Fiscal Year FY 2008 FY 2009 FY 2010 FY 2011 FY 2012 Plan Actual Estimate Request
Unqualified opinion Yes Yes Yes Yes Yes Yes Yes Yes Yes
Material weaknesses 0 1 2 0 0 0 0 0 0
Significant deficiency 3 6 0 4 2 0 1 0 0
Responsible DivisionOffice Office of Financial Management
Data Source GAO SEC Financial Audit Report
PERFORMANCE GOAL 432 Assurance statement on internal control over operations
Description In accordance with OMB A-123 and Section 961 of the Dodd-Frank Act the SEC conducts an annual assessment of the effectiveness of internal controls The SEC will continue to develop its Operational Risk program and enhance cross-organizational processes to support all division and office management assurance statements Success is measured by the quality of risk and control assessments and management self-identification and resolution of improvement opportunities
FY 2013 FY 2013 FY 2014 FY 2015 Fiscal Year FY 2008 FY 2009 FY 2010 FY 2011 FY 2012 Plan Actual Estimate Request
Unqualified opinion Yes Yes Yes Yes Yes Yes Yes Yes Yes
Material weakness 0 0 0 0 0 0 0 0 0
Responsible DivisionOffice Office of the Chief Operating Officer
Data Source SEC Financial Audit Report
45
FY 2015 CBJ FY 2015 APP AND FY 2013 APR bull FY 2015 ANNUAL PERFORMANCE PLAN
1
PERFORMANCE GOAL 433 Timely completion of corrective action on Office of Inspector General (OIG) and the GAO audit recommendations1
Description Timely completion of audit recommendations is an important SEC priority This metric measures how well the Commission is doing in completing corrective action on OIG audit recommendations within established timeframes
FY 2013 FY 2013 FY 2014 FY 2015 Fiscal Year FY 2008 FY 2009 FY 2010 FY 2011 FY 2012 Plan Actual Estimate Request
OIG recommendations completed in Prior-year data not available NA 78 80 80
less than one year
Responsible DivisionOffice Office of the Chief Operating Officer
Data Source Audit Recommendation Tracking System
This measure was developed as part of the FY 2014-2018 SEC strategic planning process Currently there is no methodology in place to capture data for tracking all GAO Audit recommendations OCOO will determine a timeframe for establishing a methodology during FY 2014
46
FY 2015 APP Summary
A Readerrsquos Guide to the SECrsquos Performance Information
The SEC focuses its resources on (1) establishing and maintaining an effective regulatory environment (2) fostering and enforcing compliance with the federal securities laws (3) facilitating access to the information investors need to make informed investment decisions and (4) enhancing the agencyrsquos performance through effective alignment and management of human information and financial capital
The budget request for FY 2015 totals $17 billion an increase of about $2363 million (161 percent) over the agencyrsquos FY 2014 Continuing Resolution funding amount The FY 2015 budget funds 4688 full-time equivalents (FTE) an increase of about 467 FTE (111 percent) over the FY 2014 level and increases the number of positions by 639 to a total of 5183
The additional resources requested for FY 2015 would bolster the SECrsquos efforts to achieve each of its four strategic goals and allow the agency to begin overseeing the new markets and market participants that have been added to the SECrsquos jurisdiction Resources that directly support establishing and maintaining an effective regulatory environment would increase approximately 17 percent from FY 2014 to FY 2015 resources utilized in fostering and enforcing compliance with the
The following chapters comprise the agencyrsquos FY 2013 Annual Performance Report (APR) and FY 2015 Annual Performance Plan (APP) which explains how the SEC uses resources to achieve each of its four strategic goals As part of the SEC Strategic Plan process for FY 2014-2018 the agency has developed a new set of Strategic Goals Objectives and Performance Goals and Indicators The APR reports on the set of measures from the prior FY 2010-2015 Strategic Plan while the APP projects performance using the new set of measures
The following outlines a brief description of each of the major components of the performance section
Strategic Goal Summary Each strategic goal section opens by reviewing the purpose of the goal followed by information identifying the resources allocated toward achieving the goal
securities laws would increase by approximately 17 percent compared to FY 2014 resources that support activities that aim to facilitate access to the information investors need to make informed investment decisions would decrease about 7 percent
The agency is mindful that significantly increasing staffing in the program areas requires a commensurate increase in staff and funding for support offices Additionally refinements to the tracking of resources devoted to the effective management of human information and financial capital has led the program offices to devote more staff time to these duties The requested funding will provide necessary resources for investments in information technology that will improve the agencyrsquos technology security tips complaints and referrals (TCR) system technology infrastructure and workflow processes
To complement the FY 2015 performance budget the agency also presents its FY 2015 budget by program (beginning on page 47) Each program chapter provides detailed information on program priorities initiatives and workload figures for the relevant divisions and offices
Budgeting for the Future (FY 2015) A brief discussion of how the SEC plans to use resources requested in FY 2015 to achieve the strategic goal
Strategic Objective This section provides a description of the SECrsquos strategic objectives that gauge the agencyrsquos performance within each strategic goal
Performance Goals and Indicators Each strategic goal section includes a presentation of performance measures and performance indicators by outcome comparing planned and actual performance levels for FY 2013 Four years of historical data is provided for performance measures and performance indicators where available The APP will include an analysis of performance expectations for each goal
22
FY 2015 CBJ FY 2015 APP AND FY 2013 APR bull FY 2015 ANNUAL PERFORMANCE PLAN
Verification and Validation of Performance Data
The SECrsquos programs require accurate data to properly assess program performance and to make good management decisions Data verification and validation is used to evaluate whether data has been generated according to specifications satisfy acceptance criteria and are appropriate and consistent with their intended use Data verification is a systematic process for evaluating performance and compliance of a set of data when compared to a set of standards to ascertain its completeness correctness and consistency using the methods and criteria defined in the project documentation Data validation follows the data verification process and uses information from the project documentation to ascertain the usability of the data in light of its measurement quality objectives and to ensure that results obtained are scientifically defensible
The SEC ensures that the performance data presented in this report is complete reliable and accurate based upon the following assessment steps
(1) The agency develops performance measures through its strategic planning process
(2) The SECrsquos divisions and offices perform the following steps to ensure that data used in the calculation of performance measures is accurate and reliable including adequately documenting
uuthe sources of the underlying data elements and the procedures used to gather the data
uuthe procedures used to obtain assurance as to the accuracy and reliability of the data
uuthe data definitions for reference documenting and explaining the measure calculations
(3) The divisions and offices calculate and report the performance measures to the Office of Financial Management and the measures are approved by division directors and office heads This process ensures that the data used in the calculation of performance measures is accurate and reliable and that internal control is maintained through the approval process
23
FY 2015 ANNUAL PERFORMANCE PLAN bull FY 2015 CBJ FY 2015 APP AND FY 2013 APR
Performance Summary by Strategic Goal
Strategic Goal 1 Establish and Maintain an Effective Regulatory Environment
During FY 2015 the SEC plans to pursue a vigorous investor-focused rulemaking agenda that will help protect investors and ensure that markets operate fairly In FY 2015 the agency is requesting a total of $9373 million and 2668 FTEs toward achieving results in establishing an effective regulatory environment
Budgeting for the Future (FY 2015)
In FY 2014 and FY 2015 SEC staff will continue implementing new rules required under the Dodd-Frank Act and the Jumpstart Our Business Startups (JOBS) Act designed by Congress to give entrepreneurs greater access to early-stage capital
SECrsquos rulemaking agenda places priority on investor protection market stability and capital formation
In FY 2014 and FY 2015 TM will continue significant rulemaking efforts to implement key areas of the Dodd-Frank Act including (1) creation of a new regulatory structure for over-the-counter (OTC) derivatives (2) the substantially expanded regulation of NRSROs (3) the regulation and examination of new clearing agencies and new clearing agency activities including interagency coordination with respect to those agencies deemed to be systemically significant (4) implementation of a new regulatory regime for municipal advisors (5) restrictions on
certain conflicts of interest arising in connection with activities involving asset-backed securities (ABS) and (6) new rules relating to the cross-border implementation of rules under Title VII of the Dodd-Frank Act
CF plans to devote significant staff resources to rulemaking and interpretive guidance including to prepare any remaining rules to implement the Dodd-Frank Act and JOBS Act consider the impact of SEC rules and regulations on small business capital formation review the accredited investor definition in Regulation D and continue efforts to modernize and simplify disclosure requirements
In FY 2014 and FY 2015 IM also will undertake several rulemaking initiatives The SEC plans to continue work to evaluate options on money market fund reform and develop a recommendation to the Commission for final rule amendments that were proposed in FY 2013 In addition IM expects to recommend that the Commission issue a proposal to improve the reporting of information about fund operations and portfolio holdings and adopt rule and form changes regarding the general solicitation of hedge and other private funds
TM IM and CF remain committed to exceeding timeliness goals in responding to written requests for no-action letters exemptive applications and written interpretive requests (Performance Goal 131)
Strategic Objective 11 The SEC establishes and maintains a regulatory environment that promotes high-quality disclosure financial reporting and governance and prevents abusive practices by registrants financial intermediaries and other market participants
Goal Leader(s) Director Office of Investor Education and Advocacy
PERFORMANCE INDICATOR (PROCESS) 111 Number of investor testing research projects
Description This metric tracks the number of research initiatives used to gather feedback from investors on the usefulness of disclosures and other input on SEC rulemaking
Fiscal Year FY 2008 FY 2009 FY 2010 FY 2011 FY 2012 FY 2013 Actual
Number of projects 1 0 0 2 2 0
Responsible DivisionOffice Office of Investor Education and Advocacy
Data Source Microsoft Office Suite Tools
24
FY 2015 CBJ FY 2015 APP AND FY 2013 APR bull FY 2015 ANNUAL PERFORMANCE PLAN
FY 2015 ANNUAL PERFORMANCE PLAN bull FY 2015 CBJ FY 2015 APP AND FY 2013 APR
Strategic Objective 12 The SEC promotes capital markets that operate in a fair efficient transparent and competitive manner fostering capital formation and innovation
Goal Leader(s) Director Division of Trading and Markets
PERFORMANCE GOAL 121 Time to complete SEC review of SRO rules that are subject to SEC approval
Description The SEC reviews SRO rule proposals for consistency with the Exchange Act standards of investor protection fair and orderly operation of the markets and market structure as well as other statutory requirements This metric gauges the timeliness of those reviews
FY 2013 FY 2013 FY 2014 FY 2015 Fiscal Year FY 2008 FY 2009 FY 2010 FY 2011 FY 2012 Plan Actual Estimate Request
Within 45 days Prior-year data 99 82 75 70 74 70 70
not available
Responsible DivisionOffice Division of Trading and Markets
Data Source SRO Rule Tracking System (SRTS)
PERFORMANCE INDICATOR (PROCESS) 121 Percentage of SRO rule filings that are submitted for immediate effectiveness
Description This indicator gauges the proportion of SRO rule proposals that can be submitted for immediate effectiveness without Commission approval
FY 2013 Fiscal Year FY 2008 FY 2009 FY 2010 FY 2011 FY 2012 Actual
Percentage Prior-year data 69 77 72 78
not available
Responsible DivisionOffice Division of Trading and Markets
Data Source SRO Rule Tracking System (SRTS)
PERFORMANCE INDICATOR (PROCESS) 122 Percentage of transaction dollars settled on time each year
Description This indicator measures the efficiency of the US clearance and settlement system for equity securities
FY 2013 Fiscal Year FY 2008 FY 2009 FY 2010 FY 2011 FY 2012 Actual
Percentage 99 99 99 99 99 98
Responsible DivisionOffice Division of Trading and Markets
Data Source National Securities Clearing Corporation
25
FY 2015 CBJ FY 2015 APP AND FY 2013 APR bull FY 2015 ANNUAL PERFORMANCE PLAN
PERFORMANCE INDICATOR (PROCESS) 123 Percentage of market outages at SROs and electronic communications networks (ECNs)
that are corrected within targeted timeframes
Description Market outages reflect problems in the systems underlying the securities markets that could have an adverse effect on the marketsrsquo ability to function as required The SEC assesses the reliability and resiliency of these systems to minimize the number and duration of outages This metric gauges how quickly outages are resolved so that market activity can resume
FY 2013 Fiscal Year FY 2008 FY 2009 FY 2010 FY 2011 FY 2012 Actual
Within 2 hours 84 87 74 88 71 80
Within 4 hours 96 98 85 94 89 86
Within 24 hours 100 98 100 100 100 98
Responsible DivisionOffice Division of Trading and Markets
Data Source ECN outage data is derived from SROs
Strategic Objective 13 The SEC adopts and administers regulations and rules that are informed by robust economic analysis and public comment and that enable market participants to understand their obligations under the securities laws
Goal Leader(s) Director Division of Trading and Markets Director Division of Corporation Finance Director Division of Investment Management
PERFORMANCE GOAL 131 Length of time to respond to written requests for no-action letters (NAL) exemptive applications and written interpretive requests
Description The SEC staff responds to requests for guidance from individuals and market participants about specific provisions of the federal securities laws These queries may seek interpretations of the securities laws or regulations or assurances that no enforcement action will be taken if the individual or market participant engages in a specified activity The staff also reviews applications for exemptions from the securities laws Written responses to such requests for guidance when provided generally are publicly available as are applications and related notices and orders when issued This metric gauges the timeliness of initial comments issued by the Divisions of Trading and Markets Investment Management and Corporation Finance
FY 2013 FY 2013 FY 2014 FY 2015 Fiscal Year FY 2008 FY 2009 FY 2010 FY 2011 FY 2012 Plan Actual Estimate Request
Trading and Markets No-action letters exemptive applications and written interpretive requests (combined figure)
Percentage within required timeframe 63 70 91 985 89 85 93 85 85
Responsible DivisionOffice Division of Corporation Finance
Data Source TM Request Tracking Log
Investment Management
No-action letters and interpretive 98 100 100 100 100 90 100 90 90
requests
Exemptive applications 81 95 100 100 100 80 99 80 80
Responsible DivisionOffice Division of Investment Management
Data Source OCC Letter Log OICR and OIP Applications Tracking Systems (Access) Excel spreadsheet
Corporation Finance
No-action letters and interpretive 66 85 97 97 98 90 98 90 90
requests
Shareholder proposals 100 100 100 100 100 100 100 100 100
Responsible DivisionOffice Division of Corporation Finance
Data Source Division No-Action Letter database and Division Shareholder Proposal database
26
FY 2015 ANNUAL PERFORMANCE PLAN bull FY 2015 CBJ FY 2015 APP AND FY 2013 APR
PERFORMANCE GOAL 132 Timeliness of responses to requests for informal guidance received by the Trading and Markets dedicated hotline or email box
Description The Division of Trading and Markets maintains a dedicated phone line and an email account to provide market participants with avenues to request information and informal guidance regarding the Exchange Act and rules thereunder This metric will reflect the timeliness of the staffrsquos responses to these requests
FY 2013 FY 2013 FY 2014 FY 2015 Fiscal Year FY 2008 FY 2009 FY 2010 FY 2011 FY 2012 Plan Actual Estimate Request
Respond to or refer inquiries within Prior-year data not available NA NA 95 95
2 weeks
Responsible DivisionOffice Division of Trading and Markets
Data Source Division of Trading and Markets Office of Interpretation and Guidance (OIG) Log and email box
PERFORMANCE INDICATOR (CONTEXTUAL) 131 Number of published economic reports
Description This indicator gauges the number of economic reports that staff of the Division of Economic and Risk Analysis publishes annually on the SECrsquos website
FY 2013 Fiscal Year FY 2008 FY 2009 FY 2010 FY 2011 FY 2012 Actual
Number of reports NA NA NA NA NA
Responsible DivisionOffice Division of Economic Research and Analysis
Data Source DERA economists produce research for publication in leading academic journals including the top accounting and finance journals such as the Journal of Accounting and Economics the Journal of Financial Economics and the Review of Financial Studies DERArsquos site on SEC gov includes citations of all published and forthcoming research written by DERA staff
PERFORMANCE INDICATOR (PROCESS) 132 Number of amendments to national securities exchange registrations (Form 1)
Description This indicator provides information about the volume of material filed with the SEC that involves amendments to exchange registrations
FY 2013 Fiscal Year FY 2008 FY 2009 FY 2010 FY 2011 FY 2012 Actual
Number of amendments Prior-year data not available NA
Responsible DivisionOffice Division of Trading and Markets
Data Source Manual spreadsheets
PERFORMANCE INDICATOR (PROCESS) 133 Number of Alternative Trading System registrations (Form ATS)
Description This indicator provides information about the volume of material filed with the SEC that involves filings related to ATS registrations
FY 2013 Fiscal Year FY 2008 FY 2009 FY 2010 FY 2011 FY 2012 Actual
Number of registrations Prior-year data not available NA
Responsible DivisionOffice Division of Trading and Markets
Data Source Manual spreadsheets
11
27
FY 2015 CBJ FY 2015 APP AND FY 2013 APR bull FY 2015 ANNUAL PERFORMANCE PLAN
PERFORMANCE INDICATOR (PROCESS) 134 Number of new investment product submissions
Description This indicator provides information about the volume of material filed with the SEC that involves new product submissions pursuant to Rule 19b-4(e) of the Exchange Act
FY 2013 Fiscal Year FY 2008 FY 2009 FY 2010 FY 2011 FY 2012 Actual
Number of submissions Prior-year data not available NA
Responsible DivisionOffice Division of Trading and Markets
Data Source Manual spreadsheets
Strategic Objective 14 The SEC engages with a multitude of stakeholders to inform and enhance regulatory activities domestically and internationally
Goal Leader(s) Director Office of International Affairs
PERFORMANCE GOAL 141 Super visory cooperation requests from foreign authorities for SEC assistance and SEC requests for assistance on supervisory cooperation from foreign authorities
Description The SEC makes requests to foreign authorities for supervisory cooperation assistance and responds to such requests from foreign regulators through both formal mechanisms such as supervisory memoranda of understanding and on an ad hoc basis
FY 2013 FY 2013 FY 2014 FY 2015 Fiscal Year FY 2008 FY 2009 FY 2010 FY 2011 FY 2012 Plan Actual Estimate Request
Supervisory cooperation requests Prior-year data not available NA 118 NA NA
from foreign authorities
SEC requests for assistance on supervisory cooperation from Prior-year data not available NA 25 NA NA foreign authorities
Responsible DivisionOffice Office of International Affairs
Data Source International Program Oversight Database and Business Objects reports
PERFORMANCE GOAL 142 Number of non-US regulators trained
Description This metric shows the reach of the SECrsquos technical assistance programs for regulators around the world The SEC conducts these training sessions to assist countries in developing and maintaining robust protections for investors and promoting cross-border enforcement and supervisory assistance
FY 2013 FY 2013 FY 2014 FY 2015 Fiscal Year FY 2008 FY 2009 FY 2010 FY 2011 FY 2012 Plan Actual Estimate Request
Number of non-US regulators Prior-year data not 1997 1765 1785 1370 1716 1400 1400
available
Responsible DivisionOffice Office of International Affairs
Data Source International Program Oversight Database and Business Objects reports
28
Strategic Goal 2 Foster and Enforce Compliance with the Federal Securities Laws
In FY 2015 the agency is requesting a total of 502 FTE for Goal 2 The additional resources will allow the SEC to continue building out the agencyrsquos new responsibility areas and begin addressing the disparity between the number of exam staff and the growing number and complexity of registered firms Additionally the Commission will be able to take prompt action to halt misconduct sanction wrongdoers effectively and return funds to harmed investors In all the agency plans to devote approximately $1802 million to enforcing compliance with the federal securities laws
Budgeting for the Future (FY 2015)
In FY 2015 the SEC will continue to make improvements to its National Examination and Enforcement programs These improvements include hiring staff with new skill sets enhancing their technologies streamlining processes expanding the SECrsquos training programs improving the processing of the thousands of tips the agency receives annually and improving risk assessment techniques These and other significant efforts contribute to the agencyrsquos objective of creating an enduring structure for improved protection of investors and markets
In FY 2015 the National Examination program will continue its focus on high-risk entities and activities Additional staff will among other things improve risk assessment and surveillance functions and continue to address the disparity between the number of staff and the size and complexity of regulated entities The staff will perform targeted sweep and cause examinations including examinations over new or expanded areas of the agencyrsquos jurisdiction
The Enforcement program plans to build on significant changes implemented in prior fiscal years and will work to meet new challenges expected in FY 2015 In order to effectively meet these challenges the Enforcement program is aggressively adopting new methods initiatives and organizational reforms to ensure the best possible use of available resources to strengthen investor confidence in the US financial markets and to send a strong message of deterrence to would-be violators of the securities laws
To improve the quality and efficiency of its investigations the SEC has put seasoned investigators on the front lines created specialized units focused on specific programmatic priorities enhanced case management systems and increased coordination efforts with other offices and divisions in the agency and other regulators In FY 2015 the SEC plans to obtain relief on one or more claims from approximately 92 percent of enforcement actions (Performance Goal 231) The SEC has implemented controls and strategies to resolve actions on a favorable basis while at the same time it will not hesitate to file matters on a contested basis where a favorable settlement was unavailable before filing The agency also plans to reduce in FY 2015 the average number months between the opening of an investigation and the commencement of an enforcement action arising out of that investigation (Performance Goal 233)
Under the Sarbanes-Oxley Act of 2002 the SEC can use Fair Funds to redirect penalties collected from securities law violators to the victims of their wrongdoing The SEC is committed to the timely collection and distribution of penalties and disgorgement funds and has adopted a variety of new measures for monitoring its progress (Performance Goal 235)
29
FY 2015 ANNUAL PERFORMANCE PLAN bull FY 2015 CBJ FY 2015 APP AND FY 2013 APR
FY 2015 CBJ FY 2015 APP AND FY 2013 APR bull FY 2015 ANNUAL PERFORMANCE PLAN
Strategic Objective 21 The SEC fosters compliance with the federal securities laws
Goal Leader(s) Director Office of Compliance Inspections and Examinations
PERFORMANCE GOAL 211 Number of industr y outreach and education programs targeted to areas identified as raising particular compliance risks
Description Targeted communication with industry participants on topics shaping the examination program is intended to enhance compliance practices and prevent violations before they occur This metric identifies the number of major outreach efforts conducted including the SECrsquos national and regional compliance outreach events published risk alerts and other educational programs and initiatives
FY 2013 FY 2013 FY 2014 FY 2015 Fiscal Year FY 2008 FY 2009 FY 2010 FY 2011 FY 2012 Plan Actual Estimate Request
Number of major outreach efforts Prior-year data 6 5 12 14 15 16
not available
Responsible DivisionOffice Office of Compliance Inspections and Examinations
Data Source Internal tracking although the events noted above are referenced in the SECrsquos website
PERFORMANCE GOAL 212 Percentage of firms receiving deficiency letters that take corrective action in response to all exam findings
Description At the conclusion of examinations the staff communicates identified deficiencies to registrants in the form of a deficiency letter Registrants are then given a chance to respond to staff findings and often take action to remedy any problems and potential risks including monetary compensation to clients and enhancements to disclosures policies and procedures Most often registrants respond that they have corrected the deficiencies and implemented measures to prevent recurrence
FY 2013 FY 2013 FY 2014 FY 2015 Fiscal Year FY 2008 FY 2009 FY 2010 FY 2011 FY 2012 Plan Actual Estimate Request
Percentage 93 94 90 93 92 93 86 87 88
Responsible DivisionOffice Office of Compliance Inspections and Examinations
Data Source Tracking and Reporting Exam National Documentation System (TRENDS)
Strategic Objective 22 The SEC promptly detects and deters violations of the federal securities laws
Goal Leader(s) Director Office of Compliance Inspections and Examinations
PERFORMANCE GOAL 221 Percentage of investment advisers investment companies and broker-dealers examined during the year
Description This metric indicates the number of registrants examined by the SEC or an SRO as a percentage of the total number of registrants This metric includes all types of examinations risk priority examinations cause inspections to follow up on tips and complaints limited-scope special inspections to probe emerging risk areas oversight examinations of broker-dealers to test compliance and the quality of examinations by FINRA
FY 2013 FY 2013 FY 2014 FY 2015 Fiscal Year FY 2008 FY 2009 FY 2010 FY 2011 FY 2012 Plan Actual Estimate Request
Investment advisers 14 10 9 8 8 10 9 9 12
Investment companies 23 29 10 13 12 14 11 12 15
Broker-dealers (exams by SEC 57 54 44 58 49 50 46 48 50
and SROs)
Responsible DivisionOffice Office of Compliance Inspections and Examinations
Data Source Tracking and Reporting Exam National Documentation System (TRENDS) (IA IC and BD SEC data) and SRO Databases (BD SRO Data)
17
30
FY 2015 ANNUAL PERFORMANCE PLAN bull FY 2015 CBJ FY 2015 APP AND FY 2013 APR
PERFORMANCE GOAL 222 Percentage of compliance exams that are timely concluded in accordance with the Office of Compliance Inspections
and Examinationrsquos (OCIE) statutory deadline
Description The staff conducts examinations each year of registered entities including investment advisers investment company complexes transfer agents and broker-dealers The staff strives to complete its examinations and communicate findings in the most efficient and effective manner and within its statutory deadline This metric reflects the percentage of examinations concluded within the statutory deadline
FY 2013 FY 2013 FY 2014 FY 2015 Fiscal Year FY 2008 FY 2009 FY 2010 FY 2011 FY 2012 Plan Actual Estimate Request
Percentage Prior-year data NA NA NA 100 100 100 100
not available
Responsible DivisionOffice Office of Compliance Inspections and Examinations
Data Source Tracking and Reporting Exam National Documentation System (TRENDS)
PERFORMANCE GOAL 223 Number of joint exams information sharing agreements and formal meetings with other regulators
Description The SEC attempts to coordinate and collaborate with other regulators on areas of mutual interest This helps to ensure that all regulators are informed of on-going risks and issues related to broad market practices as well as specific entities of mutual interest This cooperation is critical to the exam program to ensure that certain higher risk firms and activities are addressed in the most efficient and effective manner This metric tracks critical cooperation activities that are occurring between the SECrsquos exam program and other regulators
FY 2013 FY 2013 FY 2014 FY 2015 Fiscal Year FY 2008 FY 2009 FY 2010 FY 2011 FY 2012 Plan Actual Estimate Request
Number of joint exams active sharing Prior-year data not available NA NA 85 100
agreements and formal meetings
Responsible DivisionOffice Office of Compliance Inspections and Examinations
Data Source Various (including internal tracking and TRENDS)
PERFORMANCE INDICATOR (CONTEXTUAL) 221 Percentage of exams that identify deficiencies the percentage that result in a ldquosignificant findingrdquo
and the percentage referred to the Division of Enforcement
Description Examiners find a wide range of deficiencies during examinations Some of the deficiencies are more technical in nature such as failing to include all information that is required to be in a record However other deficiencies may cause harm to customers or clients of a firm have a high potential to cause harm or reflect recidivist misconduct The latter deficiencies are among those categorized as ldquosignificantrdquo This indicator identifies the percentage of exams that identified deficiencies that resulted in significant deficiency findings and that were referred to Enforcement
FY 2013 Fiscal Year FY 2008 FY 2009 FY 2010 FY 2011 FY 2012 Actual
Percentage that identify deficiencies Prior-year data 72 82 80 80
not available
Percentage that result in a ldquosignificant findingrdquo Prior-year data 42 42 42 35
not available
Percentage referred to the Division of Enforcement Prior-year data not available 13
Responsible DivisionOffice Office of Compliance Inspections and Examinations
Data Source Tracking and Reporting Exam National Documentation System (TRENDS)
31
PERFORMANCE INDICATOR (OUTPUT) 222 Number of cause exams that result from tips complaints and referrals
Description Analysis of a tip can support the request for a cause exam This indicator would identify the number of SEC cause exams that result from tips collected through outreach efforts
Fiscal Year FY 2008 FY 2009 FY 2010 FY 2011 FY 2012 FY 2013 Actual
Number of cause exams Prior-year data not available
NA NA NA 222
Responsible DivisionOffice Office of Compliance Inspections and Examinations
Data Source Tracking and Reporting Exam National Documentation System (TRENDS)
PERFORMANCE INDICATOR (OUTPUT) 223 Number of rule-making initiatives assisted by the National Exam Program
Description The examination program interacts with registrants on a regular basis and this work provides critical feedback to ensuring effective and practical rulemaking and policy efforts This indicator tracks how frequently the examination program assists with rulemaking initiatives
Fiscal Year FY 2008 FY 2009 FY 2010 FY 2011 FY 2012 FY 2013 Actual
Number of rule-making initiatives assisted by the NEP Prior-year data not available NA
Responsible DivisionOffice Office of Compliance Inspections and Examinations
Data Source Internal tracking
PERFORMANCE INDICATOR (OUTPUT) 224 Number of investigations or inquiries originating from a tip or complaint
Description Analysis of a tip or complaint can result in the need for further enforcement investigation The indicator identifies the volume of SEC investigations that result from tips and complaints received by the SEC
Fiscal Year FY 2008 FY 2009 FY 2010 FY 2011 FY 2012 FY 2013 Actual
Number of investigations Prior-year data not available
303 349 296 289
Responsible DivisionOffice Division of Enforcement
Data Source HUB case management and tracking system for the Division of Enforcement
PERFORMANCE INDICATOR (OUTPUT) 225 SEC investigations in which requests for access to information were granted by the SEC to other authorities
such as SROs or other state federal and foreign enforcement authorities
Description The SEC works closely with other regulators and authorities This measure identifies the number of investigations in which the SEC granted one or more authorities access to information concerning an investigation during the fiscal year This may include requests for access to SEC investigative files concerning investigations that the SEC continues to pursue as well as those in which the SEC has completed its investigation
Fiscal Year FY 2008 FY 2009 FY 2010 FY 2011 FY 2012 FY 2013 Actual
Number of investigations Prior-year data not available
492 586 515 504
Responsible DivisionOffice Division of Enforcement
Data Source HUB case management and tracking system for the Division of Enforcement
32
FY 2015 CBJ FY 2015 APP AND FY 2013 APR bull FY 2015 ANNUAL PERFORMANCE PLAN
FY 2015 ANNUAL PERFORMANCE PLAN bull FY 2015 CBJ FY 2015 APP AND FY 2013 APR
PERFORMANCE INDICATOR (OUTPUT) 226 Requests from foreign authorities for SEC assistance and SEC requests for assistance from foreign authorities
Description Each year the SEC makes hundreds of requests for enforcement assistance to foreign regulators while responding to hundreds of such requests from other nations To facilitate this type of assistance and encourage other countries to enact laws necessary to allow regulators to cooperate with their foreign counterparts the SEC has entered into bilateral information sharing arrangements as well as the Multilateral Memorandum of Understanding an information-sharing arrangement negotiated through the International Organization of Securities Commissions (IOSCO)
FY 2013 Fiscal Year FY 2008 FY 2009 FY 2010 FY 2011 FY 2012 Actual
Number of requests from foreign authorities 414 408 457 492 450
Number of SEC requests 594 774 605 772 718
Responsible DivisionOffice Office of International Affairs
Data Source International Program Oversight Database and Business Objects reports
Strategic Objective 23 The SEC prosecutes violations of federal securities laws and holds violators accountable through appropriate sanctions and remedies
Goal Leader(s) Director Division of Enforcement
PERFORMANCE GOAL 231 Percentage of enforcement actions in which the Commission obtained relief on one or more claims
Description This metric identifies as to all parties to enforcement actions that were resolved in the fiscal year the percentage against whom the Commission obtained a judgment or order entered on consent a default judgment a judgment of liability on one or more charges andor the imposition of monetary or other relief
FY 2013 FY 2013 FY 2014 FY 2015 Fiscal Year FY 2008 FY 2009 FY 2010 FY 2011 FY 2012 Plan Actual Estimate Request
Percentage 92 92 92 93 89 92 93 92 92
Responsible DivisionOffice Division of Enforcement
Data Source HUB case management and tracking system for the Division of Enforcement
PERFORMANCE GOAL 232 Percentage of first enforcement actions filed within two years of the opening of an investigation
Description This metric concerns the pace of investigations that lead to the filing of enforcement actions Specifically this metric captures the rate at which the first enforcement action arising out of an investigation was filed within two years of the opening of the investigation If the investigation was preceded by a matter under inquiry the metric draws on the date of the opening of the matter under inquiry In conducting investigations the Enforcement program continually strives to balance the need for complete effective and fair investigations with the need to file enforcement actions in as timely a manner as possible
FY 2013 FY 2013 FY 2014 FY 2015 Fiscal Year FY 2008 FY 2009 FY 2010 FY 2011 FY 2012 Plan Actual Estimate Request
Percentage 62 70 67 61 63 65 58 65 65
Responsible DivisionOffice Division of Enforcement
Data Source HUB case management and tracking system for the Division of Enforcement
508
717
33
FY 2015 CBJ FY 2015 APP AND FY 2013 APR bull FY 2015 ANNUAL PERFORMANCE PLAN
PERFORMANCE GOAL 233 Average months between opening a matter under inquiry or an investigation and commencing an enforcement action
Description This metric captures the average number of months between the opening of an investigation and the filing of the first enforcement action arising out of that investigation If the investigation was preceded by a matter under inquiry the metric draws on the date of opening of the matter inquiry In conducting investigations the enforcement program continually strives to balance the need for complete effective and fair investigation with the need to file enforcement actions in as timely a manner as possible While not all investigations result in the filing of enforcement actions this metric provides information concerning the pace of investigations that do lead to such actions and supplements the previous goal which measures the percentage of first enforcement actions filed within two years
FY 2013 FY 2013 FY 2014 FY 2015 Fiscal Year FY 2008 FY 2009 FY 2010 FY 2011 FY 2012 Plan Actual Estimate Request
Months Prior-year data not available 22 21 20 21 20 20
Responsible DivisionOffice Division of Enforcement
Data Source HUB case management and tracking system for the Division of Enforcement
PERFORMANCE GOAL 234 Percentage of debts where either a payment has been made or a collection activity has
been initiated within 180 days of the due date of the debt
Description The SEC can seek a wide range of remedies for failure to comply with the securities laws These remedies include civil monetary penalties and disgorgement When the remedies are imposed by the SEC or the Federal district court payments must be made by a certain date This metric identifies the percentage of debts where debtors have made payments or the SEC has initiated a collection activity within 180 days of the due date Such collection activities include among other things demand letters negotiation of payment plans enforcing the payment of the debt through the courts or other judicial remedies
FY 2013 FY 2013 FY 2014 FY 2015 Fiscal Year FY 2008 FY 2009 FY 2010 FY 2011 FY 2012 Plan Actual Estimate Request
Percentage 88 90 86 91 92 92 95 95 95
Responsible DivisionOffice Division of Enforcement
Data Source DELPHI
PERFORMANCE GOAL 235 Percentage of Fair Fund and disgorgement fund plans that have distributed 80 percent of the available
funds for distribution within twenty four (24) months of the approval of the distribution plan
Description In addition to other types of relief the SEC may seek orders requiring parties to disgorge any money obtained through wrongdoing The SEC also is empowered to seek civil penalties for violations of the securities laws Where appropriate the SEC has sought to return disgorged funds to harmed investors and as a result of the Fair Funds provisions of the Sarbanes-Oxley Act and the Dodd-Frank Act to combine amounts paid as penalties with disgorged funds or to create a Fair Fund from penalties only to reduce losses to injured parties and to maximize funds available for distribution This metric identifies the percentage of distribution plans that reached a critical mass during the fiscal year and within twenty four (24) months of the approval of the distribution plan The distribution plan includes the timeline and procedures required to return the funds to injured investors This reflects Commission-wide efforts to implement plans to return money to investors quickly Any funds not returned to investors are sent to the US Treasury or the Investor Protection Fund established pursuant to Section 21F(g) of the Securities Exchange Act of 1934 Neither disgorgement nor penalties are used for the SECrsquos own expenses
FY 2013 FY 2013 FY 2014 FY 2015 Fiscal Year FY 2008 FY 2009 FY 2010 FY 2011 FY 2012 Plan Actual Estimate Request
Percentage Prior-year data not available 80 80 73 78 82
Responsible DivisionOffice Division of Enforcement
Data Source HUB case management and tracking system for the Division of Enforcement and Distributions Management System
34
PERFORMANCE INDICATOR (CONTEXTUAL) 232 Total amount distributed within the fiscal year and the number of Fair Funds from which those distributions came
Description In its enforcement actions the SEC may seek to return funds to harmed investors through disgorgement of ill-gotten gains or through the Fair Funds provision of the Sarbanes-Oxley Act This provision permits the SEC to combine amounts paid as penalties with disgorged funds or to create a Fair Fund from penalties only to reduce losses to injured parties This reflects the SECrsquos efforts to return funds to injured investors This indicator identifies the total amount distributed within the fiscal year and the number of Fair Funds from which those distributions came This indicator may increase or decrease in dollar amount and number of distribution funds based on the number of SEC enforcement actions brought involving distributions amounts ordered and paid in those actions and other factors Due to the variation in reporting timelines established for each individual distribution reported amounts are based on the agencyrsquos best available information Reported amounts do not include those funds distributed through receiverships Any funds not returned to investors are sent to the US Treasury or the Investor Protection Fund established pursuant to Section 21F(g) of the Securities Exchange Act of 1934 Neither disgorgement nor penalties are used for the Commissionrsquos own expenses
Fiscal Year FY 2008 FY 2009 FY 2010 FY 2011 FY 2012 FY 2013 Actual
Amount distributed (in millions) Prior-year data not available 815 251
Number of Fair Funds Prior-year data not available 31 22
Responsible DivisionOffice Division of Enforcement
Data Source HUB case management and tracking system for the Division of Enforcement Distributions Management System
PERFORMANCE INDICATOR (CONTEXTUAL) 231 Percentage of filed enforcement actions reflecting characteristics that present enhanced risk to investors and markets as
measured by the nature of the investigation conduct parties and impact
Description This indicator assesses the quality of the cases filed by the Division of Enforcement The indicator focuses on cases filed by the SEC that involve factors reflecting enhanced risk to investors and markets Such cases may involve (i) those identified through risk analytics and cross-disciplinary initiatives to reveal difficult-to-detect or early stage misconduct thus minimizing investor loss and preventing the spread of unlawful conduct and practices (ii) particularly egregious or widespread misconduct and investor harm (iii) vulnerable victims (iv) a high degree of scienter (v) involvement of individuals occupying substantial positions of authority or having fiduciary obligations or other special responsibilities to investors (vi) involvement of recidivists (vii) high amount of investor loss prevented (viii) misconduct that is difficult to detect due to the complexity of products transactions and practices (ix) use of innovative investigative or analytical techniques (x) effective coordination with other law enforcement partners andor (xi) whether the matter involves markets transactions or practices identified as an enforcement priority or that advances the programmatic priorities of other SEC Divisions or Offices
Fiscal Year FY 2008 FY 2009 FY 2010 FY 2011 FY 2012 FY 2013 Actual
Percentage Prior-year data not available NA NA
Responsible DivisionOffice Division of Enforcement
Data Source HUB case management and tracking system for the Division of Enforcement
35
FY 2015 ANNUAL PERFORMANCE PLAN bull FY 2015 CBJ FY 2015 APP AND FY 2013 APR
PERFORMANCE INDICATOR (OUTPUT) 233 Percent of enforcement actions filed that arose out of national priority investigations
Description The Division of Enforcement conducts many enforcement actions each year that can be characterized as high impact and of national priority High impact or national priority investigations include those investigations which are significant for one or more of the following reasons ndashthe matter (i) presents an opportunity to send a particularly strong and effective message of deterrence including with respect to markets products and transactions that are newly developing or that are long established but which by their nature present limited opportunities to detect wrongdoing and thus to deter misconduct (ii) involves particularly egregious or extensive misconduct (iii) involves potentially widespread and extensive harm to investors (iv) involves misconduct by persons occupying positions of substantial authority or responsibility or who owe fiduciary or other enhanced duties and obligations to a broad group of investors or others (v) involves potential wrongdoing as prohibited under newly-enacted legislation or regulatory rules (vi) concerns potential misconduct that occurred in connection with products markets transactions or practices that pose particularly significant risks for investors or a systemically important sector of the market (vii) involves a substantial number of potential victims and or particularly vulnerable victims (viii) involves products markets transactions or practices that the Enforcement Division has identified as priority areas (ie conduct relating to the financial crisis fraud in connection with mortgage-related securities financial fraud involving public companies whose stock is widely held misconduct by investment advisers and matters involving priorities established by particular regional offices or the specialized units) andor (ix) provides an opportunity to pursue priority interests shared by other law enforcement agencies on a coordinated basis
Fiscal Year FY 2008 FY 2009 FY 2010 FY 2011 FY 2012 FY 2013 Actual
Percentage Prior-year data not available 10 20 15
Responsible DivisionOffice Division of Enforcement
Data Source HUB case management and tracking system for the Division of Enforcement
PERFORMANCE INDICATOR (CONTEXTUAL) 234 Criminal actions related to conduct under investigation by the SEC
Description In some instances conduct may involve both civil and criminal violations and may be investigated by both the SEC and the criminal authorities This indicator identifies the number of criminal actions that are related to conduct under investigation by the SEC
Fiscal Year FY 2008 FY 2009 FY 2010 FY 2011 FY 2012 FY 2013 Actual
Number of criminal investigations Prior-year data not available
139 134 126 126
Responsible DivisionOffice Division of Enforcement
Data Source HUB case management and tracking system for the Division of Enforcement
PERFORMANCE INDICATOR (OUTPUT) 235 Disgorgement and penalties ordered and the amounts collected
Description In addition to other types of relief the SEC may seek orders requiring parties to disgorge any money obtained through wrongdoing The SEC is also empowered to seek civil penalties for violations of the securities laws In some cases the SEC will seek to obtain large monetary sanctions even in instances where the prospects of collecting on a judgment are slight The rationale for seeking monetary relief in these circumstances is that such relief even when likely uncollectible might become collectible in the future based on the defendantrsquos changed circumstances and also because such relief can serve to deter others from violating the securities laws Where appropriate the SEC has sought to return disgorged funds to harmed investors Funds not returned to investors are sent to the Treasury or the Investor Protection Fund established pursuant to Section 21F(g) of the Securities Exchange Act of 1934 This indicator lists disgorgement and penalties ordered as a result of SEC cases and the amounts collected in those actions This indicator could increase or decrease based on various factors
Fiscal Year FY 2008 FY 2009 FY 2010 FY 2011 FY 2012 FY 2013 Actual
Ordered amounts (in millions) 1030 2442 2846 2806 3104 3424
Collected amounts (in millions) 521 1694 1775 1281 1048 1603
Responsible DivisionOffice Division of Enforcement
Data Source DELPHI
36
FY 2015 CBJ FY 2015 APP AND FY 2013 APR bull FY 2015 ANNUAL PERFORMANCE PLAN
FY 2015 ANNUAL PERFORMANCE PLAN bull FY 2015 CBJ FY 2015 APP AND FY 2013 APR
Strategic Goal 3 Facilitate Access to the Information Investors Need to Make Informed Investment Decisions
The agency is requesting in FY 2015 a total of $2226 million and 651 FTEs towards achieving results in Strategic Goal 3
Budgeting for the Future (FY 2015)
An educated investing public ultimately provides the best defense against fraud and costly mistakes The federal securities laws place great emphasis on assuring that corporations investments companies and other entities provide investors with timely clear complete and accurate financial and non-financial information allowing investors to make wise investment decisions As part of its disclosure program CF and IM will continue in FY 2015 to meet the requirements of the Sarbanes-Oxley Act (Performance Goal 311) Accordingly CF and IM strive to review disclosures made by certain public issuers including issuersrsquo financial statements no less frequently than once every three years Additionally CF staff will strive to issue comments on a timely basis allowing companies seeking to raise capital by building offering schedules around the 30-day standard (Performance Goal 312) and IM will aim to exceed timeliness targets for
reviewing investment company disclosures (Performance Goal 313) Also in FY 2015 CF will continue to improve the quality of information provided to investors by focusing on disclosure by companies of the information most material to investment decision-making
OIEA responds to investment-related complaints and questions from tens of thousands of investors each year In FY 2015 staff is expected to close approximately 60 percent of complaints and inquiries within seven days and about 90 percent within 30 days (Performance Goal 322) The seven-day target has been adjusted to reflect new workload demands In FY 2015 OIEA will continue to refine internal processes and promote staff training to resolve matters OIEA expects to increase of the number of visitors to its investor education web pages by using social media technologies and partnering with the SECrsquos regional offices other federal and state agencies financial industry associations consumer groups and educational organizations on investor education programs OIEA also will continue to participate in a significant number of in-person outreach events in FY 2015 (Performance Goal 321)
Strategic Objective 31 The SEC works to ensure that investors have access to high-quality disclosure materials that facilitate informed investment decision-making
Goal Leader(s) Director Division of Trading and Markets Director Division of Corporation Finance Director Division of Investment Management
PERFORMANCE GOAL 311 Percentage of public companies and investment companies with disclosures reviewed each year
Description The Sarbanes-Oxley Act requires that the SEC review at least once every three years the disclosures of all companies and investment company portfolios reporting under the Exchange Act These reviews help improve the information available to investors and may identify possible violations of the federal securities laws This metric gauges the number of public companies and investment companies reviewed each year
FY 2013 FY 2013 FY 2014 FY 2015 Fiscal Year FY 2008 FY 2009 FY 2010 FY 2011 FY 2012 Plan Actual Estimate Request
Division of Corporation Finance
Corporations 39 40 44 48 48 33 52 33 33
Responsible DivisionOffice Division of Corporation Finance
Data Source Electronic Data Gathering Analysis and Retrieval (EDGAR)Filing Activity Tracking System (FACTS)
Division of Investment Management
Investment Company Portfolios 36 35 35 33 36 33 34 33 33
Responsible DivisionOffice Division of Investment Management
Data Source Microsoft Office Suite Tools
37
FY 2015 CBJ FY 2015 APP AND FY 2013 APR bull FY 2015 ANNUAL PERFORMANCE PLAN
PERFORMANCE GOAL 312 Time to issue initial comments on Securities Act filings
Description The target of 30 days or less has become a de facto industry standard for the maximum time to receive initial comments
FY 2013 FY 2013 FY 2014 FY 2015 Fiscal Year FY 2008 FY 2009 FY 2010 FY 2011 FY 2012 Plan Actual Estimate Request
Days 252 253 241 244 249 lt30 256 lt30 lt30 days days days days days days days days days
Responsible DivisionOffice Division of Corporation Finance
Data Source FACTS
PERFORMANCE GOAL 313 Percentage of investment company disclosure reviews for which initial comments are completed within timeliness goals
Description For initial registration statements the SECrsquos goal is to issue initial comments within 30 days after they are filed (60 days for registration statements of insurance product separate accounts and related mutual funds) The SEC also aims to comment on post-effective amendments within 45 days and preliminary proxy statements within 10 days after they are filed
FY 2013 FY 2013 FY 2014 FY 2015 Fiscal Year FY 2008 FY 2009 FY 2010 FY 2011 FY 2012 Plan Actual Estimate Request
Initial registration statements 95 95 93 92 96 85 98 85 85
Post-effective amendments 97 97 94 94 95 90 99 90 90
Preliminary proxy statements 99 99 99 98 100 99 98 99 99
Responsible DivisionOffice Division of Investment Management
Data Source Electronic Data Gathering Analysis and Retrieval (EDGAR)
PERFORMANCE INDICATOR (CONTEXTUAL) 311 Total digital audience including website social media and mobile media
Description Digital media has become the dominant channel for investors seeking to access information These statistics will help evaluate the extent to which investors are turning to the SEC identify the channels they use and quantify the amount of information they receive
FY 2013 Fiscal Year FY 2008 FY 2009 FY 2010 FY 2011 FY 2012 Actual
SECgov page views Prior-year data not available 372B
Social media followers 0 1608 83141 193837 236700 258733
Total emailmobile subscriptions Prior-year data not available 519602 631839 740318
Total email bulletins sent NA 875518 1280M 2397M 3344M 4085M
Total mobile bulletins sent NA 6001 62324 107848 150303 238815
Responsible DivisionOffice Office of Public Affairs
Data Source Akamai Technologies Google Analytics GovDelivery Hootsuite Social Media Channels
38
rsquo
FY 2015 ANNUAL PERFORMANCE PLAN bull FY 2015 CBJ FY 2015 APP AND FY 2013 APR
Strategic Objective 32 The SEC works to understand investor needs and educate investors so they are better prepared to make informed investment decisions
Goal Leader(s) Director Office of Investor Education and Advocacy
PERFORMANCE GOAL 321 Number of page views of online investor education content and number of in-person events
including those with specifically targeted communities and organizations
Description The Office of Investor Education and Advocacy (OIEA) initiates investor education campaigns on key strategies for making informed investment decisions including publicizing online resources for researching investment professionals and investments understanding fees and identifying fraud OIEA staff also participates in in-person events for investors generally and those targeted to specific investors such as seniors service members and other affinity groups This metric tracks page views of SEC online investor education materials and the number of investor events in which OIEA staff participated
FY 2013 FY 2013 FY 2014 FY 2015 Fiscal Year FY 2008 FY 2009 FY 2010 FY 2011 FY 2012 Plan Actual Estimate Request
Number of page views Prior-year data not available 15 121 15 20
Number of ldquoin-personrdquo events Prior-year data not available 50 52 50 50
Responsible DivisionOffice Office of Investor Education and Advocacy
Data Source Microsoft Office Suite Tools
PERFORMANCE GOAL 322 Timeliness of responses to investor contacts
Description OIEA serves the tens of thousands of investors each year who contact the SEC with investment-related complaints and questions The staff aims to close out as many new investor assistance matters as possible within seven and thirty business days
FY 2013 FY 2013 FY 2014 FY 2015 Fiscal Year FY 2008 FY 2009 FY 2010 FY 2011 FY 2012 Plan Actual Estimate Request
Closed within 7 days 78 70 72 67 54 50 62 60 60
Closed within 30 days 88 90 93 92 93 90 93 90 90
Responsible DivisionOffice Office of Investor Education and Advocacy
Data Source Internal log using IRIS data
PERFORMANCE GOAL 323 Customer satisfaction rating of OIEA s online investor education resources
Description This metric gauges the effectiveness helpfulness and usability of OIEArsquos online investor education resources
FY 2013 FY 2013 FY 2014 FY 2015 Fiscal Year FY 2008 FY 2009 FY 2010 FY 2011 FY 2012 Plan Actual Estimate Request
Satisfaction index Benchmark Benchmark score for score for
Prior-year data not available NA 81 federal federal government government
websites websites
Responsible DivisionOffice Office of Investor Education and Advocacy
Data Source ForeSee results online portal
39
FY 2015 CBJ FY 2015 APP AND FY 2013 APR bull FY 2015 ANNUAL PERFORMANCE PLAN
PERFORMANCE GOAL 324 Number of new investor education materials designed specifically to help investors protect themselves from fraud
Description Through OIEA and often in conjunction with other organizations the staff issues Investor Alerts and other forms of educational material that inform investors about different permutations of fraud new investment products and other topical issues This metric measures the number of new investor education materials issued by OIEA
FY 2013 FY 2013 FY 2014 FY 2015 Fiscal Year FY 2008 FY 2009 FY 2010 FY 2011 FY 2012 Plan Actual Estimate Request
Number of education materials Prior-year data 16 24 24 26 26 26
not available
Responsible DivisionOffice Office of Investor Education and Advocacy
Data Source wwwsecgov and wwwinvestorgov
PERFORMANCE INDICATOR (PROCESS) 321 Number of investor testing research projects
Description This indicator tracks the number of research initiatives used to gather feedback from investors on the usefulness of disclosures and other input on SEC rulemaking
FY 2013 Fiscal Year FY 2008 FY 2009 FY 2010 FY 2011 FY 2012 Actual
Number of projects 1 0 0 2 2
Responsible DivisionOffice Office of Investor Education and Advocacy
Data Source Microsoft Office Suite Tools
PERFORMANCE INDICATOR (PROCESS) 322 Number of sets of recommendations prepared by the investor advisor y committee
Description This indicator tracks the recommendations from the Investor Advisory Committee regarding investorsrsquo perspectives and priorities
FY 2013 Fiscal Year FY 2008 FY 2009 FY 2010 FY 2011 FY 2012 Actual
Number of sets of recommendations Prior-year data not available 0 4
Responsible DivisionOffice Office of Investor Education and Advocacy
Data Source wwwsecgov
26
0
40
Strategic Goal 4 Enhance the Commissionrsquos Performance through Effective Alignment and Management of Human Information and Financial Capital During FY 2015 the agency will continue to focus on recruiting and retaining high-performing staff and updating the expertise of SEC employees so they are abreast of the latest developments in the securities markets Furthermore the SEC will continue to strengthen internal controls The agency is requesting a total of $3599 million and 867 FTEs in FY 2015 to achieve results in Strategic Goal 4
Budgeting for the Future (FY 2015)
The investing public and the securities markets are best served by an efficient effective and agile SEC In FY 2015 the agency will continue to take steps to become a more effective regulator of the US financial markets by making sound investments in human capital and new technologies and enhancing internal controls
The planned investment in the SEC University for FY 2015 principally supports training and development for employees directly involved in examinations investigations fraud detection litigation and other core mission responsibilities of the agency The SEC University will provide specialized in-depth training concerning changing market conditions analytics and forensics and the agencyrsquos new responsibility areas The investment also will fund employees for certain specialized financial certifications and regulatory credentials as well as the advanced continuing education required for maintaining legal and financial credentials
To maintain mission effectiveness it is essential that attrition in the leadership ranks is quickly addressed by having a highly qualified and diverse pool of candidates ready to assume those
critical roles (Performance Goal 415) The Office of Human Resourcesrsquo (OHR) Workforce Planning has completed building the foundational database necessary to conduct succession planning A subset of this team has begun benchmarking succession planning approaches used by other Federal agencies and will develop and implement a program at the SEC by the end of FY 2014 The first measure is expected by September 30 2014
Leveraging modern reliable and innovative technologies together with predictive analytics will transform the way the SEC performs its mission and provide a proactive view into how technology impacts capital markets The SEC will derive significant and measurable performance improvements in core operations and increase value for users through the use of automated enterprise processes
The continuing implementation of OITrsquos Technology Transformation Plan (ldquoWorking Smarterrdquo) in FY 2015 will support vital technology initiatives It will ensure the SECrsquos business processes are streamlined integrated and implemented using the best technology available
While the SEC has made significant strides in its multi-year path towards a strong sustainable internal control posture the agency will continue to dedicate its energies towards remediating the significant deficiency in information security During FY 2015 OFM will work closely with the Department of Transportationrsquos Federal Shared Services Provider (FSSP) to implement its software upgrade and refine the new Federal government-wide travel management system
41
FY 2015 ANNUAL PERFORMANCE PLAN bull FY 2015 CBJ FY 2015 APP AND FY 2013 APR
FY 2015 CBJ FY 2015 APP AND FY 2013 APR bull FY 2015 ANNUAL PERFORMANCE PLAN
Strategic Objective 41 The SEC promotes a results-oriented work environment that attracts engages and retains a technically proficient and diverse workforce including leaders who provide motivation and strategic direction
Goal Leader(s) Director Office of Human Resources Director Office of Minority and Women Inclusion
PERFORMANCE GOAL 411 Turnover
Description When employee morale and engagement are high high-performing employees tend to remain in the organization Although turnover can fluctuate based on a variety of factors the SEC aims to keep its turnover rate relatively low below 8 per year
FY 2013 FY 2013 FY 2014 FY 2015 Fiscal Year FY 2008 FY 2009 FY 2010 FY 2011 FY 2012 Plan Actual Estimate Request
Percent turnover 62 37 5 64 658 lt8 658 lt8 lt8
Responsible DivisionOffice Office of Human Resources
Data Source The National Business Center at Department of Interior (DOI)
PERFORMANCE GOAL 412 Expanding staff expertise
Description Internal training and hiring programs are designed to help the agency recruit and develop a diverse and qualified staff with the key skills industry knowledge and expertise to support the SEC mission In particular there is a need to train examiners attorneys economists and other experts for subject matter expertise relevant to the marketplace and investment and trading practices This metric tracks whether certain areas requiring significant training are being addressed The agency will track the number of SEC staff participants in mission-focused training and development programs and will report on specific items through the use of post-course evaluations to assess the impact and results of this training on a five-point scale
FY 2013 FY 2013 FY 2014 FY 2015 Fiscal Year FY 2008 FY 2009 FY 2010 FY 2011 FY 2012 Plan Actual Estimate Request
Mission-focused training attendance Prior year data not available NA NA 12000 12120
Post-course evaluations of mission-Prior year data not available NA NA 45 45
focused training
Responsible DivisionOffice Office of Human Resources
Data Source Course Attendance Identified in LEAP (Instructor-led courses only) and End of Course Evaluation Report Summary provided by Metrics that Matter
PERFORMANCE GOAL 413 Number of diversity-related partnershipsalliances
Description Increased numbers of diversity-related partnerships or alliances with professional associations and educational organizations provide opportunities to educate students about the SECrsquos work and to recruit career professionals from all segments of society The SEC will track the number of partnerships andor alliances with diverse professional associations and educational organizations
FY 2013 FY 2013 FY 2014 FY 2015 Fiscal Year FY 2008 FY 2009 FY 2010 FY 2011 FY 2012 Plan Actual Estimate Request
Number of partnershipsalliances Prior-year data 2 10 12 15 13 15
not available
Responsible DivisionOffice Office of Minority Women and Inclusion
Data Source Office of Minority Women and Inclusion Internal Records and Section 342 of DFA
15
42
FY 2015 ANNUAL PERFORMANCE PLAN bull FY 2015 CBJ FY 2015 APP AND FY 2013 APR
PERFORMANCE GOAL 414 Sur vey rankings
Description Annual and other rankings together with other metrics and indicators of federal government agencies will be used as one kind of metric to determine the SECrsquos overall success in improving employee morale and employee engagement
FY 2013 FY 2013 FY 2014 FY 2015 Fiscal Year FY 2008 FY 2009 FY 2010 FY 2011 FY 2012 Plan Actual Estimate Request
Best Places to Work ranking Ranked Ranked Ranked Ranked Ranked Ranked Ranked Ranked Ranked 3 11 24 27 19 20 15 5 5
Average of employee engagement Prior-year data not available NA 61 75 75
and global satisfaction index
Responsible DivisionOffice Office of Human Resources
Data Source Annual Partnership for Public Service calculated ranking based on Annual Employee Viewpoint Survey (EVS) administered by OPM and Average of Employee Engagement and Global Satisfaction Index from OPM Employee Viewpoint Survey (EVS)
PERFORMANCE GOAL 415 Bench strength
Description To maintain mission effectiveness it is essential that attrition in the leadership ranks is quickly addressed by having a highly qualified and diverse pool of candidates ready to assume those critical roles Success is measured by the percentage of key leadership positions for which the SEC has identified a pool of qualified candidates
FY 2013 FY 2013 FY 2014 FY 2015 Fiscal Year FY 2008 FY 2009 FY 2010 FY 2011 FY 2012 Plan Actual Estimate Request
Data point under development NA NA NA NA NA NA NA TBD TBD
Responsible DivisionOffice Office of Human Resources
Data Source TBD
Strategic Objective 42 The SEC encourages a collaborative environment across divisions and offices and leverages technology and data to fulfill its mission more effectively and efficiently
Goal Leader(s) Director Office of Information Technology
PERFORMANCE GOAL 421 Ensure SECrsquos systems and applications are available
Description The SEC aims to enhance its computing infrastructure to eliminate down time if systems at one site fail among other objectives This metric will capture the percentage of systems and applications that can fail over within 8 hours
FY 2013 FY 2013 FY 2014 FY 2015 Fiscal Year FY 2008 FY 2009 FY 2010 FY 2011 FY 2012 Plan Actual Estimate Request
Percentage of servers virtualized NA 12 22 38 79 85 93 94 95
Percentage fail over within 8 hours NA NA NA NA NA NA NA 100 100
Responsible DivisionOffice Office of Information Technology
Data Source OIT Network Operations Center (NOC) ndash automated network monitoring tools
43
FY 2015 CBJ FY 2015 APP AND FY 2013 APR bull FY 2015 ANNUAL PERFORMANCE PLAN
PERFORMANCE GOAL 422 Equip the SEC with an enhanced technology infrastructure to support enterprise infrastructure
Description The SEC aims to promote collaboration and information sharing across the enterprise To improve efficiency and knowledge management the SEC will consolidate and centralize its collaborative technologies to a commonly used enterprise set by 2020 This metric will measure the percentage of the SECrsquos offices and divisions that utilize centralized enterprise collaboration solutions
FY 2013 FY 2013 FY 2014 FY 2015 Fiscal Year FY 2008 FY 2009 FY 2010 FY 2011 FY 2012 Plan Actual Estimate Request
Number of enterprise solutions Prior-year data not 10 20 25 30 30 35 40
available
Responsible DivisionOffice Office of Information Technology
Data Source Approved software applications list
PERFORMANCE GOAL 423 Expand the SECrsquos video teleconferencing (VTC) capabilities to support an increasingly geographically dispersed workforce
Description The SEC seeks to develop a state of the art video teleconference solution that allows users to conduct a videoteleconference meeting between HQ regional offices and multiple endpoints simultaneously collaborate and share presentation materials and use VoIP technology to host video teleconferences from their officesworkspaces with other SEC users or conference rooms This metric will measure the average ldquouptimerdquo or availability of all VTC systems
FY 2013 FY 2013 FY 2014 FY 2015 Fiscal Year FY 2008 FY 2009 FY 2010 FY 2011 FY 2012 Plan Actual Estimate Request
Availability rate for VTC solutions Prior-year data not available 75 80 9999 9999
Responsible DivisionOffice Office of Information Technology
Data Source Telecommunications monitoring system
PERFORMANCE GOAL 424 Pursue continuous technology cost reductions and efficiencies
Description Recent technology enhancements ndash eg data center consolidation virtualization and maintenance contract reductions ndash are producing technical efficiencies and cost savings This metric will measure the amount of these costs savings
FY 2013 FY 2013 FY 2014 FY 2015 Fiscal Year FY 2008 FY 2009 FY 2010 FY 2011 FY 2012 Plan Actual Estimate Request
Percent reduction in operational run 1-3 187 1 2 cost leveraging technology and cost cost reduction reduction process efficiencies
Prior-year data not available reduction in steady
reduction in steady
in run costs
in run costs
state run state run costs costs1
Responsible DivisionOffice Office of Information Technology
Data Source OIT Network Operations Center (NOC)
The higher than expected FY 2013 actual of 187 percent is due to one-time technologies enhancements resulting from the data consolidation and virtualization 1
44
FY 2015 ANNUAL PERFORMANCE PLAN bull FY 2015 CBJ FY 2015 APP AND FY 2013 APR
PERFORMANCE GOAL 425 Enhance the SECrsquos enterprise data warehouse infrastructure and performance
Description The Enterprise Data Warehouse (EDW) infrastructure will enable the provisioning of data to Commission staff for search and analysis through a virtual data warehouse platform This metric will measure the availability of EDW and data sources
FY 2013 FY 2013 FY 2014 FY 2015 Fiscal Year FY 2008 FY 2009 FY 2010 FY 2011 FY 2012 Plan Actual Estimate Request
Availability rate for the EDW infrastructure components in Prior-year data not available NA NA 99 99 production
Responsible DivisionOffice Office of Information Technology
Data Source OIT Network Operations Center (NOC) ndash automated network monitoring tools
Strategic Objective 43 The SEC maximizes the use of agency resources by continually improving agency operations and bolstering internal controls
Goal Leader(s) Chief Financial Officer Chief Operations Officer
PERFORMANCE GOAL 431 Financial audit results
Description Under the Accountability of Taxpayer Dollars Act of 2002 the agency is required to meet all proprietary and budgetary accounting guidelines for federal agencies and to undergo annual audits The SECrsquos audits are conducted by the Government Accountability Office
FY 2013 FY 2013 FY 2014 FY 2015 Fiscal Year FY 2008 FY 2009 FY 2010 FY 2011 FY 2012 Plan Actual Estimate Request
Unqualified opinion Yes Yes Yes Yes Yes Yes Yes Yes Yes
Material weaknesses 0 1 2 0 0 0 0 0 0
Significant deficiency 3 6 0 4 2 0 1 0 0
Responsible DivisionOffice Office of Financial Management
Data Source GAO SEC Financial Audit Report
PERFORMANCE GOAL 432 Assurance statement on internal control over operations
Description In accordance with OMB A-123 and Section 961 of the Dodd-Frank Act the SEC conducts an annual assessment of the effectiveness of internal controls The SEC will continue to develop its Operational Risk program and enhance cross-organizational processes to support all division and office management assurance statements Success is measured by the quality of risk and control assessments and management self-identification and resolution of improvement opportunities
FY 2013 FY 2013 FY 2014 FY 2015 Fiscal Year FY 2008 FY 2009 FY 2010 FY 2011 FY 2012 Plan Actual Estimate Request
Unqualified opinion Yes Yes Yes Yes Yes Yes Yes Yes Yes
Material weakness 0 0 0 0 0 0 0 0 0
Responsible DivisionOffice Office of the Chief Operating Officer
Data Source SEC Financial Audit Report
45
FY 2015 CBJ FY 2015 APP AND FY 2013 APR bull FY 2015 ANNUAL PERFORMANCE PLAN
1
PERFORMANCE GOAL 433 Timely completion of corrective action on Office of Inspector General (OIG) and the GAO audit recommendations1
Description Timely completion of audit recommendations is an important SEC priority This metric measures how well the Commission is doing in completing corrective action on OIG audit recommendations within established timeframes
FY 2013 FY 2013 FY 2014 FY 2015 Fiscal Year FY 2008 FY 2009 FY 2010 FY 2011 FY 2012 Plan Actual Estimate Request
OIG recommendations completed in Prior-year data not available NA 78 80 80
less than one year
Responsible DivisionOffice Office of the Chief Operating Officer
Data Source Audit Recommendation Tracking System
This measure was developed as part of the FY 2014-2018 SEC strategic planning process Currently there is no methodology in place to capture data for tracking all GAO Audit recommendations OCOO will determine a timeframe for establishing a methodology during FY 2014
46
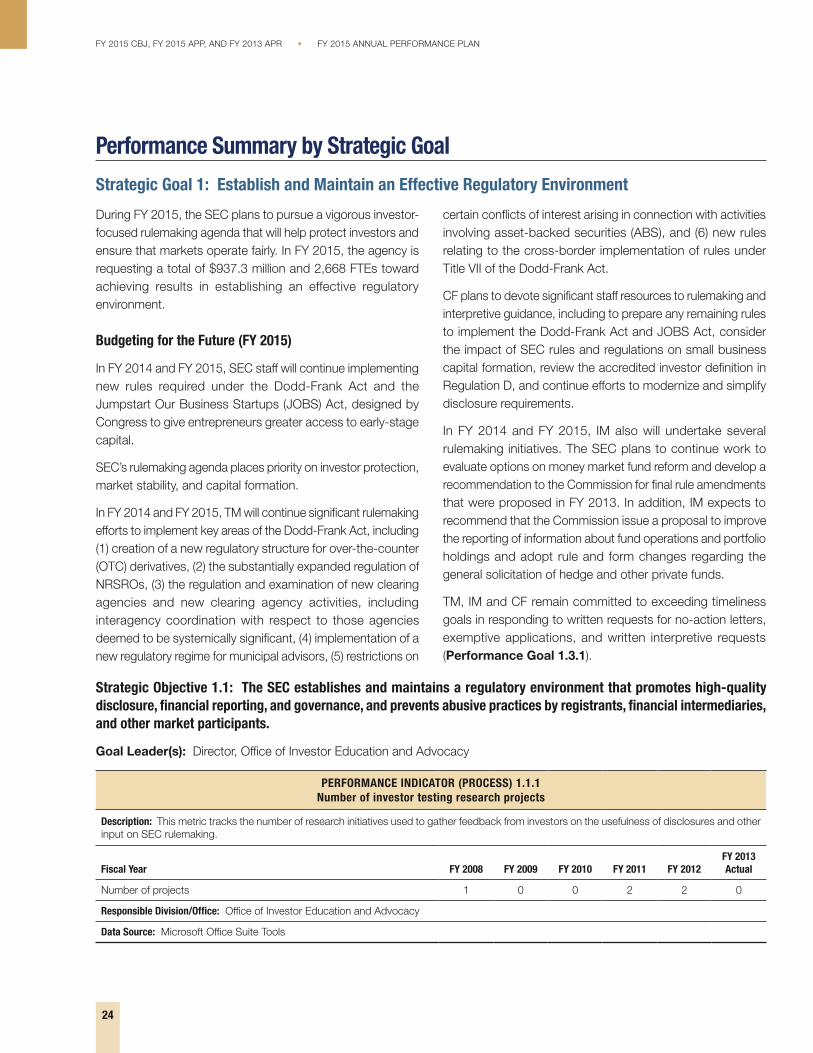
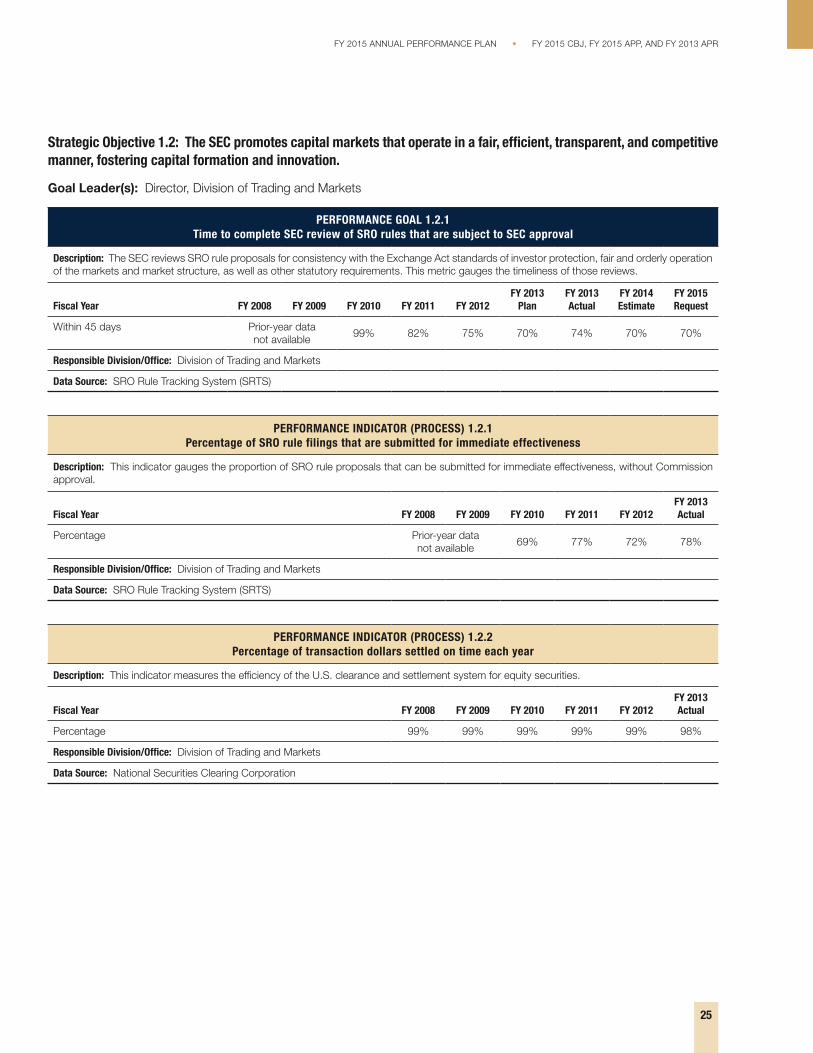
FY 2015 ANNUAL PERFORMANCE PLAN bull FY 2015 CBJ FY 2015 APP AND FY 2013 APR
Strategic Objective 12 The SEC promotes capital markets that operate in a fair efficient transparent and competitive manner fostering capital formation and innovation
Goal Leader(s) Director Division of Trading and Markets
PERFORMANCE GOAL 121 Time to complete SEC review of SRO rules that are subject to SEC approval
Description The SEC reviews SRO rule proposals for consistency with the Exchange Act standards of investor protection fair and orderly operation of the markets and market structure as well as other statutory requirements This metric gauges the timeliness of those reviews
FY 2013 FY 2013 FY 2014 FY 2015 Fiscal Year FY 2008 FY 2009 FY 2010 FY 2011 FY 2012 Plan Actual Estimate Request
Within 45 days Prior-year data 99 82 75 70 74 70 70
not available
Responsible DivisionOffice Division of Trading and Markets
Data Source SRO Rule Tracking System (SRTS)
PERFORMANCE INDICATOR (PROCESS) 121 Percentage of SRO rule filings that are submitted for immediate effectiveness
Description This indicator gauges the proportion of SRO rule proposals that can be submitted for immediate effectiveness without Commission approval
FY 2013 Fiscal Year FY 2008 FY 2009 FY 2010 FY 2011 FY 2012 Actual
Percentage Prior-year data 69 77 72 78
not available
Responsible DivisionOffice Division of Trading and Markets
Data Source SRO Rule Tracking System (SRTS)
PERFORMANCE INDICATOR (PROCESS) 122 Percentage of transaction dollars settled on time each year
Description This indicator measures the efficiency of the US clearance and settlement system for equity securities
FY 2013 Fiscal Year FY 2008 FY 2009 FY 2010 FY 2011 FY 2012 Actual
Percentage 99 99 99 99 99 98
Responsible DivisionOffice Division of Trading and Markets
Data Source National Securities Clearing Corporation
25
FY 2015 CBJ FY 2015 APP AND FY 2013 APR bull FY 2015 ANNUAL PERFORMANCE PLAN
PERFORMANCE INDICATOR (PROCESS) 123 Percentage of market outages at SROs and electronic communications networks (ECNs)
that are corrected within targeted timeframes
Description Market outages reflect problems in the systems underlying the securities markets that could have an adverse effect on the marketsrsquo ability to function as required The SEC assesses the reliability and resiliency of these systems to minimize the number and duration of outages This metric gauges how quickly outages are resolved so that market activity can resume
FY 2013 Fiscal Year FY 2008 FY 2009 FY 2010 FY 2011 FY 2012 Actual
Within 2 hours 84 87 74 88 71 80
Within 4 hours 96 98 85 94 89 86
Within 24 hours 100 98 100 100 100 98
Responsible DivisionOffice Division of Trading and Markets
Data Source ECN outage data is derived from SROs
Strategic Objective 13 The SEC adopts and administers regulations and rules that are informed by robust economic analysis and public comment and that enable market participants to understand their obligations under the securities laws
Goal Leader(s) Director Division of Trading and Markets Director Division of Corporation Finance Director Division of Investment Management
PERFORMANCE GOAL 131 Length of time to respond to written requests for no-action letters (NAL) exemptive applications and written interpretive requests
Description The SEC staff responds to requests for guidance from individuals and market participants about specific provisions of the federal securities laws These queries may seek interpretations of the securities laws or regulations or assurances that no enforcement action will be taken if the individual or market participant engages in a specified activity The staff also reviews applications for exemptions from the securities laws Written responses to such requests for guidance when provided generally are publicly available as are applications and related notices and orders when issued This metric gauges the timeliness of initial comments issued by the Divisions of Trading and Markets Investment Management and Corporation Finance
FY 2013 FY 2013 FY 2014 FY 2015 Fiscal Year FY 2008 FY 2009 FY 2010 FY 2011 FY 2012 Plan Actual Estimate Request
Trading and Markets No-action letters exemptive applications and written interpretive requests (combined figure)
Percentage within required timeframe 63 70 91 985 89 85 93 85 85
Responsible DivisionOffice Division of Corporation Finance
Data Source TM Request Tracking Log
Investment Management
No-action letters and interpretive 98 100 100 100 100 90 100 90 90
requests
Exemptive applications 81 95 100 100 100 80 99 80 80
Responsible DivisionOffice Division of Investment Management
Data Source OCC Letter Log OICR and OIP Applications Tracking Systems (Access) Excel spreadsheet
Corporation Finance
No-action letters and interpretive 66 85 97 97 98 90 98 90 90
requests
Shareholder proposals 100 100 100 100 100 100 100 100 100
Responsible DivisionOffice Division of Corporation Finance
Data Source Division No-Action Letter database and Division Shareholder Proposal database
26
FY 2015 ANNUAL PERFORMANCE PLAN bull FY 2015 CBJ FY 2015 APP AND FY 2013 APR
PERFORMANCE GOAL 132 Timeliness of responses to requests for informal guidance received by the Trading and Markets dedicated hotline or email box
Description The Division of Trading and Markets maintains a dedicated phone line and an email account to provide market participants with avenues to request information and informal guidance regarding the Exchange Act and rules thereunder This metric will reflect the timeliness of the staffrsquos responses to these requests
FY 2013 FY 2013 FY 2014 FY 2015 Fiscal Year FY 2008 FY 2009 FY 2010 FY 2011 FY 2012 Plan Actual Estimate Request
Respond to or refer inquiries within Prior-year data not available NA NA 95 95
2 weeks
Responsible DivisionOffice Division of Trading and Markets
Data Source Division of Trading and Markets Office of Interpretation and Guidance (OIG) Log and email box
PERFORMANCE INDICATOR (CONTEXTUAL) 131 Number of published economic reports
Description This indicator gauges the number of economic reports that staff of the Division of Economic and Risk Analysis publishes annually on the SECrsquos website
FY 2013 Fiscal Year FY 2008 FY 2009 FY 2010 FY 2011 FY 2012 Actual
Number of reports NA NA NA NA NA
Responsible DivisionOffice Division of Economic Research and Analysis
Data Source DERA economists produce research for publication in leading academic journals including the top accounting and finance journals such as the Journal of Accounting and Economics the Journal of Financial Economics and the Review of Financial Studies DERArsquos site on SEC gov includes citations of all published and forthcoming research written by DERA staff
PERFORMANCE INDICATOR (PROCESS) 132 Number of amendments to national securities exchange registrations (Form 1)
Description This indicator provides information about the volume of material filed with the SEC that involves amendments to exchange registrations
FY 2013 Fiscal Year FY 2008 FY 2009 FY 2010 FY 2011 FY 2012 Actual
Number of amendments Prior-year data not available NA
Responsible DivisionOffice Division of Trading and Markets
Data Source Manual spreadsheets
PERFORMANCE INDICATOR (PROCESS) 133 Number of Alternative Trading System registrations (Form ATS)
Description This indicator provides information about the volume of material filed with the SEC that involves filings related to ATS registrations
FY 2013 Fiscal Year FY 2008 FY 2009 FY 2010 FY 2011 FY 2012 Actual
Number of registrations Prior-year data not available NA
Responsible DivisionOffice Division of Trading and Markets
Data Source Manual spreadsheets
11
27
FY 2015 CBJ FY 2015 APP AND FY 2013 APR bull FY 2015 ANNUAL PERFORMANCE PLAN
PERFORMANCE INDICATOR (PROCESS) 134 Number of new investment product submissions
Description This indicator provides information about the volume of material filed with the SEC that involves new product submissions pursuant to Rule 19b-4(e) of the Exchange Act
FY 2013 Fiscal Year FY 2008 FY 2009 FY 2010 FY 2011 FY 2012 Actual
Number of submissions Prior-year data not available NA
Responsible DivisionOffice Division of Trading and Markets
Data Source Manual spreadsheets
Strategic Objective 14 The SEC engages with a multitude of stakeholders to inform and enhance regulatory activities domestically and internationally
Goal Leader(s) Director Office of International Affairs
PERFORMANCE GOAL 141 Super visory cooperation requests from foreign authorities for SEC assistance and SEC requests for assistance on supervisory cooperation from foreign authorities
Description The SEC makes requests to foreign authorities for supervisory cooperation assistance and responds to such requests from foreign regulators through both formal mechanisms such as supervisory memoranda of understanding and on an ad hoc basis
FY 2013 FY 2013 FY 2014 FY 2015 Fiscal Year FY 2008 FY 2009 FY 2010 FY 2011 FY 2012 Plan Actual Estimate Request
Supervisory cooperation requests Prior-year data not available NA 118 NA NA
from foreign authorities
SEC requests for assistance on supervisory cooperation from Prior-year data not available NA 25 NA NA foreign authorities
Responsible DivisionOffice Office of International Affairs
Data Source International Program Oversight Database and Business Objects reports
PERFORMANCE GOAL 142 Number of non-US regulators trained
Description This metric shows the reach of the SECrsquos technical assistance programs for regulators around the world The SEC conducts these training sessions to assist countries in developing and maintaining robust protections for investors and promoting cross-border enforcement and supervisory assistance
FY 2013 FY 2013 FY 2014 FY 2015 Fiscal Year FY 2008 FY 2009 FY 2010 FY 2011 FY 2012 Plan Actual Estimate Request
Number of non-US regulators Prior-year data not 1997 1765 1785 1370 1716 1400 1400
available
Responsible DivisionOffice Office of International Affairs
Data Source International Program Oversight Database and Business Objects reports
28
Strategic Goal 2 Foster and Enforce Compliance with the Federal Securities Laws
In FY 2015 the agency is requesting a total of 502 FTE for Goal 2 The additional resources will allow the SEC to continue building out the agencyrsquos new responsibility areas and begin addressing the disparity between the number of exam staff and the growing number and complexity of registered firms Additionally the Commission will be able to take prompt action to halt misconduct sanction wrongdoers effectively and return funds to harmed investors In all the agency plans to devote approximately $1802 million to enforcing compliance with the federal securities laws
Budgeting for the Future (FY 2015)
In FY 2015 the SEC will continue to make improvements to its National Examination and Enforcement programs These improvements include hiring staff with new skill sets enhancing their technologies streamlining processes expanding the SECrsquos training programs improving the processing of the thousands of tips the agency receives annually and improving risk assessment techniques These and other significant efforts contribute to the agencyrsquos objective of creating an enduring structure for improved protection of investors and markets
In FY 2015 the National Examination program will continue its focus on high-risk entities and activities Additional staff will among other things improve risk assessment and surveillance functions and continue to address the disparity between the number of staff and the size and complexity of regulated entities The staff will perform targeted sweep and cause examinations including examinations over new or expanded areas of the agencyrsquos jurisdiction
The Enforcement program plans to build on significant changes implemented in prior fiscal years and will work to meet new challenges expected in FY 2015 In order to effectively meet these challenges the Enforcement program is aggressively adopting new methods initiatives and organizational reforms to ensure the best possible use of available resources to strengthen investor confidence in the US financial markets and to send a strong message of deterrence to would-be violators of the securities laws
To improve the quality and efficiency of its investigations the SEC has put seasoned investigators on the front lines created specialized units focused on specific programmatic priorities enhanced case management systems and increased coordination efforts with other offices and divisions in the agency and other regulators In FY 2015 the SEC plans to obtain relief on one or more claims from approximately 92 percent of enforcement actions (Performance Goal 231) The SEC has implemented controls and strategies to resolve actions on a favorable basis while at the same time it will not hesitate to file matters on a contested basis where a favorable settlement was unavailable before filing The agency also plans to reduce in FY 2015 the average number months between the opening of an investigation and the commencement of an enforcement action arising out of that investigation (Performance Goal 233)
Under the Sarbanes-Oxley Act of 2002 the SEC can use Fair Funds to redirect penalties collected from securities law violators to the victims of their wrongdoing The SEC is committed to the timely collection and distribution of penalties and disgorgement funds and has adopted a variety of new measures for monitoring its progress (Performance Goal 235)
29
FY 2015 ANNUAL PERFORMANCE PLAN bull FY 2015 CBJ FY 2015 APP AND FY 2013 APR
FY 2015 CBJ FY 2015 APP AND FY 2013 APR bull FY 2015 ANNUAL PERFORMANCE PLAN
Strategic Objective 21 The SEC fosters compliance with the federal securities laws
Goal Leader(s) Director Office of Compliance Inspections and Examinations
PERFORMANCE GOAL 211 Number of industr y outreach and education programs targeted to areas identified as raising particular compliance risks
Description Targeted communication with industry participants on topics shaping the examination program is intended to enhance compliance practices and prevent violations before they occur This metric identifies the number of major outreach efforts conducted including the SECrsquos national and regional compliance outreach events published risk alerts and other educational programs and initiatives
FY 2013 FY 2013 FY 2014 FY 2015 Fiscal Year FY 2008 FY 2009 FY 2010 FY 2011 FY 2012 Plan Actual Estimate Request
Number of major outreach efforts Prior-year data 6 5 12 14 15 16
not available
Responsible DivisionOffice Office of Compliance Inspections and Examinations
Data Source Internal tracking although the events noted above are referenced in the SECrsquos website
PERFORMANCE GOAL 212 Percentage of firms receiving deficiency letters that take corrective action in response to all exam findings
Description At the conclusion of examinations the staff communicates identified deficiencies to registrants in the form of a deficiency letter Registrants are then given a chance to respond to staff findings and often take action to remedy any problems and potential risks including monetary compensation to clients and enhancements to disclosures policies and procedures Most often registrants respond that they have corrected the deficiencies and implemented measures to prevent recurrence
FY 2013 FY 2013 FY 2014 FY 2015 Fiscal Year FY 2008 FY 2009 FY 2010 FY 2011 FY 2012 Plan Actual Estimate Request
Percentage 93 94 90 93 92 93 86 87 88
Responsible DivisionOffice Office of Compliance Inspections and Examinations
Data Source Tracking and Reporting Exam National Documentation System (TRENDS)
Strategic Objective 22 The SEC promptly detects and deters violations of the federal securities laws
Goal Leader(s) Director Office of Compliance Inspections and Examinations
PERFORMANCE GOAL 221 Percentage of investment advisers investment companies and broker-dealers examined during the year
Description This metric indicates the number of registrants examined by the SEC or an SRO as a percentage of the total number of registrants This metric includes all types of examinations risk priority examinations cause inspections to follow up on tips and complaints limited-scope special inspections to probe emerging risk areas oversight examinations of broker-dealers to test compliance and the quality of examinations by FINRA
FY 2013 FY 2013 FY 2014 FY 2015 Fiscal Year FY 2008 FY 2009 FY 2010 FY 2011 FY 2012 Plan Actual Estimate Request
Investment advisers 14 10 9 8 8 10 9 9 12
Investment companies 23 29 10 13 12 14 11 12 15
Broker-dealers (exams by SEC 57 54 44 58 49 50 46 48 50
and SROs)
Responsible DivisionOffice Office of Compliance Inspections and Examinations
Data Source Tracking and Reporting Exam National Documentation System (TRENDS) (IA IC and BD SEC data) and SRO Databases (BD SRO Data)
17
30
FY 2015 ANNUAL PERFORMANCE PLAN bull FY 2015 CBJ FY 2015 APP AND FY 2013 APR
PERFORMANCE GOAL 222 Percentage of compliance exams that are timely concluded in accordance with the Office of Compliance Inspections
and Examinationrsquos (OCIE) statutory deadline
Description The staff conducts examinations each year of registered entities including investment advisers investment company complexes transfer agents and broker-dealers The staff strives to complete its examinations and communicate findings in the most efficient and effective manner and within its statutory deadline This metric reflects the percentage of examinations concluded within the statutory deadline
FY 2013 FY 2013 FY 2014 FY 2015 Fiscal Year FY 2008 FY 2009 FY 2010 FY 2011 FY 2012 Plan Actual Estimate Request
Percentage Prior-year data NA NA NA 100 100 100 100
not available
Responsible DivisionOffice Office of Compliance Inspections and Examinations
Data Source Tracking and Reporting Exam National Documentation System (TRENDS)
PERFORMANCE GOAL 223 Number of joint exams information sharing agreements and formal meetings with other regulators
Description The SEC attempts to coordinate and collaborate with other regulators on areas of mutual interest This helps to ensure that all regulators are informed of on-going risks and issues related to broad market practices as well as specific entities of mutual interest This cooperation is critical to the exam program to ensure that certain higher risk firms and activities are addressed in the most efficient and effective manner This metric tracks critical cooperation activities that are occurring between the SECrsquos exam program and other regulators
FY 2013 FY 2013 FY 2014 FY 2015 Fiscal Year FY 2008 FY 2009 FY 2010 FY 2011 FY 2012 Plan Actual Estimate Request
Number of joint exams active sharing Prior-year data not available NA NA 85 100
agreements and formal meetings
Responsible DivisionOffice Office of Compliance Inspections and Examinations
Data Source Various (including internal tracking and TRENDS)
PERFORMANCE INDICATOR (CONTEXTUAL) 221 Percentage of exams that identify deficiencies the percentage that result in a ldquosignificant findingrdquo
and the percentage referred to the Division of Enforcement
Description Examiners find a wide range of deficiencies during examinations Some of the deficiencies are more technical in nature such as failing to include all information that is required to be in a record However other deficiencies may cause harm to customers or clients of a firm have a high potential to cause harm or reflect recidivist misconduct The latter deficiencies are among those categorized as ldquosignificantrdquo This indicator identifies the percentage of exams that identified deficiencies that resulted in significant deficiency findings and that were referred to Enforcement
FY 2013 Fiscal Year FY 2008 FY 2009 FY 2010 FY 2011 FY 2012 Actual
Percentage that identify deficiencies Prior-year data 72 82 80 80
not available
Percentage that result in a ldquosignificant findingrdquo Prior-year data 42 42 42 35
not available
Percentage referred to the Division of Enforcement Prior-year data not available 13
Responsible DivisionOffice Office of Compliance Inspections and Examinations
Data Source Tracking and Reporting Exam National Documentation System (TRENDS)
31
PERFORMANCE INDICATOR (OUTPUT) 222 Number of cause exams that result from tips complaints and referrals
Description Analysis of a tip can support the request for a cause exam This indicator would identify the number of SEC cause exams that result from tips collected through outreach efforts
Fiscal Year FY 2008 FY 2009 FY 2010 FY 2011 FY 2012 FY 2013 Actual
Number of cause exams Prior-year data not available
NA NA NA 222
Responsible DivisionOffice Office of Compliance Inspections and Examinations
Data Source Tracking and Reporting Exam National Documentation System (TRENDS)
PERFORMANCE INDICATOR (OUTPUT) 223 Number of rule-making initiatives assisted by the National Exam Program
Description The examination program interacts with registrants on a regular basis and this work provides critical feedback to ensuring effective and practical rulemaking and policy efforts This indicator tracks how frequently the examination program assists with rulemaking initiatives
Fiscal Year FY 2008 FY 2009 FY 2010 FY 2011 FY 2012 FY 2013 Actual
Number of rule-making initiatives assisted by the NEP Prior-year data not available NA
Responsible DivisionOffice Office of Compliance Inspections and Examinations
Data Source Internal tracking
PERFORMANCE INDICATOR (OUTPUT) 224 Number of investigations or inquiries originating from a tip or complaint
Description Analysis of a tip or complaint can result in the need for further enforcement investigation The indicator identifies the volume of SEC investigations that result from tips and complaints received by the SEC
Fiscal Year FY 2008 FY 2009 FY 2010 FY 2011 FY 2012 FY 2013 Actual
Number of investigations Prior-year data not available
303 349 296 289
Responsible DivisionOffice Division of Enforcement
Data Source HUB case management and tracking system for the Division of Enforcement
PERFORMANCE INDICATOR (OUTPUT) 225 SEC investigations in which requests for access to information were granted by the SEC to other authorities
such as SROs or other state federal and foreign enforcement authorities
Description The SEC works closely with other regulators and authorities This measure identifies the number of investigations in which the SEC granted one or more authorities access to information concerning an investigation during the fiscal year This may include requests for access to SEC investigative files concerning investigations that the SEC continues to pursue as well as those in which the SEC has completed its investigation
Fiscal Year FY 2008 FY 2009 FY 2010 FY 2011 FY 2012 FY 2013 Actual
Number of investigations Prior-year data not available
492 586 515 504
Responsible DivisionOffice Division of Enforcement
Data Source HUB case management and tracking system for the Division of Enforcement
32
FY 2015 CBJ FY 2015 APP AND FY 2013 APR bull FY 2015 ANNUAL PERFORMANCE PLAN
FY 2015 ANNUAL PERFORMANCE PLAN bull FY 2015 CBJ FY 2015 APP AND FY 2013 APR
PERFORMANCE INDICATOR (OUTPUT) 226 Requests from foreign authorities for SEC assistance and SEC requests for assistance from foreign authorities
Description Each year the SEC makes hundreds of requests for enforcement assistance to foreign regulators while responding to hundreds of such requests from other nations To facilitate this type of assistance and encourage other countries to enact laws necessary to allow regulators to cooperate with their foreign counterparts the SEC has entered into bilateral information sharing arrangements as well as the Multilateral Memorandum of Understanding an information-sharing arrangement negotiated through the International Organization of Securities Commissions (IOSCO)
FY 2013 Fiscal Year FY 2008 FY 2009 FY 2010 FY 2011 FY 2012 Actual
Number of requests from foreign authorities 414 408 457 492 450
Number of SEC requests 594 774 605 772 718
Responsible DivisionOffice Office of International Affairs
Data Source International Program Oversight Database and Business Objects reports
Strategic Objective 23 The SEC prosecutes violations of federal securities laws and holds violators accountable through appropriate sanctions and remedies
Goal Leader(s) Director Division of Enforcement
PERFORMANCE GOAL 231 Percentage of enforcement actions in which the Commission obtained relief on one or more claims
Description This metric identifies as to all parties to enforcement actions that were resolved in the fiscal year the percentage against whom the Commission obtained a judgment or order entered on consent a default judgment a judgment of liability on one or more charges andor the imposition of monetary or other relief
FY 2013 FY 2013 FY 2014 FY 2015 Fiscal Year FY 2008 FY 2009 FY 2010 FY 2011 FY 2012 Plan Actual Estimate Request
Percentage 92 92 92 93 89 92 93 92 92
Responsible DivisionOffice Division of Enforcement
Data Source HUB case management and tracking system for the Division of Enforcement
PERFORMANCE GOAL 232 Percentage of first enforcement actions filed within two years of the opening of an investigation
Description This metric concerns the pace of investigations that lead to the filing of enforcement actions Specifically this metric captures the rate at which the first enforcement action arising out of an investigation was filed within two years of the opening of the investigation If the investigation was preceded by a matter under inquiry the metric draws on the date of the opening of the matter under inquiry In conducting investigations the Enforcement program continually strives to balance the need for complete effective and fair investigations with the need to file enforcement actions in as timely a manner as possible
FY 2013 FY 2013 FY 2014 FY 2015 Fiscal Year FY 2008 FY 2009 FY 2010 FY 2011 FY 2012 Plan Actual Estimate Request
Percentage 62 70 67 61 63 65 58 65 65
Responsible DivisionOffice Division of Enforcement
Data Source HUB case management and tracking system for the Division of Enforcement
508
717
33
FY 2015 CBJ FY 2015 APP AND FY 2013 APR bull FY 2015 ANNUAL PERFORMANCE PLAN
PERFORMANCE GOAL 233 Average months between opening a matter under inquiry or an investigation and commencing an enforcement action
Description This metric captures the average number of months between the opening of an investigation and the filing of the first enforcement action arising out of that investigation If the investigation was preceded by a matter under inquiry the metric draws on the date of opening of the matter inquiry In conducting investigations the enforcement program continually strives to balance the need for complete effective and fair investigation with the need to file enforcement actions in as timely a manner as possible While not all investigations result in the filing of enforcement actions this metric provides information concerning the pace of investigations that do lead to such actions and supplements the previous goal which measures the percentage of first enforcement actions filed within two years
FY 2013 FY 2013 FY 2014 FY 2015 Fiscal Year FY 2008 FY 2009 FY 2010 FY 2011 FY 2012 Plan Actual Estimate Request
Months Prior-year data not available 22 21 20 21 20 20
Responsible DivisionOffice Division of Enforcement
Data Source HUB case management and tracking system for the Division of Enforcement
PERFORMANCE GOAL 234 Percentage of debts where either a payment has been made or a collection activity has
been initiated within 180 days of the due date of the debt
Description The SEC can seek a wide range of remedies for failure to comply with the securities laws These remedies include civil monetary penalties and disgorgement When the remedies are imposed by the SEC or the Federal district court payments must be made by a certain date This metric identifies the percentage of debts where debtors have made payments or the SEC has initiated a collection activity within 180 days of the due date Such collection activities include among other things demand letters negotiation of payment plans enforcing the payment of the debt through the courts or other judicial remedies
FY 2013 FY 2013 FY 2014 FY 2015 Fiscal Year FY 2008 FY 2009 FY 2010 FY 2011 FY 2012 Plan Actual Estimate Request
Percentage 88 90 86 91 92 92 95 95 95
Responsible DivisionOffice Division of Enforcement
Data Source DELPHI
PERFORMANCE GOAL 235 Percentage of Fair Fund and disgorgement fund plans that have distributed 80 percent of the available
funds for distribution within twenty four (24) months of the approval of the distribution plan
Description In addition to other types of relief the SEC may seek orders requiring parties to disgorge any money obtained through wrongdoing The SEC also is empowered to seek civil penalties for violations of the securities laws Where appropriate the SEC has sought to return disgorged funds to harmed investors and as a result of the Fair Funds provisions of the Sarbanes-Oxley Act and the Dodd-Frank Act to combine amounts paid as penalties with disgorged funds or to create a Fair Fund from penalties only to reduce losses to injured parties and to maximize funds available for distribution This metric identifies the percentage of distribution plans that reached a critical mass during the fiscal year and within twenty four (24) months of the approval of the distribution plan The distribution plan includes the timeline and procedures required to return the funds to injured investors This reflects Commission-wide efforts to implement plans to return money to investors quickly Any funds not returned to investors are sent to the US Treasury or the Investor Protection Fund established pursuant to Section 21F(g) of the Securities Exchange Act of 1934 Neither disgorgement nor penalties are used for the SECrsquos own expenses
FY 2013 FY 2013 FY 2014 FY 2015 Fiscal Year FY 2008 FY 2009 FY 2010 FY 2011 FY 2012 Plan Actual Estimate Request
Percentage Prior-year data not available 80 80 73 78 82
Responsible DivisionOffice Division of Enforcement
Data Source HUB case management and tracking system for the Division of Enforcement and Distributions Management System
34
PERFORMANCE INDICATOR (CONTEXTUAL) 232 Total amount distributed within the fiscal year and the number of Fair Funds from which those distributions came
Description In its enforcement actions the SEC may seek to return funds to harmed investors through disgorgement of ill-gotten gains or through the Fair Funds provision of the Sarbanes-Oxley Act This provision permits the SEC to combine amounts paid as penalties with disgorged funds or to create a Fair Fund from penalties only to reduce losses to injured parties This reflects the SECrsquos efforts to return funds to injured investors This indicator identifies the total amount distributed within the fiscal year and the number of Fair Funds from which those distributions came This indicator may increase or decrease in dollar amount and number of distribution funds based on the number of SEC enforcement actions brought involving distributions amounts ordered and paid in those actions and other factors Due to the variation in reporting timelines established for each individual distribution reported amounts are based on the agencyrsquos best available information Reported amounts do not include those funds distributed through receiverships Any funds not returned to investors are sent to the US Treasury or the Investor Protection Fund established pursuant to Section 21F(g) of the Securities Exchange Act of 1934 Neither disgorgement nor penalties are used for the Commissionrsquos own expenses
Fiscal Year FY 2008 FY 2009 FY 2010 FY 2011 FY 2012 FY 2013 Actual
Amount distributed (in millions) Prior-year data not available 815 251
Number of Fair Funds Prior-year data not available 31 22
Responsible DivisionOffice Division of Enforcement
Data Source HUB case management and tracking system for the Division of Enforcement Distributions Management System
PERFORMANCE INDICATOR (CONTEXTUAL) 231 Percentage of filed enforcement actions reflecting characteristics that present enhanced risk to investors and markets as
measured by the nature of the investigation conduct parties and impact
Description This indicator assesses the quality of the cases filed by the Division of Enforcement The indicator focuses on cases filed by the SEC that involve factors reflecting enhanced risk to investors and markets Such cases may involve (i) those identified through risk analytics and cross-disciplinary initiatives to reveal difficult-to-detect or early stage misconduct thus minimizing investor loss and preventing the spread of unlawful conduct and practices (ii) particularly egregious or widespread misconduct and investor harm (iii) vulnerable victims (iv) a high degree of scienter (v) involvement of individuals occupying substantial positions of authority or having fiduciary obligations or other special responsibilities to investors (vi) involvement of recidivists (vii) high amount of investor loss prevented (viii) misconduct that is difficult to detect due to the complexity of products transactions and practices (ix) use of innovative investigative or analytical techniques (x) effective coordination with other law enforcement partners andor (xi) whether the matter involves markets transactions or practices identified as an enforcement priority or that advances the programmatic priorities of other SEC Divisions or Offices
Fiscal Year FY 2008 FY 2009 FY 2010 FY 2011 FY 2012 FY 2013 Actual
Percentage Prior-year data not available NA NA
Responsible DivisionOffice Division of Enforcement
Data Source HUB case management and tracking system for the Division of Enforcement
35
FY 2015 ANNUAL PERFORMANCE PLAN bull FY 2015 CBJ FY 2015 APP AND FY 2013 APR
PERFORMANCE INDICATOR (OUTPUT) 233 Percent of enforcement actions filed that arose out of national priority investigations
Description The Division of Enforcement conducts many enforcement actions each year that can be characterized as high impact and of national priority High impact or national priority investigations include those investigations which are significant for one or more of the following reasons ndashthe matter (i) presents an opportunity to send a particularly strong and effective message of deterrence including with respect to markets products and transactions that are newly developing or that are long established but which by their nature present limited opportunities to detect wrongdoing and thus to deter misconduct (ii) involves particularly egregious or extensive misconduct (iii) involves potentially widespread and extensive harm to investors (iv) involves misconduct by persons occupying positions of substantial authority or responsibility or who owe fiduciary or other enhanced duties and obligations to a broad group of investors or others (v) involves potential wrongdoing as prohibited under newly-enacted legislation or regulatory rules (vi) concerns potential misconduct that occurred in connection with products markets transactions or practices that pose particularly significant risks for investors or a systemically important sector of the market (vii) involves a substantial number of potential victims and or particularly vulnerable victims (viii) involves products markets transactions or practices that the Enforcement Division has identified as priority areas (ie conduct relating to the financial crisis fraud in connection with mortgage-related securities financial fraud involving public companies whose stock is widely held misconduct by investment advisers and matters involving priorities established by particular regional offices or the specialized units) andor (ix) provides an opportunity to pursue priority interests shared by other law enforcement agencies on a coordinated basis
Fiscal Year FY 2008 FY 2009 FY 2010 FY 2011 FY 2012 FY 2013 Actual
Percentage Prior-year data not available 10 20 15
Responsible DivisionOffice Division of Enforcement
Data Source HUB case management and tracking system for the Division of Enforcement
PERFORMANCE INDICATOR (CONTEXTUAL) 234 Criminal actions related to conduct under investigation by the SEC
Description In some instances conduct may involve both civil and criminal violations and may be investigated by both the SEC and the criminal authorities This indicator identifies the number of criminal actions that are related to conduct under investigation by the SEC
Fiscal Year FY 2008 FY 2009 FY 2010 FY 2011 FY 2012 FY 2013 Actual
Number of criminal investigations Prior-year data not available
139 134 126 126
Responsible DivisionOffice Division of Enforcement
Data Source HUB case management and tracking system for the Division of Enforcement
PERFORMANCE INDICATOR (OUTPUT) 235 Disgorgement and penalties ordered and the amounts collected
Description In addition to other types of relief the SEC may seek orders requiring parties to disgorge any money obtained through wrongdoing The SEC is also empowered to seek civil penalties for violations of the securities laws In some cases the SEC will seek to obtain large monetary sanctions even in instances where the prospects of collecting on a judgment are slight The rationale for seeking monetary relief in these circumstances is that such relief even when likely uncollectible might become collectible in the future based on the defendantrsquos changed circumstances and also because such relief can serve to deter others from violating the securities laws Where appropriate the SEC has sought to return disgorged funds to harmed investors Funds not returned to investors are sent to the Treasury or the Investor Protection Fund established pursuant to Section 21F(g) of the Securities Exchange Act of 1934 This indicator lists disgorgement and penalties ordered as a result of SEC cases and the amounts collected in those actions This indicator could increase or decrease based on various factors
Fiscal Year FY 2008 FY 2009 FY 2010 FY 2011 FY 2012 FY 2013 Actual
Ordered amounts (in millions) 1030 2442 2846 2806 3104 3424
Collected amounts (in millions) 521 1694 1775 1281 1048 1603
Responsible DivisionOffice Division of Enforcement
Data Source DELPHI
36
FY 2015 CBJ FY 2015 APP AND FY 2013 APR bull FY 2015 ANNUAL PERFORMANCE PLAN
FY 2015 ANNUAL PERFORMANCE PLAN bull FY 2015 CBJ FY 2015 APP AND FY 2013 APR
Strategic Goal 3 Facilitate Access to the Information Investors Need to Make Informed Investment Decisions
The agency is requesting in FY 2015 a total of $2226 million and 651 FTEs towards achieving results in Strategic Goal 3
Budgeting for the Future (FY 2015)
An educated investing public ultimately provides the best defense against fraud and costly mistakes The federal securities laws place great emphasis on assuring that corporations investments companies and other entities provide investors with timely clear complete and accurate financial and non-financial information allowing investors to make wise investment decisions As part of its disclosure program CF and IM will continue in FY 2015 to meet the requirements of the Sarbanes-Oxley Act (Performance Goal 311) Accordingly CF and IM strive to review disclosures made by certain public issuers including issuersrsquo financial statements no less frequently than once every three years Additionally CF staff will strive to issue comments on a timely basis allowing companies seeking to raise capital by building offering schedules around the 30-day standard (Performance Goal 312) and IM will aim to exceed timeliness targets for
reviewing investment company disclosures (Performance Goal 313) Also in FY 2015 CF will continue to improve the quality of information provided to investors by focusing on disclosure by companies of the information most material to investment decision-making
OIEA responds to investment-related complaints and questions from tens of thousands of investors each year In FY 2015 staff is expected to close approximately 60 percent of complaints and inquiries within seven days and about 90 percent within 30 days (Performance Goal 322) The seven-day target has been adjusted to reflect new workload demands In FY 2015 OIEA will continue to refine internal processes and promote staff training to resolve matters OIEA expects to increase of the number of visitors to its investor education web pages by using social media technologies and partnering with the SECrsquos regional offices other federal and state agencies financial industry associations consumer groups and educational organizations on investor education programs OIEA also will continue to participate in a significant number of in-person outreach events in FY 2015 (Performance Goal 321)
Strategic Objective 31 The SEC works to ensure that investors have access to high-quality disclosure materials that facilitate informed investment decision-making
Goal Leader(s) Director Division of Trading and Markets Director Division of Corporation Finance Director Division of Investment Management
PERFORMANCE GOAL 311 Percentage of public companies and investment companies with disclosures reviewed each year
Description The Sarbanes-Oxley Act requires that the SEC review at least once every three years the disclosures of all companies and investment company portfolios reporting under the Exchange Act These reviews help improve the information available to investors and may identify possible violations of the federal securities laws This metric gauges the number of public companies and investment companies reviewed each year
FY 2013 FY 2013 FY 2014 FY 2015 Fiscal Year FY 2008 FY 2009 FY 2010 FY 2011 FY 2012 Plan Actual Estimate Request
Division of Corporation Finance
Corporations 39 40 44 48 48 33 52 33 33
Responsible DivisionOffice Division of Corporation Finance
Data Source Electronic Data Gathering Analysis and Retrieval (EDGAR)Filing Activity Tracking System (FACTS)
Division of Investment Management
Investment Company Portfolios 36 35 35 33 36 33 34 33 33
Responsible DivisionOffice Division of Investment Management
Data Source Microsoft Office Suite Tools
37
FY 2015 CBJ FY 2015 APP AND FY 2013 APR bull FY 2015 ANNUAL PERFORMANCE PLAN
PERFORMANCE GOAL 312 Time to issue initial comments on Securities Act filings
Description The target of 30 days or less has become a de facto industry standard for the maximum time to receive initial comments
FY 2013 FY 2013 FY 2014 FY 2015 Fiscal Year FY 2008 FY 2009 FY 2010 FY 2011 FY 2012 Plan Actual Estimate Request
Days 252 253 241 244 249 lt30 256 lt30 lt30 days days days days days days days days days
Responsible DivisionOffice Division of Corporation Finance
Data Source FACTS
PERFORMANCE GOAL 313 Percentage of investment company disclosure reviews for which initial comments are completed within timeliness goals
Description For initial registration statements the SECrsquos goal is to issue initial comments within 30 days after they are filed (60 days for registration statements of insurance product separate accounts and related mutual funds) The SEC also aims to comment on post-effective amendments within 45 days and preliminary proxy statements within 10 days after they are filed
FY 2013 FY 2013 FY 2014 FY 2015 Fiscal Year FY 2008 FY 2009 FY 2010 FY 2011 FY 2012 Plan Actual Estimate Request
Initial registration statements 95 95 93 92 96 85 98 85 85
Post-effective amendments 97 97 94 94 95 90 99 90 90
Preliminary proxy statements 99 99 99 98 100 99 98 99 99
Responsible DivisionOffice Division of Investment Management
Data Source Electronic Data Gathering Analysis and Retrieval (EDGAR)
PERFORMANCE INDICATOR (CONTEXTUAL) 311 Total digital audience including website social media and mobile media
Description Digital media has become the dominant channel for investors seeking to access information These statistics will help evaluate the extent to which investors are turning to the SEC identify the channels they use and quantify the amount of information they receive
FY 2013 Fiscal Year FY 2008 FY 2009 FY 2010 FY 2011 FY 2012 Actual
SECgov page views Prior-year data not available 372B
Social media followers 0 1608 83141 193837 236700 258733
Total emailmobile subscriptions Prior-year data not available 519602 631839 740318
Total email bulletins sent NA 875518 1280M 2397M 3344M 4085M
Total mobile bulletins sent NA 6001 62324 107848 150303 238815
Responsible DivisionOffice Office of Public Affairs
Data Source Akamai Technologies Google Analytics GovDelivery Hootsuite Social Media Channels
38
rsquo
FY 2015 ANNUAL PERFORMANCE PLAN bull FY 2015 CBJ FY 2015 APP AND FY 2013 APR
Strategic Objective 32 The SEC works to understand investor needs and educate investors so they are better prepared to make informed investment decisions
Goal Leader(s) Director Office of Investor Education and Advocacy
PERFORMANCE GOAL 321 Number of page views of online investor education content and number of in-person events
including those with specifically targeted communities and organizations
Description The Office of Investor Education and Advocacy (OIEA) initiates investor education campaigns on key strategies for making informed investment decisions including publicizing online resources for researching investment professionals and investments understanding fees and identifying fraud OIEA staff also participates in in-person events for investors generally and those targeted to specific investors such as seniors service members and other affinity groups This metric tracks page views of SEC online investor education materials and the number of investor events in which OIEA staff participated
FY 2013 FY 2013 FY 2014 FY 2015 Fiscal Year FY 2008 FY 2009 FY 2010 FY 2011 FY 2012 Plan Actual Estimate Request
Number of page views Prior-year data not available 15 121 15 20
Number of ldquoin-personrdquo events Prior-year data not available 50 52 50 50
Responsible DivisionOffice Office of Investor Education and Advocacy
Data Source Microsoft Office Suite Tools
PERFORMANCE GOAL 322 Timeliness of responses to investor contacts
Description OIEA serves the tens of thousands of investors each year who contact the SEC with investment-related complaints and questions The staff aims to close out as many new investor assistance matters as possible within seven and thirty business days
FY 2013 FY 2013 FY 2014 FY 2015 Fiscal Year FY 2008 FY 2009 FY 2010 FY 2011 FY 2012 Plan Actual Estimate Request
Closed within 7 days 78 70 72 67 54 50 62 60 60
Closed within 30 days 88 90 93 92 93 90 93 90 90
Responsible DivisionOffice Office of Investor Education and Advocacy
Data Source Internal log using IRIS data
PERFORMANCE GOAL 323 Customer satisfaction rating of OIEA s online investor education resources
Description This metric gauges the effectiveness helpfulness and usability of OIEArsquos online investor education resources
FY 2013 FY 2013 FY 2014 FY 2015 Fiscal Year FY 2008 FY 2009 FY 2010 FY 2011 FY 2012 Plan Actual Estimate Request
Satisfaction index Benchmark Benchmark score for score for
Prior-year data not available NA 81 federal federal government government
websites websites
Responsible DivisionOffice Office of Investor Education and Advocacy
Data Source ForeSee results online portal
39
FY 2015 CBJ FY 2015 APP AND FY 2013 APR bull FY 2015 ANNUAL PERFORMANCE PLAN
PERFORMANCE GOAL 324 Number of new investor education materials designed specifically to help investors protect themselves from fraud
Description Through OIEA and often in conjunction with other organizations the staff issues Investor Alerts and other forms of educational material that inform investors about different permutations of fraud new investment products and other topical issues This metric measures the number of new investor education materials issued by OIEA
FY 2013 FY 2013 FY 2014 FY 2015 Fiscal Year FY 2008 FY 2009 FY 2010 FY 2011 FY 2012 Plan Actual Estimate Request
Number of education materials Prior-year data 16 24 24 26 26 26
not available
Responsible DivisionOffice Office of Investor Education and Advocacy
Data Source wwwsecgov and wwwinvestorgov
PERFORMANCE INDICATOR (PROCESS) 321 Number of investor testing research projects
Description This indicator tracks the number of research initiatives used to gather feedback from investors on the usefulness of disclosures and other input on SEC rulemaking
FY 2013 Fiscal Year FY 2008 FY 2009 FY 2010 FY 2011 FY 2012 Actual
Number of projects 1 0 0 2 2
Responsible DivisionOffice Office of Investor Education and Advocacy
Data Source Microsoft Office Suite Tools
PERFORMANCE INDICATOR (PROCESS) 322 Number of sets of recommendations prepared by the investor advisor y committee
Description This indicator tracks the recommendations from the Investor Advisory Committee regarding investorsrsquo perspectives and priorities
FY 2013 Fiscal Year FY 2008 FY 2009 FY 2010 FY 2011 FY 2012 Actual
Number of sets of recommendations Prior-year data not available 0 4
Responsible DivisionOffice Office of Investor Education and Advocacy
Data Source wwwsecgov
26
0
40
Strategic Goal 4 Enhance the Commissionrsquos Performance through Effective Alignment and Management of Human Information and Financial Capital During FY 2015 the agency will continue to focus on recruiting and retaining high-performing staff and updating the expertise of SEC employees so they are abreast of the latest developments in the securities markets Furthermore the SEC will continue to strengthen internal controls The agency is requesting a total of $3599 million and 867 FTEs in FY 2015 to achieve results in Strategic Goal 4
Budgeting for the Future (FY 2015)
The investing public and the securities markets are best served by an efficient effective and agile SEC In FY 2015 the agency will continue to take steps to become a more effective regulator of the US financial markets by making sound investments in human capital and new technologies and enhancing internal controls
The planned investment in the SEC University for FY 2015 principally supports training and development for employees directly involved in examinations investigations fraud detection litigation and other core mission responsibilities of the agency The SEC University will provide specialized in-depth training concerning changing market conditions analytics and forensics and the agencyrsquos new responsibility areas The investment also will fund employees for certain specialized financial certifications and regulatory credentials as well as the advanced continuing education required for maintaining legal and financial credentials
To maintain mission effectiveness it is essential that attrition in the leadership ranks is quickly addressed by having a highly qualified and diverse pool of candidates ready to assume those
critical roles (Performance Goal 415) The Office of Human Resourcesrsquo (OHR) Workforce Planning has completed building the foundational database necessary to conduct succession planning A subset of this team has begun benchmarking succession planning approaches used by other Federal agencies and will develop and implement a program at the SEC by the end of FY 2014 The first measure is expected by September 30 2014
Leveraging modern reliable and innovative technologies together with predictive analytics will transform the way the SEC performs its mission and provide a proactive view into how technology impacts capital markets The SEC will derive significant and measurable performance improvements in core operations and increase value for users through the use of automated enterprise processes
The continuing implementation of OITrsquos Technology Transformation Plan (ldquoWorking Smarterrdquo) in FY 2015 will support vital technology initiatives It will ensure the SECrsquos business processes are streamlined integrated and implemented using the best technology available
While the SEC has made significant strides in its multi-year path towards a strong sustainable internal control posture the agency will continue to dedicate its energies towards remediating the significant deficiency in information security During FY 2015 OFM will work closely with the Department of Transportationrsquos Federal Shared Services Provider (FSSP) to implement its software upgrade and refine the new Federal government-wide travel management system
41
FY 2015 ANNUAL PERFORMANCE PLAN bull FY 2015 CBJ FY 2015 APP AND FY 2013 APR
FY 2015 CBJ FY 2015 APP AND FY 2013 APR bull FY 2015 ANNUAL PERFORMANCE PLAN
Strategic Objective 41 The SEC promotes a results-oriented work environment that attracts engages and retains a technically proficient and diverse workforce including leaders who provide motivation and strategic direction
Goal Leader(s) Director Office of Human Resources Director Office of Minority and Women Inclusion
PERFORMANCE GOAL 411 Turnover
Description When employee morale and engagement are high high-performing employees tend to remain in the organization Although turnover can fluctuate based on a variety of factors the SEC aims to keep its turnover rate relatively low below 8 per year
FY 2013 FY 2013 FY 2014 FY 2015 Fiscal Year FY 2008 FY 2009 FY 2010 FY 2011 FY 2012 Plan Actual Estimate Request
Percent turnover 62 37 5 64 658 lt8 658 lt8 lt8
Responsible DivisionOffice Office of Human Resources
Data Source The National Business Center at Department of Interior (DOI)
PERFORMANCE GOAL 412 Expanding staff expertise
Description Internal training and hiring programs are designed to help the agency recruit and develop a diverse and qualified staff with the key skills industry knowledge and expertise to support the SEC mission In particular there is a need to train examiners attorneys economists and other experts for subject matter expertise relevant to the marketplace and investment and trading practices This metric tracks whether certain areas requiring significant training are being addressed The agency will track the number of SEC staff participants in mission-focused training and development programs and will report on specific items through the use of post-course evaluations to assess the impact and results of this training on a five-point scale
FY 2013 FY 2013 FY 2014 FY 2015 Fiscal Year FY 2008 FY 2009 FY 2010 FY 2011 FY 2012 Plan Actual Estimate Request
Mission-focused training attendance Prior year data not available NA NA 12000 12120
Post-course evaluations of mission-Prior year data not available NA NA 45 45
focused training
Responsible DivisionOffice Office of Human Resources
Data Source Course Attendance Identified in LEAP (Instructor-led courses only) and End of Course Evaluation Report Summary provided by Metrics that Matter
PERFORMANCE GOAL 413 Number of diversity-related partnershipsalliances
Description Increased numbers of diversity-related partnerships or alliances with professional associations and educational organizations provide opportunities to educate students about the SECrsquos work and to recruit career professionals from all segments of society The SEC will track the number of partnerships andor alliances with diverse professional associations and educational organizations
FY 2013 FY 2013 FY 2014 FY 2015 Fiscal Year FY 2008 FY 2009 FY 2010 FY 2011 FY 2012 Plan Actual Estimate Request
Number of partnershipsalliances Prior-year data 2 10 12 15 13 15
not available
Responsible DivisionOffice Office of Minority Women and Inclusion
Data Source Office of Minority Women and Inclusion Internal Records and Section 342 of DFA
15
42
FY 2015 ANNUAL PERFORMANCE PLAN bull FY 2015 CBJ FY 2015 APP AND FY 2013 APR
PERFORMANCE GOAL 414 Sur vey rankings
Description Annual and other rankings together with other metrics and indicators of federal government agencies will be used as one kind of metric to determine the SECrsquos overall success in improving employee morale and employee engagement
FY 2013 FY 2013 FY 2014 FY 2015 Fiscal Year FY 2008 FY 2009 FY 2010 FY 2011 FY 2012 Plan Actual Estimate Request
Best Places to Work ranking Ranked Ranked Ranked Ranked Ranked Ranked Ranked Ranked Ranked 3 11 24 27 19 20 15 5 5
Average of employee engagement Prior-year data not available NA 61 75 75
and global satisfaction index
Responsible DivisionOffice Office of Human Resources
Data Source Annual Partnership for Public Service calculated ranking based on Annual Employee Viewpoint Survey (EVS) administered by OPM and Average of Employee Engagement and Global Satisfaction Index from OPM Employee Viewpoint Survey (EVS)
PERFORMANCE GOAL 415 Bench strength
Description To maintain mission effectiveness it is essential that attrition in the leadership ranks is quickly addressed by having a highly qualified and diverse pool of candidates ready to assume those critical roles Success is measured by the percentage of key leadership positions for which the SEC has identified a pool of qualified candidates
FY 2013 FY 2013 FY 2014 FY 2015 Fiscal Year FY 2008 FY 2009 FY 2010 FY 2011 FY 2012 Plan Actual Estimate Request
Data point under development NA NA NA NA NA NA NA TBD TBD
Responsible DivisionOffice Office of Human Resources
Data Source TBD
Strategic Objective 42 The SEC encourages a collaborative environment across divisions and offices and leverages technology and data to fulfill its mission more effectively and efficiently
Goal Leader(s) Director Office of Information Technology
PERFORMANCE GOAL 421 Ensure SECrsquos systems and applications are available
Description The SEC aims to enhance its computing infrastructure to eliminate down time if systems at one site fail among other objectives This metric will capture the percentage of systems and applications that can fail over within 8 hours
FY 2013 FY 2013 FY 2014 FY 2015 Fiscal Year FY 2008 FY 2009 FY 2010 FY 2011 FY 2012 Plan Actual Estimate Request
Percentage of servers virtualized NA 12 22 38 79 85 93 94 95
Percentage fail over within 8 hours NA NA NA NA NA NA NA 100 100
Responsible DivisionOffice Office of Information Technology
Data Source OIT Network Operations Center (NOC) ndash automated network monitoring tools
43
FY 2015 CBJ FY 2015 APP AND FY 2013 APR bull FY 2015 ANNUAL PERFORMANCE PLAN
PERFORMANCE GOAL 422 Equip the SEC with an enhanced technology infrastructure to support enterprise infrastructure
Description The SEC aims to promote collaboration and information sharing across the enterprise To improve efficiency and knowledge management the SEC will consolidate and centralize its collaborative technologies to a commonly used enterprise set by 2020 This metric will measure the percentage of the SECrsquos offices and divisions that utilize centralized enterprise collaboration solutions
FY 2013 FY 2013 FY 2014 FY 2015 Fiscal Year FY 2008 FY 2009 FY 2010 FY 2011 FY 2012 Plan Actual Estimate Request
Number of enterprise solutions Prior-year data not 10 20 25 30 30 35 40
available
Responsible DivisionOffice Office of Information Technology
Data Source Approved software applications list
PERFORMANCE GOAL 423 Expand the SECrsquos video teleconferencing (VTC) capabilities to support an increasingly geographically dispersed workforce
Description The SEC seeks to develop a state of the art video teleconference solution that allows users to conduct a videoteleconference meeting between HQ regional offices and multiple endpoints simultaneously collaborate and share presentation materials and use VoIP technology to host video teleconferences from their officesworkspaces with other SEC users or conference rooms This metric will measure the average ldquouptimerdquo or availability of all VTC systems
FY 2013 FY 2013 FY 2014 FY 2015 Fiscal Year FY 2008 FY 2009 FY 2010 FY 2011 FY 2012 Plan Actual Estimate Request
Availability rate for VTC solutions Prior-year data not available 75 80 9999 9999
Responsible DivisionOffice Office of Information Technology
Data Source Telecommunications monitoring system
PERFORMANCE GOAL 424 Pursue continuous technology cost reductions and efficiencies
Description Recent technology enhancements ndash eg data center consolidation virtualization and maintenance contract reductions ndash are producing technical efficiencies and cost savings This metric will measure the amount of these costs savings
FY 2013 FY 2013 FY 2014 FY 2015 Fiscal Year FY 2008 FY 2009 FY 2010 FY 2011 FY 2012 Plan Actual Estimate Request
Percent reduction in operational run 1-3 187 1 2 cost leveraging technology and cost cost reduction reduction process efficiencies
Prior-year data not available reduction in steady
reduction in steady
in run costs
in run costs
state run state run costs costs1
Responsible DivisionOffice Office of Information Technology
Data Source OIT Network Operations Center (NOC)
The higher than expected FY 2013 actual of 187 percent is due to one-time technologies enhancements resulting from the data consolidation and virtualization 1
44
FY 2015 ANNUAL PERFORMANCE PLAN bull FY 2015 CBJ FY 2015 APP AND FY 2013 APR
PERFORMANCE GOAL 425 Enhance the SECrsquos enterprise data warehouse infrastructure and performance
Description The Enterprise Data Warehouse (EDW) infrastructure will enable the provisioning of data to Commission staff for search and analysis through a virtual data warehouse platform This metric will measure the availability of EDW and data sources
FY 2013 FY 2013 FY 2014 FY 2015 Fiscal Year FY 2008 FY 2009 FY 2010 FY 2011 FY 2012 Plan Actual Estimate Request
Availability rate for the EDW infrastructure components in Prior-year data not available NA NA 99 99 production
Responsible DivisionOffice Office of Information Technology
Data Source OIT Network Operations Center (NOC) ndash automated network monitoring tools
Strategic Objective 43 The SEC maximizes the use of agency resources by continually improving agency operations and bolstering internal controls
Goal Leader(s) Chief Financial Officer Chief Operations Officer
PERFORMANCE GOAL 431 Financial audit results
Description Under the Accountability of Taxpayer Dollars Act of 2002 the agency is required to meet all proprietary and budgetary accounting guidelines for federal agencies and to undergo annual audits The SECrsquos audits are conducted by the Government Accountability Office
FY 2013 FY 2013 FY 2014 FY 2015 Fiscal Year FY 2008 FY 2009 FY 2010 FY 2011 FY 2012 Plan Actual Estimate Request
Unqualified opinion Yes Yes Yes Yes Yes Yes Yes Yes Yes
Material weaknesses 0 1 2 0 0 0 0 0 0
Significant deficiency 3 6 0 4 2 0 1 0 0
Responsible DivisionOffice Office of Financial Management
Data Source GAO SEC Financial Audit Report
PERFORMANCE GOAL 432 Assurance statement on internal control over operations
Description In accordance with OMB A-123 and Section 961 of the Dodd-Frank Act the SEC conducts an annual assessment of the effectiveness of internal controls The SEC will continue to develop its Operational Risk program and enhance cross-organizational processes to support all division and office management assurance statements Success is measured by the quality of risk and control assessments and management self-identification and resolution of improvement opportunities
FY 2013 FY 2013 FY 2014 FY 2015 Fiscal Year FY 2008 FY 2009 FY 2010 FY 2011 FY 2012 Plan Actual Estimate Request
Unqualified opinion Yes Yes Yes Yes Yes Yes Yes Yes Yes
Material weakness 0 0 0 0 0 0 0 0 0
Responsible DivisionOffice Office of the Chief Operating Officer
Data Source SEC Financial Audit Report
45
FY 2015 CBJ FY 2015 APP AND FY 2013 APR bull FY 2015 ANNUAL PERFORMANCE PLAN
1
PERFORMANCE GOAL 433 Timely completion of corrective action on Office of Inspector General (OIG) and the GAO audit recommendations1
Description Timely completion of audit recommendations is an important SEC priority This metric measures how well the Commission is doing in completing corrective action on OIG audit recommendations within established timeframes
FY 2013 FY 2013 FY 2014 FY 2015 Fiscal Year FY 2008 FY 2009 FY 2010 FY 2011 FY 2012 Plan Actual Estimate Request
OIG recommendations completed in Prior-year data not available NA 78 80 80
less than one year
Responsible DivisionOffice Office of the Chief Operating Officer
Data Source Audit Recommendation Tracking System
This measure was developed as part of the FY 2014-2018 SEC strategic planning process Currently there is no methodology in place to capture data for tracking all GAO Audit recommendations OCOO will determine a timeframe for establishing a methodology during FY 2014
46
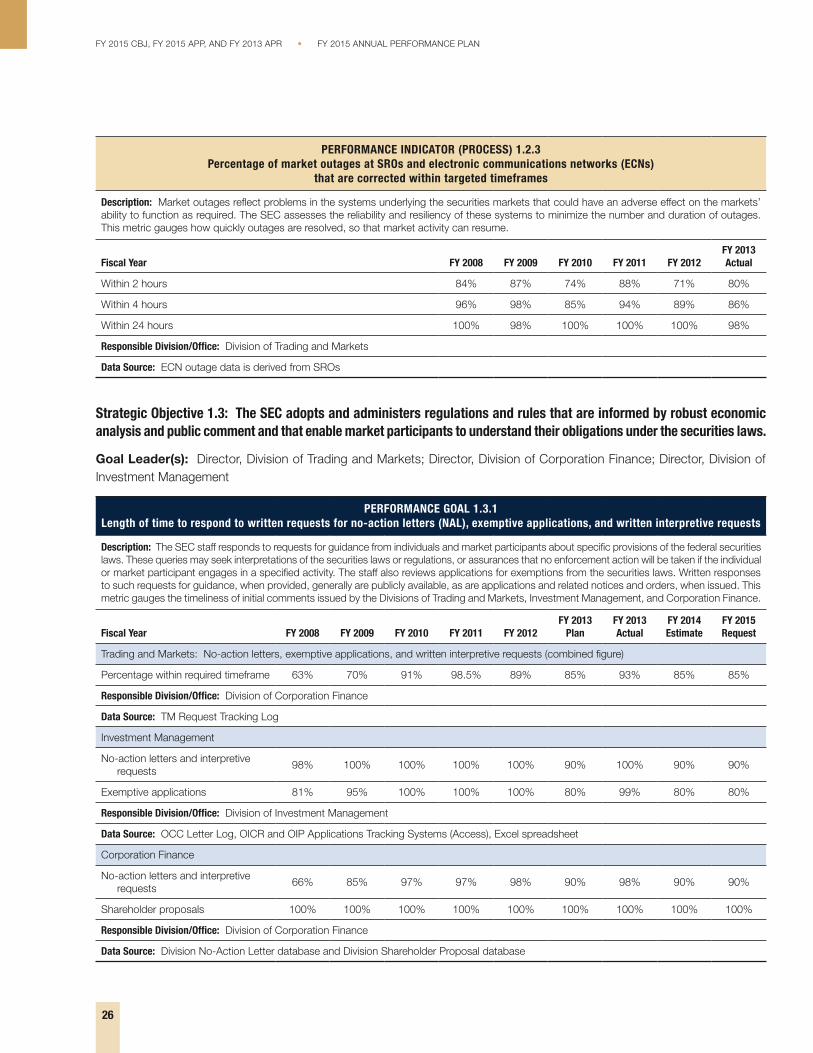
FY 2015 CBJ FY 2015 APP AND FY 2013 APR bull FY 2015 ANNUAL PERFORMANCE PLAN
PERFORMANCE INDICATOR (PROCESS) 123 Percentage of market outages at SROs and electronic communications networks (ECNs)
that are corrected within targeted timeframes
Description Market outages reflect problems in the systems underlying the securities markets that could have an adverse effect on the marketsrsquo ability to function as required The SEC assesses the reliability and resiliency of these systems to minimize the number and duration of outages This metric gauges how quickly outages are resolved so that market activity can resume
FY 2013 Fiscal Year FY 2008 FY 2009 FY 2010 FY 2011 FY 2012 Actual
Within 2 hours 84 87 74 88 71 80
Within 4 hours 96 98 85 94 89 86
Within 24 hours 100 98 100 100 100 98
Responsible DivisionOffice Division of Trading and Markets
Data Source ECN outage data is derived from SROs
Strategic Objective 13 The SEC adopts and administers regulations and rules that are informed by robust economic analysis and public comment and that enable market participants to understand their obligations under the securities laws
Goal Leader(s) Director Division of Trading and Markets Director Division of Corporation Finance Director Division of Investment Management
PERFORMANCE GOAL 131 Length of time to respond to written requests for no-action letters (NAL) exemptive applications and written interpretive requests
Description The SEC staff responds to requests for guidance from individuals and market participants about specific provisions of the federal securities laws These queries may seek interpretations of the securities laws or regulations or assurances that no enforcement action will be taken if the individual or market participant engages in a specified activity The staff also reviews applications for exemptions from the securities laws Written responses to such requests for guidance when provided generally are publicly available as are applications and related notices and orders when issued This metric gauges the timeliness of initial comments issued by the Divisions of Trading and Markets Investment Management and Corporation Finance
FY 2013 FY 2013 FY 2014 FY 2015 Fiscal Year FY 2008 FY 2009 FY 2010 FY 2011 FY 2012 Plan Actual Estimate Request
Trading and Markets No-action letters exemptive applications and written interpretive requests (combined figure)
Percentage within required timeframe 63 70 91 985 89 85 93 85 85
Responsible DivisionOffice Division of Corporation Finance
Data Source TM Request Tracking Log
Investment Management
No-action letters and interpretive 98 100 100 100 100 90 100 90 90
requests
Exemptive applications 81 95 100 100 100 80 99 80 80
Responsible DivisionOffice Division of Investment Management
Data Source OCC Letter Log OICR and OIP Applications Tracking Systems (Access) Excel spreadsheet
Corporation Finance
No-action letters and interpretive 66 85 97 97 98 90 98 90 90
requests
Shareholder proposals 100 100 100 100 100 100 100 100 100
Responsible DivisionOffice Division of Corporation Finance
Data Source Division No-Action Letter database and Division Shareholder Proposal database
26
FY 2015 ANNUAL PERFORMANCE PLAN bull FY 2015 CBJ FY 2015 APP AND FY 2013 APR
PERFORMANCE GOAL 132 Timeliness of responses to requests for informal guidance received by the Trading and Markets dedicated hotline or email box
Description The Division of Trading and Markets maintains a dedicated phone line and an email account to provide market participants with avenues to request information and informal guidance regarding the Exchange Act and rules thereunder This metric will reflect the timeliness of the staffrsquos responses to these requests
FY 2013 FY 2013 FY 2014 FY 2015 Fiscal Year FY 2008 FY 2009 FY 2010 FY 2011 FY 2012 Plan Actual Estimate Request
Respond to or refer inquiries within Prior-year data not available NA NA 95 95
2 weeks
Responsible DivisionOffice Division of Trading and Markets
Data Source Division of Trading and Markets Office of Interpretation and Guidance (OIG) Log and email box
PERFORMANCE INDICATOR (CONTEXTUAL) 131 Number of published economic reports
Description This indicator gauges the number of economic reports that staff of the Division of Economic and Risk Analysis publishes annually on the SECrsquos website
FY 2013 Fiscal Year FY 2008 FY 2009 FY 2010 FY 2011 FY 2012 Actual
Number of reports NA NA NA NA NA
Responsible DivisionOffice Division of Economic Research and Analysis
Data Source DERA economists produce research for publication in leading academic journals including the top accounting and finance journals such as the Journal of Accounting and Economics the Journal of Financial Economics and the Review of Financial Studies DERArsquos site on SEC gov includes citations of all published and forthcoming research written by DERA staff
PERFORMANCE INDICATOR (PROCESS) 132 Number of amendments to national securities exchange registrations (Form 1)
Description This indicator provides information about the volume of material filed with the SEC that involves amendments to exchange registrations
FY 2013 Fiscal Year FY 2008 FY 2009 FY 2010 FY 2011 FY 2012 Actual
Number of amendments Prior-year data not available NA
Responsible DivisionOffice Division of Trading and Markets
Data Source Manual spreadsheets
PERFORMANCE INDICATOR (PROCESS) 133 Number of Alternative Trading System registrations (Form ATS)
Description This indicator provides information about the volume of material filed with the SEC that involves filings related to ATS registrations
FY 2013 Fiscal Year FY 2008 FY 2009 FY 2010 FY 2011 FY 2012 Actual
Number of registrations Prior-year data not available NA
Responsible DivisionOffice Division of Trading and Markets
Data Source Manual spreadsheets
11
27
FY 2015 CBJ FY 2015 APP AND FY 2013 APR bull FY 2015 ANNUAL PERFORMANCE PLAN
PERFORMANCE INDICATOR (PROCESS) 134 Number of new investment product submissions
Description This indicator provides information about the volume of material filed with the SEC that involves new product submissions pursuant to Rule 19b-4(e) of the Exchange Act
FY 2013 Fiscal Year FY 2008 FY 2009 FY 2010 FY 2011 FY 2012 Actual
Number of submissions Prior-year data not available NA
Responsible DivisionOffice Division of Trading and Markets
Data Source Manual spreadsheets
Strategic Objective 14 The SEC engages with a multitude of stakeholders to inform and enhance regulatory activities domestically and internationally
Goal Leader(s) Director Office of International Affairs
PERFORMANCE GOAL 141 Super visory cooperation requests from foreign authorities for SEC assistance and SEC requests for assistance on supervisory cooperation from foreign authorities
Description The SEC makes requests to foreign authorities for supervisory cooperation assistance and responds to such requests from foreign regulators through both formal mechanisms such as supervisory memoranda of understanding and on an ad hoc basis
FY 2013 FY 2013 FY 2014 FY 2015 Fiscal Year FY 2008 FY 2009 FY 2010 FY 2011 FY 2012 Plan Actual Estimate Request
Supervisory cooperation requests Prior-year data not available NA 118 NA NA
from foreign authorities
SEC requests for assistance on supervisory cooperation from Prior-year data not available NA 25 NA NA foreign authorities
Responsible DivisionOffice Office of International Affairs
Data Source International Program Oversight Database and Business Objects reports
PERFORMANCE GOAL 142 Number of non-US regulators trained
Description This metric shows the reach of the SECrsquos technical assistance programs for regulators around the world The SEC conducts these training sessions to assist countries in developing and maintaining robust protections for investors and promoting cross-border enforcement and supervisory assistance
FY 2013 FY 2013 FY 2014 FY 2015 Fiscal Year FY 2008 FY 2009 FY 2010 FY 2011 FY 2012 Plan Actual Estimate Request
Number of non-US regulators Prior-year data not 1997 1765 1785 1370 1716 1400 1400
available
Responsible DivisionOffice Office of International Affairs
Data Source International Program Oversight Database and Business Objects reports
28
Strategic Goal 2 Foster and Enforce Compliance with the Federal Securities Laws
In FY 2015 the agency is requesting a total of 502 FTE for Goal 2 The additional resources will allow the SEC to continue building out the agencyrsquos new responsibility areas and begin addressing the disparity between the number of exam staff and the growing number and complexity of registered firms Additionally the Commission will be able to take prompt action to halt misconduct sanction wrongdoers effectively and return funds to harmed investors In all the agency plans to devote approximately $1802 million to enforcing compliance with the federal securities laws
Budgeting for the Future (FY 2015)
In FY 2015 the SEC will continue to make improvements to its National Examination and Enforcement programs These improvements include hiring staff with new skill sets enhancing their technologies streamlining processes expanding the SECrsquos training programs improving the processing of the thousands of tips the agency receives annually and improving risk assessment techniques These and other significant efforts contribute to the agencyrsquos objective of creating an enduring structure for improved protection of investors and markets
In FY 2015 the National Examination program will continue its focus on high-risk entities and activities Additional staff will among other things improve risk assessment and surveillance functions and continue to address the disparity between the number of staff and the size and complexity of regulated entities The staff will perform targeted sweep and cause examinations including examinations over new or expanded areas of the agencyrsquos jurisdiction
The Enforcement program plans to build on significant changes implemented in prior fiscal years and will work to meet new challenges expected in FY 2015 In order to effectively meet these challenges the Enforcement program is aggressively adopting new methods initiatives and organizational reforms to ensure the best possible use of available resources to strengthen investor confidence in the US financial markets and to send a strong message of deterrence to would-be violators of the securities laws
To improve the quality and efficiency of its investigations the SEC has put seasoned investigators on the front lines created specialized units focused on specific programmatic priorities enhanced case management systems and increased coordination efforts with other offices and divisions in the agency and other regulators In FY 2015 the SEC plans to obtain relief on one or more claims from approximately 92 percent of enforcement actions (Performance Goal 231) The SEC has implemented controls and strategies to resolve actions on a favorable basis while at the same time it will not hesitate to file matters on a contested basis where a favorable settlement was unavailable before filing The agency also plans to reduce in FY 2015 the average number months between the opening of an investigation and the commencement of an enforcement action arising out of that investigation (Performance Goal 233)
Under the Sarbanes-Oxley Act of 2002 the SEC can use Fair Funds to redirect penalties collected from securities law violators to the victims of their wrongdoing The SEC is committed to the timely collection and distribution of penalties and disgorgement funds and has adopted a variety of new measures for monitoring its progress (Performance Goal 235)
29
FY 2015 ANNUAL PERFORMANCE PLAN bull FY 2015 CBJ FY 2015 APP AND FY 2013 APR
FY 2015 CBJ FY 2015 APP AND FY 2013 APR bull FY 2015 ANNUAL PERFORMANCE PLAN
Strategic Objective 21 The SEC fosters compliance with the federal securities laws
Goal Leader(s) Director Office of Compliance Inspections and Examinations
PERFORMANCE GOAL 211 Number of industr y outreach and education programs targeted to areas identified as raising particular compliance risks
Description Targeted communication with industry participants on topics shaping the examination program is intended to enhance compliance practices and prevent violations before they occur This metric identifies the number of major outreach efforts conducted including the SECrsquos national and regional compliance outreach events published risk alerts and other educational programs and initiatives
FY 2013 FY 2013 FY 2014 FY 2015 Fiscal Year FY 2008 FY 2009 FY 2010 FY 2011 FY 2012 Plan Actual Estimate Request
Number of major outreach efforts Prior-year data 6 5 12 14 15 16
not available
Responsible DivisionOffice Office of Compliance Inspections and Examinations
Data Source Internal tracking although the events noted above are referenced in the SECrsquos website
PERFORMANCE GOAL 212 Percentage of firms receiving deficiency letters that take corrective action in response to all exam findings
Description At the conclusion of examinations the staff communicates identified deficiencies to registrants in the form of a deficiency letter Registrants are then given a chance to respond to staff findings and often take action to remedy any problems and potential risks including monetary compensation to clients and enhancements to disclosures policies and procedures Most often registrants respond that they have corrected the deficiencies and implemented measures to prevent recurrence
FY 2013 FY 2013 FY 2014 FY 2015 Fiscal Year FY 2008 FY 2009 FY 2010 FY 2011 FY 2012 Plan Actual Estimate Request
Percentage 93 94 90 93 92 93 86 87 88
Responsible DivisionOffice Office of Compliance Inspections and Examinations
Data Source Tracking and Reporting Exam National Documentation System (TRENDS)
Strategic Objective 22 The SEC promptly detects and deters violations of the federal securities laws
Goal Leader(s) Director Office of Compliance Inspections and Examinations
PERFORMANCE GOAL 221 Percentage of investment advisers investment companies and broker-dealers examined during the year
Description This metric indicates the number of registrants examined by the SEC or an SRO as a percentage of the total number of registrants This metric includes all types of examinations risk priority examinations cause inspections to follow up on tips and complaints limited-scope special inspections to probe emerging risk areas oversight examinations of broker-dealers to test compliance and the quality of examinations by FINRA
FY 2013 FY 2013 FY 2014 FY 2015 Fiscal Year FY 2008 FY 2009 FY 2010 FY 2011 FY 2012 Plan Actual Estimate Request
Investment advisers 14 10 9 8 8 10 9 9 12
Investment companies 23 29 10 13 12 14 11 12 15
Broker-dealers (exams by SEC 57 54 44 58 49 50 46 48 50
and SROs)
Responsible DivisionOffice Office of Compliance Inspections and Examinations
Data Source Tracking and Reporting Exam National Documentation System (TRENDS) (IA IC and BD SEC data) and SRO Databases (BD SRO Data)
17
30
FY 2015 ANNUAL PERFORMANCE PLAN bull FY 2015 CBJ FY 2015 APP AND FY 2013 APR
PERFORMANCE GOAL 222 Percentage of compliance exams that are timely concluded in accordance with the Office of Compliance Inspections
and Examinationrsquos (OCIE) statutory deadline
Description The staff conducts examinations each year of registered entities including investment advisers investment company complexes transfer agents and broker-dealers The staff strives to complete its examinations and communicate findings in the most efficient and effective manner and within its statutory deadline This metric reflects the percentage of examinations concluded within the statutory deadline
FY 2013 FY 2013 FY 2014 FY 2015 Fiscal Year FY 2008 FY 2009 FY 2010 FY 2011 FY 2012 Plan Actual Estimate Request
Percentage Prior-year data NA NA NA 100 100 100 100
not available
Responsible DivisionOffice Office of Compliance Inspections and Examinations
Data Source Tracking and Reporting Exam National Documentation System (TRENDS)
PERFORMANCE GOAL 223 Number of joint exams information sharing agreements and formal meetings with other regulators
Description The SEC attempts to coordinate and collaborate with other regulators on areas of mutual interest This helps to ensure that all regulators are informed of on-going risks and issues related to broad market practices as well as specific entities of mutual interest This cooperation is critical to the exam program to ensure that certain higher risk firms and activities are addressed in the most efficient and effective manner This metric tracks critical cooperation activities that are occurring between the SECrsquos exam program and other regulators
FY 2013 FY 2013 FY 2014 FY 2015 Fiscal Year FY 2008 FY 2009 FY 2010 FY 2011 FY 2012 Plan Actual Estimate Request
Number of joint exams active sharing Prior-year data not available NA NA 85 100
agreements and formal meetings
Responsible DivisionOffice Office of Compliance Inspections and Examinations
Data Source Various (including internal tracking and TRENDS)
PERFORMANCE INDICATOR (CONTEXTUAL) 221 Percentage of exams that identify deficiencies the percentage that result in a ldquosignificant findingrdquo
and the percentage referred to the Division of Enforcement
Description Examiners find a wide range of deficiencies during examinations Some of the deficiencies are more technical in nature such as failing to include all information that is required to be in a record However other deficiencies may cause harm to customers or clients of a firm have a high potential to cause harm or reflect recidivist misconduct The latter deficiencies are among those categorized as ldquosignificantrdquo This indicator identifies the percentage of exams that identified deficiencies that resulted in significant deficiency findings and that were referred to Enforcement
FY 2013 Fiscal Year FY 2008 FY 2009 FY 2010 FY 2011 FY 2012 Actual
Percentage that identify deficiencies Prior-year data 72 82 80 80
not available
Percentage that result in a ldquosignificant findingrdquo Prior-year data 42 42 42 35
not available
Percentage referred to the Division of Enforcement Prior-year data not available 13
Responsible DivisionOffice Office of Compliance Inspections and Examinations
Data Source Tracking and Reporting Exam National Documentation System (TRENDS)
31
PERFORMANCE INDICATOR (OUTPUT) 222 Number of cause exams that result from tips complaints and referrals
Description Analysis of a tip can support the request for a cause exam This indicator would identify the number of SEC cause exams that result from tips collected through outreach efforts
Fiscal Year FY 2008 FY 2009 FY 2010 FY 2011 FY 2012 FY 2013 Actual
Number of cause exams Prior-year data not available
NA NA NA 222
Responsible DivisionOffice Office of Compliance Inspections and Examinations
Data Source Tracking and Reporting Exam National Documentation System (TRENDS)
PERFORMANCE INDICATOR (OUTPUT) 223 Number of rule-making initiatives assisted by the National Exam Program
Description The examination program interacts with registrants on a regular basis and this work provides critical feedback to ensuring effective and practical rulemaking and policy efforts This indicator tracks how frequently the examination program assists with rulemaking initiatives
Fiscal Year FY 2008 FY 2009 FY 2010 FY 2011 FY 2012 FY 2013 Actual
Number of rule-making initiatives assisted by the NEP Prior-year data not available NA
Responsible DivisionOffice Office of Compliance Inspections and Examinations
Data Source Internal tracking
PERFORMANCE INDICATOR (OUTPUT) 224 Number of investigations or inquiries originating from a tip or complaint
Description Analysis of a tip or complaint can result in the need for further enforcement investigation The indicator identifies the volume of SEC investigations that result from tips and complaints received by the SEC
Fiscal Year FY 2008 FY 2009 FY 2010 FY 2011 FY 2012 FY 2013 Actual
Number of investigations Prior-year data not available
303 349 296 289
Responsible DivisionOffice Division of Enforcement
Data Source HUB case management and tracking system for the Division of Enforcement
PERFORMANCE INDICATOR (OUTPUT) 225 SEC investigations in which requests for access to information were granted by the SEC to other authorities
such as SROs or other state federal and foreign enforcement authorities
Description The SEC works closely with other regulators and authorities This measure identifies the number of investigations in which the SEC granted one or more authorities access to information concerning an investigation during the fiscal year This may include requests for access to SEC investigative files concerning investigations that the SEC continues to pursue as well as those in which the SEC has completed its investigation
Fiscal Year FY 2008 FY 2009 FY 2010 FY 2011 FY 2012 FY 2013 Actual
Number of investigations Prior-year data not available
492 586 515 504
Responsible DivisionOffice Division of Enforcement
Data Source HUB case management and tracking system for the Division of Enforcement
32
FY 2015 CBJ FY 2015 APP AND FY 2013 APR bull FY 2015 ANNUAL PERFORMANCE PLAN
FY 2015 ANNUAL PERFORMANCE PLAN bull FY 2015 CBJ FY 2015 APP AND FY 2013 APR
PERFORMANCE INDICATOR (OUTPUT) 226 Requests from foreign authorities for SEC assistance and SEC requests for assistance from foreign authorities
Description Each year the SEC makes hundreds of requests for enforcement assistance to foreign regulators while responding to hundreds of such requests from other nations To facilitate this type of assistance and encourage other countries to enact laws necessary to allow regulators to cooperate with their foreign counterparts the SEC has entered into bilateral information sharing arrangements as well as the Multilateral Memorandum of Understanding an information-sharing arrangement negotiated through the International Organization of Securities Commissions (IOSCO)
FY 2013 Fiscal Year FY 2008 FY 2009 FY 2010 FY 2011 FY 2012 Actual
Number of requests from foreign authorities 414 408 457 492 450
Number of SEC requests 594 774 605 772 718
Responsible DivisionOffice Office of International Affairs
Data Source International Program Oversight Database and Business Objects reports
Strategic Objective 23 The SEC prosecutes violations of federal securities laws and holds violators accountable through appropriate sanctions and remedies
Goal Leader(s) Director Division of Enforcement
PERFORMANCE GOAL 231 Percentage of enforcement actions in which the Commission obtained relief on one or more claims
Description This metric identifies as to all parties to enforcement actions that were resolved in the fiscal year the percentage against whom the Commission obtained a judgment or order entered on consent a default judgment a judgment of liability on one or more charges andor the imposition of monetary or other relief
FY 2013 FY 2013 FY 2014 FY 2015 Fiscal Year FY 2008 FY 2009 FY 2010 FY 2011 FY 2012 Plan Actual Estimate Request
Percentage 92 92 92 93 89 92 93 92 92
Responsible DivisionOffice Division of Enforcement
Data Source HUB case management and tracking system for the Division of Enforcement
PERFORMANCE GOAL 232 Percentage of first enforcement actions filed within two years of the opening of an investigation
Description This metric concerns the pace of investigations that lead to the filing of enforcement actions Specifically this metric captures the rate at which the first enforcement action arising out of an investigation was filed within two years of the opening of the investigation If the investigation was preceded by a matter under inquiry the metric draws on the date of the opening of the matter under inquiry In conducting investigations the Enforcement program continually strives to balance the need for complete effective and fair investigations with the need to file enforcement actions in as timely a manner as possible
FY 2013 FY 2013 FY 2014 FY 2015 Fiscal Year FY 2008 FY 2009 FY 2010 FY 2011 FY 2012 Plan Actual Estimate Request
Percentage 62 70 67 61 63 65 58 65 65
Responsible DivisionOffice Division of Enforcement
Data Source HUB case management and tracking system for the Division of Enforcement
508
717
33
FY 2015 CBJ FY 2015 APP AND FY 2013 APR bull FY 2015 ANNUAL PERFORMANCE PLAN
PERFORMANCE GOAL 233 Average months between opening a matter under inquiry or an investigation and commencing an enforcement action
Description This metric captures the average number of months between the opening of an investigation and the filing of the first enforcement action arising out of that investigation If the investigation was preceded by a matter under inquiry the metric draws on the date of opening of the matter inquiry In conducting investigations the enforcement program continually strives to balance the need for complete effective and fair investigation with the need to file enforcement actions in as timely a manner as possible While not all investigations result in the filing of enforcement actions this metric provides information concerning the pace of investigations that do lead to such actions and supplements the previous goal which measures the percentage of first enforcement actions filed within two years
FY 2013 FY 2013 FY 2014 FY 2015 Fiscal Year FY 2008 FY 2009 FY 2010 FY 2011 FY 2012 Plan Actual Estimate Request
Months Prior-year data not available 22 21 20 21 20 20
Responsible DivisionOffice Division of Enforcement
Data Source HUB case management and tracking system for the Division of Enforcement
PERFORMANCE GOAL 234 Percentage of debts where either a payment has been made or a collection activity has
been initiated within 180 days of the due date of the debt
Description The SEC can seek a wide range of remedies for failure to comply with the securities laws These remedies include civil monetary penalties and disgorgement When the remedies are imposed by the SEC or the Federal district court payments must be made by a certain date This metric identifies the percentage of debts where debtors have made payments or the SEC has initiated a collection activity within 180 days of the due date Such collection activities include among other things demand letters negotiation of payment plans enforcing the payment of the debt through the courts or other judicial remedies
FY 2013 FY 2013 FY 2014 FY 2015 Fiscal Year FY 2008 FY 2009 FY 2010 FY 2011 FY 2012 Plan Actual Estimate Request
Percentage 88 90 86 91 92 92 95 95 95
Responsible DivisionOffice Division of Enforcement
Data Source DELPHI
PERFORMANCE GOAL 235 Percentage of Fair Fund and disgorgement fund plans that have distributed 80 percent of the available
funds for distribution within twenty four (24) months of the approval of the distribution plan
Description In addition to other types of relief the SEC may seek orders requiring parties to disgorge any money obtained through wrongdoing The SEC also is empowered to seek civil penalties for violations of the securities laws Where appropriate the SEC has sought to return disgorged funds to harmed investors and as a result of the Fair Funds provisions of the Sarbanes-Oxley Act and the Dodd-Frank Act to combine amounts paid as penalties with disgorged funds or to create a Fair Fund from penalties only to reduce losses to injured parties and to maximize funds available for distribution This metric identifies the percentage of distribution plans that reached a critical mass during the fiscal year and within twenty four (24) months of the approval of the distribution plan The distribution plan includes the timeline and procedures required to return the funds to injured investors This reflects Commission-wide efforts to implement plans to return money to investors quickly Any funds not returned to investors are sent to the US Treasury or the Investor Protection Fund established pursuant to Section 21F(g) of the Securities Exchange Act of 1934 Neither disgorgement nor penalties are used for the SECrsquos own expenses
FY 2013 FY 2013 FY 2014 FY 2015 Fiscal Year FY 2008 FY 2009 FY 2010 FY 2011 FY 2012 Plan Actual Estimate Request
Percentage Prior-year data not available 80 80 73 78 82
Responsible DivisionOffice Division of Enforcement
Data Source HUB case management and tracking system for the Division of Enforcement and Distributions Management System
34
PERFORMANCE INDICATOR (CONTEXTUAL) 232 Total amount distributed within the fiscal year and the number of Fair Funds from which those distributions came
Description In its enforcement actions the SEC may seek to return funds to harmed investors through disgorgement of ill-gotten gains or through the Fair Funds provision of the Sarbanes-Oxley Act This provision permits the SEC to combine amounts paid as penalties with disgorged funds or to create a Fair Fund from penalties only to reduce losses to injured parties This reflects the SECrsquos efforts to return funds to injured investors This indicator identifies the total amount distributed within the fiscal year and the number of Fair Funds from which those distributions came This indicator may increase or decrease in dollar amount and number of distribution funds based on the number of SEC enforcement actions brought involving distributions amounts ordered and paid in those actions and other factors Due to the variation in reporting timelines established for each individual distribution reported amounts are based on the agencyrsquos best available information Reported amounts do not include those funds distributed through receiverships Any funds not returned to investors are sent to the US Treasury or the Investor Protection Fund established pursuant to Section 21F(g) of the Securities Exchange Act of 1934 Neither disgorgement nor penalties are used for the Commissionrsquos own expenses
Fiscal Year FY 2008 FY 2009 FY 2010 FY 2011 FY 2012 FY 2013 Actual
Amount distributed (in millions) Prior-year data not available 815 251
Number of Fair Funds Prior-year data not available 31 22
Responsible DivisionOffice Division of Enforcement
Data Source HUB case management and tracking system for the Division of Enforcement Distributions Management System
PERFORMANCE INDICATOR (CONTEXTUAL) 231 Percentage of filed enforcement actions reflecting characteristics that present enhanced risk to investors and markets as
measured by the nature of the investigation conduct parties and impact
Description This indicator assesses the quality of the cases filed by the Division of Enforcement The indicator focuses on cases filed by the SEC that involve factors reflecting enhanced risk to investors and markets Such cases may involve (i) those identified through risk analytics and cross-disciplinary initiatives to reveal difficult-to-detect or early stage misconduct thus minimizing investor loss and preventing the spread of unlawful conduct and practices (ii) particularly egregious or widespread misconduct and investor harm (iii) vulnerable victims (iv) a high degree of scienter (v) involvement of individuals occupying substantial positions of authority or having fiduciary obligations or other special responsibilities to investors (vi) involvement of recidivists (vii) high amount of investor loss prevented (viii) misconduct that is difficult to detect due to the complexity of products transactions and practices (ix) use of innovative investigative or analytical techniques (x) effective coordination with other law enforcement partners andor (xi) whether the matter involves markets transactions or practices identified as an enforcement priority or that advances the programmatic priorities of other SEC Divisions or Offices
Fiscal Year FY 2008 FY 2009 FY 2010 FY 2011 FY 2012 FY 2013 Actual
Percentage Prior-year data not available NA NA
Responsible DivisionOffice Division of Enforcement
Data Source HUB case management and tracking system for the Division of Enforcement
35
FY 2015 ANNUAL PERFORMANCE PLAN bull FY 2015 CBJ FY 2015 APP AND FY 2013 APR
PERFORMANCE INDICATOR (OUTPUT) 233 Percent of enforcement actions filed that arose out of national priority investigations
Description The Division of Enforcement conducts many enforcement actions each year that can be characterized as high impact and of national priority High impact or national priority investigations include those investigations which are significant for one or more of the following reasons ndashthe matter (i) presents an opportunity to send a particularly strong and effective message of deterrence including with respect to markets products and transactions that are newly developing or that are long established but which by their nature present limited opportunities to detect wrongdoing and thus to deter misconduct (ii) involves particularly egregious or extensive misconduct (iii) involves potentially widespread and extensive harm to investors (iv) involves misconduct by persons occupying positions of substantial authority or responsibility or who owe fiduciary or other enhanced duties and obligations to a broad group of investors or others (v) involves potential wrongdoing as prohibited under newly-enacted legislation or regulatory rules (vi) concerns potential misconduct that occurred in connection with products markets transactions or practices that pose particularly significant risks for investors or a systemically important sector of the market (vii) involves a substantial number of potential victims and or particularly vulnerable victims (viii) involves products markets transactions or practices that the Enforcement Division has identified as priority areas (ie conduct relating to the financial crisis fraud in connection with mortgage-related securities financial fraud involving public companies whose stock is widely held misconduct by investment advisers and matters involving priorities established by particular regional offices or the specialized units) andor (ix) provides an opportunity to pursue priority interests shared by other law enforcement agencies on a coordinated basis
Fiscal Year FY 2008 FY 2009 FY 2010 FY 2011 FY 2012 FY 2013 Actual
Percentage Prior-year data not available 10 20 15
Responsible DivisionOffice Division of Enforcement
Data Source HUB case management and tracking system for the Division of Enforcement
PERFORMANCE INDICATOR (CONTEXTUAL) 234 Criminal actions related to conduct under investigation by the SEC
Description In some instances conduct may involve both civil and criminal violations and may be investigated by both the SEC and the criminal authorities This indicator identifies the number of criminal actions that are related to conduct under investigation by the SEC
Fiscal Year FY 2008 FY 2009 FY 2010 FY 2011 FY 2012 FY 2013 Actual
Number of criminal investigations Prior-year data not available
139 134 126 126
Responsible DivisionOffice Division of Enforcement
Data Source HUB case management and tracking system for the Division of Enforcement
PERFORMANCE INDICATOR (OUTPUT) 235 Disgorgement and penalties ordered and the amounts collected
Description In addition to other types of relief the SEC may seek orders requiring parties to disgorge any money obtained through wrongdoing The SEC is also empowered to seek civil penalties for violations of the securities laws In some cases the SEC will seek to obtain large monetary sanctions even in instances where the prospects of collecting on a judgment are slight The rationale for seeking monetary relief in these circumstances is that such relief even when likely uncollectible might become collectible in the future based on the defendantrsquos changed circumstances and also because such relief can serve to deter others from violating the securities laws Where appropriate the SEC has sought to return disgorged funds to harmed investors Funds not returned to investors are sent to the Treasury or the Investor Protection Fund established pursuant to Section 21F(g) of the Securities Exchange Act of 1934 This indicator lists disgorgement and penalties ordered as a result of SEC cases and the amounts collected in those actions This indicator could increase or decrease based on various factors
Fiscal Year FY 2008 FY 2009 FY 2010 FY 2011 FY 2012 FY 2013 Actual
Ordered amounts (in millions) 1030 2442 2846 2806 3104 3424
Collected amounts (in millions) 521 1694 1775 1281 1048 1603
Responsible DivisionOffice Division of Enforcement
Data Source DELPHI
36
FY 2015 CBJ FY 2015 APP AND FY 2013 APR bull FY 2015 ANNUAL PERFORMANCE PLAN
FY 2015 ANNUAL PERFORMANCE PLAN bull FY 2015 CBJ FY 2015 APP AND FY 2013 APR
Strategic Goal 3 Facilitate Access to the Information Investors Need to Make Informed Investment Decisions
The agency is requesting in FY 2015 a total of $2226 million and 651 FTEs towards achieving results in Strategic Goal 3
Budgeting for the Future (FY 2015)
An educated investing public ultimately provides the best defense against fraud and costly mistakes The federal securities laws place great emphasis on assuring that corporations investments companies and other entities provide investors with timely clear complete and accurate financial and non-financial information allowing investors to make wise investment decisions As part of its disclosure program CF and IM will continue in FY 2015 to meet the requirements of the Sarbanes-Oxley Act (Performance Goal 311) Accordingly CF and IM strive to review disclosures made by certain public issuers including issuersrsquo financial statements no less frequently than once every three years Additionally CF staff will strive to issue comments on a timely basis allowing companies seeking to raise capital by building offering schedules around the 30-day standard (Performance Goal 312) and IM will aim to exceed timeliness targets for
reviewing investment company disclosures (Performance Goal 313) Also in FY 2015 CF will continue to improve the quality of information provided to investors by focusing on disclosure by companies of the information most material to investment decision-making
OIEA responds to investment-related complaints and questions from tens of thousands of investors each year In FY 2015 staff is expected to close approximately 60 percent of complaints and inquiries within seven days and about 90 percent within 30 days (Performance Goal 322) The seven-day target has been adjusted to reflect new workload demands In FY 2015 OIEA will continue to refine internal processes and promote staff training to resolve matters OIEA expects to increase of the number of visitors to its investor education web pages by using social media technologies and partnering with the SECrsquos regional offices other federal and state agencies financial industry associations consumer groups and educational organizations on investor education programs OIEA also will continue to participate in a significant number of in-person outreach events in FY 2015 (Performance Goal 321)
Strategic Objective 31 The SEC works to ensure that investors have access to high-quality disclosure materials that facilitate informed investment decision-making
Goal Leader(s) Director Division of Trading and Markets Director Division of Corporation Finance Director Division of Investment Management
PERFORMANCE GOAL 311 Percentage of public companies and investment companies with disclosures reviewed each year
Description The Sarbanes-Oxley Act requires that the SEC review at least once every three years the disclosures of all companies and investment company portfolios reporting under the Exchange Act These reviews help improve the information available to investors and may identify possible violations of the federal securities laws This metric gauges the number of public companies and investment companies reviewed each year
FY 2013 FY 2013 FY 2014 FY 2015 Fiscal Year FY 2008 FY 2009 FY 2010 FY 2011 FY 2012 Plan Actual Estimate Request
Division of Corporation Finance
Corporations 39 40 44 48 48 33 52 33 33
Responsible DivisionOffice Division of Corporation Finance
Data Source Electronic Data Gathering Analysis and Retrieval (EDGAR)Filing Activity Tracking System (FACTS)
Division of Investment Management
Investment Company Portfolios 36 35 35 33 36 33 34 33 33
Responsible DivisionOffice Division of Investment Management
Data Source Microsoft Office Suite Tools
37
FY 2015 CBJ FY 2015 APP AND FY 2013 APR bull FY 2015 ANNUAL PERFORMANCE PLAN
PERFORMANCE GOAL 312 Time to issue initial comments on Securities Act filings
Description The target of 30 days or less has become a de facto industry standard for the maximum time to receive initial comments
FY 2013 FY 2013 FY 2014 FY 2015 Fiscal Year FY 2008 FY 2009 FY 2010 FY 2011 FY 2012 Plan Actual Estimate Request
Days 252 253 241 244 249 lt30 256 lt30 lt30 days days days days days days days days days
Responsible DivisionOffice Division of Corporation Finance
Data Source FACTS
PERFORMANCE GOAL 313 Percentage of investment company disclosure reviews for which initial comments are completed within timeliness goals
Description For initial registration statements the SECrsquos goal is to issue initial comments within 30 days after they are filed (60 days for registration statements of insurance product separate accounts and related mutual funds) The SEC also aims to comment on post-effective amendments within 45 days and preliminary proxy statements within 10 days after they are filed
FY 2013 FY 2013 FY 2014 FY 2015 Fiscal Year FY 2008 FY 2009 FY 2010 FY 2011 FY 2012 Plan Actual Estimate Request
Initial registration statements 95 95 93 92 96 85 98 85 85
Post-effective amendments 97 97 94 94 95 90 99 90 90
Preliminary proxy statements 99 99 99 98 100 99 98 99 99
Responsible DivisionOffice Division of Investment Management
Data Source Electronic Data Gathering Analysis and Retrieval (EDGAR)
PERFORMANCE INDICATOR (CONTEXTUAL) 311 Total digital audience including website social media and mobile media
Description Digital media has become the dominant channel for investors seeking to access information These statistics will help evaluate the extent to which investors are turning to the SEC identify the channels they use and quantify the amount of information they receive
FY 2013 Fiscal Year FY 2008 FY 2009 FY 2010 FY 2011 FY 2012 Actual
SECgov page views Prior-year data not available 372B
Social media followers 0 1608 83141 193837 236700 258733
Total emailmobile subscriptions Prior-year data not available 519602 631839 740318
Total email bulletins sent NA 875518 1280M 2397M 3344M 4085M
Total mobile bulletins sent NA 6001 62324 107848 150303 238815
Responsible DivisionOffice Office of Public Affairs
Data Source Akamai Technologies Google Analytics GovDelivery Hootsuite Social Media Channels
38
rsquo
FY 2015 ANNUAL PERFORMANCE PLAN bull FY 2015 CBJ FY 2015 APP AND FY 2013 APR
Strategic Objective 32 The SEC works to understand investor needs and educate investors so they are better prepared to make informed investment decisions
Goal Leader(s) Director Office of Investor Education and Advocacy
PERFORMANCE GOAL 321 Number of page views of online investor education content and number of in-person events
including those with specifically targeted communities and organizations
Description The Office of Investor Education and Advocacy (OIEA) initiates investor education campaigns on key strategies for making informed investment decisions including publicizing online resources for researching investment professionals and investments understanding fees and identifying fraud OIEA staff also participates in in-person events for investors generally and those targeted to specific investors such as seniors service members and other affinity groups This metric tracks page views of SEC online investor education materials and the number of investor events in which OIEA staff participated
FY 2013 FY 2013 FY 2014 FY 2015 Fiscal Year FY 2008 FY 2009 FY 2010 FY 2011 FY 2012 Plan Actual Estimate Request
Number of page views Prior-year data not available 15 121 15 20
Number of ldquoin-personrdquo events Prior-year data not available 50 52 50 50
Responsible DivisionOffice Office of Investor Education and Advocacy
Data Source Microsoft Office Suite Tools
PERFORMANCE GOAL 322 Timeliness of responses to investor contacts
Description OIEA serves the tens of thousands of investors each year who contact the SEC with investment-related complaints and questions The staff aims to close out as many new investor assistance matters as possible within seven and thirty business days
FY 2013 FY 2013 FY 2014 FY 2015 Fiscal Year FY 2008 FY 2009 FY 2010 FY 2011 FY 2012 Plan Actual Estimate Request
Closed within 7 days 78 70 72 67 54 50 62 60 60
Closed within 30 days 88 90 93 92 93 90 93 90 90
Responsible DivisionOffice Office of Investor Education and Advocacy
Data Source Internal log using IRIS data
PERFORMANCE GOAL 323 Customer satisfaction rating of OIEA s online investor education resources
Description This metric gauges the effectiveness helpfulness and usability of OIEArsquos online investor education resources
FY 2013 FY 2013 FY 2014 FY 2015 Fiscal Year FY 2008 FY 2009 FY 2010 FY 2011 FY 2012 Plan Actual Estimate Request
Satisfaction index Benchmark Benchmark score for score for
Prior-year data not available NA 81 federal federal government government
websites websites
Responsible DivisionOffice Office of Investor Education and Advocacy
Data Source ForeSee results online portal
39
FY 2015 CBJ FY 2015 APP AND FY 2013 APR bull FY 2015 ANNUAL PERFORMANCE PLAN
PERFORMANCE GOAL 324 Number of new investor education materials designed specifically to help investors protect themselves from fraud
Description Through OIEA and often in conjunction with other organizations the staff issues Investor Alerts and other forms of educational material that inform investors about different permutations of fraud new investment products and other topical issues This metric measures the number of new investor education materials issued by OIEA
FY 2013 FY 2013 FY 2014 FY 2015 Fiscal Year FY 2008 FY 2009 FY 2010 FY 2011 FY 2012 Plan Actual Estimate Request
Number of education materials Prior-year data 16 24 24 26 26 26
not available
Responsible DivisionOffice Office of Investor Education and Advocacy
Data Source wwwsecgov and wwwinvestorgov
PERFORMANCE INDICATOR (PROCESS) 321 Number of investor testing research projects
Description This indicator tracks the number of research initiatives used to gather feedback from investors on the usefulness of disclosures and other input on SEC rulemaking
FY 2013 Fiscal Year FY 2008 FY 2009 FY 2010 FY 2011 FY 2012 Actual
Number of projects 1 0 0 2 2
Responsible DivisionOffice Office of Investor Education and Advocacy
Data Source Microsoft Office Suite Tools
PERFORMANCE INDICATOR (PROCESS) 322 Number of sets of recommendations prepared by the investor advisor y committee
Description This indicator tracks the recommendations from the Investor Advisory Committee regarding investorsrsquo perspectives and priorities
FY 2013 Fiscal Year FY 2008 FY 2009 FY 2010 FY 2011 FY 2012 Actual
Number of sets of recommendations Prior-year data not available 0 4
Responsible DivisionOffice Office of Investor Education and Advocacy
Data Source wwwsecgov
26
0
40
Strategic Goal 4 Enhance the Commissionrsquos Performance through Effective Alignment and Management of Human Information and Financial Capital During FY 2015 the agency will continue to focus on recruiting and retaining high-performing staff and updating the expertise of SEC employees so they are abreast of the latest developments in the securities markets Furthermore the SEC will continue to strengthen internal controls The agency is requesting a total of $3599 million and 867 FTEs in FY 2015 to achieve results in Strategic Goal 4
Budgeting for the Future (FY 2015)
The investing public and the securities markets are best served by an efficient effective and agile SEC In FY 2015 the agency will continue to take steps to become a more effective regulator of the US financial markets by making sound investments in human capital and new technologies and enhancing internal controls
The planned investment in the SEC University for FY 2015 principally supports training and development for employees directly involved in examinations investigations fraud detection litigation and other core mission responsibilities of the agency The SEC University will provide specialized in-depth training concerning changing market conditions analytics and forensics and the agencyrsquos new responsibility areas The investment also will fund employees for certain specialized financial certifications and regulatory credentials as well as the advanced continuing education required for maintaining legal and financial credentials
To maintain mission effectiveness it is essential that attrition in the leadership ranks is quickly addressed by having a highly qualified and diverse pool of candidates ready to assume those
critical roles (Performance Goal 415) The Office of Human Resourcesrsquo (OHR) Workforce Planning has completed building the foundational database necessary to conduct succession planning A subset of this team has begun benchmarking succession planning approaches used by other Federal agencies and will develop and implement a program at the SEC by the end of FY 2014 The first measure is expected by September 30 2014
Leveraging modern reliable and innovative technologies together with predictive analytics will transform the way the SEC performs its mission and provide a proactive view into how technology impacts capital markets The SEC will derive significant and measurable performance improvements in core operations and increase value for users through the use of automated enterprise processes
The continuing implementation of OITrsquos Technology Transformation Plan (ldquoWorking Smarterrdquo) in FY 2015 will support vital technology initiatives It will ensure the SECrsquos business processes are streamlined integrated and implemented using the best technology available
While the SEC has made significant strides in its multi-year path towards a strong sustainable internal control posture the agency will continue to dedicate its energies towards remediating the significant deficiency in information security During FY 2015 OFM will work closely with the Department of Transportationrsquos Federal Shared Services Provider (FSSP) to implement its software upgrade and refine the new Federal government-wide travel management system
41
FY 2015 ANNUAL PERFORMANCE PLAN bull FY 2015 CBJ FY 2015 APP AND FY 2013 APR
FY 2015 CBJ FY 2015 APP AND FY 2013 APR bull FY 2015 ANNUAL PERFORMANCE PLAN
Strategic Objective 41 The SEC promotes a results-oriented work environment that attracts engages and retains a technically proficient and diverse workforce including leaders who provide motivation and strategic direction
Goal Leader(s) Director Office of Human Resources Director Office of Minority and Women Inclusion
PERFORMANCE GOAL 411 Turnover
Description When employee morale and engagement are high high-performing employees tend to remain in the organization Although turnover can fluctuate based on a variety of factors the SEC aims to keep its turnover rate relatively low below 8 per year
FY 2013 FY 2013 FY 2014 FY 2015 Fiscal Year FY 2008 FY 2009 FY 2010 FY 2011 FY 2012 Plan Actual Estimate Request
Percent turnover 62 37 5 64 658 lt8 658 lt8 lt8
Responsible DivisionOffice Office of Human Resources
Data Source The National Business Center at Department of Interior (DOI)
PERFORMANCE GOAL 412 Expanding staff expertise
Description Internal training and hiring programs are designed to help the agency recruit and develop a diverse and qualified staff with the key skills industry knowledge and expertise to support the SEC mission In particular there is a need to train examiners attorneys economists and other experts for subject matter expertise relevant to the marketplace and investment and trading practices This metric tracks whether certain areas requiring significant training are being addressed The agency will track the number of SEC staff participants in mission-focused training and development programs and will report on specific items through the use of post-course evaluations to assess the impact and results of this training on a five-point scale
FY 2013 FY 2013 FY 2014 FY 2015 Fiscal Year FY 2008 FY 2009 FY 2010 FY 2011 FY 2012 Plan Actual Estimate Request
Mission-focused training attendance Prior year data not available NA NA 12000 12120
Post-course evaluations of mission-Prior year data not available NA NA 45 45
focused training
Responsible DivisionOffice Office of Human Resources
Data Source Course Attendance Identified in LEAP (Instructor-led courses only) and End of Course Evaluation Report Summary provided by Metrics that Matter
PERFORMANCE GOAL 413 Number of diversity-related partnershipsalliances
Description Increased numbers of diversity-related partnerships or alliances with professional associations and educational organizations provide opportunities to educate students about the SECrsquos work and to recruit career professionals from all segments of society The SEC will track the number of partnerships andor alliances with diverse professional associations and educational organizations
FY 2013 FY 2013 FY 2014 FY 2015 Fiscal Year FY 2008 FY 2009 FY 2010 FY 2011 FY 2012 Plan Actual Estimate Request
Number of partnershipsalliances Prior-year data 2 10 12 15 13 15
not available
Responsible DivisionOffice Office of Minority Women and Inclusion
Data Source Office of Minority Women and Inclusion Internal Records and Section 342 of DFA
15
42
FY 2015 ANNUAL PERFORMANCE PLAN bull FY 2015 CBJ FY 2015 APP AND FY 2013 APR
PERFORMANCE GOAL 414 Sur vey rankings
Description Annual and other rankings together with other metrics and indicators of federal government agencies will be used as one kind of metric to determine the SECrsquos overall success in improving employee morale and employee engagement
FY 2013 FY 2013 FY 2014 FY 2015 Fiscal Year FY 2008 FY 2009 FY 2010 FY 2011 FY 2012 Plan Actual Estimate Request
Best Places to Work ranking Ranked Ranked Ranked Ranked Ranked Ranked Ranked Ranked Ranked 3 11 24 27 19 20 15 5 5
Average of employee engagement Prior-year data not available NA 61 75 75
and global satisfaction index
Responsible DivisionOffice Office of Human Resources
Data Source Annual Partnership for Public Service calculated ranking based on Annual Employee Viewpoint Survey (EVS) administered by OPM and Average of Employee Engagement and Global Satisfaction Index from OPM Employee Viewpoint Survey (EVS)
PERFORMANCE GOAL 415 Bench strength
Description To maintain mission effectiveness it is essential that attrition in the leadership ranks is quickly addressed by having a highly qualified and diverse pool of candidates ready to assume those critical roles Success is measured by the percentage of key leadership positions for which the SEC has identified a pool of qualified candidates
FY 2013 FY 2013 FY 2014 FY 2015 Fiscal Year FY 2008 FY 2009 FY 2010 FY 2011 FY 2012 Plan Actual Estimate Request
Data point under development NA NA NA NA NA NA NA TBD TBD
Responsible DivisionOffice Office of Human Resources
Data Source TBD
Strategic Objective 42 The SEC encourages a collaborative environment across divisions and offices and leverages technology and data to fulfill its mission more effectively and efficiently
Goal Leader(s) Director Office of Information Technology
PERFORMANCE GOAL 421 Ensure SECrsquos systems and applications are available
Description The SEC aims to enhance its computing infrastructure to eliminate down time if systems at one site fail among other objectives This metric will capture the percentage of systems and applications that can fail over within 8 hours
FY 2013 FY 2013 FY 2014 FY 2015 Fiscal Year FY 2008 FY 2009 FY 2010 FY 2011 FY 2012 Plan Actual Estimate Request
Percentage of servers virtualized NA 12 22 38 79 85 93 94 95
Percentage fail over within 8 hours NA NA NA NA NA NA NA 100 100
Responsible DivisionOffice Office of Information Technology
Data Source OIT Network Operations Center (NOC) ndash automated network monitoring tools
43
FY 2015 CBJ FY 2015 APP AND FY 2013 APR bull FY 2015 ANNUAL PERFORMANCE PLAN
PERFORMANCE GOAL 422 Equip the SEC with an enhanced technology infrastructure to support enterprise infrastructure
Description The SEC aims to promote collaboration and information sharing across the enterprise To improve efficiency and knowledge management the SEC will consolidate and centralize its collaborative technologies to a commonly used enterprise set by 2020 This metric will measure the percentage of the SECrsquos offices and divisions that utilize centralized enterprise collaboration solutions
FY 2013 FY 2013 FY 2014 FY 2015 Fiscal Year FY 2008 FY 2009 FY 2010 FY 2011 FY 2012 Plan Actual Estimate Request
Number of enterprise solutions Prior-year data not 10 20 25 30 30 35 40
available
Responsible DivisionOffice Office of Information Technology
Data Source Approved software applications list
PERFORMANCE GOAL 423 Expand the SECrsquos video teleconferencing (VTC) capabilities to support an increasingly geographically dispersed workforce
Description The SEC seeks to develop a state of the art video teleconference solution that allows users to conduct a videoteleconference meeting between HQ regional offices and multiple endpoints simultaneously collaborate and share presentation materials and use VoIP technology to host video teleconferences from their officesworkspaces with other SEC users or conference rooms This metric will measure the average ldquouptimerdquo or availability of all VTC systems
FY 2013 FY 2013 FY 2014 FY 2015 Fiscal Year FY 2008 FY 2009 FY 2010 FY 2011 FY 2012 Plan Actual Estimate Request
Availability rate for VTC solutions Prior-year data not available 75 80 9999 9999
Responsible DivisionOffice Office of Information Technology
Data Source Telecommunications monitoring system
PERFORMANCE GOAL 424 Pursue continuous technology cost reductions and efficiencies
Description Recent technology enhancements ndash eg data center consolidation virtualization and maintenance contract reductions ndash are producing technical efficiencies and cost savings This metric will measure the amount of these costs savings
FY 2013 FY 2013 FY 2014 FY 2015 Fiscal Year FY 2008 FY 2009 FY 2010 FY 2011 FY 2012 Plan Actual Estimate Request
Percent reduction in operational run 1-3 187 1 2 cost leveraging technology and cost cost reduction reduction process efficiencies
Prior-year data not available reduction in steady
reduction in steady
in run costs
in run costs
state run state run costs costs1
Responsible DivisionOffice Office of Information Technology
Data Source OIT Network Operations Center (NOC)
The higher than expected FY 2013 actual of 187 percent is due to one-time technologies enhancements resulting from the data consolidation and virtualization 1
44
FY 2015 ANNUAL PERFORMANCE PLAN bull FY 2015 CBJ FY 2015 APP AND FY 2013 APR
PERFORMANCE GOAL 425 Enhance the SECrsquos enterprise data warehouse infrastructure and performance
Description The Enterprise Data Warehouse (EDW) infrastructure will enable the provisioning of data to Commission staff for search and analysis through a virtual data warehouse platform This metric will measure the availability of EDW and data sources
FY 2013 FY 2013 FY 2014 FY 2015 Fiscal Year FY 2008 FY 2009 FY 2010 FY 2011 FY 2012 Plan Actual Estimate Request
Availability rate for the EDW infrastructure components in Prior-year data not available NA NA 99 99 production
Responsible DivisionOffice Office of Information Technology
Data Source OIT Network Operations Center (NOC) ndash automated network monitoring tools
Strategic Objective 43 The SEC maximizes the use of agency resources by continually improving agency operations and bolstering internal controls
Goal Leader(s) Chief Financial Officer Chief Operations Officer
PERFORMANCE GOAL 431 Financial audit results
Description Under the Accountability of Taxpayer Dollars Act of 2002 the agency is required to meet all proprietary and budgetary accounting guidelines for federal agencies and to undergo annual audits The SECrsquos audits are conducted by the Government Accountability Office
FY 2013 FY 2013 FY 2014 FY 2015 Fiscal Year FY 2008 FY 2009 FY 2010 FY 2011 FY 2012 Plan Actual Estimate Request
Unqualified opinion Yes Yes Yes Yes Yes Yes Yes Yes Yes
Material weaknesses 0 1 2 0 0 0 0 0 0
Significant deficiency 3 6 0 4 2 0 1 0 0
Responsible DivisionOffice Office of Financial Management
Data Source GAO SEC Financial Audit Report
PERFORMANCE GOAL 432 Assurance statement on internal control over operations
Description In accordance with OMB A-123 and Section 961 of the Dodd-Frank Act the SEC conducts an annual assessment of the effectiveness of internal controls The SEC will continue to develop its Operational Risk program and enhance cross-organizational processes to support all division and office management assurance statements Success is measured by the quality of risk and control assessments and management self-identification and resolution of improvement opportunities
FY 2013 FY 2013 FY 2014 FY 2015 Fiscal Year FY 2008 FY 2009 FY 2010 FY 2011 FY 2012 Plan Actual Estimate Request
Unqualified opinion Yes Yes Yes Yes Yes Yes Yes Yes Yes
Material weakness 0 0 0 0 0 0 0 0 0
Responsible DivisionOffice Office of the Chief Operating Officer
Data Source SEC Financial Audit Report
45
FY 2015 CBJ FY 2015 APP AND FY 2013 APR bull FY 2015 ANNUAL PERFORMANCE PLAN
1
PERFORMANCE GOAL 433 Timely completion of corrective action on Office of Inspector General (OIG) and the GAO audit recommendations1
Description Timely completion of audit recommendations is an important SEC priority This metric measures how well the Commission is doing in completing corrective action on OIG audit recommendations within established timeframes
FY 2013 FY 2013 FY 2014 FY 2015 Fiscal Year FY 2008 FY 2009 FY 2010 FY 2011 FY 2012 Plan Actual Estimate Request
OIG recommendations completed in Prior-year data not available NA 78 80 80
less than one year
Responsible DivisionOffice Office of the Chief Operating Officer
Data Source Audit Recommendation Tracking System
This measure was developed as part of the FY 2014-2018 SEC strategic planning process Currently there is no methodology in place to capture data for tracking all GAO Audit recommendations OCOO will determine a timeframe for establishing a methodology during FY 2014
46
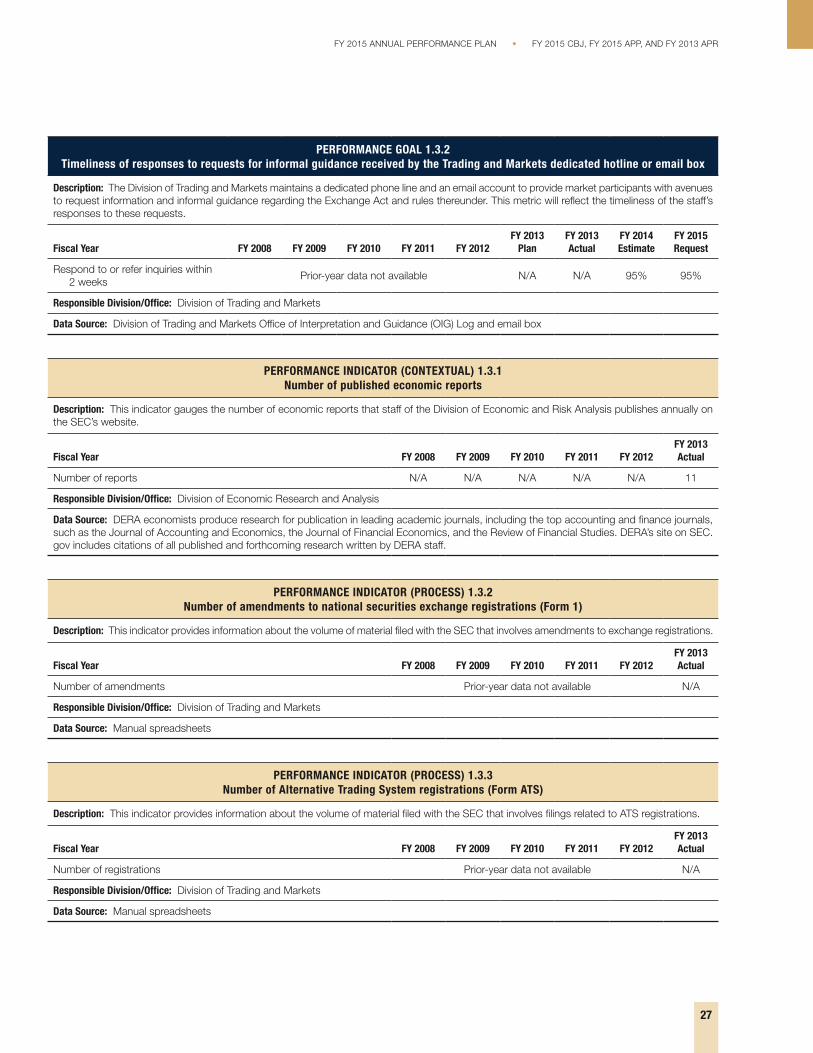
FY 2015 ANNUAL PERFORMANCE PLAN bull FY 2015 CBJ FY 2015 APP AND FY 2013 APR
PERFORMANCE GOAL 132 Timeliness of responses to requests for informal guidance received by the Trading and Markets dedicated hotline or email box
Description The Division of Trading and Markets maintains a dedicated phone line and an email account to provide market participants with avenues to request information and informal guidance regarding the Exchange Act and rules thereunder This metric will reflect the timeliness of the staffrsquos responses to these requests
FY 2013 FY 2013 FY 2014 FY 2015 Fiscal Year FY 2008 FY 2009 FY 2010 FY 2011 FY 2012 Plan Actual Estimate Request
Respond to or refer inquiries within Prior-year data not available NA NA 95 95
2 weeks
Responsible DivisionOffice Division of Trading and Markets
Data Source Division of Trading and Markets Office of Interpretation and Guidance (OIG) Log and email box
PERFORMANCE INDICATOR (CONTEXTUAL) 131 Number of published economic reports
Description This indicator gauges the number of economic reports that staff of the Division of Economic and Risk Analysis publishes annually on the SECrsquos website
FY 2013 Fiscal Year FY 2008 FY 2009 FY 2010 FY 2011 FY 2012 Actual
Number of reports NA NA NA NA NA
Responsible DivisionOffice Division of Economic Research and Analysis
Data Source DERA economists produce research for publication in leading academic journals including the top accounting and finance journals such as the Journal of Accounting and Economics the Journal of Financial Economics and the Review of Financial Studies DERArsquos site on SEC gov includes citations of all published and forthcoming research written by DERA staff
PERFORMANCE INDICATOR (PROCESS) 132 Number of amendments to national securities exchange registrations (Form 1)
Description This indicator provides information about the volume of material filed with the SEC that involves amendments to exchange registrations
FY 2013 Fiscal Year FY 2008 FY 2009 FY 2010 FY 2011 FY 2012 Actual
Number of amendments Prior-year data not available NA
Responsible DivisionOffice Division of Trading and Markets
Data Source Manual spreadsheets
PERFORMANCE INDICATOR (PROCESS) 133 Number of Alternative Trading System registrations (Form ATS)
Description This indicator provides information about the volume of material filed with the SEC that involves filings related to ATS registrations
FY 2013 Fiscal Year FY 2008 FY 2009 FY 2010 FY 2011 FY 2012 Actual
Number of registrations Prior-year data not available NA
Responsible DivisionOffice Division of Trading and Markets
Data Source Manual spreadsheets
11
27
FY 2015 CBJ FY 2015 APP AND FY 2013 APR bull FY 2015 ANNUAL PERFORMANCE PLAN
PERFORMANCE INDICATOR (PROCESS) 134 Number of new investment product submissions
Description This indicator provides information about the volume of material filed with the SEC that involves new product submissions pursuant to Rule 19b-4(e) of the Exchange Act
FY 2013 Fiscal Year FY 2008 FY 2009 FY 2010 FY 2011 FY 2012 Actual
Number of submissions Prior-year data not available NA
Responsible DivisionOffice Division of Trading and Markets
Data Source Manual spreadsheets
Strategic Objective 14 The SEC engages with a multitude of stakeholders to inform and enhance regulatory activities domestically and internationally
Goal Leader(s) Director Office of International Affairs
PERFORMANCE GOAL 141 Super visory cooperation requests from foreign authorities for SEC assistance and SEC requests for assistance on supervisory cooperation from foreign authorities
Description The SEC makes requests to foreign authorities for supervisory cooperation assistance and responds to such requests from foreign regulators through both formal mechanisms such as supervisory memoranda of understanding and on an ad hoc basis
FY 2013 FY 2013 FY 2014 FY 2015 Fiscal Year FY 2008 FY 2009 FY 2010 FY 2011 FY 2012 Plan Actual Estimate Request
Supervisory cooperation requests Prior-year data not available NA 118 NA NA
from foreign authorities
SEC requests for assistance on supervisory cooperation from Prior-year data not available NA 25 NA NA foreign authorities
Responsible DivisionOffice Office of International Affairs
Data Source International Program Oversight Database and Business Objects reports
PERFORMANCE GOAL 142 Number of non-US regulators trained
Description This metric shows the reach of the SECrsquos technical assistance programs for regulators around the world The SEC conducts these training sessions to assist countries in developing and maintaining robust protections for investors and promoting cross-border enforcement and supervisory assistance
FY 2013 FY 2013 FY 2014 FY 2015 Fiscal Year FY 2008 FY 2009 FY 2010 FY 2011 FY 2012 Plan Actual Estimate Request
Number of non-US regulators Prior-year data not 1997 1765 1785 1370 1716 1400 1400
available
Responsible DivisionOffice Office of International Affairs
Data Source International Program Oversight Database and Business Objects reports
28
Strategic Goal 2 Foster and Enforce Compliance with the Federal Securities Laws
In FY 2015 the agency is requesting a total of 502 FTE for Goal 2 The additional resources will allow the SEC to continue building out the agencyrsquos new responsibility areas and begin addressing the disparity between the number of exam staff and the growing number and complexity of registered firms Additionally the Commission will be able to take prompt action to halt misconduct sanction wrongdoers effectively and return funds to harmed investors In all the agency plans to devote approximately $1802 million to enforcing compliance with the federal securities laws
Budgeting for the Future (FY 2015)
In FY 2015 the SEC will continue to make improvements to its National Examination and Enforcement programs These improvements include hiring staff with new skill sets enhancing their technologies streamlining processes expanding the SECrsquos training programs improving the processing of the thousands of tips the agency receives annually and improving risk assessment techniques These and other significant efforts contribute to the agencyrsquos objective of creating an enduring structure for improved protection of investors and markets
In FY 2015 the National Examination program will continue its focus on high-risk entities and activities Additional staff will among other things improve risk assessment and surveillance functions and continue to address the disparity between the number of staff and the size and complexity of regulated entities The staff will perform targeted sweep and cause examinations including examinations over new or expanded areas of the agencyrsquos jurisdiction
The Enforcement program plans to build on significant changes implemented in prior fiscal years and will work to meet new challenges expected in FY 2015 In order to effectively meet these challenges the Enforcement program is aggressively adopting new methods initiatives and organizational reforms to ensure the best possible use of available resources to strengthen investor confidence in the US financial markets and to send a strong message of deterrence to would-be violators of the securities laws
To improve the quality and efficiency of its investigations the SEC has put seasoned investigators on the front lines created specialized units focused on specific programmatic priorities enhanced case management systems and increased coordination efforts with other offices and divisions in the agency and other regulators In FY 2015 the SEC plans to obtain relief on one or more claims from approximately 92 percent of enforcement actions (Performance Goal 231) The SEC has implemented controls and strategies to resolve actions on a favorable basis while at the same time it will not hesitate to file matters on a contested basis where a favorable settlement was unavailable before filing The agency also plans to reduce in FY 2015 the average number months between the opening of an investigation and the commencement of an enforcement action arising out of that investigation (Performance Goal 233)
Under the Sarbanes-Oxley Act of 2002 the SEC can use Fair Funds to redirect penalties collected from securities law violators to the victims of their wrongdoing The SEC is committed to the timely collection and distribution of penalties and disgorgement funds and has adopted a variety of new measures for monitoring its progress (Performance Goal 235)
29
FY 2015 ANNUAL PERFORMANCE PLAN bull FY 2015 CBJ FY 2015 APP AND FY 2013 APR
FY 2015 CBJ FY 2015 APP AND FY 2013 APR bull FY 2015 ANNUAL PERFORMANCE PLAN
Strategic Objective 21 The SEC fosters compliance with the federal securities laws
Goal Leader(s) Director Office of Compliance Inspections and Examinations
PERFORMANCE GOAL 211 Number of industr y outreach and education programs targeted to areas identified as raising particular compliance risks
Description Targeted communication with industry participants on topics shaping the examination program is intended to enhance compliance practices and prevent violations before they occur This metric identifies the number of major outreach efforts conducted including the SECrsquos national and regional compliance outreach events published risk alerts and other educational programs and initiatives
FY 2013 FY 2013 FY 2014 FY 2015 Fiscal Year FY 2008 FY 2009 FY 2010 FY 2011 FY 2012 Plan Actual Estimate Request
Number of major outreach efforts Prior-year data 6 5 12 14 15 16
not available
Responsible DivisionOffice Office of Compliance Inspections and Examinations
Data Source Internal tracking although the events noted above are referenced in the SECrsquos website
PERFORMANCE GOAL 212 Percentage of firms receiving deficiency letters that take corrective action in response to all exam findings
Description At the conclusion of examinations the staff communicates identified deficiencies to registrants in the form of a deficiency letter Registrants are then given a chance to respond to staff findings and often take action to remedy any problems and potential risks including monetary compensation to clients and enhancements to disclosures policies and procedures Most often registrants respond that they have corrected the deficiencies and implemented measures to prevent recurrence
FY 2013 FY 2013 FY 2014 FY 2015 Fiscal Year FY 2008 FY 2009 FY 2010 FY 2011 FY 2012 Plan Actual Estimate Request
Percentage 93 94 90 93 92 93 86 87 88
Responsible DivisionOffice Office of Compliance Inspections and Examinations
Data Source Tracking and Reporting Exam National Documentation System (TRENDS)
Strategic Objective 22 The SEC promptly detects and deters violations of the federal securities laws
Goal Leader(s) Director Office of Compliance Inspections and Examinations
PERFORMANCE GOAL 221 Percentage of investment advisers investment companies and broker-dealers examined during the year
Description This metric indicates the number of registrants examined by the SEC or an SRO as a percentage of the total number of registrants This metric includes all types of examinations risk priority examinations cause inspections to follow up on tips and complaints limited-scope special inspections to probe emerging risk areas oversight examinations of broker-dealers to test compliance and the quality of examinations by FINRA
FY 2013 FY 2013 FY 2014 FY 2015 Fiscal Year FY 2008 FY 2009 FY 2010 FY 2011 FY 2012 Plan Actual Estimate Request
Investment advisers 14 10 9 8 8 10 9 9 12
Investment companies 23 29 10 13 12 14 11 12 15
Broker-dealers (exams by SEC 57 54 44 58 49 50 46 48 50
and SROs)
Responsible DivisionOffice Office of Compliance Inspections and Examinations
Data Source Tracking and Reporting Exam National Documentation System (TRENDS) (IA IC and BD SEC data) and SRO Databases (BD SRO Data)
17
30
FY 2015 ANNUAL PERFORMANCE PLAN bull FY 2015 CBJ FY 2015 APP AND FY 2013 APR
PERFORMANCE GOAL 222 Percentage of compliance exams that are timely concluded in accordance with the Office of Compliance Inspections
and Examinationrsquos (OCIE) statutory deadline
Description The staff conducts examinations each year of registered entities including investment advisers investment company complexes transfer agents and broker-dealers The staff strives to complete its examinations and communicate findings in the most efficient and effective manner and within its statutory deadline This metric reflects the percentage of examinations concluded within the statutory deadline
FY 2013 FY 2013 FY 2014 FY 2015 Fiscal Year FY 2008 FY 2009 FY 2010 FY 2011 FY 2012 Plan Actual Estimate Request
Percentage Prior-year data NA NA NA 100 100 100 100
not available
Responsible DivisionOffice Office of Compliance Inspections and Examinations
Data Source Tracking and Reporting Exam National Documentation System (TRENDS)
PERFORMANCE GOAL 223 Number of joint exams information sharing agreements and formal meetings with other regulators
Description The SEC attempts to coordinate and collaborate with other regulators on areas of mutual interest This helps to ensure that all regulators are informed of on-going risks and issues related to broad market practices as well as specific entities of mutual interest This cooperation is critical to the exam program to ensure that certain higher risk firms and activities are addressed in the most efficient and effective manner This metric tracks critical cooperation activities that are occurring between the SECrsquos exam program and other regulators
FY 2013 FY 2013 FY 2014 FY 2015 Fiscal Year FY 2008 FY 2009 FY 2010 FY 2011 FY 2012 Plan Actual Estimate Request
Number of joint exams active sharing Prior-year data not available NA NA 85 100
agreements and formal meetings
Responsible DivisionOffice Office of Compliance Inspections and Examinations
Data Source Various (including internal tracking and TRENDS)
PERFORMANCE INDICATOR (CONTEXTUAL) 221 Percentage of exams that identify deficiencies the percentage that result in a ldquosignificant findingrdquo
and the percentage referred to the Division of Enforcement
Description Examiners find a wide range of deficiencies during examinations Some of the deficiencies are more technical in nature such as failing to include all information that is required to be in a record However other deficiencies may cause harm to customers or clients of a firm have a high potential to cause harm or reflect recidivist misconduct The latter deficiencies are among those categorized as ldquosignificantrdquo This indicator identifies the percentage of exams that identified deficiencies that resulted in significant deficiency findings and that were referred to Enforcement
FY 2013 Fiscal Year FY 2008 FY 2009 FY 2010 FY 2011 FY 2012 Actual
Percentage that identify deficiencies Prior-year data 72 82 80 80
not available
Percentage that result in a ldquosignificant findingrdquo Prior-year data 42 42 42 35
not available
Percentage referred to the Division of Enforcement Prior-year data not available 13
Responsible DivisionOffice Office of Compliance Inspections and Examinations
Data Source Tracking and Reporting Exam National Documentation System (TRENDS)
31
PERFORMANCE INDICATOR (OUTPUT) 222 Number of cause exams that result from tips complaints and referrals
Description Analysis of a tip can support the request for a cause exam This indicator would identify the number of SEC cause exams that result from tips collected through outreach efforts
Fiscal Year FY 2008 FY 2009 FY 2010 FY 2011 FY 2012 FY 2013 Actual
Number of cause exams Prior-year data not available
NA NA NA 222
Responsible DivisionOffice Office of Compliance Inspections and Examinations
Data Source Tracking and Reporting Exam National Documentation System (TRENDS)
PERFORMANCE INDICATOR (OUTPUT) 223 Number of rule-making initiatives assisted by the National Exam Program
Description The examination program interacts with registrants on a regular basis and this work provides critical feedback to ensuring effective and practical rulemaking and policy efforts This indicator tracks how frequently the examination program assists with rulemaking initiatives
Fiscal Year FY 2008 FY 2009 FY 2010 FY 2011 FY 2012 FY 2013 Actual
Number of rule-making initiatives assisted by the NEP Prior-year data not available NA
Responsible DivisionOffice Office of Compliance Inspections and Examinations
Data Source Internal tracking
PERFORMANCE INDICATOR (OUTPUT) 224 Number of investigations or inquiries originating from a tip or complaint
Description Analysis of a tip or complaint can result in the need for further enforcement investigation The indicator identifies the volume of SEC investigations that result from tips and complaints received by the SEC
Fiscal Year FY 2008 FY 2009 FY 2010 FY 2011 FY 2012 FY 2013 Actual
Number of investigations Prior-year data not available
303 349 296 289
Responsible DivisionOffice Division of Enforcement
Data Source HUB case management and tracking system for the Division of Enforcement
PERFORMANCE INDICATOR (OUTPUT) 225 SEC investigations in which requests for access to information were granted by the SEC to other authorities
such as SROs or other state federal and foreign enforcement authorities
Description The SEC works closely with other regulators and authorities This measure identifies the number of investigations in which the SEC granted one or more authorities access to information concerning an investigation during the fiscal year This may include requests for access to SEC investigative files concerning investigations that the SEC continues to pursue as well as those in which the SEC has completed its investigation
Fiscal Year FY 2008 FY 2009 FY 2010 FY 2011 FY 2012 FY 2013 Actual
Number of investigations Prior-year data not available
492 586 515 504
Responsible DivisionOffice Division of Enforcement
Data Source HUB case management and tracking system for the Division of Enforcement
32
FY 2015 CBJ FY 2015 APP AND FY 2013 APR bull FY 2015 ANNUAL PERFORMANCE PLAN
FY 2015 ANNUAL PERFORMANCE PLAN bull FY 2015 CBJ FY 2015 APP AND FY 2013 APR
PERFORMANCE INDICATOR (OUTPUT) 226 Requests from foreign authorities for SEC assistance and SEC requests for assistance from foreign authorities
Description Each year the SEC makes hundreds of requests for enforcement assistance to foreign regulators while responding to hundreds of such requests from other nations To facilitate this type of assistance and encourage other countries to enact laws necessary to allow regulators to cooperate with their foreign counterparts the SEC has entered into bilateral information sharing arrangements as well as the Multilateral Memorandum of Understanding an information-sharing arrangement negotiated through the International Organization of Securities Commissions (IOSCO)
FY 2013 Fiscal Year FY 2008 FY 2009 FY 2010 FY 2011 FY 2012 Actual
Number of requests from foreign authorities 414 408 457 492 450
Number of SEC requests 594 774 605 772 718
Responsible DivisionOffice Office of International Affairs
Data Source International Program Oversight Database and Business Objects reports
Strategic Objective 23 The SEC prosecutes violations of federal securities laws and holds violators accountable through appropriate sanctions and remedies
Goal Leader(s) Director Division of Enforcement
PERFORMANCE GOAL 231 Percentage of enforcement actions in which the Commission obtained relief on one or more claims
Description This metric identifies as to all parties to enforcement actions that were resolved in the fiscal year the percentage against whom the Commission obtained a judgment or order entered on consent a default judgment a judgment of liability on one or more charges andor the imposition of monetary or other relief
FY 2013 FY 2013 FY 2014 FY 2015 Fiscal Year FY 2008 FY 2009 FY 2010 FY 2011 FY 2012 Plan Actual Estimate Request
Percentage 92 92 92 93 89 92 93 92 92
Responsible DivisionOffice Division of Enforcement
Data Source HUB case management and tracking system for the Division of Enforcement
PERFORMANCE GOAL 232 Percentage of first enforcement actions filed within two years of the opening of an investigation
Description This metric concerns the pace of investigations that lead to the filing of enforcement actions Specifically this metric captures the rate at which the first enforcement action arising out of an investigation was filed within two years of the opening of the investigation If the investigation was preceded by a matter under inquiry the metric draws on the date of the opening of the matter under inquiry In conducting investigations the Enforcement program continually strives to balance the need for complete effective and fair investigations with the need to file enforcement actions in as timely a manner as possible
FY 2013 FY 2013 FY 2014 FY 2015 Fiscal Year FY 2008 FY 2009 FY 2010 FY 2011 FY 2012 Plan Actual Estimate Request
Percentage 62 70 67 61 63 65 58 65 65
Responsible DivisionOffice Division of Enforcement
Data Source HUB case management and tracking system for the Division of Enforcement
508
717
33
FY 2015 CBJ FY 2015 APP AND FY 2013 APR bull FY 2015 ANNUAL PERFORMANCE PLAN
PERFORMANCE GOAL 233 Average months between opening a matter under inquiry or an investigation and commencing an enforcement action
Description This metric captures the average number of months between the opening of an investigation and the filing of the first enforcement action arising out of that investigation If the investigation was preceded by a matter under inquiry the metric draws on the date of opening of the matter inquiry In conducting investigations the enforcement program continually strives to balance the need for complete effective and fair investigation with the need to file enforcement actions in as timely a manner as possible While not all investigations result in the filing of enforcement actions this metric provides information concerning the pace of investigations that do lead to such actions and supplements the previous goal which measures the percentage of first enforcement actions filed within two years
FY 2013 FY 2013 FY 2014 FY 2015 Fiscal Year FY 2008 FY 2009 FY 2010 FY 2011 FY 2012 Plan Actual Estimate Request
Months Prior-year data not available 22 21 20 21 20 20
Responsible DivisionOffice Division of Enforcement
Data Source HUB case management and tracking system for the Division of Enforcement
PERFORMANCE GOAL 234 Percentage of debts where either a payment has been made or a collection activity has
been initiated within 180 days of the due date of the debt
Description The SEC can seek a wide range of remedies for failure to comply with the securities laws These remedies include civil monetary penalties and disgorgement When the remedies are imposed by the SEC or the Federal district court payments must be made by a certain date This metric identifies the percentage of debts where debtors have made payments or the SEC has initiated a collection activity within 180 days of the due date Such collection activities include among other things demand letters negotiation of payment plans enforcing the payment of the debt through the courts or other judicial remedies
FY 2013 FY 2013 FY 2014 FY 2015 Fiscal Year FY 2008 FY 2009 FY 2010 FY 2011 FY 2012 Plan Actual Estimate Request
Percentage 88 90 86 91 92 92 95 95 95
Responsible DivisionOffice Division of Enforcement
Data Source DELPHI
PERFORMANCE GOAL 235 Percentage of Fair Fund and disgorgement fund plans that have distributed 80 percent of the available
funds for distribution within twenty four (24) months of the approval of the distribution plan
Description In addition to other types of relief the SEC may seek orders requiring parties to disgorge any money obtained through wrongdoing The SEC also is empowered to seek civil penalties for violations of the securities laws Where appropriate the SEC has sought to return disgorged funds to harmed investors and as a result of the Fair Funds provisions of the Sarbanes-Oxley Act and the Dodd-Frank Act to combine amounts paid as penalties with disgorged funds or to create a Fair Fund from penalties only to reduce losses to injured parties and to maximize funds available for distribution This metric identifies the percentage of distribution plans that reached a critical mass during the fiscal year and within twenty four (24) months of the approval of the distribution plan The distribution plan includes the timeline and procedures required to return the funds to injured investors This reflects Commission-wide efforts to implement plans to return money to investors quickly Any funds not returned to investors are sent to the US Treasury or the Investor Protection Fund established pursuant to Section 21F(g) of the Securities Exchange Act of 1934 Neither disgorgement nor penalties are used for the SECrsquos own expenses
FY 2013 FY 2013 FY 2014 FY 2015 Fiscal Year FY 2008 FY 2009 FY 2010 FY 2011 FY 2012 Plan Actual Estimate Request
Percentage Prior-year data not available 80 80 73 78 82
Responsible DivisionOffice Division of Enforcement
Data Source HUB case management and tracking system for the Division of Enforcement and Distributions Management System
34
PERFORMANCE INDICATOR (CONTEXTUAL) 232 Total amount distributed within the fiscal year and the number of Fair Funds from which those distributions came
Description In its enforcement actions the SEC may seek to return funds to harmed investors through disgorgement of ill-gotten gains or through the Fair Funds provision of the Sarbanes-Oxley Act This provision permits the SEC to combine amounts paid as penalties with disgorged funds or to create a Fair Fund from penalties only to reduce losses to injured parties This reflects the SECrsquos efforts to return funds to injured investors This indicator identifies the total amount distributed within the fiscal year and the number of Fair Funds from which those distributions came This indicator may increase or decrease in dollar amount and number of distribution funds based on the number of SEC enforcement actions brought involving distributions amounts ordered and paid in those actions and other factors Due to the variation in reporting timelines established for each individual distribution reported amounts are based on the agencyrsquos best available information Reported amounts do not include those funds distributed through receiverships Any funds not returned to investors are sent to the US Treasury or the Investor Protection Fund established pursuant to Section 21F(g) of the Securities Exchange Act of 1934 Neither disgorgement nor penalties are used for the Commissionrsquos own expenses
Fiscal Year FY 2008 FY 2009 FY 2010 FY 2011 FY 2012 FY 2013 Actual
Amount distributed (in millions) Prior-year data not available 815 251
Number of Fair Funds Prior-year data not available 31 22
Responsible DivisionOffice Division of Enforcement
Data Source HUB case management and tracking system for the Division of Enforcement Distributions Management System
PERFORMANCE INDICATOR (CONTEXTUAL) 231 Percentage of filed enforcement actions reflecting characteristics that present enhanced risk to investors and markets as
measured by the nature of the investigation conduct parties and impact
Description This indicator assesses the quality of the cases filed by the Division of Enforcement The indicator focuses on cases filed by the SEC that involve factors reflecting enhanced risk to investors and markets Such cases may involve (i) those identified through risk analytics and cross-disciplinary initiatives to reveal difficult-to-detect or early stage misconduct thus minimizing investor loss and preventing the spread of unlawful conduct and practices (ii) particularly egregious or widespread misconduct and investor harm (iii) vulnerable victims (iv) a high degree of scienter (v) involvement of individuals occupying substantial positions of authority or having fiduciary obligations or other special responsibilities to investors (vi) involvement of recidivists (vii) high amount of investor loss prevented (viii) misconduct that is difficult to detect due to the complexity of products transactions and practices (ix) use of innovative investigative or analytical techniques (x) effective coordination with other law enforcement partners andor (xi) whether the matter involves markets transactions or practices identified as an enforcement priority or that advances the programmatic priorities of other SEC Divisions or Offices
Fiscal Year FY 2008 FY 2009 FY 2010 FY 2011 FY 2012 FY 2013 Actual
Percentage Prior-year data not available NA NA
Responsible DivisionOffice Division of Enforcement
Data Source HUB case management and tracking system for the Division of Enforcement
35
FY 2015 ANNUAL PERFORMANCE PLAN bull FY 2015 CBJ FY 2015 APP AND FY 2013 APR
PERFORMANCE INDICATOR (OUTPUT) 233 Percent of enforcement actions filed that arose out of national priority investigations
Description The Division of Enforcement conducts many enforcement actions each year that can be characterized as high impact and of national priority High impact or national priority investigations include those investigations which are significant for one or more of the following reasons ndashthe matter (i) presents an opportunity to send a particularly strong and effective message of deterrence including with respect to markets products and transactions that are newly developing or that are long established but which by their nature present limited opportunities to detect wrongdoing and thus to deter misconduct (ii) involves particularly egregious or extensive misconduct (iii) involves potentially widespread and extensive harm to investors (iv) involves misconduct by persons occupying positions of substantial authority or responsibility or who owe fiduciary or other enhanced duties and obligations to a broad group of investors or others (v) involves potential wrongdoing as prohibited under newly-enacted legislation or regulatory rules (vi) concerns potential misconduct that occurred in connection with products markets transactions or practices that pose particularly significant risks for investors or a systemically important sector of the market (vii) involves a substantial number of potential victims and or particularly vulnerable victims (viii) involves products markets transactions or practices that the Enforcement Division has identified as priority areas (ie conduct relating to the financial crisis fraud in connection with mortgage-related securities financial fraud involving public companies whose stock is widely held misconduct by investment advisers and matters involving priorities established by particular regional offices or the specialized units) andor (ix) provides an opportunity to pursue priority interests shared by other law enforcement agencies on a coordinated basis
Fiscal Year FY 2008 FY 2009 FY 2010 FY 2011 FY 2012 FY 2013 Actual
Percentage Prior-year data not available 10 20 15
Responsible DivisionOffice Division of Enforcement
Data Source HUB case management and tracking system for the Division of Enforcement
PERFORMANCE INDICATOR (CONTEXTUAL) 234 Criminal actions related to conduct under investigation by the SEC
Description In some instances conduct may involve both civil and criminal violations and may be investigated by both the SEC and the criminal authorities This indicator identifies the number of criminal actions that are related to conduct under investigation by the SEC
Fiscal Year FY 2008 FY 2009 FY 2010 FY 2011 FY 2012 FY 2013 Actual
Number of criminal investigations Prior-year data not available
139 134 126 126
Responsible DivisionOffice Division of Enforcement
Data Source HUB case management and tracking system for the Division of Enforcement
PERFORMANCE INDICATOR (OUTPUT) 235 Disgorgement and penalties ordered and the amounts collected
Description In addition to other types of relief the SEC may seek orders requiring parties to disgorge any money obtained through wrongdoing The SEC is also empowered to seek civil penalties for violations of the securities laws In some cases the SEC will seek to obtain large monetary sanctions even in instances where the prospects of collecting on a judgment are slight The rationale for seeking monetary relief in these circumstances is that such relief even when likely uncollectible might become collectible in the future based on the defendantrsquos changed circumstances and also because such relief can serve to deter others from violating the securities laws Where appropriate the SEC has sought to return disgorged funds to harmed investors Funds not returned to investors are sent to the Treasury or the Investor Protection Fund established pursuant to Section 21F(g) of the Securities Exchange Act of 1934 This indicator lists disgorgement and penalties ordered as a result of SEC cases and the amounts collected in those actions This indicator could increase or decrease based on various factors
Fiscal Year FY 2008 FY 2009 FY 2010 FY 2011 FY 2012 FY 2013 Actual
Ordered amounts (in millions) 1030 2442 2846 2806 3104 3424
Collected amounts (in millions) 521 1694 1775 1281 1048 1603
Responsible DivisionOffice Division of Enforcement
Data Source DELPHI
36
FY 2015 CBJ FY 2015 APP AND FY 2013 APR bull FY 2015 ANNUAL PERFORMANCE PLAN
FY 2015 ANNUAL PERFORMANCE PLAN bull FY 2015 CBJ FY 2015 APP AND FY 2013 APR
Strategic Goal 3 Facilitate Access to the Information Investors Need to Make Informed Investment Decisions
The agency is requesting in FY 2015 a total of $2226 million and 651 FTEs towards achieving results in Strategic Goal 3
Budgeting for the Future (FY 2015)
An educated investing public ultimately provides the best defense against fraud and costly mistakes The federal securities laws place great emphasis on assuring that corporations investments companies and other entities provide investors with timely clear complete and accurate financial and non-financial information allowing investors to make wise investment decisions As part of its disclosure program CF and IM will continue in FY 2015 to meet the requirements of the Sarbanes-Oxley Act (Performance Goal 311) Accordingly CF and IM strive to review disclosures made by certain public issuers including issuersrsquo financial statements no less frequently than once every three years Additionally CF staff will strive to issue comments on a timely basis allowing companies seeking to raise capital by building offering schedules around the 30-day standard (Performance Goal 312) and IM will aim to exceed timeliness targets for
reviewing investment company disclosures (Performance Goal 313) Also in FY 2015 CF will continue to improve the quality of information provided to investors by focusing on disclosure by companies of the information most material to investment decision-making
OIEA responds to investment-related complaints and questions from tens of thousands of investors each year In FY 2015 staff is expected to close approximately 60 percent of complaints and inquiries within seven days and about 90 percent within 30 days (Performance Goal 322) The seven-day target has been adjusted to reflect new workload demands In FY 2015 OIEA will continue to refine internal processes and promote staff training to resolve matters OIEA expects to increase of the number of visitors to its investor education web pages by using social media technologies and partnering with the SECrsquos regional offices other federal and state agencies financial industry associations consumer groups and educational organizations on investor education programs OIEA also will continue to participate in a significant number of in-person outreach events in FY 2015 (Performance Goal 321)
Strategic Objective 31 The SEC works to ensure that investors have access to high-quality disclosure materials that facilitate informed investment decision-making
Goal Leader(s) Director Division of Trading and Markets Director Division of Corporation Finance Director Division of Investment Management
PERFORMANCE GOAL 311 Percentage of public companies and investment companies with disclosures reviewed each year
Description The Sarbanes-Oxley Act requires that the SEC review at least once every three years the disclosures of all companies and investment company portfolios reporting under the Exchange Act These reviews help improve the information available to investors and may identify possible violations of the federal securities laws This metric gauges the number of public companies and investment companies reviewed each year
FY 2013 FY 2013 FY 2014 FY 2015 Fiscal Year FY 2008 FY 2009 FY 2010 FY 2011 FY 2012 Plan Actual Estimate Request
Division of Corporation Finance
Corporations 39 40 44 48 48 33 52 33 33
Responsible DivisionOffice Division of Corporation Finance
Data Source Electronic Data Gathering Analysis and Retrieval (EDGAR)Filing Activity Tracking System (FACTS)
Division of Investment Management
Investment Company Portfolios 36 35 35 33 36 33 34 33 33
Responsible DivisionOffice Division of Investment Management
Data Source Microsoft Office Suite Tools
37
FY 2015 CBJ FY 2015 APP AND FY 2013 APR bull FY 2015 ANNUAL PERFORMANCE PLAN
PERFORMANCE GOAL 312 Time to issue initial comments on Securities Act filings
Description The target of 30 days or less has become a de facto industry standard for the maximum time to receive initial comments
FY 2013 FY 2013 FY 2014 FY 2015 Fiscal Year FY 2008 FY 2009 FY 2010 FY 2011 FY 2012 Plan Actual Estimate Request
Days 252 253 241 244 249 lt30 256 lt30 lt30 days days days days days days days days days
Responsible DivisionOffice Division of Corporation Finance
Data Source FACTS
PERFORMANCE GOAL 313 Percentage of investment company disclosure reviews for which initial comments are completed within timeliness goals
Description For initial registration statements the SECrsquos goal is to issue initial comments within 30 days after they are filed (60 days for registration statements of insurance product separate accounts and related mutual funds) The SEC also aims to comment on post-effective amendments within 45 days and preliminary proxy statements within 10 days after they are filed
FY 2013 FY 2013 FY 2014 FY 2015 Fiscal Year FY 2008 FY 2009 FY 2010 FY 2011 FY 2012 Plan Actual Estimate Request
Initial registration statements 95 95 93 92 96 85 98 85 85
Post-effective amendments 97 97 94 94 95 90 99 90 90
Preliminary proxy statements 99 99 99 98 100 99 98 99 99
Responsible DivisionOffice Division of Investment Management
Data Source Electronic Data Gathering Analysis and Retrieval (EDGAR)
PERFORMANCE INDICATOR (CONTEXTUAL) 311 Total digital audience including website social media and mobile media
Description Digital media has become the dominant channel for investors seeking to access information These statistics will help evaluate the extent to which investors are turning to the SEC identify the channels they use and quantify the amount of information they receive
FY 2013 Fiscal Year FY 2008 FY 2009 FY 2010 FY 2011 FY 2012 Actual
SECgov page views Prior-year data not available 372B
Social media followers 0 1608 83141 193837 236700 258733
Total emailmobile subscriptions Prior-year data not available 519602 631839 740318
Total email bulletins sent NA 875518 1280M 2397M 3344M 4085M
Total mobile bulletins sent NA 6001 62324 107848 150303 238815
Responsible DivisionOffice Office of Public Affairs
Data Source Akamai Technologies Google Analytics GovDelivery Hootsuite Social Media Channels
38
rsquo
FY 2015 ANNUAL PERFORMANCE PLAN bull FY 2015 CBJ FY 2015 APP AND FY 2013 APR
Strategic Objective 32 The SEC works to understand investor needs and educate investors so they are better prepared to make informed investment decisions
Goal Leader(s) Director Office of Investor Education and Advocacy
PERFORMANCE GOAL 321 Number of page views of online investor education content and number of in-person events
including those with specifically targeted communities and organizations
Description The Office of Investor Education and Advocacy (OIEA) initiates investor education campaigns on key strategies for making informed investment decisions including publicizing online resources for researching investment professionals and investments understanding fees and identifying fraud OIEA staff also participates in in-person events for investors generally and those targeted to specific investors such as seniors service members and other affinity groups This metric tracks page views of SEC online investor education materials and the number of investor events in which OIEA staff participated
FY 2013 FY 2013 FY 2014 FY 2015 Fiscal Year FY 2008 FY 2009 FY 2010 FY 2011 FY 2012 Plan Actual Estimate Request
Number of page views Prior-year data not available 15 121 15 20
Number of ldquoin-personrdquo events Prior-year data not available 50 52 50 50
Responsible DivisionOffice Office of Investor Education and Advocacy
Data Source Microsoft Office Suite Tools
PERFORMANCE GOAL 322 Timeliness of responses to investor contacts
Description OIEA serves the tens of thousands of investors each year who contact the SEC with investment-related complaints and questions The staff aims to close out as many new investor assistance matters as possible within seven and thirty business days
FY 2013 FY 2013 FY 2014 FY 2015 Fiscal Year FY 2008 FY 2009 FY 2010 FY 2011 FY 2012 Plan Actual Estimate Request
Closed within 7 days 78 70 72 67 54 50 62 60 60
Closed within 30 days 88 90 93 92 93 90 93 90 90
Responsible DivisionOffice Office of Investor Education and Advocacy
Data Source Internal log using IRIS data
PERFORMANCE GOAL 323 Customer satisfaction rating of OIEA s online investor education resources
Description This metric gauges the effectiveness helpfulness and usability of OIEArsquos online investor education resources
FY 2013 FY 2013 FY 2014 FY 2015 Fiscal Year FY 2008 FY 2009 FY 2010 FY 2011 FY 2012 Plan Actual Estimate Request
Satisfaction index Benchmark Benchmark score for score for
Prior-year data not available NA 81 federal federal government government
websites websites
Responsible DivisionOffice Office of Investor Education and Advocacy
Data Source ForeSee results online portal
39
FY 2015 CBJ FY 2015 APP AND FY 2013 APR bull FY 2015 ANNUAL PERFORMANCE PLAN
PERFORMANCE GOAL 324 Number of new investor education materials designed specifically to help investors protect themselves from fraud
Description Through OIEA and often in conjunction with other organizations the staff issues Investor Alerts and other forms of educational material that inform investors about different permutations of fraud new investment products and other topical issues This metric measures the number of new investor education materials issued by OIEA
FY 2013 FY 2013 FY 2014 FY 2015 Fiscal Year FY 2008 FY 2009 FY 2010 FY 2011 FY 2012 Plan Actual Estimate Request
Number of education materials Prior-year data 16 24 24 26 26 26
not available
Responsible DivisionOffice Office of Investor Education and Advocacy
Data Source wwwsecgov and wwwinvestorgov
PERFORMANCE INDICATOR (PROCESS) 321 Number of investor testing research projects
Description This indicator tracks the number of research initiatives used to gather feedback from investors on the usefulness of disclosures and other input on SEC rulemaking
FY 2013 Fiscal Year FY 2008 FY 2009 FY 2010 FY 2011 FY 2012 Actual
Number of projects 1 0 0 2 2
Responsible DivisionOffice Office of Investor Education and Advocacy
Data Source Microsoft Office Suite Tools
PERFORMANCE INDICATOR (PROCESS) 322 Number of sets of recommendations prepared by the investor advisor y committee
Description This indicator tracks the recommendations from the Investor Advisory Committee regarding investorsrsquo perspectives and priorities
FY 2013 Fiscal Year FY 2008 FY 2009 FY 2010 FY 2011 FY 2012 Actual
Number of sets of recommendations Prior-year data not available 0 4
Responsible DivisionOffice Office of Investor Education and Advocacy
Data Source wwwsecgov
26
0
40
Strategic Goal 4 Enhance the Commissionrsquos Performance through Effective Alignment and Management of Human Information and Financial Capital During FY 2015 the agency will continue to focus on recruiting and retaining high-performing staff and updating the expertise of SEC employees so they are abreast of the latest developments in the securities markets Furthermore the SEC will continue to strengthen internal controls The agency is requesting a total of $3599 million and 867 FTEs in FY 2015 to achieve results in Strategic Goal 4
Budgeting for the Future (FY 2015)
The investing public and the securities markets are best served by an efficient effective and agile SEC In FY 2015 the agency will continue to take steps to become a more effective regulator of the US financial markets by making sound investments in human capital and new technologies and enhancing internal controls
The planned investment in the SEC University for FY 2015 principally supports training and development for employees directly involved in examinations investigations fraud detection litigation and other core mission responsibilities of the agency The SEC University will provide specialized in-depth training concerning changing market conditions analytics and forensics and the agencyrsquos new responsibility areas The investment also will fund employees for certain specialized financial certifications and regulatory credentials as well as the advanced continuing education required for maintaining legal and financial credentials
To maintain mission effectiveness it is essential that attrition in the leadership ranks is quickly addressed by having a highly qualified and diverse pool of candidates ready to assume those
critical roles (Performance Goal 415) The Office of Human Resourcesrsquo (OHR) Workforce Planning has completed building the foundational database necessary to conduct succession planning A subset of this team has begun benchmarking succession planning approaches used by other Federal agencies and will develop and implement a program at the SEC by the end of FY 2014 The first measure is expected by September 30 2014
Leveraging modern reliable and innovative technologies together with predictive analytics will transform the way the SEC performs its mission and provide a proactive view into how technology impacts capital markets The SEC will derive significant and measurable performance improvements in core operations and increase value for users through the use of automated enterprise processes
The continuing implementation of OITrsquos Technology Transformation Plan (ldquoWorking Smarterrdquo) in FY 2015 will support vital technology initiatives It will ensure the SECrsquos business processes are streamlined integrated and implemented using the best technology available
While the SEC has made significant strides in its multi-year path towards a strong sustainable internal control posture the agency will continue to dedicate its energies towards remediating the significant deficiency in information security During FY 2015 OFM will work closely with the Department of Transportationrsquos Federal Shared Services Provider (FSSP) to implement its software upgrade and refine the new Federal government-wide travel management system
41
FY 2015 ANNUAL PERFORMANCE PLAN bull FY 2015 CBJ FY 2015 APP AND FY 2013 APR
FY 2015 CBJ FY 2015 APP AND FY 2013 APR bull FY 2015 ANNUAL PERFORMANCE PLAN
Strategic Objective 41 The SEC promotes a results-oriented work environment that attracts engages and retains a technically proficient and diverse workforce including leaders who provide motivation and strategic direction
Goal Leader(s) Director Office of Human Resources Director Office of Minority and Women Inclusion
PERFORMANCE GOAL 411 Turnover
Description When employee morale and engagement are high high-performing employees tend to remain in the organization Although turnover can fluctuate based on a variety of factors the SEC aims to keep its turnover rate relatively low below 8 per year
FY 2013 FY 2013 FY 2014 FY 2015 Fiscal Year FY 2008 FY 2009 FY 2010 FY 2011 FY 2012 Plan Actual Estimate Request
Percent turnover 62 37 5 64 658 lt8 658 lt8 lt8
Responsible DivisionOffice Office of Human Resources
Data Source The National Business Center at Department of Interior (DOI)
PERFORMANCE GOAL 412 Expanding staff expertise
Description Internal training and hiring programs are designed to help the agency recruit and develop a diverse and qualified staff with the key skills industry knowledge and expertise to support the SEC mission In particular there is a need to train examiners attorneys economists and other experts for subject matter expertise relevant to the marketplace and investment and trading practices This metric tracks whether certain areas requiring significant training are being addressed The agency will track the number of SEC staff participants in mission-focused training and development programs and will report on specific items through the use of post-course evaluations to assess the impact and results of this training on a five-point scale
FY 2013 FY 2013 FY 2014 FY 2015 Fiscal Year FY 2008 FY 2009 FY 2010 FY 2011 FY 2012 Plan Actual Estimate Request
Mission-focused training attendance Prior year data not available NA NA 12000 12120
Post-course evaluations of mission-Prior year data not available NA NA 45 45
focused training
Responsible DivisionOffice Office of Human Resources
Data Source Course Attendance Identified in LEAP (Instructor-led courses only) and End of Course Evaluation Report Summary provided by Metrics that Matter
PERFORMANCE GOAL 413 Number of diversity-related partnershipsalliances
Description Increased numbers of diversity-related partnerships or alliances with professional associations and educational organizations provide opportunities to educate students about the SECrsquos work and to recruit career professionals from all segments of society The SEC will track the number of partnerships andor alliances with diverse professional associations and educational organizations
FY 2013 FY 2013 FY 2014 FY 2015 Fiscal Year FY 2008 FY 2009 FY 2010 FY 2011 FY 2012 Plan Actual Estimate Request
Number of partnershipsalliances Prior-year data 2 10 12 15 13 15
not available
Responsible DivisionOffice Office of Minority Women and Inclusion
Data Source Office of Minority Women and Inclusion Internal Records and Section 342 of DFA
15
42
FY 2015 ANNUAL PERFORMANCE PLAN bull FY 2015 CBJ FY 2015 APP AND FY 2013 APR
PERFORMANCE GOAL 414 Sur vey rankings
Description Annual and other rankings together with other metrics and indicators of federal government agencies will be used as one kind of metric to determine the SECrsquos overall success in improving employee morale and employee engagement
FY 2013 FY 2013 FY 2014 FY 2015 Fiscal Year FY 2008 FY 2009 FY 2010 FY 2011 FY 2012 Plan Actual Estimate Request
Best Places to Work ranking Ranked Ranked Ranked Ranked Ranked Ranked Ranked Ranked Ranked 3 11 24 27 19 20 15 5 5
Average of employee engagement Prior-year data not available NA 61 75 75
and global satisfaction index
Responsible DivisionOffice Office of Human Resources
Data Source Annual Partnership for Public Service calculated ranking based on Annual Employee Viewpoint Survey (EVS) administered by OPM and Average of Employee Engagement and Global Satisfaction Index from OPM Employee Viewpoint Survey (EVS)
PERFORMANCE GOAL 415 Bench strength
Description To maintain mission effectiveness it is essential that attrition in the leadership ranks is quickly addressed by having a highly qualified and diverse pool of candidates ready to assume those critical roles Success is measured by the percentage of key leadership positions for which the SEC has identified a pool of qualified candidates
FY 2013 FY 2013 FY 2014 FY 2015 Fiscal Year FY 2008 FY 2009 FY 2010 FY 2011 FY 2012 Plan Actual Estimate Request
Data point under development NA NA NA NA NA NA NA TBD TBD
Responsible DivisionOffice Office of Human Resources
Data Source TBD
Strategic Objective 42 The SEC encourages a collaborative environment across divisions and offices and leverages technology and data to fulfill its mission more effectively and efficiently
Goal Leader(s) Director Office of Information Technology
PERFORMANCE GOAL 421 Ensure SECrsquos systems and applications are available
Description The SEC aims to enhance its computing infrastructure to eliminate down time if systems at one site fail among other objectives This metric will capture the percentage of systems and applications that can fail over within 8 hours
FY 2013 FY 2013 FY 2014 FY 2015 Fiscal Year FY 2008 FY 2009 FY 2010 FY 2011 FY 2012 Plan Actual Estimate Request
Percentage of servers virtualized NA 12 22 38 79 85 93 94 95
Percentage fail over within 8 hours NA NA NA NA NA NA NA 100 100
Responsible DivisionOffice Office of Information Technology
Data Source OIT Network Operations Center (NOC) ndash automated network monitoring tools
43
FY 2015 CBJ FY 2015 APP AND FY 2013 APR bull FY 2015 ANNUAL PERFORMANCE PLAN
PERFORMANCE GOAL 422 Equip the SEC with an enhanced technology infrastructure to support enterprise infrastructure
Description The SEC aims to promote collaboration and information sharing across the enterprise To improve efficiency and knowledge management the SEC will consolidate and centralize its collaborative technologies to a commonly used enterprise set by 2020 This metric will measure the percentage of the SECrsquos offices and divisions that utilize centralized enterprise collaboration solutions
FY 2013 FY 2013 FY 2014 FY 2015 Fiscal Year FY 2008 FY 2009 FY 2010 FY 2011 FY 2012 Plan Actual Estimate Request
Number of enterprise solutions Prior-year data not 10 20 25 30 30 35 40
available
Responsible DivisionOffice Office of Information Technology
Data Source Approved software applications list
PERFORMANCE GOAL 423 Expand the SECrsquos video teleconferencing (VTC) capabilities to support an increasingly geographically dispersed workforce
Description The SEC seeks to develop a state of the art video teleconference solution that allows users to conduct a videoteleconference meeting between HQ regional offices and multiple endpoints simultaneously collaborate and share presentation materials and use VoIP technology to host video teleconferences from their officesworkspaces with other SEC users or conference rooms This metric will measure the average ldquouptimerdquo or availability of all VTC systems
FY 2013 FY 2013 FY 2014 FY 2015 Fiscal Year FY 2008 FY 2009 FY 2010 FY 2011 FY 2012 Plan Actual Estimate Request
Availability rate for VTC solutions Prior-year data not available 75 80 9999 9999
Responsible DivisionOffice Office of Information Technology
Data Source Telecommunications monitoring system
PERFORMANCE GOAL 424 Pursue continuous technology cost reductions and efficiencies
Description Recent technology enhancements ndash eg data center consolidation virtualization and maintenance contract reductions ndash are producing technical efficiencies and cost savings This metric will measure the amount of these costs savings
FY 2013 FY 2013 FY 2014 FY 2015 Fiscal Year FY 2008 FY 2009 FY 2010 FY 2011 FY 2012 Plan Actual Estimate Request
Percent reduction in operational run 1-3 187 1 2 cost leveraging technology and cost cost reduction reduction process efficiencies
Prior-year data not available reduction in steady
reduction in steady
in run costs
in run costs
state run state run costs costs1
Responsible DivisionOffice Office of Information Technology
Data Source OIT Network Operations Center (NOC)
The higher than expected FY 2013 actual of 187 percent is due to one-time technologies enhancements resulting from the data consolidation and virtualization 1
44
FY 2015 ANNUAL PERFORMANCE PLAN bull FY 2015 CBJ FY 2015 APP AND FY 2013 APR
PERFORMANCE GOAL 425 Enhance the SECrsquos enterprise data warehouse infrastructure and performance
Description The Enterprise Data Warehouse (EDW) infrastructure will enable the provisioning of data to Commission staff for search and analysis through a virtual data warehouse platform This metric will measure the availability of EDW and data sources
FY 2013 FY 2013 FY 2014 FY 2015 Fiscal Year FY 2008 FY 2009 FY 2010 FY 2011 FY 2012 Plan Actual Estimate Request
Availability rate for the EDW infrastructure components in Prior-year data not available NA NA 99 99 production
Responsible DivisionOffice Office of Information Technology
Data Source OIT Network Operations Center (NOC) ndash automated network monitoring tools
Strategic Objective 43 The SEC maximizes the use of agency resources by continually improving agency operations and bolstering internal controls
Goal Leader(s) Chief Financial Officer Chief Operations Officer
PERFORMANCE GOAL 431 Financial audit results
Description Under the Accountability of Taxpayer Dollars Act of 2002 the agency is required to meet all proprietary and budgetary accounting guidelines for federal agencies and to undergo annual audits The SECrsquos audits are conducted by the Government Accountability Office
FY 2013 FY 2013 FY 2014 FY 2015 Fiscal Year FY 2008 FY 2009 FY 2010 FY 2011 FY 2012 Plan Actual Estimate Request
Unqualified opinion Yes Yes Yes Yes Yes Yes Yes Yes Yes
Material weaknesses 0 1 2 0 0 0 0 0 0
Significant deficiency 3 6 0 4 2 0 1 0 0
Responsible DivisionOffice Office of Financial Management
Data Source GAO SEC Financial Audit Report
PERFORMANCE GOAL 432 Assurance statement on internal control over operations
Description In accordance with OMB A-123 and Section 961 of the Dodd-Frank Act the SEC conducts an annual assessment of the effectiveness of internal controls The SEC will continue to develop its Operational Risk program and enhance cross-organizational processes to support all division and office management assurance statements Success is measured by the quality of risk and control assessments and management self-identification and resolution of improvement opportunities
FY 2013 FY 2013 FY 2014 FY 2015 Fiscal Year FY 2008 FY 2009 FY 2010 FY 2011 FY 2012 Plan Actual Estimate Request
Unqualified opinion Yes Yes Yes Yes Yes Yes Yes Yes Yes
Material weakness 0 0 0 0 0 0 0 0 0
Responsible DivisionOffice Office of the Chief Operating Officer
Data Source SEC Financial Audit Report
45
FY 2015 CBJ FY 2015 APP AND FY 2013 APR bull FY 2015 ANNUAL PERFORMANCE PLAN
1
PERFORMANCE GOAL 433 Timely completion of corrective action on Office of Inspector General (OIG) and the GAO audit recommendations1
Description Timely completion of audit recommendations is an important SEC priority This metric measures how well the Commission is doing in completing corrective action on OIG audit recommendations within established timeframes
FY 2013 FY 2013 FY 2014 FY 2015 Fiscal Year FY 2008 FY 2009 FY 2010 FY 2011 FY 2012 Plan Actual Estimate Request
OIG recommendations completed in Prior-year data not available NA 78 80 80
less than one year
Responsible DivisionOffice Office of the Chief Operating Officer
Data Source Audit Recommendation Tracking System
This measure was developed as part of the FY 2014-2018 SEC strategic planning process Currently there is no methodology in place to capture data for tracking all GAO Audit recommendations OCOO will determine a timeframe for establishing a methodology during FY 2014
46
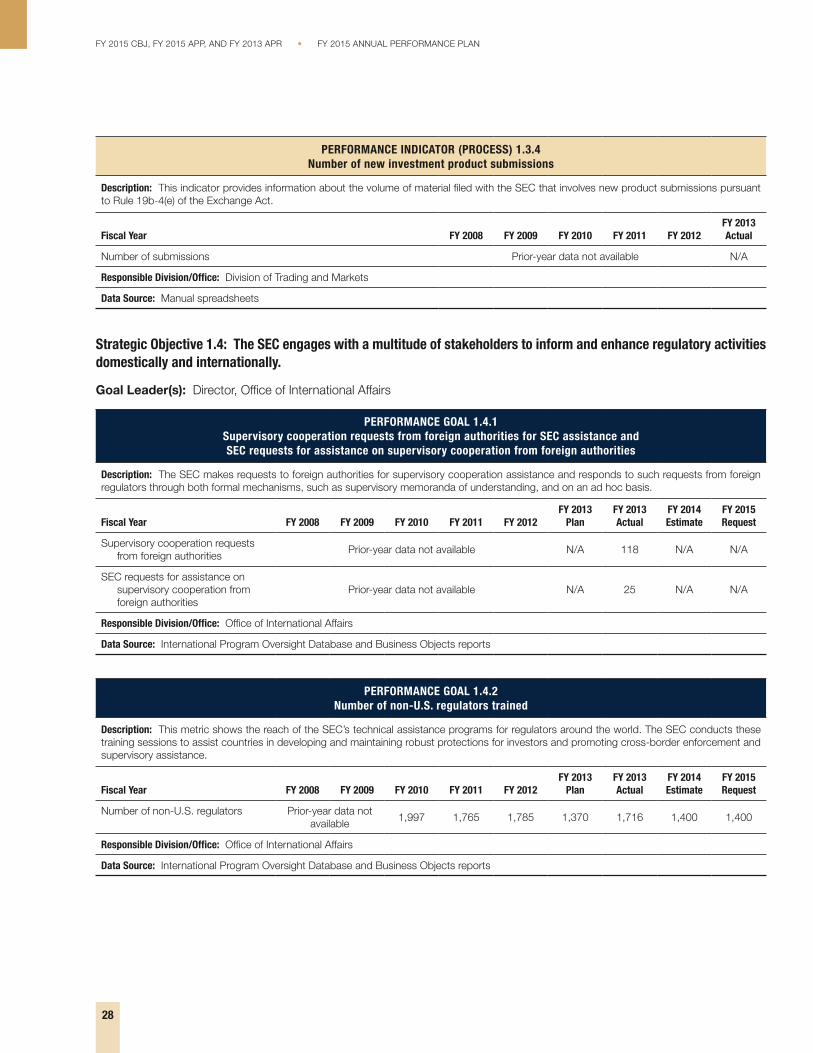
FY 2015 CBJ FY 2015 APP AND FY 2013 APR bull FY 2015 ANNUAL PERFORMANCE PLAN
PERFORMANCE INDICATOR (PROCESS) 134 Number of new investment product submissions
Description This indicator provides information about the volume of material filed with the SEC that involves new product submissions pursuant to Rule 19b-4(e) of the Exchange Act
FY 2013 Fiscal Year FY 2008 FY 2009 FY 2010 FY 2011 FY 2012 Actual
Number of submissions Prior-year data not available NA
Responsible DivisionOffice Division of Trading and Markets
Data Source Manual spreadsheets
Strategic Objective 14 The SEC engages with a multitude of stakeholders to inform and enhance regulatory activities domestically and internationally
Goal Leader(s) Director Office of International Affairs
PERFORMANCE GOAL 141 Super visory cooperation requests from foreign authorities for SEC assistance and SEC requests for assistance on supervisory cooperation from foreign authorities
Description The SEC makes requests to foreign authorities for supervisory cooperation assistance and responds to such requests from foreign regulators through both formal mechanisms such as supervisory memoranda of understanding and on an ad hoc basis
FY 2013 FY 2013 FY 2014 FY 2015 Fiscal Year FY 2008 FY 2009 FY 2010 FY 2011 FY 2012 Plan Actual Estimate Request
Supervisory cooperation requests Prior-year data not available NA 118 NA NA
from foreign authorities
SEC requests for assistance on supervisory cooperation from Prior-year data not available NA 25 NA NA foreign authorities
Responsible DivisionOffice Office of International Affairs
Data Source International Program Oversight Database and Business Objects reports
PERFORMANCE GOAL 142 Number of non-US regulators trained
Description This metric shows the reach of the SECrsquos technical assistance programs for regulators around the world The SEC conducts these training sessions to assist countries in developing and maintaining robust protections for investors and promoting cross-border enforcement and supervisory assistance
FY 2013 FY 2013 FY 2014 FY 2015 Fiscal Year FY 2008 FY 2009 FY 2010 FY 2011 FY 2012 Plan Actual Estimate Request
Number of non-US regulators Prior-year data not 1997 1765 1785 1370 1716 1400 1400
available
Responsible DivisionOffice Office of International Affairs
Data Source International Program Oversight Database and Business Objects reports
28
Strategic Goal 2 Foster and Enforce Compliance with the Federal Securities Laws
In FY 2015 the agency is requesting a total of 502 FTE for Goal 2 The additional resources will allow the SEC to continue building out the agencyrsquos new responsibility areas and begin addressing the disparity between the number of exam staff and the growing number and complexity of registered firms Additionally the Commission will be able to take prompt action to halt misconduct sanction wrongdoers effectively and return funds to harmed investors In all the agency plans to devote approximately $1802 million to enforcing compliance with the federal securities laws
Budgeting for the Future (FY 2015)
In FY 2015 the SEC will continue to make improvements to its National Examination and Enforcement programs These improvements include hiring staff with new skill sets enhancing their technologies streamlining processes expanding the SECrsquos training programs improving the processing of the thousands of tips the agency receives annually and improving risk assessment techniques These and other significant efforts contribute to the agencyrsquos objective of creating an enduring structure for improved protection of investors and markets
In FY 2015 the National Examination program will continue its focus on high-risk entities and activities Additional staff will among other things improve risk assessment and surveillance functions and continue to address the disparity between the number of staff and the size and complexity of regulated entities The staff will perform targeted sweep and cause examinations including examinations over new or expanded areas of the agencyrsquos jurisdiction
The Enforcement program plans to build on significant changes implemented in prior fiscal years and will work to meet new challenges expected in FY 2015 In order to effectively meet these challenges the Enforcement program is aggressively adopting new methods initiatives and organizational reforms to ensure the best possible use of available resources to strengthen investor confidence in the US financial markets and to send a strong message of deterrence to would-be violators of the securities laws
To improve the quality and efficiency of its investigations the SEC has put seasoned investigators on the front lines created specialized units focused on specific programmatic priorities enhanced case management systems and increased coordination efforts with other offices and divisions in the agency and other regulators In FY 2015 the SEC plans to obtain relief on one or more claims from approximately 92 percent of enforcement actions (Performance Goal 231) The SEC has implemented controls and strategies to resolve actions on a favorable basis while at the same time it will not hesitate to file matters on a contested basis where a favorable settlement was unavailable before filing The agency also plans to reduce in FY 2015 the average number months between the opening of an investigation and the commencement of an enforcement action arising out of that investigation (Performance Goal 233)
Under the Sarbanes-Oxley Act of 2002 the SEC can use Fair Funds to redirect penalties collected from securities law violators to the victims of their wrongdoing The SEC is committed to the timely collection and distribution of penalties and disgorgement funds and has adopted a variety of new measures for monitoring its progress (Performance Goal 235)
29
FY 2015 ANNUAL PERFORMANCE PLAN bull FY 2015 CBJ FY 2015 APP AND FY 2013 APR
FY 2015 CBJ FY 2015 APP AND FY 2013 APR bull FY 2015 ANNUAL PERFORMANCE PLAN
Strategic Objective 21 The SEC fosters compliance with the federal securities laws
Goal Leader(s) Director Office of Compliance Inspections and Examinations
PERFORMANCE GOAL 211 Number of industr y outreach and education programs targeted to areas identified as raising particular compliance risks
Description Targeted communication with industry participants on topics shaping the examination program is intended to enhance compliance practices and prevent violations before they occur This metric identifies the number of major outreach efforts conducted including the SECrsquos national and regional compliance outreach events published risk alerts and other educational programs and initiatives
FY 2013 FY 2013 FY 2014 FY 2015 Fiscal Year FY 2008 FY 2009 FY 2010 FY 2011 FY 2012 Plan Actual Estimate Request
Number of major outreach efforts Prior-year data 6 5 12 14 15 16
not available
Responsible DivisionOffice Office of Compliance Inspections and Examinations
Data Source Internal tracking although the events noted above are referenced in the SECrsquos website
PERFORMANCE GOAL 212 Percentage of firms receiving deficiency letters that take corrective action in response to all exam findings
Description At the conclusion of examinations the staff communicates identified deficiencies to registrants in the form of a deficiency letter Registrants are then given a chance to respond to staff findings and often take action to remedy any problems and potential risks including monetary compensation to clients and enhancements to disclosures policies and procedures Most often registrants respond that they have corrected the deficiencies and implemented measures to prevent recurrence
FY 2013 FY 2013 FY 2014 FY 2015 Fiscal Year FY 2008 FY 2009 FY 2010 FY 2011 FY 2012 Plan Actual Estimate Request
Percentage 93 94 90 93 92 93 86 87 88
Responsible DivisionOffice Office of Compliance Inspections and Examinations
Data Source Tracking and Reporting Exam National Documentation System (TRENDS)
Strategic Objective 22 The SEC promptly detects and deters violations of the federal securities laws
Goal Leader(s) Director Office of Compliance Inspections and Examinations
PERFORMANCE GOAL 221 Percentage of investment advisers investment companies and broker-dealers examined during the year
Description This metric indicates the number of registrants examined by the SEC or an SRO as a percentage of the total number of registrants This metric includes all types of examinations risk priority examinations cause inspections to follow up on tips and complaints limited-scope special inspections to probe emerging risk areas oversight examinations of broker-dealers to test compliance and the quality of examinations by FINRA
FY 2013 FY 2013 FY 2014 FY 2015 Fiscal Year FY 2008 FY 2009 FY 2010 FY 2011 FY 2012 Plan Actual Estimate Request
Investment advisers 14 10 9 8 8 10 9 9 12
Investment companies 23 29 10 13 12 14 11 12 15
Broker-dealers (exams by SEC 57 54 44 58 49 50 46 48 50
and SROs)
Responsible DivisionOffice Office of Compliance Inspections and Examinations
Data Source Tracking and Reporting Exam National Documentation System (TRENDS) (IA IC and BD SEC data) and SRO Databases (BD SRO Data)
17
30
FY 2015 ANNUAL PERFORMANCE PLAN bull FY 2015 CBJ FY 2015 APP AND FY 2013 APR
PERFORMANCE GOAL 222 Percentage of compliance exams that are timely concluded in accordance with the Office of Compliance Inspections
and Examinationrsquos (OCIE) statutory deadline
Description The staff conducts examinations each year of registered entities including investment advisers investment company complexes transfer agents and broker-dealers The staff strives to complete its examinations and communicate findings in the most efficient and effective manner and within its statutory deadline This metric reflects the percentage of examinations concluded within the statutory deadline
FY 2013 FY 2013 FY 2014 FY 2015 Fiscal Year FY 2008 FY 2009 FY 2010 FY 2011 FY 2012 Plan Actual Estimate Request
Percentage Prior-year data NA NA NA 100 100 100 100
not available
Responsible DivisionOffice Office of Compliance Inspections and Examinations
Data Source Tracking and Reporting Exam National Documentation System (TRENDS)
PERFORMANCE GOAL 223 Number of joint exams information sharing agreements and formal meetings with other regulators
Description The SEC attempts to coordinate and collaborate with other regulators on areas of mutual interest This helps to ensure that all regulators are informed of on-going risks and issues related to broad market practices as well as specific entities of mutual interest This cooperation is critical to the exam program to ensure that certain higher risk firms and activities are addressed in the most efficient and effective manner This metric tracks critical cooperation activities that are occurring between the SECrsquos exam program and other regulators
FY 2013 FY 2013 FY 2014 FY 2015 Fiscal Year FY 2008 FY 2009 FY 2010 FY 2011 FY 2012 Plan Actual Estimate Request
Number of joint exams active sharing Prior-year data not available NA NA 85 100
agreements and formal meetings
Responsible DivisionOffice Office of Compliance Inspections and Examinations
Data Source Various (including internal tracking and TRENDS)
PERFORMANCE INDICATOR (CONTEXTUAL) 221 Percentage of exams that identify deficiencies the percentage that result in a ldquosignificant findingrdquo
and the percentage referred to the Division of Enforcement
Description Examiners find a wide range of deficiencies during examinations Some of the deficiencies are more technical in nature such as failing to include all information that is required to be in a record However other deficiencies may cause harm to customers or clients of a firm have a high potential to cause harm or reflect recidivist misconduct The latter deficiencies are among those categorized as ldquosignificantrdquo This indicator identifies the percentage of exams that identified deficiencies that resulted in significant deficiency findings and that were referred to Enforcement
FY 2013 Fiscal Year FY 2008 FY 2009 FY 2010 FY 2011 FY 2012 Actual
Percentage that identify deficiencies Prior-year data 72 82 80 80
not available
Percentage that result in a ldquosignificant findingrdquo Prior-year data 42 42 42 35
not available
Percentage referred to the Division of Enforcement Prior-year data not available 13
Responsible DivisionOffice Office of Compliance Inspections and Examinations
Data Source Tracking and Reporting Exam National Documentation System (TRENDS)
31
PERFORMANCE INDICATOR (OUTPUT) 222 Number of cause exams that result from tips complaints and referrals
Description Analysis of a tip can support the request for a cause exam This indicator would identify the number of SEC cause exams that result from tips collected through outreach efforts
Fiscal Year FY 2008 FY 2009 FY 2010 FY 2011 FY 2012 FY 2013 Actual
Number of cause exams Prior-year data not available
NA NA NA 222
Responsible DivisionOffice Office of Compliance Inspections and Examinations
Data Source Tracking and Reporting Exam National Documentation System (TRENDS)
PERFORMANCE INDICATOR (OUTPUT) 223 Number of rule-making initiatives assisted by the National Exam Program
Description The examination program interacts with registrants on a regular basis and this work provides critical feedback to ensuring effective and practical rulemaking and policy efforts This indicator tracks how frequently the examination program assists with rulemaking initiatives
Fiscal Year FY 2008 FY 2009 FY 2010 FY 2011 FY 2012 FY 2013 Actual
Number of rule-making initiatives assisted by the NEP Prior-year data not available NA
Responsible DivisionOffice Office of Compliance Inspections and Examinations
Data Source Internal tracking
PERFORMANCE INDICATOR (OUTPUT) 224 Number of investigations or inquiries originating from a tip or complaint
Description Analysis of a tip or complaint can result in the need for further enforcement investigation The indicator identifies the volume of SEC investigations that result from tips and complaints received by the SEC
Fiscal Year FY 2008 FY 2009 FY 2010 FY 2011 FY 2012 FY 2013 Actual
Number of investigations Prior-year data not available
303 349 296 289
Responsible DivisionOffice Division of Enforcement
Data Source HUB case management and tracking system for the Division of Enforcement
PERFORMANCE INDICATOR (OUTPUT) 225 SEC investigations in which requests for access to information were granted by the SEC to other authorities
such as SROs or other state federal and foreign enforcement authorities
Description The SEC works closely with other regulators and authorities This measure identifies the number of investigations in which the SEC granted one or more authorities access to information concerning an investigation during the fiscal year This may include requests for access to SEC investigative files concerning investigations that the SEC continues to pursue as well as those in which the SEC has completed its investigation
Fiscal Year FY 2008 FY 2009 FY 2010 FY 2011 FY 2012 FY 2013 Actual
Number of investigations Prior-year data not available
492 586 515 504
Responsible DivisionOffice Division of Enforcement
Data Source HUB case management and tracking system for the Division of Enforcement
32
FY 2015 CBJ FY 2015 APP AND FY 2013 APR bull FY 2015 ANNUAL PERFORMANCE PLAN
FY 2015 ANNUAL PERFORMANCE PLAN bull FY 2015 CBJ FY 2015 APP AND FY 2013 APR
PERFORMANCE INDICATOR (OUTPUT) 226 Requests from foreign authorities for SEC assistance and SEC requests for assistance from foreign authorities
Description Each year the SEC makes hundreds of requests for enforcement assistance to foreign regulators while responding to hundreds of such requests from other nations To facilitate this type of assistance and encourage other countries to enact laws necessary to allow regulators to cooperate with their foreign counterparts the SEC has entered into bilateral information sharing arrangements as well as the Multilateral Memorandum of Understanding an information-sharing arrangement negotiated through the International Organization of Securities Commissions (IOSCO)
FY 2013 Fiscal Year FY 2008 FY 2009 FY 2010 FY 2011 FY 2012 Actual
Number of requests from foreign authorities 414 408 457 492 450
Number of SEC requests 594 774 605 772 718
Responsible DivisionOffice Office of International Affairs
Data Source International Program Oversight Database and Business Objects reports
Strategic Objective 23 The SEC prosecutes violations of federal securities laws and holds violators accountable through appropriate sanctions and remedies
Goal Leader(s) Director Division of Enforcement
PERFORMANCE GOAL 231 Percentage of enforcement actions in which the Commission obtained relief on one or more claims
Description This metric identifies as to all parties to enforcement actions that were resolved in the fiscal year the percentage against whom the Commission obtained a judgment or order entered on consent a default judgment a judgment of liability on one or more charges andor the imposition of monetary or other relief
FY 2013 FY 2013 FY 2014 FY 2015 Fiscal Year FY 2008 FY 2009 FY 2010 FY 2011 FY 2012 Plan Actual Estimate Request
Percentage 92 92 92 93 89 92 93 92 92
Responsible DivisionOffice Division of Enforcement
Data Source HUB case management and tracking system for the Division of Enforcement
PERFORMANCE GOAL 232 Percentage of first enforcement actions filed within two years of the opening of an investigation
Description This metric concerns the pace of investigations that lead to the filing of enforcement actions Specifically this metric captures the rate at which the first enforcement action arising out of an investigation was filed within two years of the opening of the investigation If the investigation was preceded by a matter under inquiry the metric draws on the date of the opening of the matter under inquiry In conducting investigations the Enforcement program continually strives to balance the need for complete effective and fair investigations with the need to file enforcement actions in as timely a manner as possible
FY 2013 FY 2013 FY 2014 FY 2015 Fiscal Year FY 2008 FY 2009 FY 2010 FY 2011 FY 2012 Plan Actual Estimate Request
Percentage 62 70 67 61 63 65 58 65 65
Responsible DivisionOffice Division of Enforcement
Data Source HUB case management and tracking system for the Division of Enforcement
508
717
33
FY 2015 CBJ FY 2015 APP AND FY 2013 APR bull FY 2015 ANNUAL PERFORMANCE PLAN
PERFORMANCE GOAL 233 Average months between opening a matter under inquiry or an investigation and commencing an enforcement action
Description This metric captures the average number of months between the opening of an investigation and the filing of the first enforcement action arising out of that investigation If the investigation was preceded by a matter under inquiry the metric draws on the date of opening of the matter inquiry In conducting investigations the enforcement program continually strives to balance the need for complete effective and fair investigation with the need to file enforcement actions in as timely a manner as possible While not all investigations result in the filing of enforcement actions this metric provides information concerning the pace of investigations that do lead to such actions and supplements the previous goal which measures the percentage of first enforcement actions filed within two years
FY 2013 FY 2013 FY 2014 FY 2015 Fiscal Year FY 2008 FY 2009 FY 2010 FY 2011 FY 2012 Plan Actual Estimate Request
Months Prior-year data not available 22 21 20 21 20 20
Responsible DivisionOffice Division of Enforcement
Data Source HUB case management and tracking system for the Division of Enforcement
PERFORMANCE GOAL 234 Percentage of debts where either a payment has been made or a collection activity has
been initiated within 180 days of the due date of the debt
Description The SEC can seek a wide range of remedies for failure to comply with the securities laws These remedies include civil monetary penalties and disgorgement When the remedies are imposed by the SEC or the Federal district court payments must be made by a certain date This metric identifies the percentage of debts where debtors have made payments or the SEC has initiated a collection activity within 180 days of the due date Such collection activities include among other things demand letters negotiation of payment plans enforcing the payment of the debt through the courts or other judicial remedies
FY 2013 FY 2013 FY 2014 FY 2015 Fiscal Year FY 2008 FY 2009 FY 2010 FY 2011 FY 2012 Plan Actual Estimate Request
Percentage 88 90 86 91 92 92 95 95 95
Responsible DivisionOffice Division of Enforcement
Data Source DELPHI
PERFORMANCE GOAL 235 Percentage of Fair Fund and disgorgement fund plans that have distributed 80 percent of the available
funds for distribution within twenty four (24) months of the approval of the distribution plan
Description In addition to other types of relief the SEC may seek orders requiring parties to disgorge any money obtained through wrongdoing The SEC also is empowered to seek civil penalties for violations of the securities laws Where appropriate the SEC has sought to return disgorged funds to harmed investors and as a result of the Fair Funds provisions of the Sarbanes-Oxley Act and the Dodd-Frank Act to combine amounts paid as penalties with disgorged funds or to create a Fair Fund from penalties only to reduce losses to injured parties and to maximize funds available for distribution This metric identifies the percentage of distribution plans that reached a critical mass during the fiscal year and within twenty four (24) months of the approval of the distribution plan The distribution plan includes the timeline and procedures required to return the funds to injured investors This reflects Commission-wide efforts to implement plans to return money to investors quickly Any funds not returned to investors are sent to the US Treasury or the Investor Protection Fund established pursuant to Section 21F(g) of the Securities Exchange Act of 1934 Neither disgorgement nor penalties are used for the SECrsquos own expenses
FY 2013 FY 2013 FY 2014 FY 2015 Fiscal Year FY 2008 FY 2009 FY 2010 FY 2011 FY 2012 Plan Actual Estimate Request
Percentage Prior-year data not available 80 80 73 78 82
Responsible DivisionOffice Division of Enforcement
Data Source HUB case management and tracking system for the Division of Enforcement and Distributions Management System
34
PERFORMANCE INDICATOR (CONTEXTUAL) 232 Total amount distributed within the fiscal year and the number of Fair Funds from which those distributions came
Description In its enforcement actions the SEC may seek to return funds to harmed investors through disgorgement of ill-gotten gains or through the Fair Funds provision of the Sarbanes-Oxley Act This provision permits the SEC to combine amounts paid as penalties with disgorged funds or to create a Fair Fund from penalties only to reduce losses to injured parties This reflects the SECrsquos efforts to return funds to injured investors This indicator identifies the total amount distributed within the fiscal year and the number of Fair Funds from which those distributions came This indicator may increase or decrease in dollar amount and number of distribution funds based on the number of SEC enforcement actions brought involving distributions amounts ordered and paid in those actions and other factors Due to the variation in reporting timelines established for each individual distribution reported amounts are based on the agencyrsquos best available information Reported amounts do not include those funds distributed through receiverships Any funds not returned to investors are sent to the US Treasury or the Investor Protection Fund established pursuant to Section 21F(g) of the Securities Exchange Act of 1934 Neither disgorgement nor penalties are used for the Commissionrsquos own expenses
Fiscal Year FY 2008 FY 2009 FY 2010 FY 2011 FY 2012 FY 2013 Actual
Amount distributed (in millions) Prior-year data not available 815 251
Number of Fair Funds Prior-year data not available 31 22
Responsible DivisionOffice Division of Enforcement
Data Source HUB case management and tracking system for the Division of Enforcement Distributions Management System
PERFORMANCE INDICATOR (CONTEXTUAL) 231 Percentage of filed enforcement actions reflecting characteristics that present enhanced risk to investors and markets as
measured by the nature of the investigation conduct parties and impact
Description This indicator assesses the quality of the cases filed by the Division of Enforcement The indicator focuses on cases filed by the SEC that involve factors reflecting enhanced risk to investors and markets Such cases may involve (i) those identified through risk analytics and cross-disciplinary initiatives to reveal difficult-to-detect or early stage misconduct thus minimizing investor loss and preventing the spread of unlawful conduct and practices (ii) particularly egregious or widespread misconduct and investor harm (iii) vulnerable victims (iv) a high degree of scienter (v) involvement of individuals occupying substantial positions of authority or having fiduciary obligations or other special responsibilities to investors (vi) involvement of recidivists (vii) high amount of investor loss prevented (viii) misconduct that is difficult to detect due to the complexity of products transactions and practices (ix) use of innovative investigative or analytical techniques (x) effective coordination with other law enforcement partners andor (xi) whether the matter involves markets transactions or practices identified as an enforcement priority or that advances the programmatic priorities of other SEC Divisions or Offices
Fiscal Year FY 2008 FY 2009 FY 2010 FY 2011 FY 2012 FY 2013 Actual
Percentage Prior-year data not available NA NA
Responsible DivisionOffice Division of Enforcement
Data Source HUB case management and tracking system for the Division of Enforcement
35
FY 2015 ANNUAL PERFORMANCE PLAN bull FY 2015 CBJ FY 2015 APP AND FY 2013 APR
PERFORMANCE INDICATOR (OUTPUT) 233 Percent of enforcement actions filed that arose out of national priority investigations
Description The Division of Enforcement conducts many enforcement actions each year that can be characterized as high impact and of national priority High impact or national priority investigations include those investigations which are significant for one or more of the following reasons ndashthe matter (i) presents an opportunity to send a particularly strong and effective message of deterrence including with respect to markets products and transactions that are newly developing or that are long established but which by their nature present limited opportunities to detect wrongdoing and thus to deter misconduct (ii) involves particularly egregious or extensive misconduct (iii) involves potentially widespread and extensive harm to investors (iv) involves misconduct by persons occupying positions of substantial authority or responsibility or who owe fiduciary or other enhanced duties and obligations to a broad group of investors or others (v) involves potential wrongdoing as prohibited under newly-enacted legislation or regulatory rules (vi) concerns potential misconduct that occurred in connection with products markets transactions or practices that pose particularly significant risks for investors or a systemically important sector of the market (vii) involves a substantial number of potential victims and or particularly vulnerable victims (viii) involves products markets transactions or practices that the Enforcement Division has identified as priority areas (ie conduct relating to the financial crisis fraud in connection with mortgage-related securities financial fraud involving public companies whose stock is widely held misconduct by investment advisers and matters involving priorities established by particular regional offices or the specialized units) andor (ix) provides an opportunity to pursue priority interests shared by other law enforcement agencies on a coordinated basis
Fiscal Year FY 2008 FY 2009 FY 2010 FY 2011 FY 2012 FY 2013 Actual
Percentage Prior-year data not available 10 20 15
Responsible DivisionOffice Division of Enforcement
Data Source HUB case management and tracking system for the Division of Enforcement
PERFORMANCE INDICATOR (CONTEXTUAL) 234 Criminal actions related to conduct under investigation by the SEC
Description In some instances conduct may involve both civil and criminal violations and may be investigated by both the SEC and the criminal authorities This indicator identifies the number of criminal actions that are related to conduct under investigation by the SEC
Fiscal Year FY 2008 FY 2009 FY 2010 FY 2011 FY 2012 FY 2013 Actual
Number of criminal investigations Prior-year data not available
139 134 126 126
Responsible DivisionOffice Division of Enforcement
Data Source HUB case management and tracking system for the Division of Enforcement
PERFORMANCE INDICATOR (OUTPUT) 235 Disgorgement and penalties ordered and the amounts collected
Description In addition to other types of relief the SEC may seek orders requiring parties to disgorge any money obtained through wrongdoing The SEC is also empowered to seek civil penalties for violations of the securities laws In some cases the SEC will seek to obtain large monetary sanctions even in instances where the prospects of collecting on a judgment are slight The rationale for seeking monetary relief in these circumstances is that such relief even when likely uncollectible might become collectible in the future based on the defendantrsquos changed circumstances and also because such relief can serve to deter others from violating the securities laws Where appropriate the SEC has sought to return disgorged funds to harmed investors Funds not returned to investors are sent to the Treasury or the Investor Protection Fund established pursuant to Section 21F(g) of the Securities Exchange Act of 1934 This indicator lists disgorgement and penalties ordered as a result of SEC cases and the amounts collected in those actions This indicator could increase or decrease based on various factors
Fiscal Year FY 2008 FY 2009 FY 2010 FY 2011 FY 2012 FY 2013 Actual
Ordered amounts (in millions) 1030 2442 2846 2806 3104 3424
Collected amounts (in millions) 521 1694 1775 1281 1048 1603
Responsible DivisionOffice Division of Enforcement
Data Source DELPHI
36
FY 2015 CBJ FY 2015 APP AND FY 2013 APR bull FY 2015 ANNUAL PERFORMANCE PLAN
FY 2015 ANNUAL PERFORMANCE PLAN bull FY 2015 CBJ FY 2015 APP AND FY 2013 APR
Strategic Goal 3 Facilitate Access to the Information Investors Need to Make Informed Investment Decisions
The agency is requesting in FY 2015 a total of $2226 million and 651 FTEs towards achieving results in Strategic Goal 3
Budgeting for the Future (FY 2015)
An educated investing public ultimately provides the best defense against fraud and costly mistakes The federal securities laws place great emphasis on assuring that corporations investments companies and other entities provide investors with timely clear complete and accurate financial and non-financial information allowing investors to make wise investment decisions As part of its disclosure program CF and IM will continue in FY 2015 to meet the requirements of the Sarbanes-Oxley Act (Performance Goal 311) Accordingly CF and IM strive to review disclosures made by certain public issuers including issuersrsquo financial statements no less frequently than once every three years Additionally CF staff will strive to issue comments on a timely basis allowing companies seeking to raise capital by building offering schedules around the 30-day standard (Performance Goal 312) and IM will aim to exceed timeliness targets for
reviewing investment company disclosures (Performance Goal 313) Also in FY 2015 CF will continue to improve the quality of information provided to investors by focusing on disclosure by companies of the information most material to investment decision-making
OIEA responds to investment-related complaints and questions from tens of thousands of investors each year In FY 2015 staff is expected to close approximately 60 percent of complaints and inquiries within seven days and about 90 percent within 30 days (Performance Goal 322) The seven-day target has been adjusted to reflect new workload demands In FY 2015 OIEA will continue to refine internal processes and promote staff training to resolve matters OIEA expects to increase of the number of visitors to its investor education web pages by using social media technologies and partnering with the SECrsquos regional offices other federal and state agencies financial industry associations consumer groups and educational organizations on investor education programs OIEA also will continue to participate in a significant number of in-person outreach events in FY 2015 (Performance Goal 321)
Strategic Objective 31 The SEC works to ensure that investors have access to high-quality disclosure materials that facilitate informed investment decision-making
Goal Leader(s) Director Division of Trading and Markets Director Division of Corporation Finance Director Division of Investment Management
PERFORMANCE GOAL 311 Percentage of public companies and investment companies with disclosures reviewed each year
Description The Sarbanes-Oxley Act requires that the SEC review at least once every three years the disclosures of all companies and investment company portfolios reporting under the Exchange Act These reviews help improve the information available to investors and may identify possible violations of the federal securities laws This metric gauges the number of public companies and investment companies reviewed each year
FY 2013 FY 2013 FY 2014 FY 2015 Fiscal Year FY 2008 FY 2009 FY 2010 FY 2011 FY 2012 Plan Actual Estimate Request
Division of Corporation Finance
Corporations 39 40 44 48 48 33 52 33 33
Responsible DivisionOffice Division of Corporation Finance
Data Source Electronic Data Gathering Analysis and Retrieval (EDGAR)Filing Activity Tracking System (FACTS)
Division of Investment Management
Investment Company Portfolios 36 35 35 33 36 33 34 33 33
Responsible DivisionOffice Division of Investment Management
Data Source Microsoft Office Suite Tools
37
FY 2015 CBJ FY 2015 APP AND FY 2013 APR bull FY 2015 ANNUAL PERFORMANCE PLAN
PERFORMANCE GOAL 312 Time to issue initial comments on Securities Act filings
Description The target of 30 days or less has become a de facto industry standard for the maximum time to receive initial comments
FY 2013 FY 2013 FY 2014 FY 2015 Fiscal Year FY 2008 FY 2009 FY 2010 FY 2011 FY 2012 Plan Actual Estimate Request
Days 252 253 241 244 249 lt30 256 lt30 lt30 days days days days days days days days days
Responsible DivisionOffice Division of Corporation Finance
Data Source FACTS
PERFORMANCE GOAL 313 Percentage of investment company disclosure reviews for which initial comments are completed within timeliness goals
Description For initial registration statements the SECrsquos goal is to issue initial comments within 30 days after they are filed (60 days for registration statements of insurance product separate accounts and related mutual funds) The SEC also aims to comment on post-effective amendments within 45 days and preliminary proxy statements within 10 days after they are filed
FY 2013 FY 2013 FY 2014 FY 2015 Fiscal Year FY 2008 FY 2009 FY 2010 FY 2011 FY 2012 Plan Actual Estimate Request
Initial registration statements 95 95 93 92 96 85 98 85 85
Post-effective amendments 97 97 94 94 95 90 99 90 90
Preliminary proxy statements 99 99 99 98 100 99 98 99 99
Responsible DivisionOffice Division of Investment Management
Data Source Electronic Data Gathering Analysis and Retrieval (EDGAR)
PERFORMANCE INDICATOR (CONTEXTUAL) 311 Total digital audience including website social media and mobile media
Description Digital media has become the dominant channel for investors seeking to access information These statistics will help evaluate the extent to which investors are turning to the SEC identify the channels they use and quantify the amount of information they receive
FY 2013 Fiscal Year FY 2008 FY 2009 FY 2010 FY 2011 FY 2012 Actual
SECgov page views Prior-year data not available 372B
Social media followers 0 1608 83141 193837 236700 258733
Total emailmobile subscriptions Prior-year data not available 519602 631839 740318
Total email bulletins sent NA 875518 1280M 2397M 3344M 4085M
Total mobile bulletins sent NA 6001 62324 107848 150303 238815
Responsible DivisionOffice Office of Public Affairs
Data Source Akamai Technologies Google Analytics GovDelivery Hootsuite Social Media Channels
38
rsquo
FY 2015 ANNUAL PERFORMANCE PLAN bull FY 2015 CBJ FY 2015 APP AND FY 2013 APR
Strategic Objective 32 The SEC works to understand investor needs and educate investors so they are better prepared to make informed investment decisions
Goal Leader(s) Director Office of Investor Education and Advocacy
PERFORMANCE GOAL 321 Number of page views of online investor education content and number of in-person events
including those with specifically targeted communities and organizations
Description The Office of Investor Education and Advocacy (OIEA) initiates investor education campaigns on key strategies for making informed investment decisions including publicizing online resources for researching investment professionals and investments understanding fees and identifying fraud OIEA staff also participates in in-person events for investors generally and those targeted to specific investors such as seniors service members and other affinity groups This metric tracks page views of SEC online investor education materials and the number of investor events in which OIEA staff participated
FY 2013 FY 2013 FY 2014 FY 2015 Fiscal Year FY 2008 FY 2009 FY 2010 FY 2011 FY 2012 Plan Actual Estimate Request
Number of page views Prior-year data not available 15 121 15 20
Number of ldquoin-personrdquo events Prior-year data not available 50 52 50 50
Responsible DivisionOffice Office of Investor Education and Advocacy
Data Source Microsoft Office Suite Tools
PERFORMANCE GOAL 322 Timeliness of responses to investor contacts
Description OIEA serves the tens of thousands of investors each year who contact the SEC with investment-related complaints and questions The staff aims to close out as many new investor assistance matters as possible within seven and thirty business days
FY 2013 FY 2013 FY 2014 FY 2015 Fiscal Year FY 2008 FY 2009 FY 2010 FY 2011 FY 2012 Plan Actual Estimate Request
Closed within 7 days 78 70 72 67 54 50 62 60 60
Closed within 30 days 88 90 93 92 93 90 93 90 90
Responsible DivisionOffice Office of Investor Education and Advocacy
Data Source Internal log using IRIS data
PERFORMANCE GOAL 323 Customer satisfaction rating of OIEA s online investor education resources
Description This metric gauges the effectiveness helpfulness and usability of OIEArsquos online investor education resources
FY 2013 FY 2013 FY 2014 FY 2015 Fiscal Year FY 2008 FY 2009 FY 2010 FY 2011 FY 2012 Plan Actual Estimate Request
Satisfaction index Benchmark Benchmark score for score for
Prior-year data not available NA 81 federal federal government government
websites websites
Responsible DivisionOffice Office of Investor Education and Advocacy
Data Source ForeSee results online portal
39
FY 2015 CBJ FY 2015 APP AND FY 2013 APR bull FY 2015 ANNUAL PERFORMANCE PLAN
PERFORMANCE GOAL 324 Number of new investor education materials designed specifically to help investors protect themselves from fraud
Description Through OIEA and often in conjunction with other organizations the staff issues Investor Alerts and other forms of educational material that inform investors about different permutations of fraud new investment products and other topical issues This metric measures the number of new investor education materials issued by OIEA
FY 2013 FY 2013 FY 2014 FY 2015 Fiscal Year FY 2008 FY 2009 FY 2010 FY 2011 FY 2012 Plan Actual Estimate Request
Number of education materials Prior-year data 16 24 24 26 26 26
not available
Responsible DivisionOffice Office of Investor Education and Advocacy
Data Source wwwsecgov and wwwinvestorgov
PERFORMANCE INDICATOR (PROCESS) 321 Number of investor testing research projects
Description This indicator tracks the number of research initiatives used to gather feedback from investors on the usefulness of disclosures and other input on SEC rulemaking
FY 2013 Fiscal Year FY 2008 FY 2009 FY 2010 FY 2011 FY 2012 Actual
Number of projects 1 0 0 2 2
Responsible DivisionOffice Office of Investor Education and Advocacy
Data Source Microsoft Office Suite Tools
PERFORMANCE INDICATOR (PROCESS) 322 Number of sets of recommendations prepared by the investor advisor y committee
Description This indicator tracks the recommendations from the Investor Advisory Committee regarding investorsrsquo perspectives and priorities
FY 2013 Fiscal Year FY 2008 FY 2009 FY 2010 FY 2011 FY 2012 Actual
Number of sets of recommendations Prior-year data not available 0 4
Responsible DivisionOffice Office of Investor Education and Advocacy
Data Source wwwsecgov
26
0
40
Strategic Goal 4 Enhance the Commissionrsquos Performance through Effective Alignment and Management of Human Information and Financial Capital During FY 2015 the agency will continue to focus on recruiting and retaining high-performing staff and updating the expertise of SEC employees so they are abreast of the latest developments in the securities markets Furthermore the SEC will continue to strengthen internal controls The agency is requesting a total of $3599 million and 867 FTEs in FY 2015 to achieve results in Strategic Goal 4
Budgeting for the Future (FY 2015)
The investing public and the securities markets are best served by an efficient effective and agile SEC In FY 2015 the agency will continue to take steps to become a more effective regulator of the US financial markets by making sound investments in human capital and new technologies and enhancing internal controls
The planned investment in the SEC University for FY 2015 principally supports training and development for employees directly involved in examinations investigations fraud detection litigation and other core mission responsibilities of the agency The SEC University will provide specialized in-depth training concerning changing market conditions analytics and forensics and the agencyrsquos new responsibility areas The investment also will fund employees for certain specialized financial certifications and regulatory credentials as well as the advanced continuing education required for maintaining legal and financial credentials
To maintain mission effectiveness it is essential that attrition in the leadership ranks is quickly addressed by having a highly qualified and diverse pool of candidates ready to assume those
critical roles (Performance Goal 415) The Office of Human Resourcesrsquo (OHR) Workforce Planning has completed building the foundational database necessary to conduct succession planning A subset of this team has begun benchmarking succession planning approaches used by other Federal agencies and will develop and implement a program at the SEC by the end of FY 2014 The first measure is expected by September 30 2014
Leveraging modern reliable and innovative technologies together with predictive analytics will transform the way the SEC performs its mission and provide a proactive view into how technology impacts capital markets The SEC will derive significant and measurable performance improvements in core operations and increase value for users through the use of automated enterprise processes
The continuing implementation of OITrsquos Technology Transformation Plan (ldquoWorking Smarterrdquo) in FY 2015 will support vital technology initiatives It will ensure the SECrsquos business processes are streamlined integrated and implemented using the best technology available
While the SEC has made significant strides in its multi-year path towards a strong sustainable internal control posture the agency will continue to dedicate its energies towards remediating the significant deficiency in information security During FY 2015 OFM will work closely with the Department of Transportationrsquos Federal Shared Services Provider (FSSP) to implement its software upgrade and refine the new Federal government-wide travel management system
41
FY 2015 ANNUAL PERFORMANCE PLAN bull FY 2015 CBJ FY 2015 APP AND FY 2013 APR
FY 2015 CBJ FY 2015 APP AND FY 2013 APR bull FY 2015 ANNUAL PERFORMANCE PLAN
Strategic Objective 41 The SEC promotes a results-oriented work environment that attracts engages and retains a technically proficient and diverse workforce including leaders who provide motivation and strategic direction
Goal Leader(s) Director Office of Human Resources Director Office of Minority and Women Inclusion
PERFORMANCE GOAL 411 Turnover
Description When employee morale and engagement are high high-performing employees tend to remain in the organization Although turnover can fluctuate based on a variety of factors the SEC aims to keep its turnover rate relatively low below 8 per year
FY 2013 FY 2013 FY 2014 FY 2015 Fiscal Year FY 2008 FY 2009 FY 2010 FY 2011 FY 2012 Plan Actual Estimate Request
Percent turnover 62 37 5 64 658 lt8 658 lt8 lt8
Responsible DivisionOffice Office of Human Resources
Data Source The National Business Center at Department of Interior (DOI)
PERFORMANCE GOAL 412 Expanding staff expertise
Description Internal training and hiring programs are designed to help the agency recruit and develop a diverse and qualified staff with the key skills industry knowledge and expertise to support the SEC mission In particular there is a need to train examiners attorneys economists and other experts for subject matter expertise relevant to the marketplace and investment and trading practices This metric tracks whether certain areas requiring significant training are being addressed The agency will track the number of SEC staff participants in mission-focused training and development programs and will report on specific items through the use of post-course evaluations to assess the impact and results of this training on a five-point scale
FY 2013 FY 2013 FY 2014 FY 2015 Fiscal Year FY 2008 FY 2009 FY 2010 FY 2011 FY 2012 Plan Actual Estimate Request
Mission-focused training attendance Prior year data not available NA NA 12000 12120
Post-course evaluations of mission-Prior year data not available NA NA 45 45
focused training
Responsible DivisionOffice Office of Human Resources
Data Source Course Attendance Identified in LEAP (Instructor-led courses only) and End of Course Evaluation Report Summary provided by Metrics that Matter
PERFORMANCE GOAL 413 Number of diversity-related partnershipsalliances
Description Increased numbers of diversity-related partnerships or alliances with professional associations and educational organizations provide opportunities to educate students about the SECrsquos work and to recruit career professionals from all segments of society The SEC will track the number of partnerships andor alliances with diverse professional associations and educational organizations
FY 2013 FY 2013 FY 2014 FY 2015 Fiscal Year FY 2008 FY 2009 FY 2010 FY 2011 FY 2012 Plan Actual Estimate Request
Number of partnershipsalliances Prior-year data 2 10 12 15 13 15
not available
Responsible DivisionOffice Office of Minority Women and Inclusion
Data Source Office of Minority Women and Inclusion Internal Records and Section 342 of DFA
15
42
FY 2015 ANNUAL PERFORMANCE PLAN bull FY 2015 CBJ FY 2015 APP AND FY 2013 APR
PERFORMANCE GOAL 414 Sur vey rankings
Description Annual and other rankings together with other metrics and indicators of federal government agencies will be used as one kind of metric to determine the SECrsquos overall success in improving employee morale and employee engagement
FY 2013 FY 2013 FY 2014 FY 2015 Fiscal Year FY 2008 FY 2009 FY 2010 FY 2011 FY 2012 Plan Actual Estimate Request
Best Places to Work ranking Ranked Ranked Ranked Ranked Ranked Ranked Ranked Ranked Ranked 3 11 24 27 19 20 15 5 5
Average of employee engagement Prior-year data not available NA 61 75 75
and global satisfaction index
Responsible DivisionOffice Office of Human Resources
Data Source Annual Partnership for Public Service calculated ranking based on Annual Employee Viewpoint Survey (EVS) administered by OPM and Average of Employee Engagement and Global Satisfaction Index from OPM Employee Viewpoint Survey (EVS)
PERFORMANCE GOAL 415 Bench strength
Description To maintain mission effectiveness it is essential that attrition in the leadership ranks is quickly addressed by having a highly qualified and diverse pool of candidates ready to assume those critical roles Success is measured by the percentage of key leadership positions for which the SEC has identified a pool of qualified candidates
FY 2013 FY 2013 FY 2014 FY 2015 Fiscal Year FY 2008 FY 2009 FY 2010 FY 2011 FY 2012 Plan Actual Estimate Request
Data point under development NA NA NA NA NA NA NA TBD TBD
Responsible DivisionOffice Office of Human Resources
Data Source TBD
Strategic Objective 42 The SEC encourages a collaborative environment across divisions and offices and leverages technology and data to fulfill its mission more effectively and efficiently
Goal Leader(s) Director Office of Information Technology
PERFORMANCE GOAL 421 Ensure SECrsquos systems and applications are available
Description The SEC aims to enhance its computing infrastructure to eliminate down time if systems at one site fail among other objectives This metric will capture the percentage of systems and applications that can fail over within 8 hours
FY 2013 FY 2013 FY 2014 FY 2015 Fiscal Year FY 2008 FY 2009 FY 2010 FY 2011 FY 2012 Plan Actual Estimate Request
Percentage of servers virtualized NA 12 22 38 79 85 93 94 95
Percentage fail over within 8 hours NA NA NA NA NA NA NA 100 100
Responsible DivisionOffice Office of Information Technology
Data Source OIT Network Operations Center (NOC) ndash automated network monitoring tools
43
FY 2015 CBJ FY 2015 APP AND FY 2013 APR bull FY 2015 ANNUAL PERFORMANCE PLAN
PERFORMANCE GOAL 422 Equip the SEC with an enhanced technology infrastructure to support enterprise infrastructure
Description The SEC aims to promote collaboration and information sharing across the enterprise To improve efficiency and knowledge management the SEC will consolidate and centralize its collaborative technologies to a commonly used enterprise set by 2020 This metric will measure the percentage of the SECrsquos offices and divisions that utilize centralized enterprise collaboration solutions
FY 2013 FY 2013 FY 2014 FY 2015 Fiscal Year FY 2008 FY 2009 FY 2010 FY 2011 FY 2012 Plan Actual Estimate Request
Number of enterprise solutions Prior-year data not 10 20 25 30 30 35 40
available
Responsible DivisionOffice Office of Information Technology
Data Source Approved software applications list
PERFORMANCE GOAL 423 Expand the SECrsquos video teleconferencing (VTC) capabilities to support an increasingly geographically dispersed workforce
Description The SEC seeks to develop a state of the art video teleconference solution that allows users to conduct a videoteleconference meeting between HQ regional offices and multiple endpoints simultaneously collaborate and share presentation materials and use VoIP technology to host video teleconferences from their officesworkspaces with other SEC users or conference rooms This metric will measure the average ldquouptimerdquo or availability of all VTC systems
FY 2013 FY 2013 FY 2014 FY 2015 Fiscal Year FY 2008 FY 2009 FY 2010 FY 2011 FY 2012 Plan Actual Estimate Request
Availability rate for VTC solutions Prior-year data not available 75 80 9999 9999
Responsible DivisionOffice Office of Information Technology
Data Source Telecommunications monitoring system
PERFORMANCE GOAL 424 Pursue continuous technology cost reductions and efficiencies
Description Recent technology enhancements ndash eg data center consolidation virtualization and maintenance contract reductions ndash are producing technical efficiencies and cost savings This metric will measure the amount of these costs savings
FY 2013 FY 2013 FY 2014 FY 2015 Fiscal Year FY 2008 FY 2009 FY 2010 FY 2011 FY 2012 Plan Actual Estimate Request
Percent reduction in operational run 1-3 187 1 2 cost leveraging technology and cost cost reduction reduction process efficiencies
Prior-year data not available reduction in steady
reduction in steady
in run costs
in run costs
state run state run costs costs1
Responsible DivisionOffice Office of Information Technology
Data Source OIT Network Operations Center (NOC)
The higher than expected FY 2013 actual of 187 percent is due to one-time technologies enhancements resulting from the data consolidation and virtualization 1
44
FY 2015 ANNUAL PERFORMANCE PLAN bull FY 2015 CBJ FY 2015 APP AND FY 2013 APR
PERFORMANCE GOAL 425 Enhance the SECrsquos enterprise data warehouse infrastructure and performance
Description The Enterprise Data Warehouse (EDW) infrastructure will enable the provisioning of data to Commission staff for search and analysis through a virtual data warehouse platform This metric will measure the availability of EDW and data sources
FY 2013 FY 2013 FY 2014 FY 2015 Fiscal Year FY 2008 FY 2009 FY 2010 FY 2011 FY 2012 Plan Actual Estimate Request
Availability rate for the EDW infrastructure components in Prior-year data not available NA NA 99 99 production
Responsible DivisionOffice Office of Information Technology
Data Source OIT Network Operations Center (NOC) ndash automated network monitoring tools
Strategic Objective 43 The SEC maximizes the use of agency resources by continually improving agency operations and bolstering internal controls
Goal Leader(s) Chief Financial Officer Chief Operations Officer
PERFORMANCE GOAL 431 Financial audit results
Description Under the Accountability of Taxpayer Dollars Act of 2002 the agency is required to meet all proprietary and budgetary accounting guidelines for federal agencies and to undergo annual audits The SECrsquos audits are conducted by the Government Accountability Office
FY 2013 FY 2013 FY 2014 FY 2015 Fiscal Year FY 2008 FY 2009 FY 2010 FY 2011 FY 2012 Plan Actual Estimate Request
Unqualified opinion Yes Yes Yes Yes Yes Yes Yes Yes Yes
Material weaknesses 0 1 2 0 0 0 0 0 0
Significant deficiency 3 6 0 4 2 0 1 0 0
Responsible DivisionOffice Office of Financial Management
Data Source GAO SEC Financial Audit Report
PERFORMANCE GOAL 432 Assurance statement on internal control over operations
Description In accordance with OMB A-123 and Section 961 of the Dodd-Frank Act the SEC conducts an annual assessment of the effectiveness of internal controls The SEC will continue to develop its Operational Risk program and enhance cross-organizational processes to support all division and office management assurance statements Success is measured by the quality of risk and control assessments and management self-identification and resolution of improvement opportunities
FY 2013 FY 2013 FY 2014 FY 2015 Fiscal Year FY 2008 FY 2009 FY 2010 FY 2011 FY 2012 Plan Actual Estimate Request
Unqualified opinion Yes Yes Yes Yes Yes Yes Yes Yes Yes
Material weakness 0 0 0 0 0 0 0 0 0
Responsible DivisionOffice Office of the Chief Operating Officer
Data Source SEC Financial Audit Report
45
FY 2015 CBJ FY 2015 APP AND FY 2013 APR bull FY 2015 ANNUAL PERFORMANCE PLAN
1
PERFORMANCE GOAL 433 Timely completion of corrective action on Office of Inspector General (OIG) and the GAO audit recommendations1
Description Timely completion of audit recommendations is an important SEC priority This metric measures how well the Commission is doing in completing corrective action on OIG audit recommendations within established timeframes
FY 2013 FY 2013 FY 2014 FY 2015 Fiscal Year FY 2008 FY 2009 FY 2010 FY 2011 FY 2012 Plan Actual Estimate Request
OIG recommendations completed in Prior-year data not available NA 78 80 80
less than one year
Responsible DivisionOffice Office of the Chief Operating Officer
Data Source Audit Recommendation Tracking System
This measure was developed as part of the FY 2014-2018 SEC strategic planning process Currently there is no methodology in place to capture data for tracking all GAO Audit recommendations OCOO will determine a timeframe for establishing a methodology during FY 2014
46
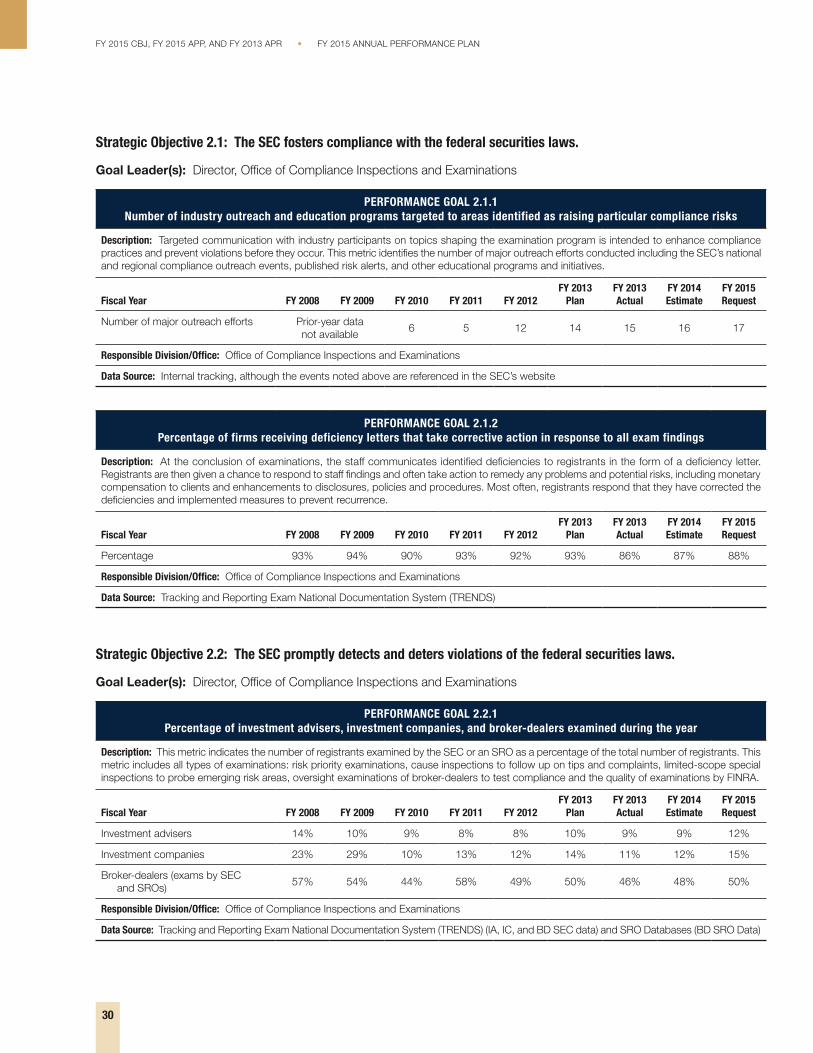
FY 2015 CBJ FY 2015 APP AND FY 2013 APR bull FY 2015 ANNUAL PERFORMANCE PLAN
Strategic Objective 21 The SEC fosters compliance with the federal securities laws
Goal Leader(s) Director Office of Compliance Inspections and Examinations
PERFORMANCE GOAL 211 Number of industr y outreach and education programs targeted to areas identified as raising particular compliance risks
Description Targeted communication with industry participants on topics shaping the examination program is intended to enhance compliance practices and prevent violations before they occur This metric identifies the number of major outreach efforts conducted including the SECrsquos national and regional compliance outreach events published risk alerts and other educational programs and initiatives
FY 2013 FY 2013 FY 2014 FY 2015 Fiscal Year FY 2008 FY 2009 FY 2010 FY 2011 FY 2012 Plan Actual Estimate Request
Number of major outreach efforts Prior-year data 6 5 12 14 15 16
not available
Responsible DivisionOffice Office of Compliance Inspections and Examinations
Data Source Internal tracking although the events noted above are referenced in the SECrsquos website
PERFORMANCE GOAL 212 Percentage of firms receiving deficiency letters that take corrective action in response to all exam findings
Description At the conclusion of examinations the staff communicates identified deficiencies to registrants in the form of a deficiency letter Registrants are then given a chance to respond to staff findings and often take action to remedy any problems and potential risks including monetary compensation to clients and enhancements to disclosures policies and procedures Most often registrants respond that they have corrected the deficiencies and implemented measures to prevent recurrence
FY 2013 FY 2013 FY 2014 FY 2015 Fiscal Year FY 2008 FY 2009 FY 2010 FY 2011 FY 2012 Plan Actual Estimate Request
Percentage 93 94 90 93 92 93 86 87 88
Responsible DivisionOffice Office of Compliance Inspections and Examinations
Data Source Tracking and Reporting Exam National Documentation System (TRENDS)
Strategic Objective 22 The SEC promptly detects and deters violations of the federal securities laws
Goal Leader(s) Director Office of Compliance Inspections and Examinations
PERFORMANCE GOAL 221 Percentage of investment advisers investment companies and broker-dealers examined during the year
Description This metric indicates the number of registrants examined by the SEC or an SRO as a percentage of the total number of registrants This metric includes all types of examinations risk priority examinations cause inspections to follow up on tips and complaints limited-scope special inspections to probe emerging risk areas oversight examinations of broker-dealers to test compliance and the quality of examinations by FINRA
FY 2013 FY 2013 FY 2014 FY 2015 Fiscal Year FY 2008 FY 2009 FY 2010 FY 2011 FY 2012 Plan Actual Estimate Request
Investment advisers 14 10 9 8 8 10 9 9 12
Investment companies 23 29 10 13 12 14 11 12 15
Broker-dealers (exams by SEC 57 54 44 58 49 50 46 48 50
and SROs)
Responsible DivisionOffice Office of Compliance Inspections and Examinations
Data Source Tracking and Reporting Exam National Documentation System (TRENDS) (IA IC and BD SEC data) and SRO Databases (BD SRO Data)
17
30
FY 2015 ANNUAL PERFORMANCE PLAN bull FY 2015 CBJ FY 2015 APP AND FY 2013 APR
PERFORMANCE GOAL 222 Percentage of compliance exams that are timely concluded in accordance with the Office of Compliance Inspections
and Examinationrsquos (OCIE) statutory deadline
Description The staff conducts examinations each year of registered entities including investment advisers investment company complexes transfer agents and broker-dealers The staff strives to complete its examinations and communicate findings in the most efficient and effective manner and within its statutory deadline This metric reflects the percentage of examinations concluded within the statutory deadline
FY 2013 FY 2013 FY 2014 FY 2015 Fiscal Year FY 2008 FY 2009 FY 2010 FY 2011 FY 2012 Plan Actual Estimate Request
Percentage Prior-year data NA NA NA 100 100 100 100
not available
Responsible DivisionOffice Office of Compliance Inspections and Examinations
Data Source Tracking and Reporting Exam National Documentation System (TRENDS)
PERFORMANCE GOAL 223 Number of joint exams information sharing agreements and formal meetings with other regulators
Description The SEC attempts to coordinate and collaborate with other regulators on areas of mutual interest This helps to ensure that all regulators are informed of on-going risks and issues related to broad market practices as well as specific entities of mutual interest This cooperation is critical to the exam program to ensure that certain higher risk firms and activities are addressed in the most efficient and effective manner This metric tracks critical cooperation activities that are occurring between the SECrsquos exam program and other regulators
FY 2013 FY 2013 FY 2014 FY 2015 Fiscal Year FY 2008 FY 2009 FY 2010 FY 2011 FY 2012 Plan Actual Estimate Request
Number of joint exams active sharing Prior-year data not available NA NA 85 100
agreements and formal meetings
Responsible DivisionOffice Office of Compliance Inspections and Examinations
Data Source Various (including internal tracking and TRENDS)
PERFORMANCE INDICATOR (CONTEXTUAL) 221 Percentage of exams that identify deficiencies the percentage that result in a ldquosignificant findingrdquo
and the percentage referred to the Division of Enforcement
Description Examiners find a wide range of deficiencies during examinations Some of the deficiencies are more technical in nature such as failing to include all information that is required to be in a record However other deficiencies may cause harm to customers or clients of a firm have a high potential to cause harm or reflect recidivist misconduct The latter deficiencies are among those categorized as ldquosignificantrdquo This indicator identifies the percentage of exams that identified deficiencies that resulted in significant deficiency findings and that were referred to Enforcement
FY 2013 Fiscal Year FY 2008 FY 2009 FY 2010 FY 2011 FY 2012 Actual
Percentage that identify deficiencies Prior-year data 72 82 80 80
not available
Percentage that result in a ldquosignificant findingrdquo Prior-year data 42 42 42 35
not available
Percentage referred to the Division of Enforcement Prior-year data not available 13
Responsible DivisionOffice Office of Compliance Inspections and Examinations
Data Source Tracking and Reporting Exam National Documentation System (TRENDS)
31
PERFORMANCE INDICATOR (OUTPUT) 222 Number of cause exams that result from tips complaints and referrals
Description Analysis of a tip can support the request for a cause exam This indicator would identify the number of SEC cause exams that result from tips collected through outreach efforts
Fiscal Year FY 2008 FY 2009 FY 2010 FY 2011 FY 2012 FY 2013 Actual
Number of cause exams Prior-year data not available
NA NA NA 222
Responsible DivisionOffice Office of Compliance Inspections and Examinations
Data Source Tracking and Reporting Exam National Documentation System (TRENDS)
PERFORMANCE INDICATOR (OUTPUT) 223 Number of rule-making initiatives assisted by the National Exam Program
Description The examination program interacts with registrants on a regular basis and this work provides critical feedback to ensuring effective and practical rulemaking and policy efforts This indicator tracks how frequently the examination program assists with rulemaking initiatives
Fiscal Year FY 2008 FY 2009 FY 2010 FY 2011 FY 2012 FY 2013 Actual
Number of rule-making initiatives assisted by the NEP Prior-year data not available NA
Responsible DivisionOffice Office of Compliance Inspections and Examinations
Data Source Internal tracking
PERFORMANCE INDICATOR (OUTPUT) 224 Number of investigations or inquiries originating from a tip or complaint
Description Analysis of a tip or complaint can result in the need for further enforcement investigation The indicator identifies the volume of SEC investigations that result from tips and complaints received by the SEC
Fiscal Year FY 2008 FY 2009 FY 2010 FY 2011 FY 2012 FY 2013 Actual
Number of investigations Prior-year data not available
303 349 296 289
Responsible DivisionOffice Division of Enforcement
Data Source HUB case management and tracking system for the Division of Enforcement
PERFORMANCE INDICATOR (OUTPUT) 225 SEC investigations in which requests for access to information were granted by the SEC to other authorities
such as SROs or other state federal and foreign enforcement authorities
Description The SEC works closely with other regulators and authorities This measure identifies the number of investigations in which the SEC granted one or more authorities access to information concerning an investigation during the fiscal year This may include requests for access to SEC investigative files concerning investigations that the SEC continues to pursue as well as those in which the SEC has completed its investigation
Fiscal Year FY 2008 FY 2009 FY 2010 FY 2011 FY 2012 FY 2013 Actual
Number of investigations Prior-year data not available
492 586 515 504
Responsible DivisionOffice Division of Enforcement
Data Source HUB case management and tracking system for the Division of Enforcement
32
FY 2015 CBJ FY 2015 APP AND FY 2013 APR bull FY 2015 ANNUAL PERFORMANCE PLAN
FY 2015 ANNUAL PERFORMANCE PLAN bull FY 2015 CBJ FY 2015 APP AND FY 2013 APR
PERFORMANCE INDICATOR (OUTPUT) 226 Requests from foreign authorities for SEC assistance and SEC requests for assistance from foreign authorities
Description Each year the SEC makes hundreds of requests for enforcement assistance to foreign regulators while responding to hundreds of such requests from other nations To facilitate this type of assistance and encourage other countries to enact laws necessary to allow regulators to cooperate with their foreign counterparts the SEC has entered into bilateral information sharing arrangements as well as the Multilateral Memorandum of Understanding an information-sharing arrangement negotiated through the International Organization of Securities Commissions (IOSCO)
FY 2013 Fiscal Year FY 2008 FY 2009 FY 2010 FY 2011 FY 2012 Actual
Number of requests from foreign authorities 414 408 457 492 450
Number of SEC requests 594 774 605 772 718
Responsible DivisionOffice Office of International Affairs
Data Source International Program Oversight Database and Business Objects reports
Strategic Objective 23 The SEC prosecutes violations of federal securities laws and holds violators accountable through appropriate sanctions and remedies
Goal Leader(s) Director Division of Enforcement
PERFORMANCE GOAL 231 Percentage of enforcement actions in which the Commission obtained relief on one or more claims
Description This metric identifies as to all parties to enforcement actions that were resolved in the fiscal year the percentage against whom the Commission obtained a judgment or order entered on consent a default judgment a judgment of liability on one or more charges andor the imposition of monetary or other relief
FY 2013 FY 2013 FY 2014 FY 2015 Fiscal Year FY 2008 FY 2009 FY 2010 FY 2011 FY 2012 Plan Actual Estimate Request
Percentage 92 92 92 93 89 92 93 92 92
Responsible DivisionOffice Division of Enforcement
Data Source HUB case management and tracking system for the Division of Enforcement
PERFORMANCE GOAL 232 Percentage of first enforcement actions filed within two years of the opening of an investigation
Description This metric concerns the pace of investigations that lead to the filing of enforcement actions Specifically this metric captures the rate at which the first enforcement action arising out of an investigation was filed within two years of the opening of the investigation If the investigation was preceded by a matter under inquiry the metric draws on the date of the opening of the matter under inquiry In conducting investigations the Enforcement program continually strives to balance the need for complete effective and fair investigations with the need to file enforcement actions in as timely a manner as possible
FY 2013 FY 2013 FY 2014 FY 2015 Fiscal Year FY 2008 FY 2009 FY 2010 FY 2011 FY 2012 Plan Actual Estimate Request
Percentage 62 70 67 61 63 65 58 65 65
Responsible DivisionOffice Division of Enforcement
Data Source HUB case management and tracking system for the Division of Enforcement
508
717
33
FY 2015 CBJ FY 2015 APP AND FY 2013 APR bull FY 2015 ANNUAL PERFORMANCE PLAN
PERFORMANCE GOAL 233 Average months between opening a matter under inquiry or an investigation and commencing an enforcement action
Description This metric captures the average number of months between the opening of an investigation and the filing of the first enforcement action arising out of that investigation If the investigation was preceded by a matter under inquiry the metric draws on the date of opening of the matter inquiry In conducting investigations the enforcement program continually strives to balance the need for complete effective and fair investigation with the need to file enforcement actions in as timely a manner as possible While not all investigations result in the filing of enforcement actions this metric provides information concerning the pace of investigations that do lead to such actions and supplements the previous goal which measures the percentage of first enforcement actions filed within two years
FY 2013 FY 2013 FY 2014 FY 2015 Fiscal Year FY 2008 FY 2009 FY 2010 FY 2011 FY 2012 Plan Actual Estimate Request
Months Prior-year data not available 22 21 20 21 20 20
Responsible DivisionOffice Division of Enforcement
Data Source HUB case management and tracking system for the Division of Enforcement
PERFORMANCE GOAL 234 Percentage of debts where either a payment has been made or a collection activity has
been initiated within 180 days of the due date of the debt
Description The SEC can seek a wide range of remedies for failure to comply with the securities laws These remedies include civil monetary penalties and disgorgement When the remedies are imposed by the SEC or the Federal district court payments must be made by a certain date This metric identifies the percentage of debts where debtors have made payments or the SEC has initiated a collection activity within 180 days of the due date Such collection activities include among other things demand letters negotiation of payment plans enforcing the payment of the debt through the courts or other judicial remedies
FY 2013 FY 2013 FY 2014 FY 2015 Fiscal Year FY 2008 FY 2009 FY 2010 FY 2011 FY 2012 Plan Actual Estimate Request
Percentage 88 90 86 91 92 92 95 95 95
Responsible DivisionOffice Division of Enforcement
Data Source DELPHI
PERFORMANCE GOAL 235 Percentage of Fair Fund and disgorgement fund plans that have distributed 80 percent of the available
funds for distribution within twenty four (24) months of the approval of the distribution plan
Description In addition to other types of relief the SEC may seek orders requiring parties to disgorge any money obtained through wrongdoing The SEC also is empowered to seek civil penalties for violations of the securities laws Where appropriate the SEC has sought to return disgorged funds to harmed investors and as a result of the Fair Funds provisions of the Sarbanes-Oxley Act and the Dodd-Frank Act to combine amounts paid as penalties with disgorged funds or to create a Fair Fund from penalties only to reduce losses to injured parties and to maximize funds available for distribution This metric identifies the percentage of distribution plans that reached a critical mass during the fiscal year and within twenty four (24) months of the approval of the distribution plan The distribution plan includes the timeline and procedures required to return the funds to injured investors This reflects Commission-wide efforts to implement plans to return money to investors quickly Any funds not returned to investors are sent to the US Treasury or the Investor Protection Fund established pursuant to Section 21F(g) of the Securities Exchange Act of 1934 Neither disgorgement nor penalties are used for the SECrsquos own expenses
FY 2013 FY 2013 FY 2014 FY 2015 Fiscal Year FY 2008 FY 2009 FY 2010 FY 2011 FY 2012 Plan Actual Estimate Request
Percentage Prior-year data not available 80 80 73 78 82
Responsible DivisionOffice Division of Enforcement
Data Source HUB case management and tracking system for the Division of Enforcement and Distributions Management System
34
PERFORMANCE INDICATOR (CONTEXTUAL) 232 Total amount distributed within the fiscal year and the number of Fair Funds from which those distributions came
Description In its enforcement actions the SEC may seek to return funds to harmed investors through disgorgement of ill-gotten gains or through the Fair Funds provision of the Sarbanes-Oxley Act This provision permits the SEC to combine amounts paid as penalties with disgorged funds or to create a Fair Fund from penalties only to reduce losses to injured parties This reflects the SECrsquos efforts to return funds to injured investors This indicator identifies the total amount distributed within the fiscal year and the number of Fair Funds from which those distributions came This indicator may increase or decrease in dollar amount and number of distribution funds based on the number of SEC enforcement actions brought involving distributions amounts ordered and paid in those actions and other factors Due to the variation in reporting timelines established for each individual distribution reported amounts are based on the agencyrsquos best available information Reported amounts do not include those funds distributed through receiverships Any funds not returned to investors are sent to the US Treasury or the Investor Protection Fund established pursuant to Section 21F(g) of the Securities Exchange Act of 1934 Neither disgorgement nor penalties are used for the Commissionrsquos own expenses
Fiscal Year FY 2008 FY 2009 FY 2010 FY 2011 FY 2012 FY 2013 Actual
Amount distributed (in millions) Prior-year data not available 815 251
Number of Fair Funds Prior-year data not available 31 22
Responsible DivisionOffice Division of Enforcement
Data Source HUB case management and tracking system for the Division of Enforcement Distributions Management System
PERFORMANCE INDICATOR (CONTEXTUAL) 231 Percentage of filed enforcement actions reflecting characteristics that present enhanced risk to investors and markets as
measured by the nature of the investigation conduct parties and impact
Description This indicator assesses the quality of the cases filed by the Division of Enforcement The indicator focuses on cases filed by the SEC that involve factors reflecting enhanced risk to investors and markets Such cases may involve (i) those identified through risk analytics and cross-disciplinary initiatives to reveal difficult-to-detect or early stage misconduct thus minimizing investor loss and preventing the spread of unlawful conduct and practices (ii) particularly egregious or widespread misconduct and investor harm (iii) vulnerable victims (iv) a high degree of scienter (v) involvement of individuals occupying substantial positions of authority or having fiduciary obligations or other special responsibilities to investors (vi) involvement of recidivists (vii) high amount of investor loss prevented (viii) misconduct that is difficult to detect due to the complexity of products transactions and practices (ix) use of innovative investigative or analytical techniques (x) effective coordination with other law enforcement partners andor (xi) whether the matter involves markets transactions or practices identified as an enforcement priority or that advances the programmatic priorities of other SEC Divisions or Offices
Fiscal Year FY 2008 FY 2009 FY 2010 FY 2011 FY 2012 FY 2013 Actual
Percentage Prior-year data not available NA NA
Responsible DivisionOffice Division of Enforcement
Data Source HUB case management and tracking system for the Division of Enforcement
35
FY 2015 ANNUAL PERFORMANCE PLAN bull FY 2015 CBJ FY 2015 APP AND FY 2013 APR
PERFORMANCE INDICATOR (OUTPUT) 233 Percent of enforcement actions filed that arose out of national priority investigations
Description The Division of Enforcement conducts many enforcement actions each year that can be characterized as high impact and of national priority High impact or national priority investigations include those investigations which are significant for one or more of the following reasons ndashthe matter (i) presents an opportunity to send a particularly strong and effective message of deterrence including with respect to markets products and transactions that are newly developing or that are long established but which by their nature present limited opportunities to detect wrongdoing and thus to deter misconduct (ii) involves particularly egregious or extensive misconduct (iii) involves potentially widespread and extensive harm to investors (iv) involves misconduct by persons occupying positions of substantial authority or responsibility or who owe fiduciary or other enhanced duties and obligations to a broad group of investors or others (v) involves potential wrongdoing as prohibited under newly-enacted legislation or regulatory rules (vi) concerns potential misconduct that occurred in connection with products markets transactions or practices that pose particularly significant risks for investors or a systemically important sector of the market (vii) involves a substantial number of potential victims and or particularly vulnerable victims (viii) involves products markets transactions or practices that the Enforcement Division has identified as priority areas (ie conduct relating to the financial crisis fraud in connection with mortgage-related securities financial fraud involving public companies whose stock is widely held misconduct by investment advisers and matters involving priorities established by particular regional offices or the specialized units) andor (ix) provides an opportunity to pursue priority interests shared by other law enforcement agencies on a coordinated basis
Fiscal Year FY 2008 FY 2009 FY 2010 FY 2011 FY 2012 FY 2013 Actual
Percentage Prior-year data not available 10 20 15
Responsible DivisionOffice Division of Enforcement
Data Source HUB case management and tracking system for the Division of Enforcement
PERFORMANCE INDICATOR (CONTEXTUAL) 234 Criminal actions related to conduct under investigation by the SEC
Description In some instances conduct may involve both civil and criminal violations and may be investigated by both the SEC and the criminal authorities This indicator identifies the number of criminal actions that are related to conduct under investigation by the SEC
Fiscal Year FY 2008 FY 2009 FY 2010 FY 2011 FY 2012 FY 2013 Actual
Number of criminal investigations Prior-year data not available
139 134 126 126
Responsible DivisionOffice Division of Enforcement
Data Source HUB case management and tracking system for the Division of Enforcement
PERFORMANCE INDICATOR (OUTPUT) 235 Disgorgement and penalties ordered and the amounts collected
Description In addition to other types of relief the SEC may seek orders requiring parties to disgorge any money obtained through wrongdoing The SEC is also empowered to seek civil penalties for violations of the securities laws In some cases the SEC will seek to obtain large monetary sanctions even in instances where the prospects of collecting on a judgment are slight The rationale for seeking monetary relief in these circumstances is that such relief even when likely uncollectible might become collectible in the future based on the defendantrsquos changed circumstances and also because such relief can serve to deter others from violating the securities laws Where appropriate the SEC has sought to return disgorged funds to harmed investors Funds not returned to investors are sent to the Treasury or the Investor Protection Fund established pursuant to Section 21F(g) of the Securities Exchange Act of 1934 This indicator lists disgorgement and penalties ordered as a result of SEC cases and the amounts collected in those actions This indicator could increase or decrease based on various factors
Fiscal Year FY 2008 FY 2009 FY 2010 FY 2011 FY 2012 FY 2013 Actual
Ordered amounts (in millions) 1030 2442 2846 2806 3104 3424
Collected amounts (in millions) 521 1694 1775 1281 1048 1603
Responsible DivisionOffice Division of Enforcement
Data Source DELPHI
36
FY 2015 CBJ FY 2015 APP AND FY 2013 APR bull FY 2015 ANNUAL PERFORMANCE PLAN
FY 2015 ANNUAL PERFORMANCE PLAN bull FY 2015 CBJ FY 2015 APP AND FY 2013 APR
Strategic Goal 3 Facilitate Access to the Information Investors Need to Make Informed Investment Decisions
The agency is requesting in FY 2015 a total of $2226 million and 651 FTEs towards achieving results in Strategic Goal 3
Budgeting for the Future (FY 2015)
An educated investing public ultimately provides the best defense against fraud and costly mistakes The federal securities laws place great emphasis on assuring that corporations investments companies and other entities provide investors with timely clear complete and accurate financial and non-financial information allowing investors to make wise investment decisions As part of its disclosure program CF and IM will continue in FY 2015 to meet the requirements of the Sarbanes-Oxley Act (Performance Goal 311) Accordingly CF and IM strive to review disclosures made by certain public issuers including issuersrsquo financial statements no less frequently than once every three years Additionally CF staff will strive to issue comments on a timely basis allowing companies seeking to raise capital by building offering schedules around the 30-day standard (Performance Goal 312) and IM will aim to exceed timeliness targets for
reviewing investment company disclosures (Performance Goal 313) Also in FY 2015 CF will continue to improve the quality of information provided to investors by focusing on disclosure by companies of the information most material to investment decision-making
OIEA responds to investment-related complaints and questions from tens of thousands of investors each year In FY 2015 staff is expected to close approximately 60 percent of complaints and inquiries within seven days and about 90 percent within 30 days (Performance Goal 322) The seven-day target has been adjusted to reflect new workload demands In FY 2015 OIEA will continue to refine internal processes and promote staff training to resolve matters OIEA expects to increase of the number of visitors to its investor education web pages by using social media technologies and partnering with the SECrsquos regional offices other federal and state agencies financial industry associations consumer groups and educational organizations on investor education programs OIEA also will continue to participate in a significant number of in-person outreach events in FY 2015 (Performance Goal 321)
Strategic Objective 31 The SEC works to ensure that investors have access to high-quality disclosure materials that facilitate informed investment decision-making
Goal Leader(s) Director Division of Trading and Markets Director Division of Corporation Finance Director Division of Investment Management
PERFORMANCE GOAL 311 Percentage of public companies and investment companies with disclosures reviewed each year
Description The Sarbanes-Oxley Act requires that the SEC review at least once every three years the disclosures of all companies and investment company portfolios reporting under the Exchange Act These reviews help improve the information available to investors and may identify possible violations of the federal securities laws This metric gauges the number of public companies and investment companies reviewed each year
FY 2013 FY 2013 FY 2014 FY 2015 Fiscal Year FY 2008 FY 2009 FY 2010 FY 2011 FY 2012 Plan Actual Estimate Request
Division of Corporation Finance
Corporations 39 40 44 48 48 33 52 33 33
Responsible DivisionOffice Division of Corporation Finance
Data Source Electronic Data Gathering Analysis and Retrieval (EDGAR)Filing Activity Tracking System (FACTS)
Division of Investment Management
Investment Company Portfolios 36 35 35 33 36 33 34 33 33
Responsible DivisionOffice Division of Investment Management
Data Source Microsoft Office Suite Tools
37
FY 2015 CBJ FY 2015 APP AND FY 2013 APR bull FY 2015 ANNUAL PERFORMANCE PLAN
PERFORMANCE GOAL 312 Time to issue initial comments on Securities Act filings
Description The target of 30 days or less has become a de facto industry standard for the maximum time to receive initial comments
FY 2013 FY 2013 FY 2014 FY 2015 Fiscal Year FY 2008 FY 2009 FY 2010 FY 2011 FY 2012 Plan Actual Estimate Request
Days 252 253 241 244 249 lt30 256 lt30 lt30 days days days days days days days days days
Responsible DivisionOffice Division of Corporation Finance
Data Source FACTS
PERFORMANCE GOAL 313 Percentage of investment company disclosure reviews for which initial comments are completed within timeliness goals
Description For initial registration statements the SECrsquos goal is to issue initial comments within 30 days after they are filed (60 days for registration statements of insurance product separate accounts and related mutual funds) The SEC also aims to comment on post-effective amendments within 45 days and preliminary proxy statements within 10 days after they are filed
FY 2013 FY 2013 FY 2014 FY 2015 Fiscal Year FY 2008 FY 2009 FY 2010 FY 2011 FY 2012 Plan Actual Estimate Request
Initial registration statements 95 95 93 92 96 85 98 85 85
Post-effective amendments 97 97 94 94 95 90 99 90 90
Preliminary proxy statements 99 99 99 98 100 99 98 99 99
Responsible DivisionOffice Division of Investment Management
Data Source Electronic Data Gathering Analysis and Retrieval (EDGAR)
PERFORMANCE INDICATOR (CONTEXTUAL) 311 Total digital audience including website social media and mobile media
Description Digital media has become the dominant channel for investors seeking to access information These statistics will help evaluate the extent to which investors are turning to the SEC identify the channels they use and quantify the amount of information they receive
FY 2013 Fiscal Year FY 2008 FY 2009 FY 2010 FY 2011 FY 2012 Actual
SECgov page views Prior-year data not available 372B
Social media followers 0 1608 83141 193837 236700 258733
Total emailmobile subscriptions Prior-year data not available 519602 631839 740318
Total email bulletins sent NA 875518 1280M 2397M 3344M 4085M
Total mobile bulletins sent NA 6001 62324 107848 150303 238815
Responsible DivisionOffice Office of Public Affairs
Data Source Akamai Technologies Google Analytics GovDelivery Hootsuite Social Media Channels
38
rsquo
FY 2015 ANNUAL PERFORMANCE PLAN bull FY 2015 CBJ FY 2015 APP AND FY 2013 APR
Strategic Objective 32 The SEC works to understand investor needs and educate investors so they are better prepared to make informed investment decisions
Goal Leader(s) Director Office of Investor Education and Advocacy
PERFORMANCE GOAL 321 Number of page views of online investor education content and number of in-person events
including those with specifically targeted communities and organizations
Description The Office of Investor Education and Advocacy (OIEA) initiates investor education campaigns on key strategies for making informed investment decisions including publicizing online resources for researching investment professionals and investments understanding fees and identifying fraud OIEA staff also participates in in-person events for investors generally and those targeted to specific investors such as seniors service members and other affinity groups This metric tracks page views of SEC online investor education materials and the number of investor events in which OIEA staff participated
FY 2013 FY 2013 FY 2014 FY 2015 Fiscal Year FY 2008 FY 2009 FY 2010 FY 2011 FY 2012 Plan Actual Estimate Request
Number of page views Prior-year data not available 15 121 15 20
Number of ldquoin-personrdquo events Prior-year data not available 50 52 50 50
Responsible DivisionOffice Office of Investor Education and Advocacy
Data Source Microsoft Office Suite Tools
PERFORMANCE GOAL 322 Timeliness of responses to investor contacts
Description OIEA serves the tens of thousands of investors each year who contact the SEC with investment-related complaints and questions The staff aims to close out as many new investor assistance matters as possible within seven and thirty business days
FY 2013 FY 2013 FY 2014 FY 2015 Fiscal Year FY 2008 FY 2009 FY 2010 FY 2011 FY 2012 Plan Actual Estimate Request
Closed within 7 days 78 70 72 67 54 50 62 60 60
Closed within 30 days 88 90 93 92 93 90 93 90 90
Responsible DivisionOffice Office of Investor Education and Advocacy
Data Source Internal log using IRIS data
PERFORMANCE GOAL 323 Customer satisfaction rating of OIEA s online investor education resources
Description This metric gauges the effectiveness helpfulness and usability of OIEArsquos online investor education resources
FY 2013 FY 2013 FY 2014 FY 2015 Fiscal Year FY 2008 FY 2009 FY 2010 FY 2011 FY 2012 Plan Actual Estimate Request
Satisfaction index Benchmark Benchmark score for score for
Prior-year data not available NA 81 federal federal government government
websites websites
Responsible DivisionOffice Office of Investor Education and Advocacy
Data Source ForeSee results online portal
39
FY 2015 CBJ FY 2015 APP AND FY 2013 APR bull FY 2015 ANNUAL PERFORMANCE PLAN
PERFORMANCE GOAL 324 Number of new investor education materials designed specifically to help investors protect themselves from fraud
Description Through OIEA and often in conjunction with other organizations the staff issues Investor Alerts and other forms of educational material that inform investors about different permutations of fraud new investment products and other topical issues This metric measures the number of new investor education materials issued by OIEA
FY 2013 FY 2013 FY 2014 FY 2015 Fiscal Year FY 2008 FY 2009 FY 2010 FY 2011 FY 2012 Plan Actual Estimate Request
Number of education materials Prior-year data 16 24 24 26 26 26
not available
Responsible DivisionOffice Office of Investor Education and Advocacy
Data Source wwwsecgov and wwwinvestorgov
PERFORMANCE INDICATOR (PROCESS) 321 Number of investor testing research projects
Description This indicator tracks the number of research initiatives used to gather feedback from investors on the usefulness of disclosures and other input on SEC rulemaking
FY 2013 Fiscal Year FY 2008 FY 2009 FY 2010 FY 2011 FY 2012 Actual
Number of projects 1 0 0 2 2
Responsible DivisionOffice Office of Investor Education and Advocacy
Data Source Microsoft Office Suite Tools
PERFORMANCE INDICATOR (PROCESS) 322 Number of sets of recommendations prepared by the investor advisor y committee
Description This indicator tracks the recommendations from the Investor Advisory Committee regarding investorsrsquo perspectives and priorities
FY 2013 Fiscal Year FY 2008 FY 2009 FY 2010 FY 2011 FY 2012 Actual
Number of sets of recommendations Prior-year data not available 0 4
Responsible DivisionOffice Office of Investor Education and Advocacy
Data Source wwwsecgov
26
0
40
Strategic Goal 4 Enhance the Commissionrsquos Performance through Effective Alignment and Management of Human Information and Financial Capital During FY 2015 the agency will continue to focus on recruiting and retaining high-performing staff and updating the expertise of SEC employees so they are abreast of the latest developments in the securities markets Furthermore the SEC will continue to strengthen internal controls The agency is requesting a total of $3599 million and 867 FTEs in FY 2015 to achieve results in Strategic Goal 4
Budgeting for the Future (FY 2015)
The investing public and the securities markets are best served by an efficient effective and agile SEC In FY 2015 the agency will continue to take steps to become a more effective regulator of the US financial markets by making sound investments in human capital and new technologies and enhancing internal controls
The planned investment in the SEC University for FY 2015 principally supports training and development for employees directly involved in examinations investigations fraud detection litigation and other core mission responsibilities of the agency The SEC University will provide specialized in-depth training concerning changing market conditions analytics and forensics and the agencyrsquos new responsibility areas The investment also will fund employees for certain specialized financial certifications and regulatory credentials as well as the advanced continuing education required for maintaining legal and financial credentials
To maintain mission effectiveness it is essential that attrition in the leadership ranks is quickly addressed by having a highly qualified and diverse pool of candidates ready to assume those
critical roles (Performance Goal 415) The Office of Human Resourcesrsquo (OHR) Workforce Planning has completed building the foundational database necessary to conduct succession planning A subset of this team has begun benchmarking succession planning approaches used by other Federal agencies and will develop and implement a program at the SEC by the end of FY 2014 The first measure is expected by September 30 2014
Leveraging modern reliable and innovative technologies together with predictive analytics will transform the way the SEC performs its mission and provide a proactive view into how technology impacts capital markets The SEC will derive significant and measurable performance improvements in core operations and increase value for users through the use of automated enterprise processes
The continuing implementation of OITrsquos Technology Transformation Plan (ldquoWorking Smarterrdquo) in FY 2015 will support vital technology initiatives It will ensure the SECrsquos business processes are streamlined integrated and implemented using the best technology available
While the SEC has made significant strides in its multi-year path towards a strong sustainable internal control posture the agency will continue to dedicate its energies towards remediating the significant deficiency in information security During FY 2015 OFM will work closely with the Department of Transportationrsquos Federal Shared Services Provider (FSSP) to implement its software upgrade and refine the new Federal government-wide travel management system
41
FY 2015 ANNUAL PERFORMANCE PLAN bull FY 2015 CBJ FY 2015 APP AND FY 2013 APR
FY 2015 CBJ FY 2015 APP AND FY 2013 APR bull FY 2015 ANNUAL PERFORMANCE PLAN
Strategic Objective 41 The SEC promotes a results-oriented work environment that attracts engages and retains a technically proficient and diverse workforce including leaders who provide motivation and strategic direction
Goal Leader(s) Director Office of Human Resources Director Office of Minority and Women Inclusion
PERFORMANCE GOAL 411 Turnover
Description When employee morale and engagement are high high-performing employees tend to remain in the organization Although turnover can fluctuate based on a variety of factors the SEC aims to keep its turnover rate relatively low below 8 per year
FY 2013 FY 2013 FY 2014 FY 2015 Fiscal Year FY 2008 FY 2009 FY 2010 FY 2011 FY 2012 Plan Actual Estimate Request
Percent turnover 62 37 5 64 658 lt8 658 lt8 lt8
Responsible DivisionOffice Office of Human Resources
Data Source The National Business Center at Department of Interior (DOI)
PERFORMANCE GOAL 412 Expanding staff expertise
Description Internal training and hiring programs are designed to help the agency recruit and develop a diverse and qualified staff with the key skills industry knowledge and expertise to support the SEC mission In particular there is a need to train examiners attorneys economists and other experts for subject matter expertise relevant to the marketplace and investment and trading practices This metric tracks whether certain areas requiring significant training are being addressed The agency will track the number of SEC staff participants in mission-focused training and development programs and will report on specific items through the use of post-course evaluations to assess the impact and results of this training on a five-point scale
FY 2013 FY 2013 FY 2014 FY 2015 Fiscal Year FY 2008 FY 2009 FY 2010 FY 2011 FY 2012 Plan Actual Estimate Request
Mission-focused training attendance Prior year data not available NA NA 12000 12120
Post-course evaluations of mission-Prior year data not available NA NA 45 45
focused training
Responsible DivisionOffice Office of Human Resources
Data Source Course Attendance Identified in LEAP (Instructor-led courses only) and End of Course Evaluation Report Summary provided by Metrics that Matter
PERFORMANCE GOAL 413 Number of diversity-related partnershipsalliances
Description Increased numbers of diversity-related partnerships or alliances with professional associations and educational organizations provide opportunities to educate students about the SECrsquos work and to recruit career professionals from all segments of society The SEC will track the number of partnerships andor alliances with diverse professional associations and educational organizations
FY 2013 FY 2013 FY 2014 FY 2015 Fiscal Year FY 2008 FY 2009 FY 2010 FY 2011 FY 2012 Plan Actual Estimate Request
Number of partnershipsalliances Prior-year data 2 10 12 15 13 15
not available
Responsible DivisionOffice Office of Minority Women and Inclusion
Data Source Office of Minority Women and Inclusion Internal Records and Section 342 of DFA
15
42
FY 2015 ANNUAL PERFORMANCE PLAN bull FY 2015 CBJ FY 2015 APP AND FY 2013 APR
PERFORMANCE GOAL 414 Sur vey rankings
Description Annual and other rankings together with other metrics and indicators of federal government agencies will be used as one kind of metric to determine the SECrsquos overall success in improving employee morale and employee engagement
FY 2013 FY 2013 FY 2014 FY 2015 Fiscal Year FY 2008 FY 2009 FY 2010 FY 2011 FY 2012 Plan Actual Estimate Request
Best Places to Work ranking Ranked Ranked Ranked Ranked Ranked Ranked Ranked Ranked Ranked 3 11 24 27 19 20 15 5 5
Average of employee engagement Prior-year data not available NA 61 75 75
and global satisfaction index
Responsible DivisionOffice Office of Human Resources
Data Source Annual Partnership for Public Service calculated ranking based on Annual Employee Viewpoint Survey (EVS) administered by OPM and Average of Employee Engagement and Global Satisfaction Index from OPM Employee Viewpoint Survey (EVS)
PERFORMANCE GOAL 415 Bench strength
Description To maintain mission effectiveness it is essential that attrition in the leadership ranks is quickly addressed by having a highly qualified and diverse pool of candidates ready to assume those critical roles Success is measured by the percentage of key leadership positions for which the SEC has identified a pool of qualified candidates
FY 2013 FY 2013 FY 2014 FY 2015 Fiscal Year FY 2008 FY 2009 FY 2010 FY 2011 FY 2012 Plan Actual Estimate Request
Data point under development NA NA NA NA NA NA NA TBD TBD
Responsible DivisionOffice Office of Human Resources
Data Source TBD
Strategic Objective 42 The SEC encourages a collaborative environment across divisions and offices and leverages technology and data to fulfill its mission more effectively and efficiently
Goal Leader(s) Director Office of Information Technology
PERFORMANCE GOAL 421 Ensure SECrsquos systems and applications are available
Description The SEC aims to enhance its computing infrastructure to eliminate down time if systems at one site fail among other objectives This metric will capture the percentage of systems and applications that can fail over within 8 hours
FY 2013 FY 2013 FY 2014 FY 2015 Fiscal Year FY 2008 FY 2009 FY 2010 FY 2011 FY 2012 Plan Actual Estimate Request
Percentage of servers virtualized NA 12 22 38 79 85 93 94 95
Percentage fail over within 8 hours NA NA NA NA NA NA NA 100 100
Responsible DivisionOffice Office of Information Technology
Data Source OIT Network Operations Center (NOC) ndash automated network monitoring tools
43
FY 2015 CBJ FY 2015 APP AND FY 2013 APR bull FY 2015 ANNUAL PERFORMANCE PLAN
PERFORMANCE GOAL 422 Equip the SEC with an enhanced technology infrastructure to support enterprise infrastructure
Description The SEC aims to promote collaboration and information sharing across the enterprise To improve efficiency and knowledge management the SEC will consolidate and centralize its collaborative technologies to a commonly used enterprise set by 2020 This metric will measure the percentage of the SECrsquos offices and divisions that utilize centralized enterprise collaboration solutions
FY 2013 FY 2013 FY 2014 FY 2015 Fiscal Year FY 2008 FY 2009 FY 2010 FY 2011 FY 2012 Plan Actual Estimate Request
Number of enterprise solutions Prior-year data not 10 20 25 30 30 35 40
available
Responsible DivisionOffice Office of Information Technology
Data Source Approved software applications list
PERFORMANCE GOAL 423 Expand the SECrsquos video teleconferencing (VTC) capabilities to support an increasingly geographically dispersed workforce
Description The SEC seeks to develop a state of the art video teleconference solution that allows users to conduct a videoteleconference meeting between HQ regional offices and multiple endpoints simultaneously collaborate and share presentation materials and use VoIP technology to host video teleconferences from their officesworkspaces with other SEC users or conference rooms This metric will measure the average ldquouptimerdquo or availability of all VTC systems
FY 2013 FY 2013 FY 2014 FY 2015 Fiscal Year FY 2008 FY 2009 FY 2010 FY 2011 FY 2012 Plan Actual Estimate Request
Availability rate for VTC solutions Prior-year data not available 75 80 9999 9999
Responsible DivisionOffice Office of Information Technology
Data Source Telecommunications monitoring system
PERFORMANCE GOAL 424 Pursue continuous technology cost reductions and efficiencies
Description Recent technology enhancements ndash eg data center consolidation virtualization and maintenance contract reductions ndash are producing technical efficiencies and cost savings This metric will measure the amount of these costs savings
FY 2013 FY 2013 FY 2014 FY 2015 Fiscal Year FY 2008 FY 2009 FY 2010 FY 2011 FY 2012 Plan Actual Estimate Request
Percent reduction in operational run 1-3 187 1 2 cost leveraging technology and cost cost reduction reduction process efficiencies
Prior-year data not available reduction in steady
reduction in steady
in run costs
in run costs
state run state run costs costs1
Responsible DivisionOffice Office of Information Technology
Data Source OIT Network Operations Center (NOC)
The higher than expected FY 2013 actual of 187 percent is due to one-time technologies enhancements resulting from the data consolidation and virtualization 1
44
FY 2015 ANNUAL PERFORMANCE PLAN bull FY 2015 CBJ FY 2015 APP AND FY 2013 APR
PERFORMANCE GOAL 425 Enhance the SECrsquos enterprise data warehouse infrastructure and performance
Description The Enterprise Data Warehouse (EDW) infrastructure will enable the provisioning of data to Commission staff for search and analysis through a virtual data warehouse platform This metric will measure the availability of EDW and data sources
FY 2013 FY 2013 FY 2014 FY 2015 Fiscal Year FY 2008 FY 2009 FY 2010 FY 2011 FY 2012 Plan Actual Estimate Request
Availability rate for the EDW infrastructure components in Prior-year data not available NA NA 99 99 production
Responsible DivisionOffice Office of Information Technology
Data Source OIT Network Operations Center (NOC) ndash automated network monitoring tools
Strategic Objective 43 The SEC maximizes the use of agency resources by continually improving agency operations and bolstering internal controls
Goal Leader(s) Chief Financial Officer Chief Operations Officer
PERFORMANCE GOAL 431 Financial audit results
Description Under the Accountability of Taxpayer Dollars Act of 2002 the agency is required to meet all proprietary and budgetary accounting guidelines for federal agencies and to undergo annual audits The SECrsquos audits are conducted by the Government Accountability Office
FY 2013 FY 2013 FY 2014 FY 2015 Fiscal Year FY 2008 FY 2009 FY 2010 FY 2011 FY 2012 Plan Actual Estimate Request
Unqualified opinion Yes Yes Yes Yes Yes Yes Yes Yes Yes
Material weaknesses 0 1 2 0 0 0 0 0 0
Significant deficiency 3 6 0 4 2 0 1 0 0
Responsible DivisionOffice Office of Financial Management
Data Source GAO SEC Financial Audit Report
PERFORMANCE GOAL 432 Assurance statement on internal control over operations
Description In accordance with OMB A-123 and Section 961 of the Dodd-Frank Act the SEC conducts an annual assessment of the effectiveness of internal controls The SEC will continue to develop its Operational Risk program and enhance cross-organizational processes to support all division and office management assurance statements Success is measured by the quality of risk and control assessments and management self-identification and resolution of improvement opportunities
FY 2013 FY 2013 FY 2014 FY 2015 Fiscal Year FY 2008 FY 2009 FY 2010 FY 2011 FY 2012 Plan Actual Estimate Request
Unqualified opinion Yes Yes Yes Yes Yes Yes Yes Yes Yes
Material weakness 0 0 0 0 0 0 0 0 0
Responsible DivisionOffice Office of the Chief Operating Officer
Data Source SEC Financial Audit Report
45
FY 2015 CBJ FY 2015 APP AND FY 2013 APR bull FY 2015 ANNUAL PERFORMANCE PLAN
1
PERFORMANCE GOAL 433 Timely completion of corrective action on Office of Inspector General (OIG) and the GAO audit recommendations1
Description Timely completion of audit recommendations is an important SEC priority This metric measures how well the Commission is doing in completing corrective action on OIG audit recommendations within established timeframes
FY 2013 FY 2013 FY 2014 FY 2015 Fiscal Year FY 2008 FY 2009 FY 2010 FY 2011 FY 2012 Plan Actual Estimate Request
OIG recommendations completed in Prior-year data not available NA 78 80 80
less than one year
Responsible DivisionOffice Office of the Chief Operating Officer
Data Source Audit Recommendation Tracking System
This measure was developed as part of the FY 2014-2018 SEC strategic planning process Currently there is no methodology in place to capture data for tracking all GAO Audit recommendations OCOO will determine a timeframe for establishing a methodology during FY 2014
46
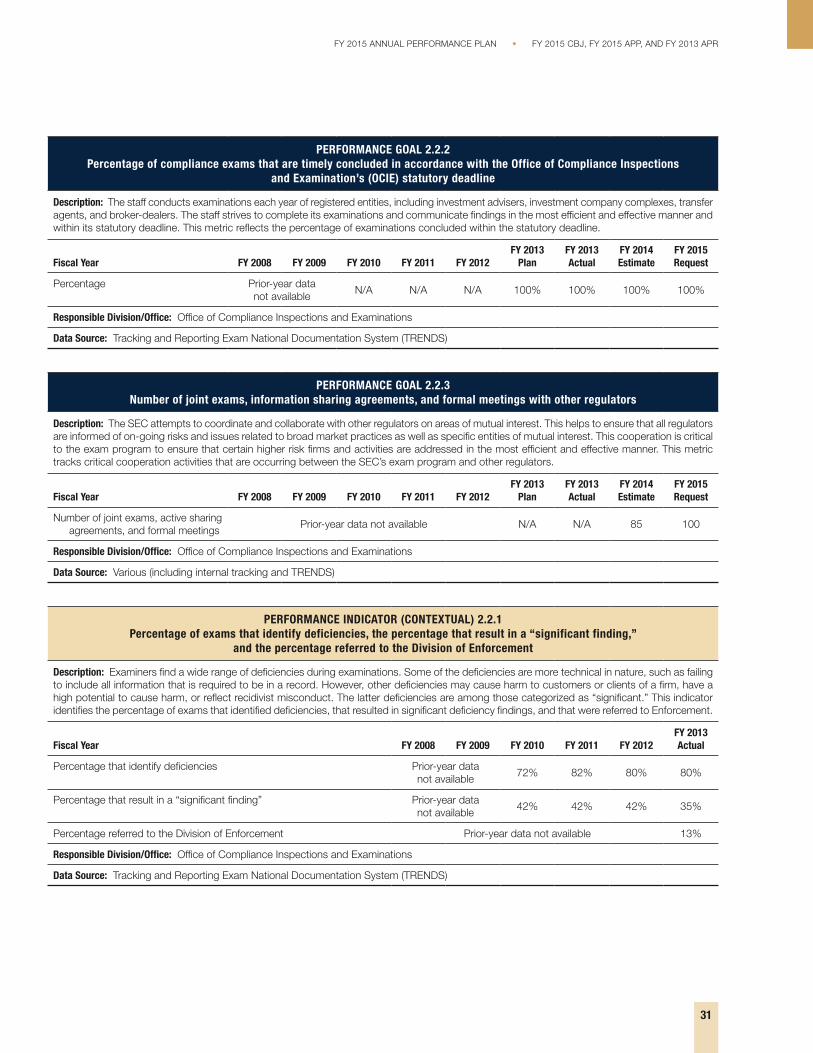
FY 2015 ANNUAL PERFORMANCE PLAN bull FY 2015 CBJ FY 2015 APP AND FY 2013 APR
PERFORMANCE GOAL 222 Percentage of compliance exams that are timely concluded in accordance with the Office of Compliance Inspections
and Examinationrsquos (OCIE) statutory deadline
Description The staff conducts examinations each year of registered entities including investment advisers investment company complexes transfer agents and broker-dealers The staff strives to complete its examinations and communicate findings in the most efficient and effective manner and within its statutory deadline This metric reflects the percentage of examinations concluded within the statutory deadline
FY 2013 FY 2013 FY 2014 FY 2015 Fiscal Year FY 2008 FY 2009 FY 2010 FY 2011 FY 2012 Plan Actual Estimate Request
Percentage Prior-year data NA NA NA 100 100 100 100
not available
Responsible DivisionOffice Office of Compliance Inspections and Examinations
Data Source Tracking and Reporting Exam National Documentation System (TRENDS)
PERFORMANCE GOAL 223 Number of joint exams information sharing agreements and formal meetings with other regulators
Description The SEC attempts to coordinate and collaborate with other regulators on areas of mutual interest This helps to ensure that all regulators are informed of on-going risks and issues related to broad market practices as well as specific entities of mutual interest This cooperation is critical to the exam program to ensure that certain higher risk firms and activities are addressed in the most efficient and effective manner This metric tracks critical cooperation activities that are occurring between the SECrsquos exam program and other regulators
FY 2013 FY 2013 FY 2014 FY 2015 Fiscal Year FY 2008 FY 2009 FY 2010 FY 2011 FY 2012 Plan Actual Estimate Request
Number of joint exams active sharing Prior-year data not available NA NA 85 100
agreements and formal meetings
Responsible DivisionOffice Office of Compliance Inspections and Examinations
Data Source Various (including internal tracking and TRENDS)
PERFORMANCE INDICATOR (CONTEXTUAL) 221 Percentage of exams that identify deficiencies the percentage that result in a ldquosignificant findingrdquo
and the percentage referred to the Division of Enforcement
Description Examiners find a wide range of deficiencies during examinations Some of the deficiencies are more technical in nature such as failing to include all information that is required to be in a record However other deficiencies may cause harm to customers or clients of a firm have a high potential to cause harm or reflect recidivist misconduct The latter deficiencies are among those categorized as ldquosignificantrdquo This indicator identifies the percentage of exams that identified deficiencies that resulted in significant deficiency findings and that were referred to Enforcement
FY 2013 Fiscal Year FY 2008 FY 2009 FY 2010 FY 2011 FY 2012 Actual
Percentage that identify deficiencies Prior-year data 72 82 80 80
not available
Percentage that result in a ldquosignificant findingrdquo Prior-year data 42 42 42 35
not available
Percentage referred to the Division of Enforcement Prior-year data not available 13
Responsible DivisionOffice Office of Compliance Inspections and Examinations
Data Source Tracking and Reporting Exam National Documentation System (TRENDS)
31
PERFORMANCE INDICATOR (OUTPUT) 222 Number of cause exams that result from tips complaints and referrals
Description Analysis of a tip can support the request for a cause exam This indicator would identify the number of SEC cause exams that result from tips collected through outreach efforts
Fiscal Year FY 2008 FY 2009 FY 2010 FY 2011 FY 2012 FY 2013 Actual
Number of cause exams Prior-year data not available
NA NA NA 222
Responsible DivisionOffice Office of Compliance Inspections and Examinations
Data Source Tracking and Reporting Exam National Documentation System (TRENDS)
PERFORMANCE INDICATOR (OUTPUT) 223 Number of rule-making initiatives assisted by the National Exam Program
Description The examination program interacts with registrants on a regular basis and this work provides critical feedback to ensuring effective and practical rulemaking and policy efforts This indicator tracks how frequently the examination program assists with rulemaking initiatives
Fiscal Year FY 2008 FY 2009 FY 2010 FY 2011 FY 2012 FY 2013 Actual
Number of rule-making initiatives assisted by the NEP Prior-year data not available NA
Responsible DivisionOffice Office of Compliance Inspections and Examinations
Data Source Internal tracking
PERFORMANCE INDICATOR (OUTPUT) 224 Number of investigations or inquiries originating from a tip or complaint
Description Analysis of a tip or complaint can result in the need for further enforcement investigation The indicator identifies the volume of SEC investigations that result from tips and complaints received by the SEC
Fiscal Year FY 2008 FY 2009 FY 2010 FY 2011 FY 2012 FY 2013 Actual
Number of investigations Prior-year data not available
303 349 296 289
Responsible DivisionOffice Division of Enforcement
Data Source HUB case management and tracking system for the Division of Enforcement
PERFORMANCE INDICATOR (OUTPUT) 225 SEC investigations in which requests for access to information were granted by the SEC to other authorities
such as SROs or other state federal and foreign enforcement authorities
Description The SEC works closely with other regulators and authorities This measure identifies the number of investigations in which the SEC granted one or more authorities access to information concerning an investigation during the fiscal year This may include requests for access to SEC investigative files concerning investigations that the SEC continues to pursue as well as those in which the SEC has completed its investigation
Fiscal Year FY 2008 FY 2009 FY 2010 FY 2011 FY 2012 FY 2013 Actual
Number of investigations Prior-year data not available
492 586 515 504
Responsible DivisionOffice Division of Enforcement
Data Source HUB case management and tracking system for the Division of Enforcement
32
FY 2015 CBJ FY 2015 APP AND FY 2013 APR bull FY 2015 ANNUAL PERFORMANCE PLAN
FY 2015 ANNUAL PERFORMANCE PLAN bull FY 2015 CBJ FY 2015 APP AND FY 2013 APR
PERFORMANCE INDICATOR (OUTPUT) 226 Requests from foreign authorities for SEC assistance and SEC requests for assistance from foreign authorities
Description Each year the SEC makes hundreds of requests for enforcement assistance to foreign regulators while responding to hundreds of such requests from other nations To facilitate this type of assistance and encourage other countries to enact laws necessary to allow regulators to cooperate with their foreign counterparts the SEC has entered into bilateral information sharing arrangements as well as the Multilateral Memorandum of Understanding an information-sharing arrangement negotiated through the International Organization of Securities Commissions (IOSCO)
FY 2013 Fiscal Year FY 2008 FY 2009 FY 2010 FY 2011 FY 2012 Actual
Number of requests from foreign authorities 414 408 457 492 450
Number of SEC requests 594 774 605 772 718
Responsible DivisionOffice Office of International Affairs
Data Source International Program Oversight Database and Business Objects reports
Strategic Objective 23 The SEC prosecutes violations of federal securities laws and holds violators accountable through appropriate sanctions and remedies
Goal Leader(s) Director Division of Enforcement
PERFORMANCE GOAL 231 Percentage of enforcement actions in which the Commission obtained relief on one or more claims
Description This metric identifies as to all parties to enforcement actions that were resolved in the fiscal year the percentage against whom the Commission obtained a judgment or order entered on consent a default judgment a judgment of liability on one or more charges andor the imposition of monetary or other relief
FY 2013 FY 2013 FY 2014 FY 2015 Fiscal Year FY 2008 FY 2009 FY 2010 FY 2011 FY 2012 Plan Actual Estimate Request
Percentage 92 92 92 93 89 92 93 92 92
Responsible DivisionOffice Division of Enforcement
Data Source HUB case management and tracking system for the Division of Enforcement
PERFORMANCE GOAL 232 Percentage of first enforcement actions filed within two years of the opening of an investigation
Description This metric concerns the pace of investigations that lead to the filing of enforcement actions Specifically this metric captures the rate at which the first enforcement action arising out of an investigation was filed within two years of the opening of the investigation If the investigation was preceded by a matter under inquiry the metric draws on the date of the opening of the matter under inquiry In conducting investigations the Enforcement program continually strives to balance the need for complete effective and fair investigations with the need to file enforcement actions in as timely a manner as possible
FY 2013 FY 2013 FY 2014 FY 2015 Fiscal Year FY 2008 FY 2009 FY 2010 FY 2011 FY 2012 Plan Actual Estimate Request
Percentage 62 70 67 61 63 65 58 65 65
Responsible DivisionOffice Division of Enforcement
Data Source HUB case management and tracking system for the Division of Enforcement
508
717
33
FY 2015 CBJ FY 2015 APP AND FY 2013 APR bull FY 2015 ANNUAL PERFORMANCE PLAN
PERFORMANCE GOAL 233 Average months between opening a matter under inquiry or an investigation and commencing an enforcement action
Description This metric captures the average number of months between the opening of an investigation and the filing of the first enforcement action arising out of that investigation If the investigation was preceded by a matter under inquiry the metric draws on the date of opening of the matter inquiry In conducting investigations the enforcement program continually strives to balance the need for complete effective and fair investigation with the need to file enforcement actions in as timely a manner as possible While not all investigations result in the filing of enforcement actions this metric provides information concerning the pace of investigations that do lead to such actions and supplements the previous goal which measures the percentage of first enforcement actions filed within two years
FY 2013 FY 2013 FY 2014 FY 2015 Fiscal Year FY 2008 FY 2009 FY 2010 FY 2011 FY 2012 Plan Actual Estimate Request
Months Prior-year data not available 22 21 20 21 20 20
Responsible DivisionOffice Division of Enforcement
Data Source HUB case management and tracking system for the Division of Enforcement
PERFORMANCE GOAL 234 Percentage of debts where either a payment has been made or a collection activity has
been initiated within 180 days of the due date of the debt
Description The SEC can seek a wide range of remedies for failure to comply with the securities laws These remedies include civil monetary penalties and disgorgement When the remedies are imposed by the SEC or the Federal district court payments must be made by a certain date This metric identifies the percentage of debts where debtors have made payments or the SEC has initiated a collection activity within 180 days of the due date Such collection activities include among other things demand letters negotiation of payment plans enforcing the payment of the debt through the courts or other judicial remedies
FY 2013 FY 2013 FY 2014 FY 2015 Fiscal Year FY 2008 FY 2009 FY 2010 FY 2011 FY 2012 Plan Actual Estimate Request
Percentage 88 90 86 91 92 92 95 95 95
Responsible DivisionOffice Division of Enforcement
Data Source DELPHI
PERFORMANCE GOAL 235 Percentage of Fair Fund and disgorgement fund plans that have distributed 80 percent of the available
funds for distribution within twenty four (24) months of the approval of the distribution plan
Description In addition to other types of relief the SEC may seek orders requiring parties to disgorge any money obtained through wrongdoing The SEC also is empowered to seek civil penalties for violations of the securities laws Where appropriate the SEC has sought to return disgorged funds to harmed investors and as a result of the Fair Funds provisions of the Sarbanes-Oxley Act and the Dodd-Frank Act to combine amounts paid as penalties with disgorged funds or to create a Fair Fund from penalties only to reduce losses to injured parties and to maximize funds available for distribution This metric identifies the percentage of distribution plans that reached a critical mass during the fiscal year and within twenty four (24) months of the approval of the distribution plan The distribution plan includes the timeline and procedures required to return the funds to injured investors This reflects Commission-wide efforts to implement plans to return money to investors quickly Any funds not returned to investors are sent to the US Treasury or the Investor Protection Fund established pursuant to Section 21F(g) of the Securities Exchange Act of 1934 Neither disgorgement nor penalties are used for the SECrsquos own expenses
FY 2013 FY 2013 FY 2014 FY 2015 Fiscal Year FY 2008 FY 2009 FY 2010 FY 2011 FY 2012 Plan Actual Estimate Request
Percentage Prior-year data not available 80 80 73 78 82
Responsible DivisionOffice Division of Enforcement
Data Source HUB case management and tracking system for the Division of Enforcement and Distributions Management System
34
PERFORMANCE INDICATOR (CONTEXTUAL) 232 Total amount distributed within the fiscal year and the number of Fair Funds from which those distributions came
Description In its enforcement actions the SEC may seek to return funds to harmed investors through disgorgement of ill-gotten gains or through the Fair Funds provision of the Sarbanes-Oxley Act This provision permits the SEC to combine amounts paid as penalties with disgorged funds or to create a Fair Fund from penalties only to reduce losses to injured parties This reflects the SECrsquos efforts to return funds to injured investors This indicator identifies the total amount distributed within the fiscal year and the number of Fair Funds from which those distributions came This indicator may increase or decrease in dollar amount and number of distribution funds based on the number of SEC enforcement actions brought involving distributions amounts ordered and paid in those actions and other factors Due to the variation in reporting timelines established for each individual distribution reported amounts are based on the agencyrsquos best available information Reported amounts do not include those funds distributed through receiverships Any funds not returned to investors are sent to the US Treasury or the Investor Protection Fund established pursuant to Section 21F(g) of the Securities Exchange Act of 1934 Neither disgorgement nor penalties are used for the Commissionrsquos own expenses
Fiscal Year FY 2008 FY 2009 FY 2010 FY 2011 FY 2012 FY 2013 Actual
Amount distributed (in millions) Prior-year data not available 815 251
Number of Fair Funds Prior-year data not available 31 22
Responsible DivisionOffice Division of Enforcement
Data Source HUB case management and tracking system for the Division of Enforcement Distributions Management System
PERFORMANCE INDICATOR (CONTEXTUAL) 231 Percentage of filed enforcement actions reflecting characteristics that present enhanced risk to investors and markets as
measured by the nature of the investigation conduct parties and impact
Description This indicator assesses the quality of the cases filed by the Division of Enforcement The indicator focuses on cases filed by the SEC that involve factors reflecting enhanced risk to investors and markets Such cases may involve (i) those identified through risk analytics and cross-disciplinary initiatives to reveal difficult-to-detect or early stage misconduct thus minimizing investor loss and preventing the spread of unlawful conduct and practices (ii) particularly egregious or widespread misconduct and investor harm (iii) vulnerable victims (iv) a high degree of scienter (v) involvement of individuals occupying substantial positions of authority or having fiduciary obligations or other special responsibilities to investors (vi) involvement of recidivists (vii) high amount of investor loss prevented (viii) misconduct that is difficult to detect due to the complexity of products transactions and practices (ix) use of innovative investigative or analytical techniques (x) effective coordination with other law enforcement partners andor (xi) whether the matter involves markets transactions or practices identified as an enforcement priority or that advances the programmatic priorities of other SEC Divisions or Offices
Fiscal Year FY 2008 FY 2009 FY 2010 FY 2011 FY 2012 FY 2013 Actual
Percentage Prior-year data not available NA NA
Responsible DivisionOffice Division of Enforcement
Data Source HUB case management and tracking system for the Division of Enforcement
35
FY 2015 ANNUAL PERFORMANCE PLAN bull FY 2015 CBJ FY 2015 APP AND FY 2013 APR
PERFORMANCE INDICATOR (OUTPUT) 233 Percent of enforcement actions filed that arose out of national priority investigations
Description The Division of Enforcement conducts many enforcement actions each year that can be characterized as high impact and of national priority High impact or national priority investigations include those investigations which are significant for one or more of the following reasons ndashthe matter (i) presents an opportunity to send a particularly strong and effective message of deterrence including with respect to markets products and transactions that are newly developing or that are long established but which by their nature present limited opportunities to detect wrongdoing and thus to deter misconduct (ii) involves particularly egregious or extensive misconduct (iii) involves potentially widespread and extensive harm to investors (iv) involves misconduct by persons occupying positions of substantial authority or responsibility or who owe fiduciary or other enhanced duties and obligations to a broad group of investors or others (v) involves potential wrongdoing as prohibited under newly-enacted legislation or regulatory rules (vi) concerns potential misconduct that occurred in connection with products markets transactions or practices that pose particularly significant risks for investors or a systemically important sector of the market (vii) involves a substantial number of potential victims and or particularly vulnerable victims (viii) involves products markets transactions or practices that the Enforcement Division has identified as priority areas (ie conduct relating to the financial crisis fraud in connection with mortgage-related securities financial fraud involving public companies whose stock is widely held misconduct by investment advisers and matters involving priorities established by particular regional offices or the specialized units) andor (ix) provides an opportunity to pursue priority interests shared by other law enforcement agencies on a coordinated basis
Fiscal Year FY 2008 FY 2009 FY 2010 FY 2011 FY 2012 FY 2013 Actual
Percentage Prior-year data not available 10 20 15
Responsible DivisionOffice Division of Enforcement
Data Source HUB case management and tracking system for the Division of Enforcement
PERFORMANCE INDICATOR (CONTEXTUAL) 234 Criminal actions related to conduct under investigation by the SEC
Description In some instances conduct may involve both civil and criminal violations and may be investigated by both the SEC and the criminal authorities This indicator identifies the number of criminal actions that are related to conduct under investigation by the SEC
Fiscal Year FY 2008 FY 2009 FY 2010 FY 2011 FY 2012 FY 2013 Actual
Number of criminal investigations Prior-year data not available
139 134 126 126
Responsible DivisionOffice Division of Enforcement
Data Source HUB case management and tracking system for the Division of Enforcement
PERFORMANCE INDICATOR (OUTPUT) 235 Disgorgement and penalties ordered and the amounts collected
Description In addition to other types of relief the SEC may seek orders requiring parties to disgorge any money obtained through wrongdoing The SEC is also empowered to seek civil penalties for violations of the securities laws In some cases the SEC will seek to obtain large monetary sanctions even in instances where the prospects of collecting on a judgment are slight The rationale for seeking monetary relief in these circumstances is that such relief even when likely uncollectible might become collectible in the future based on the defendantrsquos changed circumstances and also because such relief can serve to deter others from violating the securities laws Where appropriate the SEC has sought to return disgorged funds to harmed investors Funds not returned to investors are sent to the Treasury or the Investor Protection Fund established pursuant to Section 21F(g) of the Securities Exchange Act of 1934 This indicator lists disgorgement and penalties ordered as a result of SEC cases and the amounts collected in those actions This indicator could increase or decrease based on various factors
Fiscal Year FY 2008 FY 2009 FY 2010 FY 2011 FY 2012 FY 2013 Actual
Ordered amounts (in millions) 1030 2442 2846 2806 3104 3424
Collected amounts (in millions) 521 1694 1775 1281 1048 1603
Responsible DivisionOffice Division of Enforcement
Data Source DELPHI
36
FY 2015 CBJ FY 2015 APP AND FY 2013 APR bull FY 2015 ANNUAL PERFORMANCE PLAN
FY 2015 ANNUAL PERFORMANCE PLAN bull FY 2015 CBJ FY 2015 APP AND FY 2013 APR
Strategic Goal 3 Facilitate Access to the Information Investors Need to Make Informed Investment Decisions
The agency is requesting in FY 2015 a total of $2226 million and 651 FTEs towards achieving results in Strategic Goal 3
Budgeting for the Future (FY 2015)
An educated investing public ultimately provides the best defense against fraud and costly mistakes The federal securities laws place great emphasis on assuring that corporations investments companies and other entities provide investors with timely clear complete and accurate financial and non-financial information allowing investors to make wise investment decisions As part of its disclosure program CF and IM will continue in FY 2015 to meet the requirements of the Sarbanes-Oxley Act (Performance Goal 311) Accordingly CF and IM strive to review disclosures made by certain public issuers including issuersrsquo financial statements no less frequently than once every three years Additionally CF staff will strive to issue comments on a timely basis allowing companies seeking to raise capital by building offering schedules around the 30-day standard (Performance Goal 312) and IM will aim to exceed timeliness targets for
reviewing investment company disclosures (Performance Goal 313) Also in FY 2015 CF will continue to improve the quality of information provided to investors by focusing on disclosure by companies of the information most material to investment decision-making
OIEA responds to investment-related complaints and questions from tens of thousands of investors each year In FY 2015 staff is expected to close approximately 60 percent of complaints and inquiries within seven days and about 90 percent within 30 days (Performance Goal 322) The seven-day target has been adjusted to reflect new workload demands In FY 2015 OIEA will continue to refine internal processes and promote staff training to resolve matters OIEA expects to increase of the number of visitors to its investor education web pages by using social media technologies and partnering with the SECrsquos regional offices other federal and state agencies financial industry associations consumer groups and educational organizations on investor education programs OIEA also will continue to participate in a significant number of in-person outreach events in FY 2015 (Performance Goal 321)
Strategic Objective 31 The SEC works to ensure that investors have access to high-quality disclosure materials that facilitate informed investment decision-making
Goal Leader(s) Director Division of Trading and Markets Director Division of Corporation Finance Director Division of Investment Management
PERFORMANCE GOAL 311 Percentage of public companies and investment companies with disclosures reviewed each year
Description The Sarbanes-Oxley Act requires that the SEC review at least once every three years the disclosures of all companies and investment company portfolios reporting under the Exchange Act These reviews help improve the information available to investors and may identify possible violations of the federal securities laws This metric gauges the number of public companies and investment companies reviewed each year
FY 2013 FY 2013 FY 2014 FY 2015 Fiscal Year FY 2008 FY 2009 FY 2010 FY 2011 FY 2012 Plan Actual Estimate Request
Division of Corporation Finance
Corporations 39 40 44 48 48 33 52 33 33
Responsible DivisionOffice Division of Corporation Finance
Data Source Electronic Data Gathering Analysis and Retrieval (EDGAR)Filing Activity Tracking System (FACTS)
Division of Investment Management
Investment Company Portfolios 36 35 35 33 36 33 34 33 33
Responsible DivisionOffice Division of Investment Management
Data Source Microsoft Office Suite Tools
37
FY 2015 CBJ FY 2015 APP AND FY 2013 APR bull FY 2015 ANNUAL PERFORMANCE PLAN
PERFORMANCE GOAL 312 Time to issue initial comments on Securities Act filings
Description The target of 30 days or less has become a de facto industry standard for the maximum time to receive initial comments
FY 2013 FY 2013 FY 2014 FY 2015 Fiscal Year FY 2008 FY 2009 FY 2010 FY 2011 FY 2012 Plan Actual Estimate Request
Days 252 253 241 244 249 lt30 256 lt30 lt30 days days days days days days days days days
Responsible DivisionOffice Division of Corporation Finance
Data Source FACTS
PERFORMANCE GOAL 313 Percentage of investment company disclosure reviews for which initial comments are completed within timeliness goals
Description For initial registration statements the SECrsquos goal is to issue initial comments within 30 days after they are filed (60 days for registration statements of insurance product separate accounts and related mutual funds) The SEC also aims to comment on post-effective amendments within 45 days and preliminary proxy statements within 10 days after they are filed
FY 2013 FY 2013 FY 2014 FY 2015 Fiscal Year FY 2008 FY 2009 FY 2010 FY 2011 FY 2012 Plan Actual Estimate Request
Initial registration statements 95 95 93 92 96 85 98 85 85
Post-effective amendments 97 97 94 94 95 90 99 90 90
Preliminary proxy statements 99 99 99 98 100 99 98 99 99
Responsible DivisionOffice Division of Investment Management
Data Source Electronic Data Gathering Analysis and Retrieval (EDGAR)
PERFORMANCE INDICATOR (CONTEXTUAL) 311 Total digital audience including website social media and mobile media
Description Digital media has become the dominant channel for investors seeking to access information These statistics will help evaluate the extent to which investors are turning to the SEC identify the channels they use and quantify the amount of information they receive
FY 2013 Fiscal Year FY 2008 FY 2009 FY 2010 FY 2011 FY 2012 Actual
SECgov page views Prior-year data not available 372B
Social media followers 0 1608 83141 193837 236700 258733
Total emailmobile subscriptions Prior-year data not available 519602 631839 740318
Total email bulletins sent NA 875518 1280M 2397M 3344M 4085M
Total mobile bulletins sent NA 6001 62324 107848 150303 238815
Responsible DivisionOffice Office of Public Affairs
Data Source Akamai Technologies Google Analytics GovDelivery Hootsuite Social Media Channels
38
rsquo
FY 2015 ANNUAL PERFORMANCE PLAN bull FY 2015 CBJ FY 2015 APP AND FY 2013 APR
Strategic Objective 32 The SEC works to understand investor needs and educate investors so they are better prepared to make informed investment decisions
Goal Leader(s) Director Office of Investor Education and Advocacy
PERFORMANCE GOAL 321 Number of page views of online investor education content and number of in-person events
including those with specifically targeted communities and organizations
Description The Office of Investor Education and Advocacy (OIEA) initiates investor education campaigns on key strategies for making informed investment decisions including publicizing online resources for researching investment professionals and investments understanding fees and identifying fraud OIEA staff also participates in in-person events for investors generally and those targeted to specific investors such as seniors service members and other affinity groups This metric tracks page views of SEC online investor education materials and the number of investor events in which OIEA staff participated
FY 2013 FY 2013 FY 2014 FY 2015 Fiscal Year FY 2008 FY 2009 FY 2010 FY 2011 FY 2012 Plan Actual Estimate Request
Number of page views Prior-year data not available 15 121 15 20
Number of ldquoin-personrdquo events Prior-year data not available 50 52 50 50
Responsible DivisionOffice Office of Investor Education and Advocacy
Data Source Microsoft Office Suite Tools
PERFORMANCE GOAL 322 Timeliness of responses to investor contacts
Description OIEA serves the tens of thousands of investors each year who contact the SEC with investment-related complaints and questions The staff aims to close out as many new investor assistance matters as possible within seven and thirty business days
FY 2013 FY 2013 FY 2014 FY 2015 Fiscal Year FY 2008 FY 2009 FY 2010 FY 2011 FY 2012 Plan Actual Estimate Request
Closed within 7 days 78 70 72 67 54 50 62 60 60
Closed within 30 days 88 90 93 92 93 90 93 90 90
Responsible DivisionOffice Office of Investor Education and Advocacy
Data Source Internal log using IRIS data
PERFORMANCE GOAL 323 Customer satisfaction rating of OIEA s online investor education resources
Description This metric gauges the effectiveness helpfulness and usability of OIEArsquos online investor education resources
FY 2013 FY 2013 FY 2014 FY 2015 Fiscal Year FY 2008 FY 2009 FY 2010 FY 2011 FY 2012 Plan Actual Estimate Request
Satisfaction index Benchmark Benchmark score for score for
Prior-year data not available NA 81 federal federal government government
websites websites
Responsible DivisionOffice Office of Investor Education and Advocacy
Data Source ForeSee results online portal
39
FY 2015 CBJ FY 2015 APP AND FY 2013 APR bull FY 2015 ANNUAL PERFORMANCE PLAN
PERFORMANCE GOAL 324 Number of new investor education materials designed specifically to help investors protect themselves from fraud
Description Through OIEA and often in conjunction with other organizations the staff issues Investor Alerts and other forms of educational material that inform investors about different permutations of fraud new investment products and other topical issues This metric measures the number of new investor education materials issued by OIEA
FY 2013 FY 2013 FY 2014 FY 2015 Fiscal Year FY 2008 FY 2009 FY 2010 FY 2011 FY 2012 Plan Actual Estimate Request
Number of education materials Prior-year data 16 24 24 26 26 26
not available
Responsible DivisionOffice Office of Investor Education and Advocacy
Data Source wwwsecgov and wwwinvestorgov
PERFORMANCE INDICATOR (PROCESS) 321 Number of investor testing research projects
Description This indicator tracks the number of research initiatives used to gather feedback from investors on the usefulness of disclosures and other input on SEC rulemaking
FY 2013 Fiscal Year FY 2008 FY 2009 FY 2010 FY 2011 FY 2012 Actual
Number of projects 1 0 0 2 2
Responsible DivisionOffice Office of Investor Education and Advocacy
Data Source Microsoft Office Suite Tools
PERFORMANCE INDICATOR (PROCESS) 322 Number of sets of recommendations prepared by the investor advisor y committee
Description This indicator tracks the recommendations from the Investor Advisory Committee regarding investorsrsquo perspectives and priorities
FY 2013 Fiscal Year FY 2008 FY 2009 FY 2010 FY 2011 FY 2012 Actual
Number of sets of recommendations Prior-year data not available 0 4
Responsible DivisionOffice Office of Investor Education and Advocacy
Data Source wwwsecgov
26
0
40
Strategic Goal 4 Enhance the Commissionrsquos Performance through Effective Alignment and Management of Human Information and Financial Capital During FY 2015 the agency will continue to focus on recruiting and retaining high-performing staff and updating the expertise of SEC employees so they are abreast of the latest developments in the securities markets Furthermore the SEC will continue to strengthen internal controls The agency is requesting a total of $3599 million and 867 FTEs in FY 2015 to achieve results in Strategic Goal 4
Budgeting for the Future (FY 2015)
The investing public and the securities markets are best served by an efficient effective and agile SEC In FY 2015 the agency will continue to take steps to become a more effective regulator of the US financial markets by making sound investments in human capital and new technologies and enhancing internal controls
The planned investment in the SEC University for FY 2015 principally supports training and development for employees directly involved in examinations investigations fraud detection litigation and other core mission responsibilities of the agency The SEC University will provide specialized in-depth training concerning changing market conditions analytics and forensics and the agencyrsquos new responsibility areas The investment also will fund employees for certain specialized financial certifications and regulatory credentials as well as the advanced continuing education required for maintaining legal and financial credentials
To maintain mission effectiveness it is essential that attrition in the leadership ranks is quickly addressed by having a highly qualified and diverse pool of candidates ready to assume those
critical roles (Performance Goal 415) The Office of Human Resourcesrsquo (OHR) Workforce Planning has completed building the foundational database necessary to conduct succession planning A subset of this team has begun benchmarking succession planning approaches used by other Federal agencies and will develop and implement a program at the SEC by the end of FY 2014 The first measure is expected by September 30 2014
Leveraging modern reliable and innovative technologies together with predictive analytics will transform the way the SEC performs its mission and provide a proactive view into how technology impacts capital markets The SEC will derive significant and measurable performance improvements in core operations and increase value for users through the use of automated enterprise processes
The continuing implementation of OITrsquos Technology Transformation Plan (ldquoWorking Smarterrdquo) in FY 2015 will support vital technology initiatives It will ensure the SECrsquos business processes are streamlined integrated and implemented using the best technology available
While the SEC has made significant strides in its multi-year path towards a strong sustainable internal control posture the agency will continue to dedicate its energies towards remediating the significant deficiency in information security During FY 2015 OFM will work closely with the Department of Transportationrsquos Federal Shared Services Provider (FSSP) to implement its software upgrade and refine the new Federal government-wide travel management system
41
FY 2015 ANNUAL PERFORMANCE PLAN bull FY 2015 CBJ FY 2015 APP AND FY 2013 APR
FY 2015 CBJ FY 2015 APP AND FY 2013 APR bull FY 2015 ANNUAL PERFORMANCE PLAN
Strategic Objective 41 The SEC promotes a results-oriented work environment that attracts engages and retains a technically proficient and diverse workforce including leaders who provide motivation and strategic direction
Goal Leader(s) Director Office of Human Resources Director Office of Minority and Women Inclusion
PERFORMANCE GOAL 411 Turnover
Description When employee morale and engagement are high high-performing employees tend to remain in the organization Although turnover can fluctuate based on a variety of factors the SEC aims to keep its turnover rate relatively low below 8 per year
FY 2013 FY 2013 FY 2014 FY 2015 Fiscal Year FY 2008 FY 2009 FY 2010 FY 2011 FY 2012 Plan Actual Estimate Request
Percent turnover 62 37 5 64 658 lt8 658 lt8 lt8
Responsible DivisionOffice Office of Human Resources
Data Source The National Business Center at Department of Interior (DOI)
PERFORMANCE GOAL 412 Expanding staff expertise
Description Internal training and hiring programs are designed to help the agency recruit and develop a diverse and qualified staff with the key skills industry knowledge and expertise to support the SEC mission In particular there is a need to train examiners attorneys economists and other experts for subject matter expertise relevant to the marketplace and investment and trading practices This metric tracks whether certain areas requiring significant training are being addressed The agency will track the number of SEC staff participants in mission-focused training and development programs and will report on specific items through the use of post-course evaluations to assess the impact and results of this training on a five-point scale
FY 2013 FY 2013 FY 2014 FY 2015 Fiscal Year FY 2008 FY 2009 FY 2010 FY 2011 FY 2012 Plan Actual Estimate Request
Mission-focused training attendance Prior year data not available NA NA 12000 12120
Post-course evaluations of mission-Prior year data not available NA NA 45 45
focused training
Responsible DivisionOffice Office of Human Resources
Data Source Course Attendance Identified in LEAP (Instructor-led courses only) and End of Course Evaluation Report Summary provided by Metrics that Matter
PERFORMANCE GOAL 413 Number of diversity-related partnershipsalliances
Description Increased numbers of diversity-related partnerships or alliances with professional associations and educational organizations provide opportunities to educate students about the SECrsquos work and to recruit career professionals from all segments of society The SEC will track the number of partnerships andor alliances with diverse professional associations and educational organizations
FY 2013 FY 2013 FY 2014 FY 2015 Fiscal Year FY 2008 FY 2009 FY 2010 FY 2011 FY 2012 Plan Actual Estimate Request
Number of partnershipsalliances Prior-year data 2 10 12 15 13 15
not available
Responsible DivisionOffice Office of Minority Women and Inclusion
Data Source Office of Minority Women and Inclusion Internal Records and Section 342 of DFA
15
42
FY 2015 ANNUAL PERFORMANCE PLAN bull FY 2015 CBJ FY 2015 APP AND FY 2013 APR
PERFORMANCE GOAL 414 Sur vey rankings
Description Annual and other rankings together with other metrics and indicators of federal government agencies will be used as one kind of metric to determine the SECrsquos overall success in improving employee morale and employee engagement
FY 2013 FY 2013 FY 2014 FY 2015 Fiscal Year FY 2008 FY 2009 FY 2010 FY 2011 FY 2012 Plan Actual Estimate Request
Best Places to Work ranking Ranked Ranked Ranked Ranked Ranked Ranked Ranked Ranked Ranked 3 11 24 27 19 20 15 5 5
Average of employee engagement Prior-year data not available NA 61 75 75
and global satisfaction index
Responsible DivisionOffice Office of Human Resources
Data Source Annual Partnership for Public Service calculated ranking based on Annual Employee Viewpoint Survey (EVS) administered by OPM and Average of Employee Engagement and Global Satisfaction Index from OPM Employee Viewpoint Survey (EVS)
PERFORMANCE GOAL 415 Bench strength
Description To maintain mission effectiveness it is essential that attrition in the leadership ranks is quickly addressed by having a highly qualified and diverse pool of candidates ready to assume those critical roles Success is measured by the percentage of key leadership positions for which the SEC has identified a pool of qualified candidates
FY 2013 FY 2013 FY 2014 FY 2015 Fiscal Year FY 2008 FY 2009 FY 2010 FY 2011 FY 2012 Plan Actual Estimate Request
Data point under development NA NA NA NA NA NA NA TBD TBD
Responsible DivisionOffice Office of Human Resources
Data Source TBD
Strategic Objective 42 The SEC encourages a collaborative environment across divisions and offices and leverages technology and data to fulfill its mission more effectively and efficiently
Goal Leader(s) Director Office of Information Technology
PERFORMANCE GOAL 421 Ensure SECrsquos systems and applications are available
Description The SEC aims to enhance its computing infrastructure to eliminate down time if systems at one site fail among other objectives This metric will capture the percentage of systems and applications that can fail over within 8 hours
FY 2013 FY 2013 FY 2014 FY 2015 Fiscal Year FY 2008 FY 2009 FY 2010 FY 2011 FY 2012 Plan Actual Estimate Request
Percentage of servers virtualized NA 12 22 38 79 85 93 94 95
Percentage fail over within 8 hours NA NA NA NA NA NA NA 100 100
Responsible DivisionOffice Office of Information Technology
Data Source OIT Network Operations Center (NOC) ndash automated network monitoring tools
43
FY 2015 CBJ FY 2015 APP AND FY 2013 APR bull FY 2015 ANNUAL PERFORMANCE PLAN
PERFORMANCE GOAL 422 Equip the SEC with an enhanced technology infrastructure to support enterprise infrastructure
Description The SEC aims to promote collaboration and information sharing across the enterprise To improve efficiency and knowledge management the SEC will consolidate and centralize its collaborative technologies to a commonly used enterprise set by 2020 This metric will measure the percentage of the SECrsquos offices and divisions that utilize centralized enterprise collaboration solutions
FY 2013 FY 2013 FY 2014 FY 2015 Fiscal Year FY 2008 FY 2009 FY 2010 FY 2011 FY 2012 Plan Actual Estimate Request
Number of enterprise solutions Prior-year data not 10 20 25 30 30 35 40
available
Responsible DivisionOffice Office of Information Technology
Data Source Approved software applications list
PERFORMANCE GOAL 423 Expand the SECrsquos video teleconferencing (VTC) capabilities to support an increasingly geographically dispersed workforce
Description The SEC seeks to develop a state of the art video teleconference solution that allows users to conduct a videoteleconference meeting between HQ regional offices and multiple endpoints simultaneously collaborate and share presentation materials and use VoIP technology to host video teleconferences from their officesworkspaces with other SEC users or conference rooms This metric will measure the average ldquouptimerdquo or availability of all VTC systems
FY 2013 FY 2013 FY 2014 FY 2015 Fiscal Year FY 2008 FY 2009 FY 2010 FY 2011 FY 2012 Plan Actual Estimate Request
Availability rate for VTC solutions Prior-year data not available 75 80 9999 9999
Responsible DivisionOffice Office of Information Technology
Data Source Telecommunications monitoring system
PERFORMANCE GOAL 424 Pursue continuous technology cost reductions and efficiencies
Description Recent technology enhancements ndash eg data center consolidation virtualization and maintenance contract reductions ndash are producing technical efficiencies and cost savings This metric will measure the amount of these costs savings
FY 2013 FY 2013 FY 2014 FY 2015 Fiscal Year FY 2008 FY 2009 FY 2010 FY 2011 FY 2012 Plan Actual Estimate Request
Percent reduction in operational run 1-3 187 1 2 cost leveraging technology and cost cost reduction reduction process efficiencies
Prior-year data not available reduction in steady
reduction in steady
in run costs
in run costs
state run state run costs costs1
Responsible DivisionOffice Office of Information Technology
Data Source OIT Network Operations Center (NOC)
The higher than expected FY 2013 actual of 187 percent is due to one-time technologies enhancements resulting from the data consolidation and virtualization 1
44
FY 2015 ANNUAL PERFORMANCE PLAN bull FY 2015 CBJ FY 2015 APP AND FY 2013 APR
PERFORMANCE GOAL 425 Enhance the SECrsquos enterprise data warehouse infrastructure and performance
Description The Enterprise Data Warehouse (EDW) infrastructure will enable the provisioning of data to Commission staff for search and analysis through a virtual data warehouse platform This metric will measure the availability of EDW and data sources
FY 2013 FY 2013 FY 2014 FY 2015 Fiscal Year FY 2008 FY 2009 FY 2010 FY 2011 FY 2012 Plan Actual Estimate Request
Availability rate for the EDW infrastructure components in Prior-year data not available NA NA 99 99 production
Responsible DivisionOffice Office of Information Technology
Data Source OIT Network Operations Center (NOC) ndash automated network monitoring tools
Strategic Objective 43 The SEC maximizes the use of agency resources by continually improving agency operations and bolstering internal controls
Goal Leader(s) Chief Financial Officer Chief Operations Officer
PERFORMANCE GOAL 431 Financial audit results
Description Under the Accountability of Taxpayer Dollars Act of 2002 the agency is required to meet all proprietary and budgetary accounting guidelines for federal agencies and to undergo annual audits The SECrsquos audits are conducted by the Government Accountability Office
FY 2013 FY 2013 FY 2014 FY 2015 Fiscal Year FY 2008 FY 2009 FY 2010 FY 2011 FY 2012 Plan Actual Estimate Request
Unqualified opinion Yes Yes Yes Yes Yes Yes Yes Yes Yes
Material weaknesses 0 1 2 0 0 0 0 0 0
Significant deficiency 3 6 0 4 2 0 1 0 0
Responsible DivisionOffice Office of Financial Management
Data Source GAO SEC Financial Audit Report
PERFORMANCE GOAL 432 Assurance statement on internal control over operations
Description In accordance with OMB A-123 and Section 961 of the Dodd-Frank Act the SEC conducts an annual assessment of the effectiveness of internal controls The SEC will continue to develop its Operational Risk program and enhance cross-organizational processes to support all division and office management assurance statements Success is measured by the quality of risk and control assessments and management self-identification and resolution of improvement opportunities
FY 2013 FY 2013 FY 2014 FY 2015 Fiscal Year FY 2008 FY 2009 FY 2010 FY 2011 FY 2012 Plan Actual Estimate Request
Unqualified opinion Yes Yes Yes Yes Yes Yes Yes Yes Yes
Material weakness 0 0 0 0 0 0 0 0 0
Responsible DivisionOffice Office of the Chief Operating Officer
Data Source SEC Financial Audit Report
45
FY 2015 CBJ FY 2015 APP AND FY 2013 APR bull FY 2015 ANNUAL PERFORMANCE PLAN
1
PERFORMANCE GOAL 433 Timely completion of corrective action on Office of Inspector General (OIG) and the GAO audit recommendations1
Description Timely completion of audit recommendations is an important SEC priority This metric measures how well the Commission is doing in completing corrective action on OIG audit recommendations within established timeframes
FY 2013 FY 2013 FY 2014 FY 2015 Fiscal Year FY 2008 FY 2009 FY 2010 FY 2011 FY 2012 Plan Actual Estimate Request
OIG recommendations completed in Prior-year data not available NA 78 80 80
less than one year
Responsible DivisionOffice Office of the Chief Operating Officer
Data Source Audit Recommendation Tracking System
This measure was developed as part of the FY 2014-2018 SEC strategic planning process Currently there is no methodology in place to capture data for tracking all GAO Audit recommendations OCOO will determine a timeframe for establishing a methodology during FY 2014
46
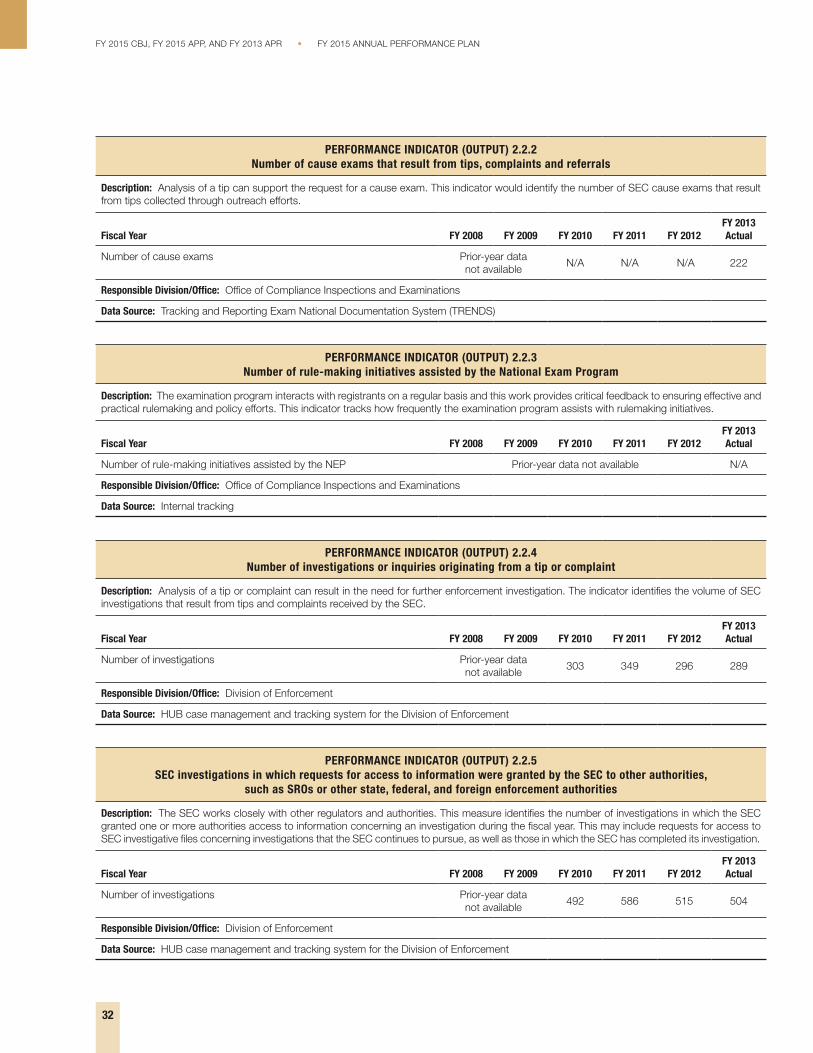
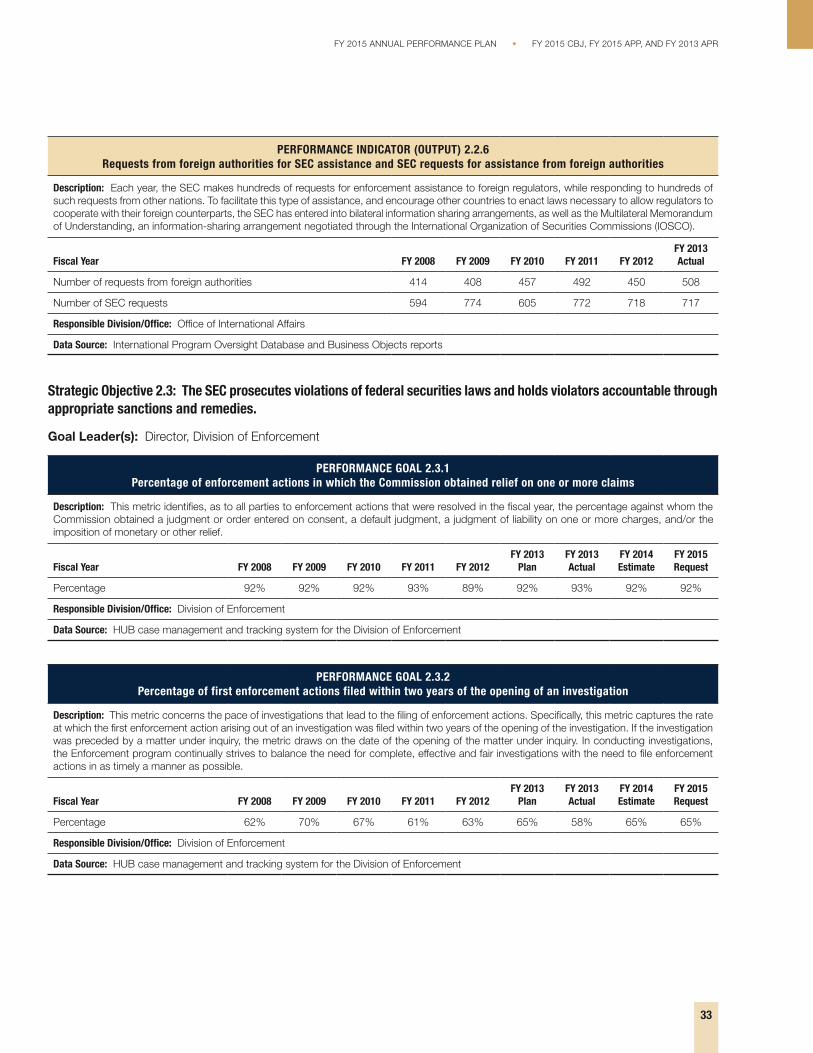
FY 2015 ANNUAL PERFORMANCE PLAN bull FY 2015 CBJ FY 2015 APP AND FY 2013 APR
PERFORMANCE INDICATOR (OUTPUT) 226 Requests from foreign authorities for SEC assistance and SEC requests for assistance from foreign authorities
Description Each year the SEC makes hundreds of requests for enforcement assistance to foreign regulators while responding to hundreds of such requests from other nations To facilitate this type of assistance and encourage other countries to enact laws necessary to allow regulators to cooperate with their foreign counterparts the SEC has entered into bilateral information sharing arrangements as well as the Multilateral Memorandum of Understanding an information-sharing arrangement negotiated through the International Organization of Securities Commissions (IOSCO)
FY 2013 Fiscal Year FY 2008 FY 2009 FY 2010 FY 2011 FY 2012 Actual
Number of requests from foreign authorities 414 408 457 492 450
Number of SEC requests 594 774 605 772 718
Responsible DivisionOffice Office of International Affairs
Data Source International Program Oversight Database and Business Objects reports
Strategic Objective 23 The SEC prosecutes violations of federal securities laws and holds violators accountable through appropriate sanctions and remedies
Goal Leader(s) Director Division of Enforcement
PERFORMANCE GOAL 231 Percentage of enforcement actions in which the Commission obtained relief on one or more claims
Description This metric identifies as to all parties to enforcement actions that were resolved in the fiscal year the percentage against whom the Commission obtained a judgment or order entered on consent a default judgment a judgment of liability on one or more charges andor the imposition of monetary or other relief
FY 2013 FY 2013 FY 2014 FY 2015 Fiscal Year FY 2008 FY 2009 FY 2010 FY 2011 FY 2012 Plan Actual Estimate Request
Percentage 92 92 92 93 89 92 93 92 92
Responsible DivisionOffice Division of Enforcement
Data Source HUB case management and tracking system for the Division of Enforcement
PERFORMANCE GOAL 232 Percentage of first enforcement actions filed within two years of the opening of an investigation
Description This metric concerns the pace of investigations that lead to the filing of enforcement actions Specifically this metric captures the rate at which the first enforcement action arising out of an investigation was filed within two years of the opening of the investigation If the investigation was preceded by a matter under inquiry the metric draws on the date of the opening of the matter under inquiry In conducting investigations the Enforcement program continually strives to balance the need for complete effective and fair investigations with the need to file enforcement actions in as timely a manner as possible
FY 2013 FY 2013 FY 2014 FY 2015 Fiscal Year FY 2008 FY 2009 FY 2010 FY 2011 FY 2012 Plan Actual Estimate Request
Percentage 62 70 67 61 63 65 58 65 65
Responsible DivisionOffice Division of Enforcement
Data Source HUB case management and tracking system for the Division of Enforcement
508
717
33
FY 2015 CBJ FY 2015 APP AND FY 2013 APR bull FY 2015 ANNUAL PERFORMANCE PLAN
PERFORMANCE GOAL 233 Average months between opening a matter under inquiry or an investigation and commencing an enforcement action
Description This metric captures the average number of months between the opening of an investigation and the filing of the first enforcement action arising out of that investigation If the investigation was preceded by a matter under inquiry the metric draws on the date of opening of the matter inquiry In conducting investigations the enforcement program continually strives to balance the need for complete effective and fair investigation with the need to file enforcement actions in as timely a manner as possible While not all investigations result in the filing of enforcement actions this metric provides information concerning the pace of investigations that do lead to such actions and supplements the previous goal which measures the percentage of first enforcement actions filed within two years
FY 2013 FY 2013 FY 2014 FY 2015 Fiscal Year FY 2008 FY 2009 FY 2010 FY 2011 FY 2012 Plan Actual Estimate Request
Months Prior-year data not available 22 21 20 21 20 20
Responsible DivisionOffice Division of Enforcement
Data Source HUB case management and tracking system for the Division of Enforcement
PERFORMANCE GOAL 234 Percentage of debts where either a payment has been made or a collection activity has
been initiated within 180 days of the due date of the debt
Description The SEC can seek a wide range of remedies for failure to comply with the securities laws These remedies include civil monetary penalties and disgorgement When the remedies are imposed by the SEC or the Federal district court payments must be made by a certain date This metric identifies the percentage of debts where debtors have made payments or the SEC has initiated a collection activity within 180 days of the due date Such collection activities include among other things demand letters negotiation of payment plans enforcing the payment of the debt through the courts or other judicial remedies
FY 2013 FY 2013 FY 2014 FY 2015 Fiscal Year FY 2008 FY 2009 FY 2010 FY 2011 FY 2012 Plan Actual Estimate Request
Percentage 88 90 86 91 92 92 95 95 95
Responsible DivisionOffice Division of Enforcement
Data Source DELPHI
PERFORMANCE GOAL 235 Percentage of Fair Fund and disgorgement fund plans that have distributed 80 percent of the available
funds for distribution within twenty four (24) months of the approval of the distribution plan
Description In addition to other types of relief the SEC may seek orders requiring parties to disgorge any money obtained through wrongdoing The SEC also is empowered to seek civil penalties for violations of the securities laws Where appropriate the SEC has sought to return disgorged funds to harmed investors and as a result of the Fair Funds provisions of the Sarbanes-Oxley Act and the Dodd-Frank Act to combine amounts paid as penalties with disgorged funds or to create a Fair Fund from penalties only to reduce losses to injured parties and to maximize funds available for distribution This metric identifies the percentage of distribution plans that reached a critical mass during the fiscal year and within twenty four (24) months of the approval of the distribution plan The distribution plan includes the timeline and procedures required to return the funds to injured investors This reflects Commission-wide efforts to implement plans to return money to investors quickly Any funds not returned to investors are sent to the US Treasury or the Investor Protection Fund established pursuant to Section 21F(g) of the Securities Exchange Act of 1934 Neither disgorgement nor penalties are used for the SECrsquos own expenses
FY 2013 FY 2013 FY 2014 FY 2015 Fiscal Year FY 2008 FY 2009 FY 2010 FY 2011 FY 2012 Plan Actual Estimate Request
Percentage Prior-year data not available 80 80 73 78 82
Responsible DivisionOffice Division of Enforcement
Data Source HUB case management and tracking system for the Division of Enforcement and Distributions Management System
34
PERFORMANCE INDICATOR (CONTEXTUAL) 232 Total amount distributed within the fiscal year and the number of Fair Funds from which those distributions came
Description In its enforcement actions the SEC may seek to return funds to harmed investors through disgorgement of ill-gotten gains or through the Fair Funds provision of the Sarbanes-Oxley Act This provision permits the SEC to combine amounts paid as penalties with disgorged funds or to create a Fair Fund from penalties only to reduce losses to injured parties This reflects the SECrsquos efforts to return funds to injured investors This indicator identifies the total amount distributed within the fiscal year and the number of Fair Funds from which those distributions came This indicator may increase or decrease in dollar amount and number of distribution funds based on the number of SEC enforcement actions brought involving distributions amounts ordered and paid in those actions and other factors Due to the variation in reporting timelines established for each individual distribution reported amounts are based on the agencyrsquos best available information Reported amounts do not include those funds distributed through receiverships Any funds not returned to investors are sent to the US Treasury or the Investor Protection Fund established pursuant to Section 21F(g) of the Securities Exchange Act of 1934 Neither disgorgement nor penalties are used for the Commissionrsquos own expenses
Fiscal Year FY 2008 FY 2009 FY 2010 FY 2011 FY 2012 FY 2013 Actual
Amount distributed (in millions) Prior-year data not available 815 251
Number of Fair Funds Prior-year data not available 31 22
Responsible DivisionOffice Division of Enforcement
Data Source HUB case management and tracking system for the Division of Enforcement Distributions Management System
PERFORMANCE INDICATOR (CONTEXTUAL) 231 Percentage of filed enforcement actions reflecting characteristics that present enhanced risk to investors and markets as
measured by the nature of the investigation conduct parties and impact
Description This indicator assesses the quality of the cases filed by the Division of Enforcement The indicator focuses on cases filed by the SEC that involve factors reflecting enhanced risk to investors and markets Such cases may involve (i) those identified through risk analytics and cross-disciplinary initiatives to reveal difficult-to-detect or early stage misconduct thus minimizing investor loss and preventing the spread of unlawful conduct and practices (ii) particularly egregious or widespread misconduct and investor harm (iii) vulnerable victims (iv) a high degree of scienter (v) involvement of individuals occupying substantial positions of authority or having fiduciary obligations or other special responsibilities to investors (vi) involvement of recidivists (vii) high amount of investor loss prevented (viii) misconduct that is difficult to detect due to the complexity of products transactions and practices (ix) use of innovative investigative or analytical techniques (x) effective coordination with other law enforcement partners andor (xi) whether the matter involves markets transactions or practices identified as an enforcement priority or that advances the programmatic priorities of other SEC Divisions or Offices
Fiscal Year FY 2008 FY 2009 FY 2010 FY 2011 FY 2012 FY 2013 Actual
Percentage Prior-year data not available NA NA
Responsible DivisionOffice Division of Enforcement
Data Source HUB case management and tracking system for the Division of Enforcement
35
FY 2015 ANNUAL PERFORMANCE PLAN bull FY 2015 CBJ FY 2015 APP AND FY 2013 APR
PERFORMANCE INDICATOR (OUTPUT) 233 Percent of enforcement actions filed that arose out of national priority investigations
Description The Division of Enforcement conducts many enforcement actions each year that can be characterized as high impact and of national priority High impact or national priority investigations include those investigations which are significant for one or more of the following reasons ndashthe matter (i) presents an opportunity to send a particularly strong and effective message of deterrence including with respect to markets products and transactions that are newly developing or that are long established but which by their nature present limited opportunities to detect wrongdoing and thus to deter misconduct (ii) involves particularly egregious or extensive misconduct (iii) involves potentially widespread and extensive harm to investors (iv) involves misconduct by persons occupying positions of substantial authority or responsibility or who owe fiduciary or other enhanced duties and obligations to a broad group of investors or others (v) involves potential wrongdoing as prohibited under newly-enacted legislation or regulatory rules (vi) concerns potential misconduct that occurred in connection with products markets transactions or practices that pose particularly significant risks for investors or a systemically important sector of the market (vii) involves a substantial number of potential victims and or particularly vulnerable victims (viii) involves products markets transactions or practices that the Enforcement Division has identified as priority areas (ie conduct relating to the financial crisis fraud in connection with mortgage-related securities financial fraud involving public companies whose stock is widely held misconduct by investment advisers and matters involving priorities established by particular regional offices or the specialized units) andor (ix) provides an opportunity to pursue priority interests shared by other law enforcement agencies on a coordinated basis
Fiscal Year FY 2008 FY 2009 FY 2010 FY 2011 FY 2012 FY 2013 Actual
Percentage Prior-year data not available 10 20 15
Responsible DivisionOffice Division of Enforcement
Data Source HUB case management and tracking system for the Division of Enforcement
PERFORMANCE INDICATOR (CONTEXTUAL) 234 Criminal actions related to conduct under investigation by the SEC
Description In some instances conduct may involve both civil and criminal violations and may be investigated by both the SEC and the criminal authorities This indicator identifies the number of criminal actions that are related to conduct under investigation by the SEC
Fiscal Year FY 2008 FY 2009 FY 2010 FY 2011 FY 2012 FY 2013 Actual
Number of criminal investigations Prior-year data not available
139 134 126 126
Responsible DivisionOffice Division of Enforcement
Data Source HUB case management and tracking system for the Division of Enforcement
PERFORMANCE INDICATOR (OUTPUT) 235 Disgorgement and penalties ordered and the amounts collected
Description In addition to other types of relief the SEC may seek orders requiring parties to disgorge any money obtained through wrongdoing The SEC is also empowered to seek civil penalties for violations of the securities laws In some cases the SEC will seek to obtain large monetary sanctions even in instances where the prospects of collecting on a judgment are slight The rationale for seeking monetary relief in these circumstances is that such relief even when likely uncollectible might become collectible in the future based on the defendantrsquos changed circumstances and also because such relief can serve to deter others from violating the securities laws Where appropriate the SEC has sought to return disgorged funds to harmed investors Funds not returned to investors are sent to the Treasury or the Investor Protection Fund established pursuant to Section 21F(g) of the Securities Exchange Act of 1934 This indicator lists disgorgement and penalties ordered as a result of SEC cases and the amounts collected in those actions This indicator could increase or decrease based on various factors
Fiscal Year FY 2008 FY 2009 FY 2010 FY 2011 FY 2012 FY 2013 Actual
Ordered amounts (in millions) 1030 2442 2846 2806 3104 3424
Collected amounts (in millions) 521 1694 1775 1281 1048 1603
Responsible DivisionOffice Division of Enforcement
Data Source DELPHI
36
FY 2015 CBJ FY 2015 APP AND FY 2013 APR bull FY 2015 ANNUAL PERFORMANCE PLAN
FY 2015 ANNUAL PERFORMANCE PLAN bull FY 2015 CBJ FY 2015 APP AND FY 2013 APR
Strategic Goal 3 Facilitate Access to the Information Investors Need to Make Informed Investment Decisions
The agency is requesting in FY 2015 a total of $2226 million and 651 FTEs towards achieving results in Strategic Goal 3
Budgeting for the Future (FY 2015)
An educated investing public ultimately provides the best defense against fraud and costly mistakes The federal securities laws place great emphasis on assuring that corporations investments companies and other entities provide investors with timely clear complete and accurate financial and non-financial information allowing investors to make wise investment decisions As part of its disclosure program CF and IM will continue in FY 2015 to meet the requirements of the Sarbanes-Oxley Act (Performance Goal 311) Accordingly CF and IM strive to review disclosures made by certain public issuers including issuersrsquo financial statements no less frequently than once every three years Additionally CF staff will strive to issue comments on a timely basis allowing companies seeking to raise capital by building offering schedules around the 30-day standard (Performance Goal 312) and IM will aim to exceed timeliness targets for
reviewing investment company disclosures (Performance Goal 313) Also in FY 2015 CF will continue to improve the quality of information provided to investors by focusing on disclosure by companies of the information most material to investment decision-making
OIEA responds to investment-related complaints and questions from tens of thousands of investors each year In FY 2015 staff is expected to close approximately 60 percent of complaints and inquiries within seven days and about 90 percent within 30 days (Performance Goal 322) The seven-day target has been adjusted to reflect new workload demands In FY 2015 OIEA will continue to refine internal processes and promote staff training to resolve matters OIEA expects to increase of the number of visitors to its investor education web pages by using social media technologies and partnering with the SECrsquos regional offices other federal and state agencies financial industry associations consumer groups and educational organizations on investor education programs OIEA also will continue to participate in a significant number of in-person outreach events in FY 2015 (Performance Goal 321)
Strategic Objective 31 The SEC works to ensure that investors have access to high-quality disclosure materials that facilitate informed investment decision-making
Goal Leader(s) Director Division of Trading and Markets Director Division of Corporation Finance Director Division of Investment Management
PERFORMANCE GOAL 311 Percentage of public companies and investment companies with disclosures reviewed each year
Description The Sarbanes-Oxley Act requires that the SEC review at least once every three years the disclosures of all companies and investment company portfolios reporting under the Exchange Act These reviews help improve the information available to investors and may identify possible violations of the federal securities laws This metric gauges the number of public companies and investment companies reviewed each year
FY 2013 FY 2013 FY 2014 FY 2015 Fiscal Year FY 2008 FY 2009 FY 2010 FY 2011 FY 2012 Plan Actual Estimate Request
Division of Corporation Finance
Corporations 39 40 44 48 48 33 52 33 33
Responsible DivisionOffice Division of Corporation Finance
Data Source Electronic Data Gathering Analysis and Retrieval (EDGAR)Filing Activity Tracking System (FACTS)
Division of Investment Management
Investment Company Portfolios 36 35 35 33 36 33 34 33 33
Responsible DivisionOffice Division of Investment Management
Data Source Microsoft Office Suite Tools
37
FY 2015 CBJ FY 2015 APP AND FY 2013 APR bull FY 2015 ANNUAL PERFORMANCE PLAN
PERFORMANCE GOAL 312 Time to issue initial comments on Securities Act filings
Description The target of 30 days or less has become a de facto industry standard for the maximum time to receive initial comments
FY 2013 FY 2013 FY 2014 FY 2015 Fiscal Year FY 2008 FY 2009 FY 2010 FY 2011 FY 2012 Plan Actual Estimate Request
Days 252 253 241 244 249 lt30 256 lt30 lt30 days days days days days days days days days
Responsible DivisionOffice Division of Corporation Finance
Data Source FACTS
PERFORMANCE GOAL 313 Percentage of investment company disclosure reviews for which initial comments are completed within timeliness goals
Description For initial registration statements the SECrsquos goal is to issue initial comments within 30 days after they are filed (60 days for registration statements of insurance product separate accounts and related mutual funds) The SEC also aims to comment on post-effective amendments within 45 days and preliminary proxy statements within 10 days after they are filed
FY 2013 FY 2013 FY 2014 FY 2015 Fiscal Year FY 2008 FY 2009 FY 2010 FY 2011 FY 2012 Plan Actual Estimate Request
Initial registration statements 95 95 93 92 96 85 98 85 85
Post-effective amendments 97 97 94 94 95 90 99 90 90
Preliminary proxy statements 99 99 99 98 100 99 98 99 99
Responsible DivisionOffice Division of Investment Management
Data Source Electronic Data Gathering Analysis and Retrieval (EDGAR)
PERFORMANCE INDICATOR (CONTEXTUAL) 311 Total digital audience including website social media and mobile media
Description Digital media has become the dominant channel for investors seeking to access information These statistics will help evaluate the extent to which investors are turning to the SEC identify the channels they use and quantify the amount of information they receive
FY 2013 Fiscal Year FY 2008 FY 2009 FY 2010 FY 2011 FY 2012 Actual
SECgov page views Prior-year data not available 372B
Social media followers 0 1608 83141 193837 236700 258733
Total emailmobile subscriptions Prior-year data not available 519602 631839 740318
Total email bulletins sent NA 875518 1280M 2397M 3344M 4085M
Total mobile bulletins sent NA 6001 62324 107848 150303 238815
Responsible DivisionOffice Office of Public Affairs
Data Source Akamai Technologies Google Analytics GovDelivery Hootsuite Social Media Channels
38
rsquo
FY 2015 ANNUAL PERFORMANCE PLAN bull FY 2015 CBJ FY 2015 APP AND FY 2013 APR
Strategic Objective 32 The SEC works to understand investor needs and educate investors so they are better prepared to make informed investment decisions
Goal Leader(s) Director Office of Investor Education and Advocacy
PERFORMANCE GOAL 321 Number of page views of online investor education content and number of in-person events
including those with specifically targeted communities and organizations
Description The Office of Investor Education and Advocacy (OIEA) initiates investor education campaigns on key strategies for making informed investment decisions including publicizing online resources for researching investment professionals and investments understanding fees and identifying fraud OIEA staff also participates in in-person events for investors generally and those targeted to specific investors such as seniors service members and other affinity groups This metric tracks page views of SEC online investor education materials and the number of investor events in which OIEA staff participated
FY 2013 FY 2013 FY 2014 FY 2015 Fiscal Year FY 2008 FY 2009 FY 2010 FY 2011 FY 2012 Plan Actual Estimate Request
Number of page views Prior-year data not available 15 121 15 20
Number of ldquoin-personrdquo events Prior-year data not available 50 52 50 50
Responsible DivisionOffice Office of Investor Education and Advocacy
Data Source Microsoft Office Suite Tools
PERFORMANCE GOAL 322 Timeliness of responses to investor contacts
Description OIEA serves the tens of thousands of investors each year who contact the SEC with investment-related complaints and questions The staff aims to close out as many new investor assistance matters as possible within seven and thirty business days
FY 2013 FY 2013 FY 2014 FY 2015 Fiscal Year FY 2008 FY 2009 FY 2010 FY 2011 FY 2012 Plan Actual Estimate Request
Closed within 7 days 78 70 72 67 54 50 62 60 60
Closed within 30 days 88 90 93 92 93 90 93 90 90
Responsible DivisionOffice Office of Investor Education and Advocacy
Data Source Internal log using IRIS data
PERFORMANCE GOAL 323 Customer satisfaction rating of OIEA s online investor education resources
Description This metric gauges the effectiveness helpfulness and usability of OIEArsquos online investor education resources
FY 2013 FY 2013 FY 2014 FY 2015 Fiscal Year FY 2008 FY 2009 FY 2010 FY 2011 FY 2012 Plan Actual Estimate Request
Satisfaction index Benchmark Benchmark score for score for
Prior-year data not available NA 81 federal federal government government
websites websites
Responsible DivisionOffice Office of Investor Education and Advocacy
Data Source ForeSee results online portal
39
FY 2015 CBJ FY 2015 APP AND FY 2013 APR bull FY 2015 ANNUAL PERFORMANCE PLAN
PERFORMANCE GOAL 324 Number of new investor education materials designed specifically to help investors protect themselves from fraud
Description Through OIEA and often in conjunction with other organizations the staff issues Investor Alerts and other forms of educational material that inform investors about different permutations of fraud new investment products and other topical issues This metric measures the number of new investor education materials issued by OIEA
FY 2013 FY 2013 FY 2014 FY 2015 Fiscal Year FY 2008 FY 2009 FY 2010 FY 2011 FY 2012 Plan Actual Estimate Request
Number of education materials Prior-year data 16 24 24 26 26 26
not available
Responsible DivisionOffice Office of Investor Education and Advocacy
Data Source wwwsecgov and wwwinvestorgov
PERFORMANCE INDICATOR (PROCESS) 321 Number of investor testing research projects
Description This indicator tracks the number of research initiatives used to gather feedback from investors on the usefulness of disclosures and other input on SEC rulemaking
FY 2013 Fiscal Year FY 2008 FY 2009 FY 2010 FY 2011 FY 2012 Actual
Number of projects 1 0 0 2 2
Responsible DivisionOffice Office of Investor Education and Advocacy
Data Source Microsoft Office Suite Tools
PERFORMANCE INDICATOR (PROCESS) 322 Number of sets of recommendations prepared by the investor advisor y committee
Description This indicator tracks the recommendations from the Investor Advisory Committee regarding investorsrsquo perspectives and priorities
FY 2013 Fiscal Year FY 2008 FY 2009 FY 2010 FY 2011 FY 2012 Actual
Number of sets of recommendations Prior-year data not available 0 4
Responsible DivisionOffice Office of Investor Education and Advocacy
Data Source wwwsecgov
26
0
40
Strategic Goal 4 Enhance the Commissionrsquos Performance through Effective Alignment and Management of Human Information and Financial Capital During FY 2015 the agency will continue to focus on recruiting and retaining high-performing staff and updating the expertise of SEC employees so they are abreast of the latest developments in the securities markets Furthermore the SEC will continue to strengthen internal controls The agency is requesting a total of $3599 million and 867 FTEs in FY 2015 to achieve results in Strategic Goal 4
Budgeting for the Future (FY 2015)
The investing public and the securities markets are best served by an efficient effective and agile SEC In FY 2015 the agency will continue to take steps to become a more effective regulator of the US financial markets by making sound investments in human capital and new technologies and enhancing internal controls
The planned investment in the SEC University for FY 2015 principally supports training and development for employees directly involved in examinations investigations fraud detection litigation and other core mission responsibilities of the agency The SEC University will provide specialized in-depth training concerning changing market conditions analytics and forensics and the agencyrsquos new responsibility areas The investment also will fund employees for certain specialized financial certifications and regulatory credentials as well as the advanced continuing education required for maintaining legal and financial credentials
To maintain mission effectiveness it is essential that attrition in the leadership ranks is quickly addressed by having a highly qualified and diverse pool of candidates ready to assume those
critical roles (Performance Goal 415) The Office of Human Resourcesrsquo (OHR) Workforce Planning has completed building the foundational database necessary to conduct succession planning A subset of this team has begun benchmarking succession planning approaches used by other Federal agencies and will develop and implement a program at the SEC by the end of FY 2014 The first measure is expected by September 30 2014
Leveraging modern reliable and innovative technologies together with predictive analytics will transform the way the SEC performs its mission and provide a proactive view into how technology impacts capital markets The SEC will derive significant and measurable performance improvements in core operations and increase value for users through the use of automated enterprise processes
The continuing implementation of OITrsquos Technology Transformation Plan (ldquoWorking Smarterrdquo) in FY 2015 will support vital technology initiatives It will ensure the SECrsquos business processes are streamlined integrated and implemented using the best technology available
While the SEC has made significant strides in its multi-year path towards a strong sustainable internal control posture the agency will continue to dedicate its energies towards remediating the significant deficiency in information security During FY 2015 OFM will work closely with the Department of Transportationrsquos Federal Shared Services Provider (FSSP) to implement its software upgrade and refine the new Federal government-wide travel management system
41
FY 2015 ANNUAL PERFORMANCE PLAN bull FY 2015 CBJ FY 2015 APP AND FY 2013 APR
FY 2015 CBJ FY 2015 APP AND FY 2013 APR bull FY 2015 ANNUAL PERFORMANCE PLAN
Strategic Objective 41 The SEC promotes a results-oriented work environment that attracts engages and retains a technically proficient and diverse workforce including leaders who provide motivation and strategic direction
Goal Leader(s) Director Office of Human Resources Director Office of Minority and Women Inclusion
PERFORMANCE GOAL 411 Turnover
Description When employee morale and engagement are high high-performing employees tend to remain in the organization Although turnover can fluctuate based on a variety of factors the SEC aims to keep its turnover rate relatively low below 8 per year
FY 2013 FY 2013 FY 2014 FY 2015 Fiscal Year FY 2008 FY 2009 FY 2010 FY 2011 FY 2012 Plan Actual Estimate Request
Percent turnover 62 37 5 64 658 lt8 658 lt8 lt8
Responsible DivisionOffice Office of Human Resources
Data Source The National Business Center at Department of Interior (DOI)
PERFORMANCE GOAL 412 Expanding staff expertise
Description Internal training and hiring programs are designed to help the agency recruit and develop a diverse and qualified staff with the key skills industry knowledge and expertise to support the SEC mission In particular there is a need to train examiners attorneys economists and other experts for subject matter expertise relevant to the marketplace and investment and trading practices This metric tracks whether certain areas requiring significant training are being addressed The agency will track the number of SEC staff participants in mission-focused training and development programs and will report on specific items through the use of post-course evaluations to assess the impact and results of this training on a five-point scale
FY 2013 FY 2013 FY 2014 FY 2015 Fiscal Year FY 2008 FY 2009 FY 2010 FY 2011 FY 2012 Plan Actual Estimate Request
Mission-focused training attendance Prior year data not available NA NA 12000 12120
Post-course evaluations of mission-Prior year data not available NA NA 45 45
focused training
Responsible DivisionOffice Office of Human Resources
Data Source Course Attendance Identified in LEAP (Instructor-led courses only) and End of Course Evaluation Report Summary provided by Metrics that Matter
PERFORMANCE GOAL 413 Number of diversity-related partnershipsalliances
Description Increased numbers of diversity-related partnerships or alliances with professional associations and educational organizations provide opportunities to educate students about the SECrsquos work and to recruit career professionals from all segments of society The SEC will track the number of partnerships andor alliances with diverse professional associations and educational organizations
FY 2013 FY 2013 FY 2014 FY 2015 Fiscal Year FY 2008 FY 2009 FY 2010 FY 2011 FY 2012 Plan Actual Estimate Request
Number of partnershipsalliances Prior-year data 2 10 12 15 13 15
not available
Responsible DivisionOffice Office of Minority Women and Inclusion
Data Source Office of Minority Women and Inclusion Internal Records and Section 342 of DFA
15
42
FY 2015 ANNUAL PERFORMANCE PLAN bull FY 2015 CBJ FY 2015 APP AND FY 2013 APR
PERFORMANCE GOAL 414 Sur vey rankings
Description Annual and other rankings together with other metrics and indicators of federal government agencies will be used as one kind of metric to determine the SECrsquos overall success in improving employee morale and employee engagement
FY 2013 FY 2013 FY 2014 FY 2015 Fiscal Year FY 2008 FY 2009 FY 2010 FY 2011 FY 2012 Plan Actual Estimate Request
Best Places to Work ranking Ranked Ranked Ranked Ranked Ranked Ranked Ranked Ranked Ranked 3 11 24 27 19 20 15 5 5
Average of employee engagement Prior-year data not available NA 61 75 75
and global satisfaction index
Responsible DivisionOffice Office of Human Resources
Data Source Annual Partnership for Public Service calculated ranking based on Annual Employee Viewpoint Survey (EVS) administered by OPM and Average of Employee Engagement and Global Satisfaction Index from OPM Employee Viewpoint Survey (EVS)
PERFORMANCE GOAL 415 Bench strength
Description To maintain mission effectiveness it is essential that attrition in the leadership ranks is quickly addressed by having a highly qualified and diverse pool of candidates ready to assume those critical roles Success is measured by the percentage of key leadership positions for which the SEC has identified a pool of qualified candidates
FY 2013 FY 2013 FY 2014 FY 2015 Fiscal Year FY 2008 FY 2009 FY 2010 FY 2011 FY 2012 Plan Actual Estimate Request
Data point under development NA NA NA NA NA NA NA TBD TBD
Responsible DivisionOffice Office of Human Resources
Data Source TBD
Strategic Objective 42 The SEC encourages a collaborative environment across divisions and offices and leverages technology and data to fulfill its mission more effectively and efficiently
Goal Leader(s) Director Office of Information Technology
PERFORMANCE GOAL 421 Ensure SECrsquos systems and applications are available
Description The SEC aims to enhance its computing infrastructure to eliminate down time if systems at one site fail among other objectives This metric will capture the percentage of systems and applications that can fail over within 8 hours
FY 2013 FY 2013 FY 2014 FY 2015 Fiscal Year FY 2008 FY 2009 FY 2010 FY 2011 FY 2012 Plan Actual Estimate Request
Percentage of servers virtualized NA 12 22 38 79 85 93 94 95
Percentage fail over within 8 hours NA NA NA NA NA NA NA 100 100
Responsible DivisionOffice Office of Information Technology
Data Source OIT Network Operations Center (NOC) ndash automated network monitoring tools
43
FY 2015 CBJ FY 2015 APP AND FY 2013 APR bull FY 2015 ANNUAL PERFORMANCE PLAN
PERFORMANCE GOAL 422 Equip the SEC with an enhanced technology infrastructure to support enterprise infrastructure
Description The SEC aims to promote collaboration and information sharing across the enterprise To improve efficiency and knowledge management the SEC will consolidate and centralize its collaborative technologies to a commonly used enterprise set by 2020 This metric will measure the percentage of the SECrsquos offices and divisions that utilize centralized enterprise collaboration solutions
FY 2013 FY 2013 FY 2014 FY 2015 Fiscal Year FY 2008 FY 2009 FY 2010 FY 2011 FY 2012 Plan Actual Estimate Request
Number of enterprise solutions Prior-year data not 10 20 25 30 30 35 40
available
Responsible DivisionOffice Office of Information Technology
Data Source Approved software applications list
PERFORMANCE GOAL 423 Expand the SECrsquos video teleconferencing (VTC) capabilities to support an increasingly geographically dispersed workforce
Description The SEC seeks to develop a state of the art video teleconference solution that allows users to conduct a videoteleconference meeting between HQ regional offices and multiple endpoints simultaneously collaborate and share presentation materials and use VoIP technology to host video teleconferences from their officesworkspaces with other SEC users or conference rooms This metric will measure the average ldquouptimerdquo or availability of all VTC systems
FY 2013 FY 2013 FY 2014 FY 2015 Fiscal Year FY 2008 FY 2009 FY 2010 FY 2011 FY 2012 Plan Actual Estimate Request
Availability rate for VTC solutions Prior-year data not available 75 80 9999 9999
Responsible DivisionOffice Office of Information Technology
Data Source Telecommunications monitoring system
PERFORMANCE GOAL 424 Pursue continuous technology cost reductions and efficiencies
Description Recent technology enhancements ndash eg data center consolidation virtualization and maintenance contract reductions ndash are producing technical efficiencies and cost savings This metric will measure the amount of these costs savings
FY 2013 FY 2013 FY 2014 FY 2015 Fiscal Year FY 2008 FY 2009 FY 2010 FY 2011 FY 2012 Plan Actual Estimate Request
Percent reduction in operational run 1-3 187 1 2 cost leveraging technology and cost cost reduction reduction process efficiencies
Prior-year data not available reduction in steady
reduction in steady
in run costs
in run costs
state run state run costs costs1
Responsible DivisionOffice Office of Information Technology
Data Source OIT Network Operations Center (NOC)
The higher than expected FY 2013 actual of 187 percent is due to one-time technologies enhancements resulting from the data consolidation and virtualization 1
44
FY 2015 ANNUAL PERFORMANCE PLAN bull FY 2015 CBJ FY 2015 APP AND FY 2013 APR
PERFORMANCE GOAL 425 Enhance the SECrsquos enterprise data warehouse infrastructure and performance
Description The Enterprise Data Warehouse (EDW) infrastructure will enable the provisioning of data to Commission staff for search and analysis through a virtual data warehouse platform This metric will measure the availability of EDW and data sources
FY 2013 FY 2013 FY 2014 FY 2015 Fiscal Year FY 2008 FY 2009 FY 2010 FY 2011 FY 2012 Plan Actual Estimate Request
Availability rate for the EDW infrastructure components in Prior-year data not available NA NA 99 99 production
Responsible DivisionOffice Office of Information Technology
Data Source OIT Network Operations Center (NOC) ndash automated network monitoring tools
Strategic Objective 43 The SEC maximizes the use of agency resources by continually improving agency operations and bolstering internal controls
Goal Leader(s) Chief Financial Officer Chief Operations Officer
PERFORMANCE GOAL 431 Financial audit results
Description Under the Accountability of Taxpayer Dollars Act of 2002 the agency is required to meet all proprietary and budgetary accounting guidelines for federal agencies and to undergo annual audits The SECrsquos audits are conducted by the Government Accountability Office
FY 2013 FY 2013 FY 2014 FY 2015 Fiscal Year FY 2008 FY 2009 FY 2010 FY 2011 FY 2012 Plan Actual Estimate Request
Unqualified opinion Yes Yes Yes Yes Yes Yes Yes Yes Yes
Material weaknesses 0 1 2 0 0 0 0 0 0
Significant deficiency 3 6 0 4 2 0 1 0 0
Responsible DivisionOffice Office of Financial Management
Data Source GAO SEC Financial Audit Report
PERFORMANCE GOAL 432 Assurance statement on internal control over operations
Description In accordance with OMB A-123 and Section 961 of the Dodd-Frank Act the SEC conducts an annual assessment of the effectiveness of internal controls The SEC will continue to develop its Operational Risk program and enhance cross-organizational processes to support all division and office management assurance statements Success is measured by the quality of risk and control assessments and management self-identification and resolution of improvement opportunities
FY 2013 FY 2013 FY 2014 FY 2015 Fiscal Year FY 2008 FY 2009 FY 2010 FY 2011 FY 2012 Plan Actual Estimate Request
Unqualified opinion Yes Yes Yes Yes Yes Yes Yes Yes Yes
Material weakness 0 0 0 0 0 0 0 0 0
Responsible DivisionOffice Office of the Chief Operating Officer
Data Source SEC Financial Audit Report
45
FY 2015 CBJ FY 2015 APP AND FY 2013 APR bull FY 2015 ANNUAL PERFORMANCE PLAN
1
PERFORMANCE GOAL 433 Timely completion of corrective action on Office of Inspector General (OIG) and the GAO audit recommendations1
Description Timely completion of audit recommendations is an important SEC priority This metric measures how well the Commission is doing in completing corrective action on OIG audit recommendations within established timeframes
FY 2013 FY 2013 FY 2014 FY 2015 Fiscal Year FY 2008 FY 2009 FY 2010 FY 2011 FY 2012 Plan Actual Estimate Request
OIG recommendations completed in Prior-year data not available NA 78 80 80
less than one year
Responsible DivisionOffice Office of the Chief Operating Officer
Data Source Audit Recommendation Tracking System
This measure was developed as part of the FY 2014-2018 SEC strategic planning process Currently there is no methodology in place to capture data for tracking all GAO Audit recommendations OCOO will determine a timeframe for establishing a methodology during FY 2014
46
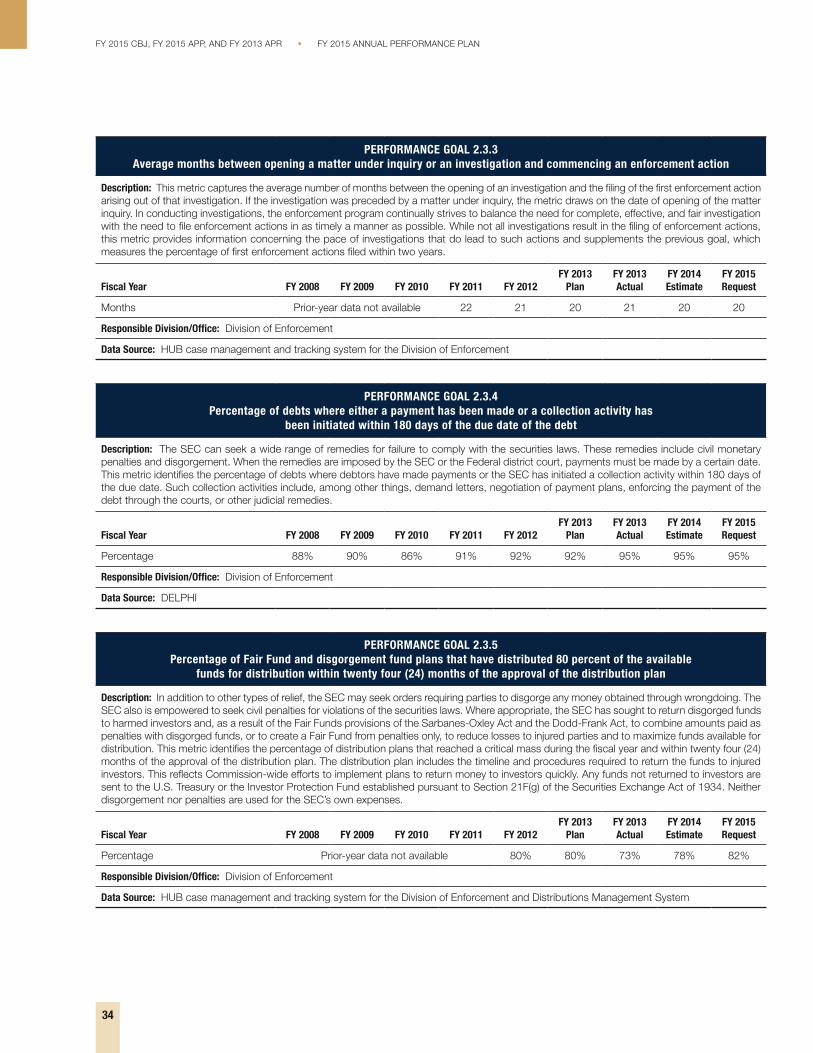
FY 2015 CBJ FY 2015 APP AND FY 2013 APR bull FY 2015 ANNUAL PERFORMANCE PLAN
PERFORMANCE GOAL 233 Average months between opening a matter under inquiry or an investigation and commencing an enforcement action
Description This metric captures the average number of months between the opening of an investigation and the filing of the first enforcement action arising out of that investigation If the investigation was preceded by a matter under inquiry the metric draws on the date of opening of the matter inquiry In conducting investigations the enforcement program continually strives to balance the need for complete effective and fair investigation with the need to file enforcement actions in as timely a manner as possible While not all investigations result in the filing of enforcement actions this metric provides information concerning the pace of investigations that do lead to such actions and supplements the previous goal which measures the percentage of first enforcement actions filed within two years
FY 2013 FY 2013 FY 2014 FY 2015 Fiscal Year FY 2008 FY 2009 FY 2010 FY 2011 FY 2012 Plan Actual Estimate Request
Months Prior-year data not available 22 21 20 21 20 20
Responsible DivisionOffice Division of Enforcement
Data Source HUB case management and tracking system for the Division of Enforcement
PERFORMANCE GOAL 234 Percentage of debts where either a payment has been made or a collection activity has
been initiated within 180 days of the due date of the debt
Description The SEC can seek a wide range of remedies for failure to comply with the securities laws These remedies include civil monetary penalties and disgorgement When the remedies are imposed by the SEC or the Federal district court payments must be made by a certain date This metric identifies the percentage of debts where debtors have made payments or the SEC has initiated a collection activity within 180 days of the due date Such collection activities include among other things demand letters negotiation of payment plans enforcing the payment of the debt through the courts or other judicial remedies
FY 2013 FY 2013 FY 2014 FY 2015 Fiscal Year FY 2008 FY 2009 FY 2010 FY 2011 FY 2012 Plan Actual Estimate Request
Percentage 88 90 86 91 92 92 95 95 95
Responsible DivisionOffice Division of Enforcement
Data Source DELPHI
PERFORMANCE GOAL 235 Percentage of Fair Fund and disgorgement fund plans that have distributed 80 percent of the available
funds for distribution within twenty four (24) months of the approval of the distribution plan
Description In addition to other types of relief the SEC may seek orders requiring parties to disgorge any money obtained through wrongdoing The SEC also is empowered to seek civil penalties for violations of the securities laws Where appropriate the SEC has sought to return disgorged funds to harmed investors and as a result of the Fair Funds provisions of the Sarbanes-Oxley Act and the Dodd-Frank Act to combine amounts paid as penalties with disgorged funds or to create a Fair Fund from penalties only to reduce losses to injured parties and to maximize funds available for distribution This metric identifies the percentage of distribution plans that reached a critical mass during the fiscal year and within twenty four (24) months of the approval of the distribution plan The distribution plan includes the timeline and procedures required to return the funds to injured investors This reflects Commission-wide efforts to implement plans to return money to investors quickly Any funds not returned to investors are sent to the US Treasury or the Investor Protection Fund established pursuant to Section 21F(g) of the Securities Exchange Act of 1934 Neither disgorgement nor penalties are used for the SECrsquos own expenses
FY 2013 FY 2013 FY 2014 FY 2015 Fiscal Year FY 2008 FY 2009 FY 2010 FY 2011 FY 2012 Plan Actual Estimate Request
Percentage Prior-year data not available 80 80 73 78 82
Responsible DivisionOffice Division of Enforcement
Data Source HUB case management and tracking system for the Division of Enforcement and Distributions Management System
34
PERFORMANCE INDICATOR (CONTEXTUAL) 232 Total amount distributed within the fiscal year and the number of Fair Funds from which those distributions came
Description In its enforcement actions the SEC may seek to return funds to harmed investors through disgorgement of ill-gotten gains or through the Fair Funds provision of the Sarbanes-Oxley Act This provision permits the SEC to combine amounts paid as penalties with disgorged funds or to create a Fair Fund from penalties only to reduce losses to injured parties This reflects the SECrsquos efforts to return funds to injured investors This indicator identifies the total amount distributed within the fiscal year and the number of Fair Funds from which those distributions came This indicator may increase or decrease in dollar amount and number of distribution funds based on the number of SEC enforcement actions brought involving distributions amounts ordered and paid in those actions and other factors Due to the variation in reporting timelines established for each individual distribution reported amounts are based on the agencyrsquos best available information Reported amounts do not include those funds distributed through receiverships Any funds not returned to investors are sent to the US Treasury or the Investor Protection Fund established pursuant to Section 21F(g) of the Securities Exchange Act of 1934 Neither disgorgement nor penalties are used for the Commissionrsquos own expenses
Fiscal Year FY 2008 FY 2009 FY 2010 FY 2011 FY 2012 FY 2013 Actual
Amount distributed (in millions) Prior-year data not available 815 251
Number of Fair Funds Prior-year data not available 31 22
Responsible DivisionOffice Division of Enforcement
Data Source HUB case management and tracking system for the Division of Enforcement Distributions Management System
PERFORMANCE INDICATOR (CONTEXTUAL) 231 Percentage of filed enforcement actions reflecting characteristics that present enhanced risk to investors and markets as
measured by the nature of the investigation conduct parties and impact
Description This indicator assesses the quality of the cases filed by the Division of Enforcement The indicator focuses on cases filed by the SEC that involve factors reflecting enhanced risk to investors and markets Such cases may involve (i) those identified through risk analytics and cross-disciplinary initiatives to reveal difficult-to-detect or early stage misconduct thus minimizing investor loss and preventing the spread of unlawful conduct and practices (ii) particularly egregious or widespread misconduct and investor harm (iii) vulnerable victims (iv) a high degree of scienter (v) involvement of individuals occupying substantial positions of authority or having fiduciary obligations or other special responsibilities to investors (vi) involvement of recidivists (vii) high amount of investor loss prevented (viii) misconduct that is difficult to detect due to the complexity of products transactions and practices (ix) use of innovative investigative or analytical techniques (x) effective coordination with other law enforcement partners andor (xi) whether the matter involves markets transactions or practices identified as an enforcement priority or that advances the programmatic priorities of other SEC Divisions or Offices
Fiscal Year FY 2008 FY 2009 FY 2010 FY 2011 FY 2012 FY 2013 Actual
Percentage Prior-year data not available NA NA
Responsible DivisionOffice Division of Enforcement
Data Source HUB case management and tracking system for the Division of Enforcement
35
FY 2015 ANNUAL PERFORMANCE PLAN bull FY 2015 CBJ FY 2015 APP AND FY 2013 APR
PERFORMANCE INDICATOR (OUTPUT) 233 Percent of enforcement actions filed that arose out of national priority investigations
Description The Division of Enforcement conducts many enforcement actions each year that can be characterized as high impact and of national priority High impact or national priority investigations include those investigations which are significant for one or more of the following reasons ndashthe matter (i) presents an opportunity to send a particularly strong and effective message of deterrence including with respect to markets products and transactions that are newly developing or that are long established but which by their nature present limited opportunities to detect wrongdoing and thus to deter misconduct (ii) involves particularly egregious or extensive misconduct (iii) involves potentially widespread and extensive harm to investors (iv) involves misconduct by persons occupying positions of substantial authority or responsibility or who owe fiduciary or other enhanced duties and obligations to a broad group of investors or others (v) involves potential wrongdoing as prohibited under newly-enacted legislation or regulatory rules (vi) concerns potential misconduct that occurred in connection with products markets transactions or practices that pose particularly significant risks for investors or a systemically important sector of the market (vii) involves a substantial number of potential victims and or particularly vulnerable victims (viii) involves products markets transactions or practices that the Enforcement Division has identified as priority areas (ie conduct relating to the financial crisis fraud in connection with mortgage-related securities financial fraud involving public companies whose stock is widely held misconduct by investment advisers and matters involving priorities established by particular regional offices or the specialized units) andor (ix) provides an opportunity to pursue priority interests shared by other law enforcement agencies on a coordinated basis
Fiscal Year FY 2008 FY 2009 FY 2010 FY 2011 FY 2012 FY 2013 Actual
Percentage Prior-year data not available 10 20 15
Responsible DivisionOffice Division of Enforcement
Data Source HUB case management and tracking system for the Division of Enforcement
PERFORMANCE INDICATOR (CONTEXTUAL) 234 Criminal actions related to conduct under investigation by the SEC
Description In some instances conduct may involve both civil and criminal violations and may be investigated by both the SEC and the criminal authorities This indicator identifies the number of criminal actions that are related to conduct under investigation by the SEC
Fiscal Year FY 2008 FY 2009 FY 2010 FY 2011 FY 2012 FY 2013 Actual
Number of criminal investigations Prior-year data not available
139 134 126 126
Responsible DivisionOffice Division of Enforcement
Data Source HUB case management and tracking system for the Division of Enforcement
PERFORMANCE INDICATOR (OUTPUT) 235 Disgorgement and penalties ordered and the amounts collected
Description In addition to other types of relief the SEC may seek orders requiring parties to disgorge any money obtained through wrongdoing The SEC is also empowered to seek civil penalties for violations of the securities laws In some cases the SEC will seek to obtain large monetary sanctions even in instances where the prospects of collecting on a judgment are slight The rationale for seeking monetary relief in these circumstances is that such relief even when likely uncollectible might become collectible in the future based on the defendantrsquos changed circumstances and also because such relief can serve to deter others from violating the securities laws Where appropriate the SEC has sought to return disgorged funds to harmed investors Funds not returned to investors are sent to the Treasury or the Investor Protection Fund established pursuant to Section 21F(g) of the Securities Exchange Act of 1934 This indicator lists disgorgement and penalties ordered as a result of SEC cases and the amounts collected in those actions This indicator could increase or decrease based on various factors
Fiscal Year FY 2008 FY 2009 FY 2010 FY 2011 FY 2012 FY 2013 Actual
Ordered amounts (in millions) 1030 2442 2846 2806 3104 3424
Collected amounts (in millions) 521 1694 1775 1281 1048 1603
Responsible DivisionOffice Division of Enforcement
Data Source DELPHI
36
FY 2015 CBJ FY 2015 APP AND FY 2013 APR bull FY 2015 ANNUAL PERFORMANCE PLAN
FY 2015 ANNUAL PERFORMANCE PLAN bull FY 2015 CBJ FY 2015 APP AND FY 2013 APR
Strategic Goal 3 Facilitate Access to the Information Investors Need to Make Informed Investment Decisions
The agency is requesting in FY 2015 a total of $2226 million and 651 FTEs towards achieving results in Strategic Goal 3
Budgeting for the Future (FY 2015)
An educated investing public ultimately provides the best defense against fraud and costly mistakes The federal securities laws place great emphasis on assuring that corporations investments companies and other entities provide investors with timely clear complete and accurate financial and non-financial information allowing investors to make wise investment decisions As part of its disclosure program CF and IM will continue in FY 2015 to meet the requirements of the Sarbanes-Oxley Act (Performance Goal 311) Accordingly CF and IM strive to review disclosures made by certain public issuers including issuersrsquo financial statements no less frequently than once every three years Additionally CF staff will strive to issue comments on a timely basis allowing companies seeking to raise capital by building offering schedules around the 30-day standard (Performance Goal 312) and IM will aim to exceed timeliness targets for
reviewing investment company disclosures (Performance Goal 313) Also in FY 2015 CF will continue to improve the quality of information provided to investors by focusing on disclosure by companies of the information most material to investment decision-making
OIEA responds to investment-related complaints and questions from tens of thousands of investors each year In FY 2015 staff is expected to close approximately 60 percent of complaints and inquiries within seven days and about 90 percent within 30 days (Performance Goal 322) The seven-day target has been adjusted to reflect new workload demands In FY 2015 OIEA will continue to refine internal processes and promote staff training to resolve matters OIEA expects to increase of the number of visitors to its investor education web pages by using social media technologies and partnering with the SECrsquos regional offices other federal and state agencies financial industry associations consumer groups and educational organizations on investor education programs OIEA also will continue to participate in a significant number of in-person outreach events in FY 2015 (Performance Goal 321)
Strategic Objective 31 The SEC works to ensure that investors have access to high-quality disclosure materials that facilitate informed investment decision-making
Goal Leader(s) Director Division of Trading and Markets Director Division of Corporation Finance Director Division of Investment Management
PERFORMANCE GOAL 311 Percentage of public companies and investment companies with disclosures reviewed each year
Description The Sarbanes-Oxley Act requires that the SEC review at least once every three years the disclosures of all companies and investment company portfolios reporting under the Exchange Act These reviews help improve the information available to investors and may identify possible violations of the federal securities laws This metric gauges the number of public companies and investment companies reviewed each year
FY 2013 FY 2013 FY 2014 FY 2015 Fiscal Year FY 2008 FY 2009 FY 2010 FY 2011 FY 2012 Plan Actual Estimate Request
Division of Corporation Finance
Corporations 39 40 44 48 48 33 52 33 33
Responsible DivisionOffice Division of Corporation Finance
Data Source Electronic Data Gathering Analysis and Retrieval (EDGAR)Filing Activity Tracking System (FACTS)
Division of Investment Management
Investment Company Portfolios 36 35 35 33 36 33 34 33 33
Responsible DivisionOffice Division of Investment Management
Data Source Microsoft Office Suite Tools
37
FY 2015 CBJ FY 2015 APP AND FY 2013 APR bull FY 2015 ANNUAL PERFORMANCE PLAN
PERFORMANCE GOAL 312 Time to issue initial comments on Securities Act filings
Description The target of 30 days or less has become a de facto industry standard for the maximum time to receive initial comments
FY 2013 FY 2013 FY 2014 FY 2015 Fiscal Year FY 2008 FY 2009 FY 2010 FY 2011 FY 2012 Plan Actual Estimate Request
Days 252 253 241 244 249 lt30 256 lt30 lt30 days days days days days days days days days
Responsible DivisionOffice Division of Corporation Finance
Data Source FACTS
PERFORMANCE GOAL 313 Percentage of investment company disclosure reviews for which initial comments are completed within timeliness goals
Description For initial registration statements the SECrsquos goal is to issue initial comments within 30 days after they are filed (60 days for registration statements of insurance product separate accounts and related mutual funds) The SEC also aims to comment on post-effective amendments within 45 days and preliminary proxy statements within 10 days after they are filed
FY 2013 FY 2013 FY 2014 FY 2015 Fiscal Year FY 2008 FY 2009 FY 2010 FY 2011 FY 2012 Plan Actual Estimate Request
Initial registration statements 95 95 93 92 96 85 98 85 85
Post-effective amendments 97 97 94 94 95 90 99 90 90
Preliminary proxy statements 99 99 99 98 100 99 98 99 99
Responsible DivisionOffice Division of Investment Management
Data Source Electronic Data Gathering Analysis and Retrieval (EDGAR)
PERFORMANCE INDICATOR (CONTEXTUAL) 311 Total digital audience including website social media and mobile media
Description Digital media has become the dominant channel for investors seeking to access information These statistics will help evaluate the extent to which investors are turning to the SEC identify the channels they use and quantify the amount of information they receive
FY 2013 Fiscal Year FY 2008 FY 2009 FY 2010 FY 2011 FY 2012 Actual
SECgov page views Prior-year data not available 372B
Social media followers 0 1608 83141 193837 236700 258733
Total emailmobile subscriptions Prior-year data not available 519602 631839 740318
Total email bulletins sent NA 875518 1280M 2397M 3344M 4085M
Total mobile bulletins sent NA 6001 62324 107848 150303 238815
Responsible DivisionOffice Office of Public Affairs
Data Source Akamai Technologies Google Analytics GovDelivery Hootsuite Social Media Channels
38
rsquo
FY 2015 ANNUAL PERFORMANCE PLAN bull FY 2015 CBJ FY 2015 APP AND FY 2013 APR
Strategic Objective 32 The SEC works to understand investor needs and educate investors so they are better prepared to make informed investment decisions
Goal Leader(s) Director Office of Investor Education and Advocacy
PERFORMANCE GOAL 321 Number of page views of online investor education content and number of in-person events
including those with specifically targeted communities and organizations
Description The Office of Investor Education and Advocacy (OIEA) initiates investor education campaigns on key strategies for making informed investment decisions including publicizing online resources for researching investment professionals and investments understanding fees and identifying fraud OIEA staff also participates in in-person events for investors generally and those targeted to specific investors such as seniors service members and other affinity groups This metric tracks page views of SEC online investor education materials and the number of investor events in which OIEA staff participated
FY 2013 FY 2013 FY 2014 FY 2015 Fiscal Year FY 2008 FY 2009 FY 2010 FY 2011 FY 2012 Plan Actual Estimate Request
Number of page views Prior-year data not available 15 121 15 20
Number of ldquoin-personrdquo events Prior-year data not available 50 52 50 50
Responsible DivisionOffice Office of Investor Education and Advocacy
Data Source Microsoft Office Suite Tools
PERFORMANCE GOAL 322 Timeliness of responses to investor contacts
Description OIEA serves the tens of thousands of investors each year who contact the SEC with investment-related complaints and questions The staff aims to close out as many new investor assistance matters as possible within seven and thirty business days
FY 2013 FY 2013 FY 2014 FY 2015 Fiscal Year FY 2008 FY 2009 FY 2010 FY 2011 FY 2012 Plan Actual Estimate Request
Closed within 7 days 78 70 72 67 54 50 62 60 60
Closed within 30 days 88 90 93 92 93 90 93 90 90
Responsible DivisionOffice Office of Investor Education and Advocacy
Data Source Internal log using IRIS data
PERFORMANCE GOAL 323 Customer satisfaction rating of OIEA s online investor education resources
Description This metric gauges the effectiveness helpfulness and usability of OIEArsquos online investor education resources
FY 2013 FY 2013 FY 2014 FY 2015 Fiscal Year FY 2008 FY 2009 FY 2010 FY 2011 FY 2012 Plan Actual Estimate Request
Satisfaction index Benchmark Benchmark score for score for
Prior-year data not available NA 81 federal federal government government
websites websites
Responsible DivisionOffice Office of Investor Education and Advocacy
Data Source ForeSee results online portal
39
FY 2015 CBJ FY 2015 APP AND FY 2013 APR bull FY 2015 ANNUAL PERFORMANCE PLAN
PERFORMANCE GOAL 324 Number of new investor education materials designed specifically to help investors protect themselves from fraud
Description Through OIEA and often in conjunction with other organizations the staff issues Investor Alerts and other forms of educational material that inform investors about different permutations of fraud new investment products and other topical issues This metric measures the number of new investor education materials issued by OIEA
FY 2013 FY 2013 FY 2014 FY 2015 Fiscal Year FY 2008 FY 2009 FY 2010 FY 2011 FY 2012 Plan Actual Estimate Request
Number of education materials Prior-year data 16 24 24 26 26 26
not available
Responsible DivisionOffice Office of Investor Education and Advocacy
Data Source wwwsecgov and wwwinvestorgov
PERFORMANCE INDICATOR (PROCESS) 321 Number of investor testing research projects
Description This indicator tracks the number of research initiatives used to gather feedback from investors on the usefulness of disclosures and other input on SEC rulemaking
FY 2013 Fiscal Year FY 2008 FY 2009 FY 2010 FY 2011 FY 2012 Actual
Number of projects 1 0 0 2 2
Responsible DivisionOffice Office of Investor Education and Advocacy
Data Source Microsoft Office Suite Tools
PERFORMANCE INDICATOR (PROCESS) 322 Number of sets of recommendations prepared by the investor advisor y committee
Description This indicator tracks the recommendations from the Investor Advisory Committee regarding investorsrsquo perspectives and priorities
FY 2013 Fiscal Year FY 2008 FY 2009 FY 2010 FY 2011 FY 2012 Actual
Number of sets of recommendations Prior-year data not available 0 4
Responsible DivisionOffice Office of Investor Education and Advocacy
Data Source wwwsecgov
26
0
40
Strategic Goal 4 Enhance the Commissionrsquos Performance through Effective Alignment and Management of Human Information and Financial Capital During FY 2015 the agency will continue to focus on recruiting and retaining high-performing staff and updating the expertise of SEC employees so they are abreast of the latest developments in the securities markets Furthermore the SEC will continue to strengthen internal controls The agency is requesting a total of $3599 million and 867 FTEs in FY 2015 to achieve results in Strategic Goal 4
Budgeting for the Future (FY 2015)
The investing public and the securities markets are best served by an efficient effective and agile SEC In FY 2015 the agency will continue to take steps to become a more effective regulator of the US financial markets by making sound investments in human capital and new technologies and enhancing internal controls
The planned investment in the SEC University for FY 2015 principally supports training and development for employees directly involved in examinations investigations fraud detection litigation and other core mission responsibilities of the agency The SEC University will provide specialized in-depth training concerning changing market conditions analytics and forensics and the agencyrsquos new responsibility areas The investment also will fund employees for certain specialized financial certifications and regulatory credentials as well as the advanced continuing education required for maintaining legal and financial credentials
To maintain mission effectiveness it is essential that attrition in the leadership ranks is quickly addressed by having a highly qualified and diverse pool of candidates ready to assume those
critical roles (Performance Goal 415) The Office of Human Resourcesrsquo (OHR) Workforce Planning has completed building the foundational database necessary to conduct succession planning A subset of this team has begun benchmarking succession planning approaches used by other Federal agencies and will develop and implement a program at the SEC by the end of FY 2014 The first measure is expected by September 30 2014
Leveraging modern reliable and innovative technologies together with predictive analytics will transform the way the SEC performs its mission and provide a proactive view into how technology impacts capital markets The SEC will derive significant and measurable performance improvements in core operations and increase value for users through the use of automated enterprise processes
The continuing implementation of OITrsquos Technology Transformation Plan (ldquoWorking Smarterrdquo) in FY 2015 will support vital technology initiatives It will ensure the SECrsquos business processes are streamlined integrated and implemented using the best technology available
While the SEC has made significant strides in its multi-year path towards a strong sustainable internal control posture the agency will continue to dedicate its energies towards remediating the significant deficiency in information security During FY 2015 OFM will work closely with the Department of Transportationrsquos Federal Shared Services Provider (FSSP) to implement its software upgrade and refine the new Federal government-wide travel management system
41
FY 2015 ANNUAL PERFORMANCE PLAN bull FY 2015 CBJ FY 2015 APP AND FY 2013 APR
FY 2015 CBJ FY 2015 APP AND FY 2013 APR bull FY 2015 ANNUAL PERFORMANCE PLAN
Strategic Objective 41 The SEC promotes a results-oriented work environment that attracts engages and retains a technically proficient and diverse workforce including leaders who provide motivation and strategic direction
Goal Leader(s) Director Office of Human Resources Director Office of Minority and Women Inclusion
PERFORMANCE GOAL 411 Turnover
Description When employee morale and engagement are high high-performing employees tend to remain in the organization Although turnover can fluctuate based on a variety of factors the SEC aims to keep its turnover rate relatively low below 8 per year
FY 2013 FY 2013 FY 2014 FY 2015 Fiscal Year FY 2008 FY 2009 FY 2010 FY 2011 FY 2012 Plan Actual Estimate Request
Percent turnover 62 37 5 64 658 lt8 658 lt8 lt8
Responsible DivisionOffice Office of Human Resources
Data Source The National Business Center at Department of Interior (DOI)
PERFORMANCE GOAL 412 Expanding staff expertise
Description Internal training and hiring programs are designed to help the agency recruit and develop a diverse and qualified staff with the key skills industry knowledge and expertise to support the SEC mission In particular there is a need to train examiners attorneys economists and other experts for subject matter expertise relevant to the marketplace and investment and trading practices This metric tracks whether certain areas requiring significant training are being addressed The agency will track the number of SEC staff participants in mission-focused training and development programs and will report on specific items through the use of post-course evaluations to assess the impact and results of this training on a five-point scale
FY 2013 FY 2013 FY 2014 FY 2015 Fiscal Year FY 2008 FY 2009 FY 2010 FY 2011 FY 2012 Plan Actual Estimate Request
Mission-focused training attendance Prior year data not available NA NA 12000 12120
Post-course evaluations of mission-Prior year data not available NA NA 45 45
focused training
Responsible DivisionOffice Office of Human Resources
Data Source Course Attendance Identified in LEAP (Instructor-led courses only) and End of Course Evaluation Report Summary provided by Metrics that Matter
PERFORMANCE GOAL 413 Number of diversity-related partnershipsalliances
Description Increased numbers of diversity-related partnerships or alliances with professional associations and educational organizations provide opportunities to educate students about the SECrsquos work and to recruit career professionals from all segments of society The SEC will track the number of partnerships andor alliances with diverse professional associations and educational organizations
FY 2013 FY 2013 FY 2014 FY 2015 Fiscal Year FY 2008 FY 2009 FY 2010 FY 2011 FY 2012 Plan Actual Estimate Request
Number of partnershipsalliances Prior-year data 2 10 12 15 13 15
not available
Responsible DivisionOffice Office of Minority Women and Inclusion
Data Source Office of Minority Women and Inclusion Internal Records and Section 342 of DFA
15
42
FY 2015 ANNUAL PERFORMANCE PLAN bull FY 2015 CBJ FY 2015 APP AND FY 2013 APR
PERFORMANCE GOAL 414 Sur vey rankings
Description Annual and other rankings together with other metrics and indicators of federal government agencies will be used as one kind of metric to determine the SECrsquos overall success in improving employee morale and employee engagement
FY 2013 FY 2013 FY 2014 FY 2015 Fiscal Year FY 2008 FY 2009 FY 2010 FY 2011 FY 2012 Plan Actual Estimate Request
Best Places to Work ranking Ranked Ranked Ranked Ranked Ranked Ranked Ranked Ranked Ranked 3 11 24 27 19 20 15 5 5
Average of employee engagement Prior-year data not available NA 61 75 75
and global satisfaction index
Responsible DivisionOffice Office of Human Resources
Data Source Annual Partnership for Public Service calculated ranking based on Annual Employee Viewpoint Survey (EVS) administered by OPM and Average of Employee Engagement and Global Satisfaction Index from OPM Employee Viewpoint Survey (EVS)
PERFORMANCE GOAL 415 Bench strength
Description To maintain mission effectiveness it is essential that attrition in the leadership ranks is quickly addressed by having a highly qualified and diverse pool of candidates ready to assume those critical roles Success is measured by the percentage of key leadership positions for which the SEC has identified a pool of qualified candidates
FY 2013 FY 2013 FY 2014 FY 2015 Fiscal Year FY 2008 FY 2009 FY 2010 FY 2011 FY 2012 Plan Actual Estimate Request
Data point under development NA NA NA NA NA NA NA TBD TBD
Responsible DivisionOffice Office of Human Resources
Data Source TBD
Strategic Objective 42 The SEC encourages a collaborative environment across divisions and offices and leverages technology and data to fulfill its mission more effectively and efficiently
Goal Leader(s) Director Office of Information Technology
PERFORMANCE GOAL 421 Ensure SECrsquos systems and applications are available
Description The SEC aims to enhance its computing infrastructure to eliminate down time if systems at one site fail among other objectives This metric will capture the percentage of systems and applications that can fail over within 8 hours
FY 2013 FY 2013 FY 2014 FY 2015 Fiscal Year FY 2008 FY 2009 FY 2010 FY 2011 FY 2012 Plan Actual Estimate Request
Percentage of servers virtualized NA 12 22 38 79 85 93 94 95
Percentage fail over within 8 hours NA NA NA NA NA NA NA 100 100
Responsible DivisionOffice Office of Information Technology
Data Source OIT Network Operations Center (NOC) ndash automated network monitoring tools
43
FY 2015 CBJ FY 2015 APP AND FY 2013 APR bull FY 2015 ANNUAL PERFORMANCE PLAN
PERFORMANCE GOAL 422 Equip the SEC with an enhanced technology infrastructure to support enterprise infrastructure
Description The SEC aims to promote collaboration and information sharing across the enterprise To improve efficiency and knowledge management the SEC will consolidate and centralize its collaborative technologies to a commonly used enterprise set by 2020 This metric will measure the percentage of the SECrsquos offices and divisions that utilize centralized enterprise collaboration solutions
FY 2013 FY 2013 FY 2014 FY 2015 Fiscal Year FY 2008 FY 2009 FY 2010 FY 2011 FY 2012 Plan Actual Estimate Request
Number of enterprise solutions Prior-year data not 10 20 25 30 30 35 40
available
Responsible DivisionOffice Office of Information Technology
Data Source Approved software applications list
PERFORMANCE GOAL 423 Expand the SECrsquos video teleconferencing (VTC) capabilities to support an increasingly geographically dispersed workforce
Description The SEC seeks to develop a state of the art video teleconference solution that allows users to conduct a videoteleconference meeting between HQ regional offices and multiple endpoints simultaneously collaborate and share presentation materials and use VoIP technology to host video teleconferences from their officesworkspaces with other SEC users or conference rooms This metric will measure the average ldquouptimerdquo or availability of all VTC systems
FY 2013 FY 2013 FY 2014 FY 2015 Fiscal Year FY 2008 FY 2009 FY 2010 FY 2011 FY 2012 Plan Actual Estimate Request
Availability rate for VTC solutions Prior-year data not available 75 80 9999 9999
Responsible DivisionOffice Office of Information Technology
Data Source Telecommunications monitoring system
PERFORMANCE GOAL 424 Pursue continuous technology cost reductions and efficiencies
Description Recent technology enhancements ndash eg data center consolidation virtualization and maintenance contract reductions ndash are producing technical efficiencies and cost savings This metric will measure the amount of these costs savings
FY 2013 FY 2013 FY 2014 FY 2015 Fiscal Year FY 2008 FY 2009 FY 2010 FY 2011 FY 2012 Plan Actual Estimate Request
Percent reduction in operational run 1-3 187 1 2 cost leveraging technology and cost cost reduction reduction process efficiencies
Prior-year data not available reduction in steady
reduction in steady
in run costs
in run costs
state run state run costs costs1
Responsible DivisionOffice Office of Information Technology
Data Source OIT Network Operations Center (NOC)
The higher than expected FY 2013 actual of 187 percent is due to one-time technologies enhancements resulting from the data consolidation and virtualization 1
44
FY 2015 ANNUAL PERFORMANCE PLAN bull FY 2015 CBJ FY 2015 APP AND FY 2013 APR
PERFORMANCE GOAL 425 Enhance the SECrsquos enterprise data warehouse infrastructure and performance
Description The Enterprise Data Warehouse (EDW) infrastructure will enable the provisioning of data to Commission staff for search and analysis through a virtual data warehouse platform This metric will measure the availability of EDW and data sources
FY 2013 FY 2013 FY 2014 FY 2015 Fiscal Year FY 2008 FY 2009 FY 2010 FY 2011 FY 2012 Plan Actual Estimate Request
Availability rate for the EDW infrastructure components in Prior-year data not available NA NA 99 99 production
Responsible DivisionOffice Office of Information Technology
Data Source OIT Network Operations Center (NOC) ndash automated network monitoring tools
Strategic Objective 43 The SEC maximizes the use of agency resources by continually improving agency operations and bolstering internal controls
Goal Leader(s) Chief Financial Officer Chief Operations Officer
PERFORMANCE GOAL 431 Financial audit results
Description Under the Accountability of Taxpayer Dollars Act of 2002 the agency is required to meet all proprietary and budgetary accounting guidelines for federal agencies and to undergo annual audits The SECrsquos audits are conducted by the Government Accountability Office
FY 2013 FY 2013 FY 2014 FY 2015 Fiscal Year FY 2008 FY 2009 FY 2010 FY 2011 FY 2012 Plan Actual Estimate Request
Unqualified opinion Yes Yes Yes Yes Yes Yes Yes Yes Yes
Material weaknesses 0 1 2 0 0 0 0 0 0
Significant deficiency 3 6 0 4 2 0 1 0 0
Responsible DivisionOffice Office of Financial Management
Data Source GAO SEC Financial Audit Report
PERFORMANCE GOAL 432 Assurance statement on internal control over operations
Description In accordance with OMB A-123 and Section 961 of the Dodd-Frank Act the SEC conducts an annual assessment of the effectiveness of internal controls The SEC will continue to develop its Operational Risk program and enhance cross-organizational processes to support all division and office management assurance statements Success is measured by the quality of risk and control assessments and management self-identification and resolution of improvement opportunities
FY 2013 FY 2013 FY 2014 FY 2015 Fiscal Year FY 2008 FY 2009 FY 2010 FY 2011 FY 2012 Plan Actual Estimate Request
Unqualified opinion Yes Yes Yes Yes Yes Yes Yes Yes Yes
Material weakness 0 0 0 0 0 0 0 0 0
Responsible DivisionOffice Office of the Chief Operating Officer
Data Source SEC Financial Audit Report
45
FY 2015 CBJ FY 2015 APP AND FY 2013 APR bull FY 2015 ANNUAL PERFORMANCE PLAN
1
PERFORMANCE GOAL 433 Timely completion of corrective action on Office of Inspector General (OIG) and the GAO audit recommendations1
Description Timely completion of audit recommendations is an important SEC priority This metric measures how well the Commission is doing in completing corrective action on OIG audit recommendations within established timeframes
FY 2013 FY 2013 FY 2014 FY 2015 Fiscal Year FY 2008 FY 2009 FY 2010 FY 2011 FY 2012 Plan Actual Estimate Request
OIG recommendations completed in Prior-year data not available NA 78 80 80
less than one year
Responsible DivisionOffice Office of the Chief Operating Officer
Data Source Audit Recommendation Tracking System
This measure was developed as part of the FY 2014-2018 SEC strategic planning process Currently there is no methodology in place to capture data for tracking all GAO Audit recommendations OCOO will determine a timeframe for establishing a methodology during FY 2014
46
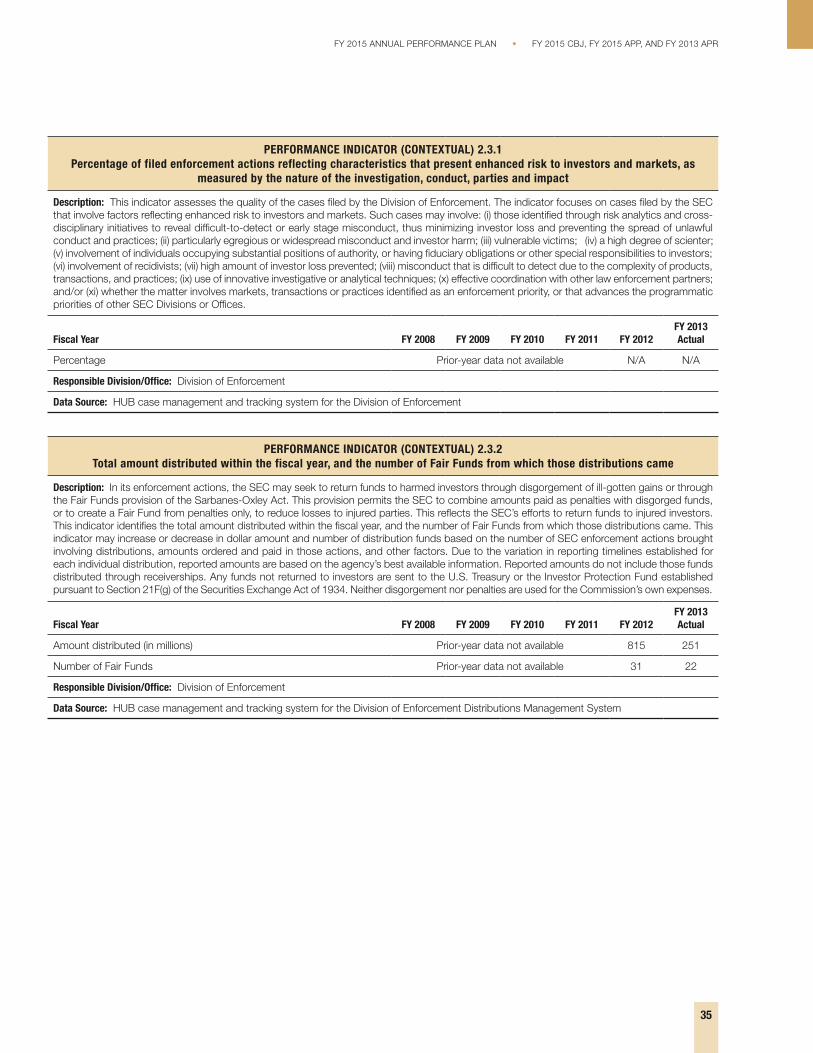
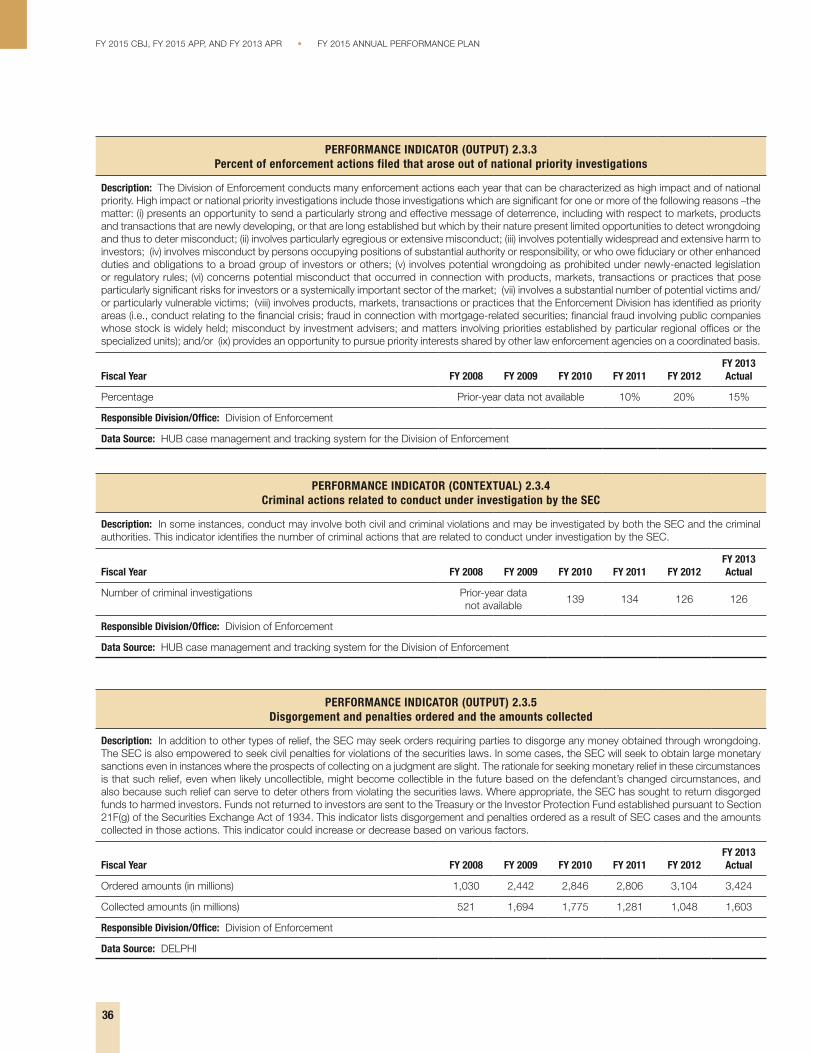
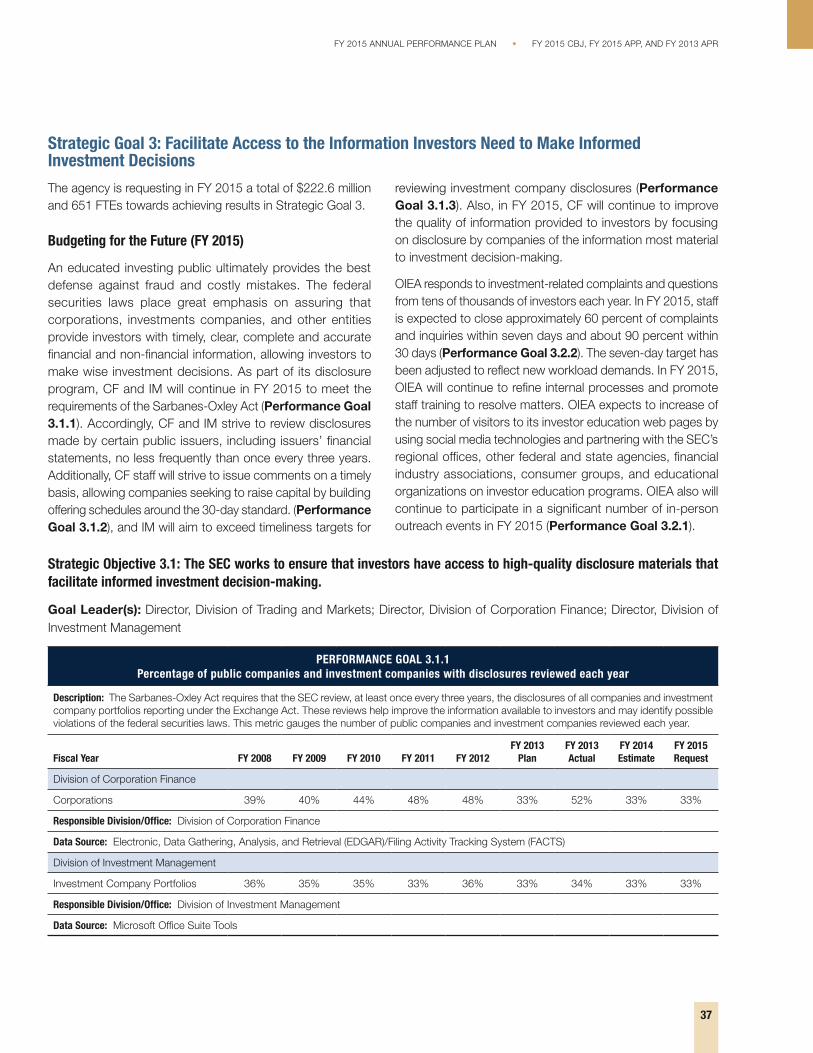
FY 2015 ANNUAL PERFORMANCE PLAN bull FY 2015 CBJ FY 2015 APP AND FY 2013 APR
Strategic Goal 3 Facilitate Access to the Information Investors Need to Make Informed Investment Decisions
The agency is requesting in FY 2015 a total of $2226 million and 651 FTEs towards achieving results in Strategic Goal 3
Budgeting for the Future (FY 2015)
An educated investing public ultimately provides the best defense against fraud and costly mistakes The federal securities laws place great emphasis on assuring that corporations investments companies and other entities provide investors with timely clear complete and accurate financial and non-financial information allowing investors to make wise investment decisions As part of its disclosure program CF and IM will continue in FY 2015 to meet the requirements of the Sarbanes-Oxley Act (Performance Goal 311) Accordingly CF and IM strive to review disclosures made by certain public issuers including issuersrsquo financial statements no less frequently than once every three years Additionally CF staff will strive to issue comments on a timely basis allowing companies seeking to raise capital by building offering schedules around the 30-day standard (Performance Goal 312) and IM will aim to exceed timeliness targets for
reviewing investment company disclosures (Performance Goal 313) Also in FY 2015 CF will continue to improve the quality of information provided to investors by focusing on disclosure by companies of the information most material to investment decision-making
OIEA responds to investment-related complaints and questions from tens of thousands of investors each year In FY 2015 staff is expected to close approximately 60 percent of complaints and inquiries within seven days and about 90 percent within 30 days (Performance Goal 322) The seven-day target has been adjusted to reflect new workload demands In FY 2015 OIEA will continue to refine internal processes and promote staff training to resolve matters OIEA expects to increase of the number of visitors to its investor education web pages by using social media technologies and partnering with the SECrsquos regional offices other federal and state agencies financial industry associations consumer groups and educational organizations on investor education programs OIEA also will continue to participate in a significant number of in-person outreach events in FY 2015 (Performance Goal 321)
Strategic Objective 31 The SEC works to ensure that investors have access to high-quality disclosure materials that facilitate informed investment decision-making
Goal Leader(s) Director Division of Trading and Markets Director Division of Corporation Finance Director Division of Investment Management
PERFORMANCE GOAL 311 Percentage of public companies and investment companies with disclosures reviewed each year
Description The Sarbanes-Oxley Act requires that the SEC review at least once every three years the disclosures of all companies and investment company portfolios reporting under the Exchange Act These reviews help improve the information available to investors and may identify possible violations of the federal securities laws This metric gauges the number of public companies and investment companies reviewed each year
FY 2013 FY 2013 FY 2014 FY 2015 Fiscal Year FY 2008 FY 2009 FY 2010 FY 2011 FY 2012 Plan Actual Estimate Request
Division of Corporation Finance
Corporations 39 40 44 48 48 33 52 33 33
Responsible DivisionOffice Division of Corporation Finance
Data Source Electronic Data Gathering Analysis and Retrieval (EDGAR)Filing Activity Tracking System (FACTS)
Division of Investment Management
Investment Company Portfolios 36 35 35 33 36 33 34 33 33
Responsible DivisionOffice Division of Investment Management
Data Source Microsoft Office Suite Tools
37
FY 2015 CBJ FY 2015 APP AND FY 2013 APR bull FY 2015 ANNUAL PERFORMANCE PLAN
PERFORMANCE GOAL 312 Time to issue initial comments on Securities Act filings
Description The target of 30 days or less has become a de facto industry standard for the maximum time to receive initial comments
FY 2013 FY 2013 FY 2014 FY 2015 Fiscal Year FY 2008 FY 2009 FY 2010 FY 2011 FY 2012 Plan Actual Estimate Request
Days 252 253 241 244 249 lt30 256 lt30 lt30 days days days days days days days days days
Responsible DivisionOffice Division of Corporation Finance
Data Source FACTS
PERFORMANCE GOAL 313 Percentage of investment company disclosure reviews for which initial comments are completed within timeliness goals
Description For initial registration statements the SECrsquos goal is to issue initial comments within 30 days after they are filed (60 days for registration statements of insurance product separate accounts and related mutual funds) The SEC also aims to comment on post-effective amendments within 45 days and preliminary proxy statements within 10 days after they are filed
FY 2013 FY 2013 FY 2014 FY 2015 Fiscal Year FY 2008 FY 2009 FY 2010 FY 2011 FY 2012 Plan Actual Estimate Request
Initial registration statements 95 95 93 92 96 85 98 85 85
Post-effective amendments 97 97 94 94 95 90 99 90 90
Preliminary proxy statements 99 99 99 98 100 99 98 99 99
Responsible DivisionOffice Division of Investment Management
Data Source Electronic Data Gathering Analysis and Retrieval (EDGAR)
PERFORMANCE INDICATOR (CONTEXTUAL) 311 Total digital audience including website social media and mobile media
Description Digital media has become the dominant channel for investors seeking to access information These statistics will help evaluate the extent to which investors are turning to the SEC identify the channels they use and quantify the amount of information they receive
FY 2013 Fiscal Year FY 2008 FY 2009 FY 2010 FY 2011 FY 2012 Actual
SECgov page views Prior-year data not available 372B
Social media followers 0 1608 83141 193837 236700 258733
Total emailmobile subscriptions Prior-year data not available 519602 631839 740318
Total email bulletins sent NA 875518 1280M 2397M 3344M 4085M
Total mobile bulletins sent NA 6001 62324 107848 150303 238815
Responsible DivisionOffice Office of Public Affairs
Data Source Akamai Technologies Google Analytics GovDelivery Hootsuite Social Media Channels
38
rsquo
FY 2015 ANNUAL PERFORMANCE PLAN bull FY 2015 CBJ FY 2015 APP AND FY 2013 APR
Strategic Objective 32 The SEC works to understand investor needs and educate investors so they are better prepared to make informed investment decisions
Goal Leader(s) Director Office of Investor Education and Advocacy
PERFORMANCE GOAL 321 Number of page views of online investor education content and number of in-person events
including those with specifically targeted communities and organizations
Description The Office of Investor Education and Advocacy (OIEA) initiates investor education campaigns on key strategies for making informed investment decisions including publicizing online resources for researching investment professionals and investments understanding fees and identifying fraud OIEA staff also participates in in-person events for investors generally and those targeted to specific investors such as seniors service members and other affinity groups This metric tracks page views of SEC online investor education materials and the number of investor events in which OIEA staff participated
FY 2013 FY 2013 FY 2014 FY 2015 Fiscal Year FY 2008 FY 2009 FY 2010 FY 2011 FY 2012 Plan Actual Estimate Request
Number of page views Prior-year data not available 15 121 15 20
Number of ldquoin-personrdquo events Prior-year data not available 50 52 50 50
Responsible DivisionOffice Office of Investor Education and Advocacy
Data Source Microsoft Office Suite Tools
PERFORMANCE GOAL 322 Timeliness of responses to investor contacts
Description OIEA serves the tens of thousands of investors each year who contact the SEC with investment-related complaints and questions The staff aims to close out as many new investor assistance matters as possible within seven and thirty business days
FY 2013 FY 2013 FY 2014 FY 2015 Fiscal Year FY 2008 FY 2009 FY 2010 FY 2011 FY 2012 Plan Actual Estimate Request
Closed within 7 days 78 70 72 67 54 50 62 60 60
Closed within 30 days 88 90 93 92 93 90 93 90 90
Responsible DivisionOffice Office of Investor Education and Advocacy
Data Source Internal log using IRIS data
PERFORMANCE GOAL 323 Customer satisfaction rating of OIEA s online investor education resources
Description This metric gauges the effectiveness helpfulness and usability of OIEArsquos online investor education resources
FY 2013 FY 2013 FY 2014 FY 2015 Fiscal Year FY 2008 FY 2009 FY 2010 FY 2011 FY 2012 Plan Actual Estimate Request
Satisfaction index Benchmark Benchmark score for score for
Prior-year data not available NA 81 federal federal government government
websites websites
Responsible DivisionOffice Office of Investor Education and Advocacy
Data Source ForeSee results online portal
39
FY 2015 CBJ FY 2015 APP AND FY 2013 APR bull FY 2015 ANNUAL PERFORMANCE PLAN
PERFORMANCE GOAL 324 Number of new investor education materials designed specifically to help investors protect themselves from fraud
Description Through OIEA and often in conjunction with other organizations the staff issues Investor Alerts and other forms of educational material that inform investors about different permutations of fraud new investment products and other topical issues This metric measures the number of new investor education materials issued by OIEA
FY 2013 FY 2013 FY 2014 FY 2015 Fiscal Year FY 2008 FY 2009 FY 2010 FY 2011 FY 2012 Plan Actual Estimate Request
Number of education materials Prior-year data 16 24 24 26 26 26
not available
Responsible DivisionOffice Office of Investor Education and Advocacy
Data Source wwwsecgov and wwwinvestorgov
PERFORMANCE INDICATOR (PROCESS) 321 Number of investor testing research projects
Description This indicator tracks the number of research initiatives used to gather feedback from investors on the usefulness of disclosures and other input on SEC rulemaking
FY 2013 Fiscal Year FY 2008 FY 2009 FY 2010 FY 2011 FY 2012 Actual
Number of projects 1 0 0 2 2
Responsible DivisionOffice Office of Investor Education and Advocacy
Data Source Microsoft Office Suite Tools
PERFORMANCE INDICATOR (PROCESS) 322 Number of sets of recommendations prepared by the investor advisor y committee
Description This indicator tracks the recommendations from the Investor Advisory Committee regarding investorsrsquo perspectives and priorities
FY 2013 Fiscal Year FY 2008 FY 2009 FY 2010 FY 2011 FY 2012 Actual
Number of sets of recommendations Prior-year data not available 0 4
Responsible DivisionOffice Office of Investor Education and Advocacy
Data Source wwwsecgov
26
0
40
Strategic Goal 4 Enhance the Commissionrsquos Performance through Effective Alignment and Management of Human Information and Financial Capital During FY 2015 the agency will continue to focus on recruiting and retaining high-performing staff and updating the expertise of SEC employees so they are abreast of the latest developments in the securities markets Furthermore the SEC will continue to strengthen internal controls The agency is requesting a total of $3599 million and 867 FTEs in FY 2015 to achieve results in Strategic Goal 4
Budgeting for the Future (FY 2015)
The investing public and the securities markets are best served by an efficient effective and agile SEC In FY 2015 the agency will continue to take steps to become a more effective regulator of the US financial markets by making sound investments in human capital and new technologies and enhancing internal controls
The planned investment in the SEC University for FY 2015 principally supports training and development for employees directly involved in examinations investigations fraud detection litigation and other core mission responsibilities of the agency The SEC University will provide specialized in-depth training concerning changing market conditions analytics and forensics and the agencyrsquos new responsibility areas The investment also will fund employees for certain specialized financial certifications and regulatory credentials as well as the advanced continuing education required for maintaining legal and financial credentials
To maintain mission effectiveness it is essential that attrition in the leadership ranks is quickly addressed by having a highly qualified and diverse pool of candidates ready to assume those
critical roles (Performance Goal 415) The Office of Human Resourcesrsquo (OHR) Workforce Planning has completed building the foundational database necessary to conduct succession planning A subset of this team has begun benchmarking succession planning approaches used by other Federal agencies and will develop and implement a program at the SEC by the end of FY 2014 The first measure is expected by September 30 2014
Leveraging modern reliable and innovative technologies together with predictive analytics will transform the way the SEC performs its mission and provide a proactive view into how technology impacts capital markets The SEC will derive significant and measurable performance improvements in core operations and increase value for users through the use of automated enterprise processes
The continuing implementation of OITrsquos Technology Transformation Plan (ldquoWorking Smarterrdquo) in FY 2015 will support vital technology initiatives It will ensure the SECrsquos business processes are streamlined integrated and implemented using the best technology available
While the SEC has made significant strides in its multi-year path towards a strong sustainable internal control posture the agency will continue to dedicate its energies towards remediating the significant deficiency in information security During FY 2015 OFM will work closely with the Department of Transportationrsquos Federal Shared Services Provider (FSSP) to implement its software upgrade and refine the new Federal government-wide travel management system
41
FY 2015 ANNUAL PERFORMANCE PLAN bull FY 2015 CBJ FY 2015 APP AND FY 2013 APR
FY 2015 CBJ FY 2015 APP AND FY 2013 APR bull FY 2015 ANNUAL PERFORMANCE PLAN
Strategic Objective 41 The SEC promotes a results-oriented work environment that attracts engages and retains a technically proficient and diverse workforce including leaders who provide motivation and strategic direction
Goal Leader(s) Director Office of Human Resources Director Office of Minority and Women Inclusion
PERFORMANCE GOAL 411 Turnover
Description When employee morale and engagement are high high-performing employees tend to remain in the organization Although turnover can fluctuate based on a variety of factors the SEC aims to keep its turnover rate relatively low below 8 per year
FY 2013 FY 2013 FY 2014 FY 2015 Fiscal Year FY 2008 FY 2009 FY 2010 FY 2011 FY 2012 Plan Actual Estimate Request
Percent turnover 62 37 5 64 658 lt8 658 lt8 lt8
Responsible DivisionOffice Office of Human Resources
Data Source The National Business Center at Department of Interior (DOI)
PERFORMANCE GOAL 412 Expanding staff expertise
Description Internal training and hiring programs are designed to help the agency recruit and develop a diverse and qualified staff with the key skills industry knowledge and expertise to support the SEC mission In particular there is a need to train examiners attorneys economists and other experts for subject matter expertise relevant to the marketplace and investment and trading practices This metric tracks whether certain areas requiring significant training are being addressed The agency will track the number of SEC staff participants in mission-focused training and development programs and will report on specific items through the use of post-course evaluations to assess the impact and results of this training on a five-point scale
FY 2013 FY 2013 FY 2014 FY 2015 Fiscal Year FY 2008 FY 2009 FY 2010 FY 2011 FY 2012 Plan Actual Estimate Request
Mission-focused training attendance Prior year data not available NA NA 12000 12120
Post-course evaluations of mission-Prior year data not available NA NA 45 45
focused training
Responsible DivisionOffice Office of Human Resources
Data Source Course Attendance Identified in LEAP (Instructor-led courses only) and End of Course Evaluation Report Summary provided by Metrics that Matter
PERFORMANCE GOAL 413 Number of diversity-related partnershipsalliances
Description Increased numbers of diversity-related partnerships or alliances with professional associations and educational organizations provide opportunities to educate students about the SECrsquos work and to recruit career professionals from all segments of society The SEC will track the number of partnerships andor alliances with diverse professional associations and educational organizations
FY 2013 FY 2013 FY 2014 FY 2015 Fiscal Year FY 2008 FY 2009 FY 2010 FY 2011 FY 2012 Plan Actual Estimate Request
Number of partnershipsalliances Prior-year data 2 10 12 15 13 15
not available
Responsible DivisionOffice Office of Minority Women and Inclusion
Data Source Office of Minority Women and Inclusion Internal Records and Section 342 of DFA
15
42
FY 2015 ANNUAL PERFORMANCE PLAN bull FY 2015 CBJ FY 2015 APP AND FY 2013 APR
PERFORMANCE GOAL 414 Sur vey rankings
Description Annual and other rankings together with other metrics and indicators of federal government agencies will be used as one kind of metric to determine the SECrsquos overall success in improving employee morale and employee engagement
FY 2013 FY 2013 FY 2014 FY 2015 Fiscal Year FY 2008 FY 2009 FY 2010 FY 2011 FY 2012 Plan Actual Estimate Request
Best Places to Work ranking Ranked Ranked Ranked Ranked Ranked Ranked Ranked Ranked Ranked 3 11 24 27 19 20 15 5 5
Average of employee engagement Prior-year data not available NA 61 75 75
and global satisfaction index
Responsible DivisionOffice Office of Human Resources
Data Source Annual Partnership for Public Service calculated ranking based on Annual Employee Viewpoint Survey (EVS) administered by OPM and Average of Employee Engagement and Global Satisfaction Index from OPM Employee Viewpoint Survey (EVS)
PERFORMANCE GOAL 415 Bench strength
Description To maintain mission effectiveness it is essential that attrition in the leadership ranks is quickly addressed by having a highly qualified and diverse pool of candidates ready to assume those critical roles Success is measured by the percentage of key leadership positions for which the SEC has identified a pool of qualified candidates
FY 2013 FY 2013 FY 2014 FY 2015 Fiscal Year FY 2008 FY 2009 FY 2010 FY 2011 FY 2012 Plan Actual Estimate Request
Data point under development NA NA NA NA NA NA NA TBD TBD
Responsible DivisionOffice Office of Human Resources
Data Source TBD
Strategic Objective 42 The SEC encourages a collaborative environment across divisions and offices and leverages technology and data to fulfill its mission more effectively and efficiently
Goal Leader(s) Director Office of Information Technology
PERFORMANCE GOAL 421 Ensure SECrsquos systems and applications are available
Description The SEC aims to enhance its computing infrastructure to eliminate down time if systems at one site fail among other objectives This metric will capture the percentage of systems and applications that can fail over within 8 hours
FY 2013 FY 2013 FY 2014 FY 2015 Fiscal Year FY 2008 FY 2009 FY 2010 FY 2011 FY 2012 Plan Actual Estimate Request
Percentage of servers virtualized NA 12 22 38 79 85 93 94 95
Percentage fail over within 8 hours NA NA NA NA NA NA NA 100 100
Responsible DivisionOffice Office of Information Technology
Data Source OIT Network Operations Center (NOC) ndash automated network monitoring tools
43
FY 2015 CBJ FY 2015 APP AND FY 2013 APR bull FY 2015 ANNUAL PERFORMANCE PLAN
PERFORMANCE GOAL 422 Equip the SEC with an enhanced technology infrastructure to support enterprise infrastructure
Description The SEC aims to promote collaboration and information sharing across the enterprise To improve efficiency and knowledge management the SEC will consolidate and centralize its collaborative technologies to a commonly used enterprise set by 2020 This metric will measure the percentage of the SECrsquos offices and divisions that utilize centralized enterprise collaboration solutions
FY 2013 FY 2013 FY 2014 FY 2015 Fiscal Year FY 2008 FY 2009 FY 2010 FY 2011 FY 2012 Plan Actual Estimate Request
Number of enterprise solutions Prior-year data not 10 20 25 30 30 35 40
available
Responsible DivisionOffice Office of Information Technology
Data Source Approved software applications list
PERFORMANCE GOAL 423 Expand the SECrsquos video teleconferencing (VTC) capabilities to support an increasingly geographically dispersed workforce
Description The SEC seeks to develop a state of the art video teleconference solution that allows users to conduct a videoteleconference meeting between HQ regional offices and multiple endpoints simultaneously collaborate and share presentation materials and use VoIP technology to host video teleconferences from their officesworkspaces with other SEC users or conference rooms This metric will measure the average ldquouptimerdquo or availability of all VTC systems
FY 2013 FY 2013 FY 2014 FY 2015 Fiscal Year FY 2008 FY 2009 FY 2010 FY 2011 FY 2012 Plan Actual Estimate Request
Availability rate for VTC solutions Prior-year data not available 75 80 9999 9999
Responsible DivisionOffice Office of Information Technology
Data Source Telecommunications monitoring system
PERFORMANCE GOAL 424 Pursue continuous technology cost reductions and efficiencies
Description Recent technology enhancements ndash eg data center consolidation virtualization and maintenance contract reductions ndash are producing technical efficiencies and cost savings This metric will measure the amount of these costs savings
FY 2013 FY 2013 FY 2014 FY 2015 Fiscal Year FY 2008 FY 2009 FY 2010 FY 2011 FY 2012 Plan Actual Estimate Request
Percent reduction in operational run 1-3 187 1 2 cost leveraging technology and cost cost reduction reduction process efficiencies
Prior-year data not available reduction in steady
reduction in steady
in run costs
in run costs
state run state run costs costs1
Responsible DivisionOffice Office of Information Technology
Data Source OIT Network Operations Center (NOC)
The higher than expected FY 2013 actual of 187 percent is due to one-time technologies enhancements resulting from the data consolidation and virtualization 1
44
FY 2015 ANNUAL PERFORMANCE PLAN bull FY 2015 CBJ FY 2015 APP AND FY 2013 APR
PERFORMANCE GOAL 425 Enhance the SECrsquos enterprise data warehouse infrastructure and performance
Description The Enterprise Data Warehouse (EDW) infrastructure will enable the provisioning of data to Commission staff for search and analysis through a virtual data warehouse platform This metric will measure the availability of EDW and data sources
FY 2013 FY 2013 FY 2014 FY 2015 Fiscal Year FY 2008 FY 2009 FY 2010 FY 2011 FY 2012 Plan Actual Estimate Request
Availability rate for the EDW infrastructure components in Prior-year data not available NA NA 99 99 production
Responsible DivisionOffice Office of Information Technology
Data Source OIT Network Operations Center (NOC) ndash automated network monitoring tools
Strategic Objective 43 The SEC maximizes the use of agency resources by continually improving agency operations and bolstering internal controls
Goal Leader(s) Chief Financial Officer Chief Operations Officer
PERFORMANCE GOAL 431 Financial audit results
Description Under the Accountability of Taxpayer Dollars Act of 2002 the agency is required to meet all proprietary and budgetary accounting guidelines for federal agencies and to undergo annual audits The SECrsquos audits are conducted by the Government Accountability Office
FY 2013 FY 2013 FY 2014 FY 2015 Fiscal Year FY 2008 FY 2009 FY 2010 FY 2011 FY 2012 Plan Actual Estimate Request
Unqualified opinion Yes Yes Yes Yes Yes Yes Yes Yes Yes
Material weaknesses 0 1 2 0 0 0 0 0 0
Significant deficiency 3 6 0 4 2 0 1 0 0
Responsible DivisionOffice Office of Financial Management
Data Source GAO SEC Financial Audit Report
PERFORMANCE GOAL 432 Assurance statement on internal control over operations
Description In accordance with OMB A-123 and Section 961 of the Dodd-Frank Act the SEC conducts an annual assessment of the effectiveness of internal controls The SEC will continue to develop its Operational Risk program and enhance cross-organizational processes to support all division and office management assurance statements Success is measured by the quality of risk and control assessments and management self-identification and resolution of improvement opportunities
FY 2013 FY 2013 FY 2014 FY 2015 Fiscal Year FY 2008 FY 2009 FY 2010 FY 2011 FY 2012 Plan Actual Estimate Request
Unqualified opinion Yes Yes Yes Yes Yes Yes Yes Yes Yes
Material weakness 0 0 0 0 0 0 0 0 0
Responsible DivisionOffice Office of the Chief Operating Officer
Data Source SEC Financial Audit Report
45
FY 2015 CBJ FY 2015 APP AND FY 2013 APR bull FY 2015 ANNUAL PERFORMANCE PLAN
1
PERFORMANCE GOAL 433 Timely completion of corrective action on Office of Inspector General (OIG) and the GAO audit recommendations1
Description Timely completion of audit recommendations is an important SEC priority This metric measures how well the Commission is doing in completing corrective action on OIG audit recommendations within established timeframes
FY 2013 FY 2013 FY 2014 FY 2015 Fiscal Year FY 2008 FY 2009 FY 2010 FY 2011 FY 2012 Plan Actual Estimate Request
OIG recommendations completed in Prior-year data not available NA 78 80 80
less than one year
Responsible DivisionOffice Office of the Chief Operating Officer
Data Source Audit Recommendation Tracking System
This measure was developed as part of the FY 2014-2018 SEC strategic planning process Currently there is no methodology in place to capture data for tracking all GAO Audit recommendations OCOO will determine a timeframe for establishing a methodology during FY 2014
46
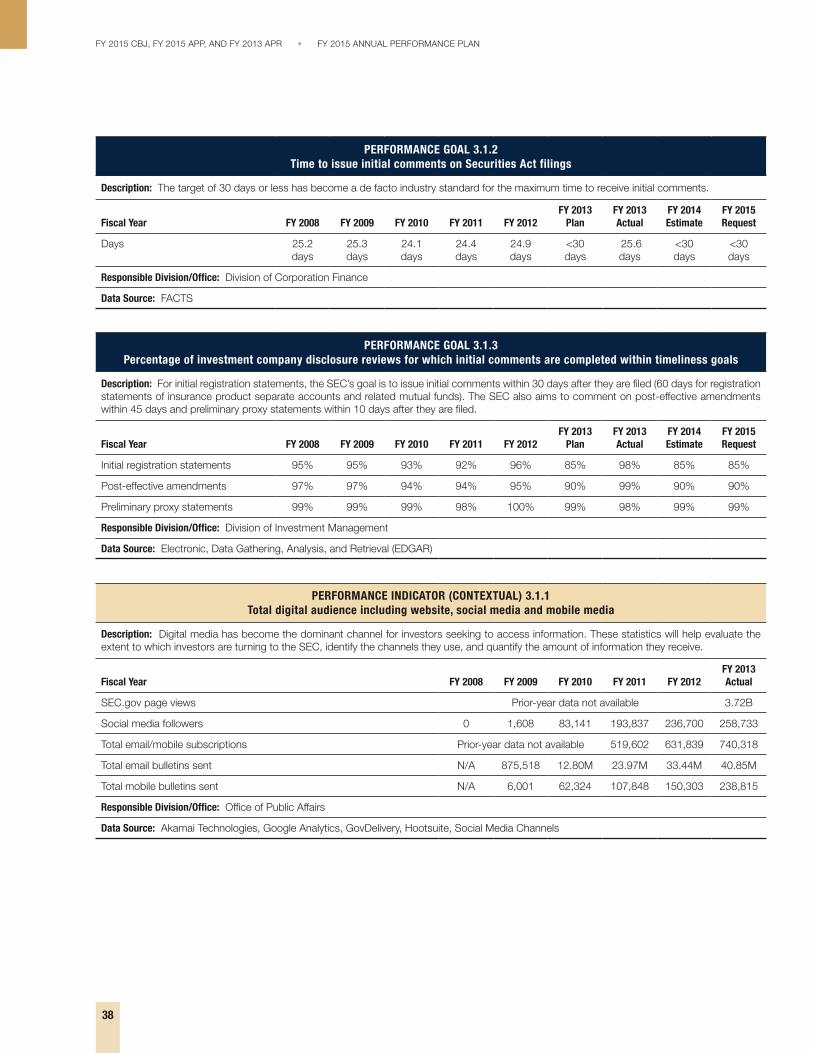
FY 2015 CBJ FY 2015 APP AND FY 2013 APR bull FY 2015 ANNUAL PERFORMANCE PLAN
PERFORMANCE GOAL 312 Time to issue initial comments on Securities Act filings
Description The target of 30 days or less has become a de facto industry standard for the maximum time to receive initial comments
FY 2013 FY 2013 FY 2014 FY 2015 Fiscal Year FY 2008 FY 2009 FY 2010 FY 2011 FY 2012 Plan Actual Estimate Request
Days 252 253 241 244 249 lt30 256 lt30 lt30 days days days days days days days days days
Responsible DivisionOffice Division of Corporation Finance
Data Source FACTS
PERFORMANCE GOAL 313 Percentage of investment company disclosure reviews for which initial comments are completed within timeliness goals
Description For initial registration statements the SECrsquos goal is to issue initial comments within 30 days after they are filed (60 days for registration statements of insurance product separate accounts and related mutual funds) The SEC also aims to comment on post-effective amendments within 45 days and preliminary proxy statements within 10 days after they are filed
FY 2013 FY 2013 FY 2014 FY 2015 Fiscal Year FY 2008 FY 2009 FY 2010 FY 2011 FY 2012 Plan Actual Estimate Request
Initial registration statements 95 95 93 92 96 85 98 85 85
Post-effective amendments 97 97 94 94 95 90 99 90 90
Preliminary proxy statements 99 99 99 98 100 99 98 99 99
Responsible DivisionOffice Division of Investment Management
Data Source Electronic Data Gathering Analysis and Retrieval (EDGAR)
PERFORMANCE INDICATOR (CONTEXTUAL) 311 Total digital audience including website social media and mobile media
Description Digital media has become the dominant channel for investors seeking to access information These statistics will help evaluate the extent to which investors are turning to the SEC identify the channels they use and quantify the amount of information they receive
FY 2013 Fiscal Year FY 2008 FY 2009 FY 2010 FY 2011 FY 2012 Actual
SECgov page views Prior-year data not available 372B
Social media followers 0 1608 83141 193837 236700 258733
Total emailmobile subscriptions Prior-year data not available 519602 631839 740318
Total email bulletins sent NA 875518 1280M 2397M 3344M 4085M
Total mobile bulletins sent NA 6001 62324 107848 150303 238815
Responsible DivisionOffice Office of Public Affairs
Data Source Akamai Technologies Google Analytics GovDelivery Hootsuite Social Media Channels
38
rsquo
FY 2015 ANNUAL PERFORMANCE PLAN bull FY 2015 CBJ FY 2015 APP AND FY 2013 APR
Strategic Objective 32 The SEC works to understand investor needs and educate investors so they are better prepared to make informed investment decisions
Goal Leader(s) Director Office of Investor Education and Advocacy
PERFORMANCE GOAL 321 Number of page views of online investor education content and number of in-person events
including those with specifically targeted communities and organizations
Description The Office of Investor Education and Advocacy (OIEA) initiates investor education campaigns on key strategies for making informed investment decisions including publicizing online resources for researching investment professionals and investments understanding fees and identifying fraud OIEA staff also participates in in-person events for investors generally and those targeted to specific investors such as seniors service members and other affinity groups This metric tracks page views of SEC online investor education materials and the number of investor events in which OIEA staff participated
FY 2013 FY 2013 FY 2014 FY 2015 Fiscal Year FY 2008 FY 2009 FY 2010 FY 2011 FY 2012 Plan Actual Estimate Request
Number of page views Prior-year data not available 15 121 15 20
Number of ldquoin-personrdquo events Prior-year data not available 50 52 50 50
Responsible DivisionOffice Office of Investor Education and Advocacy
Data Source Microsoft Office Suite Tools
PERFORMANCE GOAL 322 Timeliness of responses to investor contacts
Description OIEA serves the tens of thousands of investors each year who contact the SEC with investment-related complaints and questions The staff aims to close out as many new investor assistance matters as possible within seven and thirty business days
FY 2013 FY 2013 FY 2014 FY 2015 Fiscal Year FY 2008 FY 2009 FY 2010 FY 2011 FY 2012 Plan Actual Estimate Request
Closed within 7 days 78 70 72 67 54 50 62 60 60
Closed within 30 days 88 90 93 92 93 90 93 90 90
Responsible DivisionOffice Office of Investor Education and Advocacy
Data Source Internal log using IRIS data
PERFORMANCE GOAL 323 Customer satisfaction rating of OIEA s online investor education resources
Description This metric gauges the effectiveness helpfulness and usability of OIEArsquos online investor education resources
FY 2013 FY 2013 FY 2014 FY 2015 Fiscal Year FY 2008 FY 2009 FY 2010 FY 2011 FY 2012 Plan Actual Estimate Request
Satisfaction index Benchmark Benchmark score for score for
Prior-year data not available NA 81 federal federal government government
websites websites
Responsible DivisionOffice Office of Investor Education and Advocacy
Data Source ForeSee results online portal
39
FY 2015 CBJ FY 2015 APP AND FY 2013 APR bull FY 2015 ANNUAL PERFORMANCE PLAN
PERFORMANCE GOAL 324 Number of new investor education materials designed specifically to help investors protect themselves from fraud
Description Through OIEA and often in conjunction with other organizations the staff issues Investor Alerts and other forms of educational material that inform investors about different permutations of fraud new investment products and other topical issues This metric measures the number of new investor education materials issued by OIEA
FY 2013 FY 2013 FY 2014 FY 2015 Fiscal Year FY 2008 FY 2009 FY 2010 FY 2011 FY 2012 Plan Actual Estimate Request
Number of education materials Prior-year data 16 24 24 26 26 26
not available
Responsible DivisionOffice Office of Investor Education and Advocacy
Data Source wwwsecgov and wwwinvestorgov
PERFORMANCE INDICATOR (PROCESS) 321 Number of investor testing research projects
Description This indicator tracks the number of research initiatives used to gather feedback from investors on the usefulness of disclosures and other input on SEC rulemaking
FY 2013 Fiscal Year FY 2008 FY 2009 FY 2010 FY 2011 FY 2012 Actual
Number of projects 1 0 0 2 2
Responsible DivisionOffice Office of Investor Education and Advocacy
Data Source Microsoft Office Suite Tools
PERFORMANCE INDICATOR (PROCESS) 322 Number of sets of recommendations prepared by the investor advisor y committee
Description This indicator tracks the recommendations from the Investor Advisory Committee regarding investorsrsquo perspectives and priorities
FY 2013 Fiscal Year FY 2008 FY 2009 FY 2010 FY 2011 FY 2012 Actual
Number of sets of recommendations Prior-year data not available 0 4
Responsible DivisionOffice Office of Investor Education and Advocacy
Data Source wwwsecgov
26
0
40
Strategic Goal 4 Enhance the Commissionrsquos Performance through Effective Alignment and Management of Human Information and Financial Capital During FY 2015 the agency will continue to focus on recruiting and retaining high-performing staff and updating the expertise of SEC employees so they are abreast of the latest developments in the securities markets Furthermore the SEC will continue to strengthen internal controls The agency is requesting a total of $3599 million and 867 FTEs in FY 2015 to achieve results in Strategic Goal 4
Budgeting for the Future (FY 2015)
The investing public and the securities markets are best served by an efficient effective and agile SEC In FY 2015 the agency will continue to take steps to become a more effective regulator of the US financial markets by making sound investments in human capital and new technologies and enhancing internal controls
The planned investment in the SEC University for FY 2015 principally supports training and development for employees directly involved in examinations investigations fraud detection litigation and other core mission responsibilities of the agency The SEC University will provide specialized in-depth training concerning changing market conditions analytics and forensics and the agencyrsquos new responsibility areas The investment also will fund employees for certain specialized financial certifications and regulatory credentials as well as the advanced continuing education required for maintaining legal and financial credentials
To maintain mission effectiveness it is essential that attrition in the leadership ranks is quickly addressed by having a highly qualified and diverse pool of candidates ready to assume those
critical roles (Performance Goal 415) The Office of Human Resourcesrsquo (OHR) Workforce Planning has completed building the foundational database necessary to conduct succession planning A subset of this team has begun benchmarking succession planning approaches used by other Federal agencies and will develop and implement a program at the SEC by the end of FY 2014 The first measure is expected by September 30 2014
Leveraging modern reliable and innovative technologies together with predictive analytics will transform the way the SEC performs its mission and provide a proactive view into how technology impacts capital markets The SEC will derive significant and measurable performance improvements in core operations and increase value for users through the use of automated enterprise processes
The continuing implementation of OITrsquos Technology Transformation Plan (ldquoWorking Smarterrdquo) in FY 2015 will support vital technology initiatives It will ensure the SECrsquos business processes are streamlined integrated and implemented using the best technology available
While the SEC has made significant strides in its multi-year path towards a strong sustainable internal control posture the agency will continue to dedicate its energies towards remediating the significant deficiency in information security During FY 2015 OFM will work closely with the Department of Transportationrsquos Federal Shared Services Provider (FSSP) to implement its software upgrade and refine the new Federal government-wide travel management system
41
FY 2015 ANNUAL PERFORMANCE PLAN bull FY 2015 CBJ FY 2015 APP AND FY 2013 APR
FY 2015 CBJ FY 2015 APP AND FY 2013 APR bull FY 2015 ANNUAL PERFORMANCE PLAN
Strategic Objective 41 The SEC promotes a results-oriented work environment that attracts engages and retains a technically proficient and diverse workforce including leaders who provide motivation and strategic direction
Goal Leader(s) Director Office of Human Resources Director Office of Minority and Women Inclusion
PERFORMANCE GOAL 411 Turnover
Description When employee morale and engagement are high high-performing employees tend to remain in the organization Although turnover can fluctuate based on a variety of factors the SEC aims to keep its turnover rate relatively low below 8 per year
FY 2013 FY 2013 FY 2014 FY 2015 Fiscal Year FY 2008 FY 2009 FY 2010 FY 2011 FY 2012 Plan Actual Estimate Request
Percent turnover 62 37 5 64 658 lt8 658 lt8 lt8
Responsible DivisionOffice Office of Human Resources
Data Source The National Business Center at Department of Interior (DOI)
PERFORMANCE GOAL 412 Expanding staff expertise
Description Internal training and hiring programs are designed to help the agency recruit and develop a diverse and qualified staff with the key skills industry knowledge and expertise to support the SEC mission In particular there is a need to train examiners attorneys economists and other experts for subject matter expertise relevant to the marketplace and investment and trading practices This metric tracks whether certain areas requiring significant training are being addressed The agency will track the number of SEC staff participants in mission-focused training and development programs and will report on specific items through the use of post-course evaluations to assess the impact and results of this training on a five-point scale
FY 2013 FY 2013 FY 2014 FY 2015 Fiscal Year FY 2008 FY 2009 FY 2010 FY 2011 FY 2012 Plan Actual Estimate Request
Mission-focused training attendance Prior year data not available NA NA 12000 12120
Post-course evaluations of mission-Prior year data not available NA NA 45 45
focused training
Responsible DivisionOffice Office of Human Resources
Data Source Course Attendance Identified in LEAP (Instructor-led courses only) and End of Course Evaluation Report Summary provided by Metrics that Matter
PERFORMANCE GOAL 413 Number of diversity-related partnershipsalliances
Description Increased numbers of diversity-related partnerships or alliances with professional associations and educational organizations provide opportunities to educate students about the SECrsquos work and to recruit career professionals from all segments of society The SEC will track the number of partnerships andor alliances with diverse professional associations and educational organizations
FY 2013 FY 2013 FY 2014 FY 2015 Fiscal Year FY 2008 FY 2009 FY 2010 FY 2011 FY 2012 Plan Actual Estimate Request
Number of partnershipsalliances Prior-year data 2 10 12 15 13 15
not available
Responsible DivisionOffice Office of Minority Women and Inclusion
Data Source Office of Minority Women and Inclusion Internal Records and Section 342 of DFA
15
42
FY 2015 ANNUAL PERFORMANCE PLAN bull FY 2015 CBJ FY 2015 APP AND FY 2013 APR
PERFORMANCE GOAL 414 Sur vey rankings
Description Annual and other rankings together with other metrics and indicators of federal government agencies will be used as one kind of metric to determine the SECrsquos overall success in improving employee morale and employee engagement
FY 2013 FY 2013 FY 2014 FY 2015 Fiscal Year FY 2008 FY 2009 FY 2010 FY 2011 FY 2012 Plan Actual Estimate Request
Best Places to Work ranking Ranked Ranked Ranked Ranked Ranked Ranked Ranked Ranked Ranked 3 11 24 27 19 20 15 5 5
Average of employee engagement Prior-year data not available NA 61 75 75
and global satisfaction index
Responsible DivisionOffice Office of Human Resources
Data Source Annual Partnership for Public Service calculated ranking based on Annual Employee Viewpoint Survey (EVS) administered by OPM and Average of Employee Engagement and Global Satisfaction Index from OPM Employee Viewpoint Survey (EVS)
PERFORMANCE GOAL 415 Bench strength
Description To maintain mission effectiveness it is essential that attrition in the leadership ranks is quickly addressed by having a highly qualified and diverse pool of candidates ready to assume those critical roles Success is measured by the percentage of key leadership positions for which the SEC has identified a pool of qualified candidates
FY 2013 FY 2013 FY 2014 FY 2015 Fiscal Year FY 2008 FY 2009 FY 2010 FY 2011 FY 2012 Plan Actual Estimate Request
Data point under development NA NA NA NA NA NA NA TBD TBD
Responsible DivisionOffice Office of Human Resources
Data Source TBD
Strategic Objective 42 The SEC encourages a collaborative environment across divisions and offices and leverages technology and data to fulfill its mission more effectively and efficiently
Goal Leader(s) Director Office of Information Technology
PERFORMANCE GOAL 421 Ensure SECrsquos systems and applications are available
Description The SEC aims to enhance its computing infrastructure to eliminate down time if systems at one site fail among other objectives This metric will capture the percentage of systems and applications that can fail over within 8 hours
FY 2013 FY 2013 FY 2014 FY 2015 Fiscal Year FY 2008 FY 2009 FY 2010 FY 2011 FY 2012 Plan Actual Estimate Request
Percentage of servers virtualized NA 12 22 38 79 85 93 94 95
Percentage fail over within 8 hours NA NA NA NA NA NA NA 100 100
Responsible DivisionOffice Office of Information Technology
Data Source OIT Network Operations Center (NOC) ndash automated network monitoring tools
43
FY 2015 CBJ FY 2015 APP AND FY 2013 APR bull FY 2015 ANNUAL PERFORMANCE PLAN
PERFORMANCE GOAL 422 Equip the SEC with an enhanced technology infrastructure to support enterprise infrastructure
Description The SEC aims to promote collaboration and information sharing across the enterprise To improve efficiency and knowledge management the SEC will consolidate and centralize its collaborative technologies to a commonly used enterprise set by 2020 This metric will measure the percentage of the SECrsquos offices and divisions that utilize centralized enterprise collaboration solutions
FY 2013 FY 2013 FY 2014 FY 2015 Fiscal Year FY 2008 FY 2009 FY 2010 FY 2011 FY 2012 Plan Actual Estimate Request
Number of enterprise solutions Prior-year data not 10 20 25 30 30 35 40
available
Responsible DivisionOffice Office of Information Technology
Data Source Approved software applications list
PERFORMANCE GOAL 423 Expand the SECrsquos video teleconferencing (VTC) capabilities to support an increasingly geographically dispersed workforce
Description The SEC seeks to develop a state of the art video teleconference solution that allows users to conduct a videoteleconference meeting between HQ regional offices and multiple endpoints simultaneously collaborate and share presentation materials and use VoIP technology to host video teleconferences from their officesworkspaces with other SEC users or conference rooms This metric will measure the average ldquouptimerdquo or availability of all VTC systems
FY 2013 FY 2013 FY 2014 FY 2015 Fiscal Year FY 2008 FY 2009 FY 2010 FY 2011 FY 2012 Plan Actual Estimate Request
Availability rate for VTC solutions Prior-year data not available 75 80 9999 9999
Responsible DivisionOffice Office of Information Technology
Data Source Telecommunications monitoring system
PERFORMANCE GOAL 424 Pursue continuous technology cost reductions and efficiencies
Description Recent technology enhancements ndash eg data center consolidation virtualization and maintenance contract reductions ndash are producing technical efficiencies and cost savings This metric will measure the amount of these costs savings
FY 2013 FY 2013 FY 2014 FY 2015 Fiscal Year FY 2008 FY 2009 FY 2010 FY 2011 FY 2012 Plan Actual Estimate Request
Percent reduction in operational run 1-3 187 1 2 cost leveraging technology and cost cost reduction reduction process efficiencies
Prior-year data not available reduction in steady
reduction in steady
in run costs
in run costs
state run state run costs costs1
Responsible DivisionOffice Office of Information Technology
Data Source OIT Network Operations Center (NOC)
The higher than expected FY 2013 actual of 187 percent is due to one-time technologies enhancements resulting from the data consolidation and virtualization 1
44
FY 2015 ANNUAL PERFORMANCE PLAN bull FY 2015 CBJ FY 2015 APP AND FY 2013 APR
PERFORMANCE GOAL 425 Enhance the SECrsquos enterprise data warehouse infrastructure and performance
Description The Enterprise Data Warehouse (EDW) infrastructure will enable the provisioning of data to Commission staff for search and analysis through a virtual data warehouse platform This metric will measure the availability of EDW and data sources
FY 2013 FY 2013 FY 2014 FY 2015 Fiscal Year FY 2008 FY 2009 FY 2010 FY 2011 FY 2012 Plan Actual Estimate Request
Availability rate for the EDW infrastructure components in Prior-year data not available NA NA 99 99 production
Responsible DivisionOffice Office of Information Technology
Data Source OIT Network Operations Center (NOC) ndash automated network monitoring tools
Strategic Objective 43 The SEC maximizes the use of agency resources by continually improving agency operations and bolstering internal controls
Goal Leader(s) Chief Financial Officer Chief Operations Officer
PERFORMANCE GOAL 431 Financial audit results
Description Under the Accountability of Taxpayer Dollars Act of 2002 the agency is required to meet all proprietary and budgetary accounting guidelines for federal agencies and to undergo annual audits The SECrsquos audits are conducted by the Government Accountability Office
FY 2013 FY 2013 FY 2014 FY 2015 Fiscal Year FY 2008 FY 2009 FY 2010 FY 2011 FY 2012 Plan Actual Estimate Request
Unqualified opinion Yes Yes Yes Yes Yes Yes Yes Yes Yes
Material weaknesses 0 1 2 0 0 0 0 0 0
Significant deficiency 3 6 0 4 2 0 1 0 0
Responsible DivisionOffice Office of Financial Management
Data Source GAO SEC Financial Audit Report
PERFORMANCE GOAL 432 Assurance statement on internal control over operations
Description In accordance with OMB A-123 and Section 961 of the Dodd-Frank Act the SEC conducts an annual assessment of the effectiveness of internal controls The SEC will continue to develop its Operational Risk program and enhance cross-organizational processes to support all division and office management assurance statements Success is measured by the quality of risk and control assessments and management self-identification and resolution of improvement opportunities
FY 2013 FY 2013 FY 2014 FY 2015 Fiscal Year FY 2008 FY 2009 FY 2010 FY 2011 FY 2012 Plan Actual Estimate Request
Unqualified opinion Yes Yes Yes Yes Yes Yes Yes Yes Yes
Material weakness 0 0 0 0 0 0 0 0 0
Responsible DivisionOffice Office of the Chief Operating Officer
Data Source SEC Financial Audit Report
45
FY 2015 CBJ FY 2015 APP AND FY 2013 APR bull FY 2015 ANNUAL PERFORMANCE PLAN
1
PERFORMANCE GOAL 433 Timely completion of corrective action on Office of Inspector General (OIG) and the GAO audit recommendations1
Description Timely completion of audit recommendations is an important SEC priority This metric measures how well the Commission is doing in completing corrective action on OIG audit recommendations within established timeframes
FY 2013 FY 2013 FY 2014 FY 2015 Fiscal Year FY 2008 FY 2009 FY 2010 FY 2011 FY 2012 Plan Actual Estimate Request
OIG recommendations completed in Prior-year data not available NA 78 80 80
less than one year
Responsible DivisionOffice Office of the Chief Operating Officer
Data Source Audit Recommendation Tracking System
This measure was developed as part of the FY 2014-2018 SEC strategic planning process Currently there is no methodology in place to capture data for tracking all GAO Audit recommendations OCOO will determine a timeframe for establishing a methodology during FY 2014
46
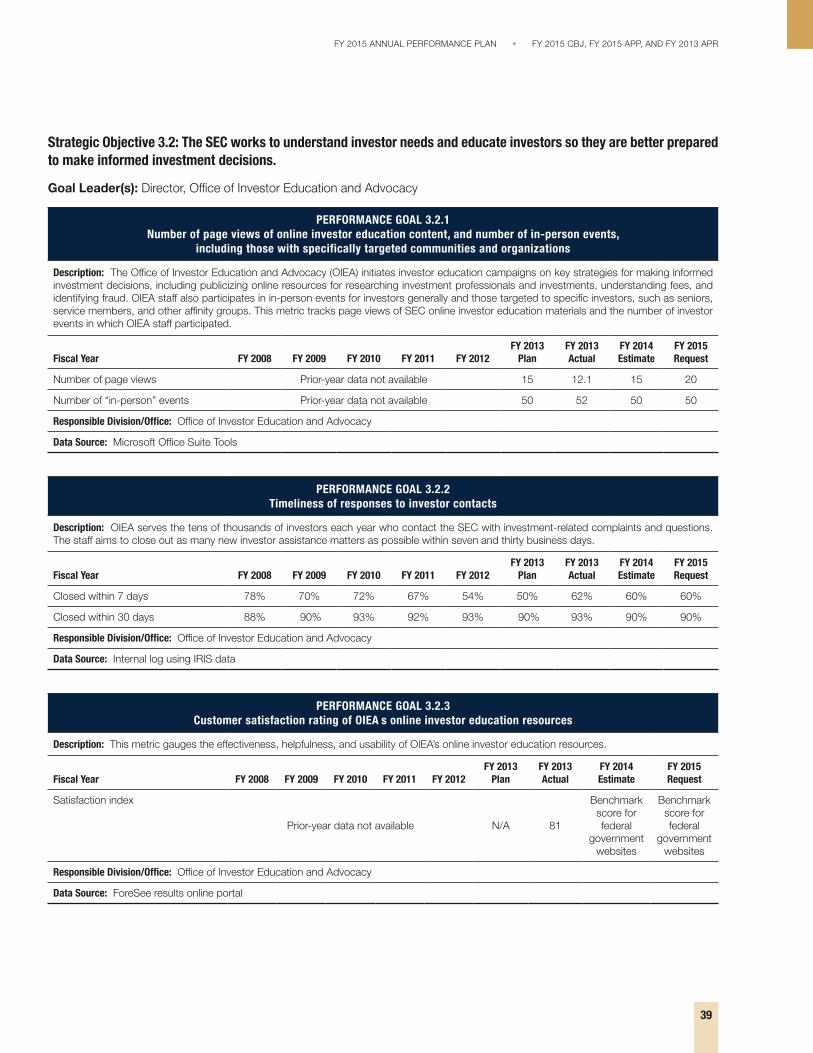
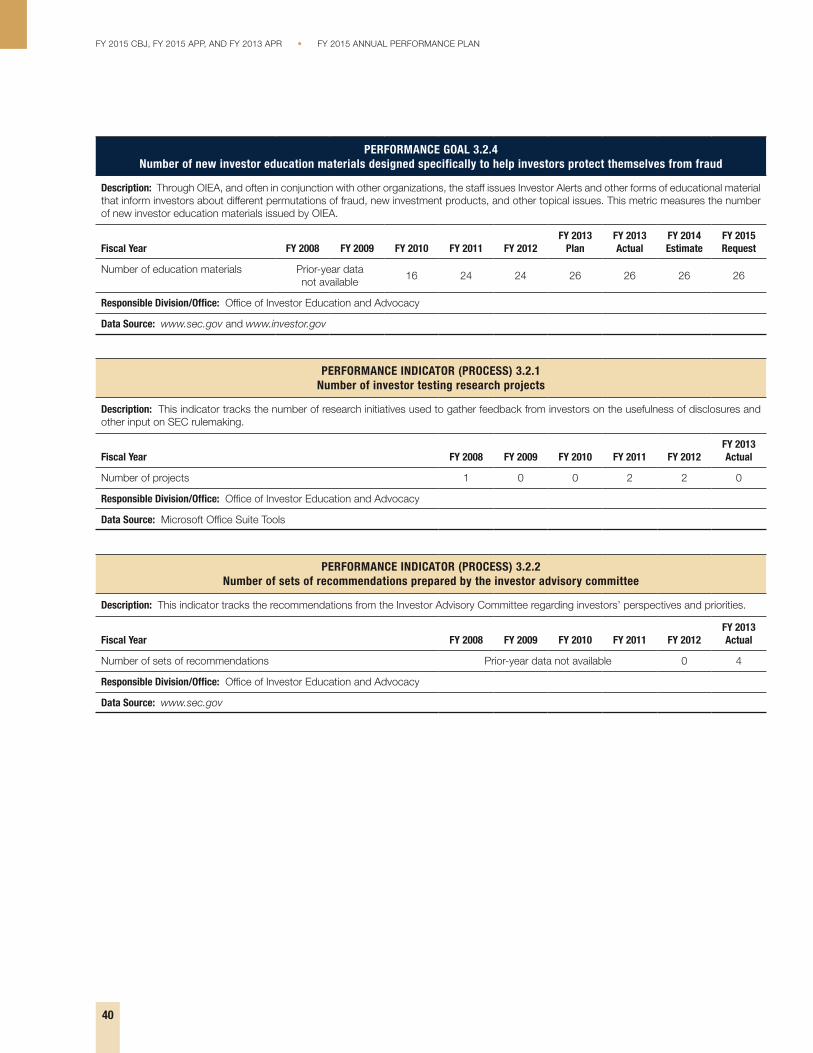
FY 2015 CBJ FY 2015 APP AND FY 2013 APR bull FY 2015 ANNUAL PERFORMANCE PLAN
PERFORMANCE GOAL 324 Number of new investor education materials designed specifically to help investors protect themselves from fraud
Description Through OIEA and often in conjunction with other organizations the staff issues Investor Alerts and other forms of educational material that inform investors about different permutations of fraud new investment products and other topical issues This metric measures the number of new investor education materials issued by OIEA
FY 2013 FY 2013 FY 2014 FY 2015 Fiscal Year FY 2008 FY 2009 FY 2010 FY 2011 FY 2012 Plan Actual Estimate Request
Number of education materials Prior-year data 16 24 24 26 26 26
not available
Responsible DivisionOffice Office of Investor Education and Advocacy
Data Source wwwsecgov and wwwinvestorgov
PERFORMANCE INDICATOR (PROCESS) 321 Number of investor testing research projects
Description This indicator tracks the number of research initiatives used to gather feedback from investors on the usefulness of disclosures and other input on SEC rulemaking
FY 2013 Fiscal Year FY 2008 FY 2009 FY 2010 FY 2011 FY 2012 Actual
Number of projects 1 0 0 2 2
Responsible DivisionOffice Office of Investor Education and Advocacy
Data Source Microsoft Office Suite Tools
PERFORMANCE INDICATOR (PROCESS) 322 Number of sets of recommendations prepared by the investor advisor y committee
Description This indicator tracks the recommendations from the Investor Advisory Committee regarding investorsrsquo perspectives and priorities
FY 2013 Fiscal Year FY 2008 FY 2009 FY 2010 FY 2011 FY 2012 Actual
Number of sets of recommendations Prior-year data not available 0 4
Responsible DivisionOffice Office of Investor Education and Advocacy
Data Source wwwsecgov
26
0
40
Strategic Goal 4 Enhance the Commissionrsquos Performance through Effective Alignment and Management of Human Information and Financial Capital During FY 2015 the agency will continue to focus on recruiting and retaining high-performing staff and updating the expertise of SEC employees so they are abreast of the latest developments in the securities markets Furthermore the SEC will continue to strengthen internal controls The agency is requesting a total of $3599 million and 867 FTEs in FY 2015 to achieve results in Strategic Goal 4
Budgeting for the Future (FY 2015)
The investing public and the securities markets are best served by an efficient effective and agile SEC In FY 2015 the agency will continue to take steps to become a more effective regulator of the US financial markets by making sound investments in human capital and new technologies and enhancing internal controls
The planned investment in the SEC University for FY 2015 principally supports training and development for employees directly involved in examinations investigations fraud detection litigation and other core mission responsibilities of the agency The SEC University will provide specialized in-depth training concerning changing market conditions analytics and forensics and the agencyrsquos new responsibility areas The investment also will fund employees for certain specialized financial certifications and regulatory credentials as well as the advanced continuing education required for maintaining legal and financial credentials
To maintain mission effectiveness it is essential that attrition in the leadership ranks is quickly addressed by having a highly qualified and diverse pool of candidates ready to assume those
critical roles (Performance Goal 415) The Office of Human Resourcesrsquo (OHR) Workforce Planning has completed building the foundational database necessary to conduct succession planning A subset of this team has begun benchmarking succession planning approaches used by other Federal agencies and will develop and implement a program at the SEC by the end of FY 2014 The first measure is expected by September 30 2014
Leveraging modern reliable and innovative technologies together with predictive analytics will transform the way the SEC performs its mission and provide a proactive view into how technology impacts capital markets The SEC will derive significant and measurable performance improvements in core operations and increase value for users through the use of automated enterprise processes
The continuing implementation of OITrsquos Technology Transformation Plan (ldquoWorking Smarterrdquo) in FY 2015 will support vital technology initiatives It will ensure the SECrsquos business processes are streamlined integrated and implemented using the best technology available
While the SEC has made significant strides in its multi-year path towards a strong sustainable internal control posture the agency will continue to dedicate its energies towards remediating the significant deficiency in information security During FY 2015 OFM will work closely with the Department of Transportationrsquos Federal Shared Services Provider (FSSP) to implement its software upgrade and refine the new Federal government-wide travel management system
41
FY 2015 ANNUAL PERFORMANCE PLAN bull FY 2015 CBJ FY 2015 APP AND FY 2013 APR
FY 2015 CBJ FY 2015 APP AND FY 2013 APR bull FY 2015 ANNUAL PERFORMANCE PLAN
Strategic Objective 41 The SEC promotes a results-oriented work environment that attracts engages and retains a technically proficient and diverse workforce including leaders who provide motivation and strategic direction
Goal Leader(s) Director Office of Human Resources Director Office of Minority and Women Inclusion
PERFORMANCE GOAL 411 Turnover
Description When employee morale and engagement are high high-performing employees tend to remain in the organization Although turnover can fluctuate based on a variety of factors the SEC aims to keep its turnover rate relatively low below 8 per year
FY 2013 FY 2013 FY 2014 FY 2015 Fiscal Year FY 2008 FY 2009 FY 2010 FY 2011 FY 2012 Plan Actual Estimate Request
Percent turnover 62 37 5 64 658 lt8 658 lt8 lt8
Responsible DivisionOffice Office of Human Resources
Data Source The National Business Center at Department of Interior (DOI)
PERFORMANCE GOAL 412 Expanding staff expertise
Description Internal training and hiring programs are designed to help the agency recruit and develop a diverse and qualified staff with the key skills industry knowledge and expertise to support the SEC mission In particular there is a need to train examiners attorneys economists and other experts for subject matter expertise relevant to the marketplace and investment and trading practices This metric tracks whether certain areas requiring significant training are being addressed The agency will track the number of SEC staff participants in mission-focused training and development programs and will report on specific items through the use of post-course evaluations to assess the impact and results of this training on a five-point scale
FY 2013 FY 2013 FY 2014 FY 2015 Fiscal Year FY 2008 FY 2009 FY 2010 FY 2011 FY 2012 Plan Actual Estimate Request
Mission-focused training attendance Prior year data not available NA NA 12000 12120
Post-course evaluations of mission-Prior year data not available NA NA 45 45
focused training
Responsible DivisionOffice Office of Human Resources
Data Source Course Attendance Identified in LEAP (Instructor-led courses only) and End of Course Evaluation Report Summary provided by Metrics that Matter
PERFORMANCE GOAL 413 Number of diversity-related partnershipsalliances
Description Increased numbers of diversity-related partnerships or alliances with professional associations and educational organizations provide opportunities to educate students about the SECrsquos work and to recruit career professionals from all segments of society The SEC will track the number of partnerships andor alliances with diverse professional associations and educational organizations
FY 2013 FY 2013 FY 2014 FY 2015 Fiscal Year FY 2008 FY 2009 FY 2010 FY 2011 FY 2012 Plan Actual Estimate Request
Number of partnershipsalliances Prior-year data 2 10 12 15 13 15
not available
Responsible DivisionOffice Office of Minority Women and Inclusion
Data Source Office of Minority Women and Inclusion Internal Records and Section 342 of DFA
15
42
FY 2015 ANNUAL PERFORMANCE PLAN bull FY 2015 CBJ FY 2015 APP AND FY 2013 APR
PERFORMANCE GOAL 414 Sur vey rankings
Description Annual and other rankings together with other metrics and indicators of federal government agencies will be used as one kind of metric to determine the SECrsquos overall success in improving employee morale and employee engagement
FY 2013 FY 2013 FY 2014 FY 2015 Fiscal Year FY 2008 FY 2009 FY 2010 FY 2011 FY 2012 Plan Actual Estimate Request
Best Places to Work ranking Ranked Ranked Ranked Ranked Ranked Ranked Ranked Ranked Ranked 3 11 24 27 19 20 15 5 5
Average of employee engagement Prior-year data not available NA 61 75 75
and global satisfaction index
Responsible DivisionOffice Office of Human Resources
Data Source Annual Partnership for Public Service calculated ranking based on Annual Employee Viewpoint Survey (EVS) administered by OPM and Average of Employee Engagement and Global Satisfaction Index from OPM Employee Viewpoint Survey (EVS)
PERFORMANCE GOAL 415 Bench strength
Description To maintain mission effectiveness it is essential that attrition in the leadership ranks is quickly addressed by having a highly qualified and diverse pool of candidates ready to assume those critical roles Success is measured by the percentage of key leadership positions for which the SEC has identified a pool of qualified candidates
FY 2013 FY 2013 FY 2014 FY 2015 Fiscal Year FY 2008 FY 2009 FY 2010 FY 2011 FY 2012 Plan Actual Estimate Request
Data point under development NA NA NA NA NA NA NA TBD TBD
Responsible DivisionOffice Office of Human Resources
Data Source TBD
Strategic Objective 42 The SEC encourages a collaborative environment across divisions and offices and leverages technology and data to fulfill its mission more effectively and efficiently
Goal Leader(s) Director Office of Information Technology
PERFORMANCE GOAL 421 Ensure SECrsquos systems and applications are available
Description The SEC aims to enhance its computing infrastructure to eliminate down time if systems at one site fail among other objectives This metric will capture the percentage of systems and applications that can fail over within 8 hours
FY 2013 FY 2013 FY 2014 FY 2015 Fiscal Year FY 2008 FY 2009 FY 2010 FY 2011 FY 2012 Plan Actual Estimate Request
Percentage of servers virtualized NA 12 22 38 79 85 93 94 95
Percentage fail over within 8 hours NA NA NA NA NA NA NA 100 100
Responsible DivisionOffice Office of Information Technology
Data Source OIT Network Operations Center (NOC) ndash automated network monitoring tools
43
FY 2015 CBJ FY 2015 APP AND FY 2013 APR bull FY 2015 ANNUAL PERFORMANCE PLAN
PERFORMANCE GOAL 422 Equip the SEC with an enhanced technology infrastructure to support enterprise infrastructure
Description The SEC aims to promote collaboration and information sharing across the enterprise To improve efficiency and knowledge management the SEC will consolidate and centralize its collaborative technologies to a commonly used enterprise set by 2020 This metric will measure the percentage of the SECrsquos offices and divisions that utilize centralized enterprise collaboration solutions
FY 2013 FY 2013 FY 2014 FY 2015 Fiscal Year FY 2008 FY 2009 FY 2010 FY 2011 FY 2012 Plan Actual Estimate Request
Number of enterprise solutions Prior-year data not 10 20 25 30 30 35 40
available
Responsible DivisionOffice Office of Information Technology
Data Source Approved software applications list
PERFORMANCE GOAL 423 Expand the SECrsquos video teleconferencing (VTC) capabilities to support an increasingly geographically dispersed workforce
Description The SEC seeks to develop a state of the art video teleconference solution that allows users to conduct a videoteleconference meeting between HQ regional offices and multiple endpoints simultaneously collaborate and share presentation materials and use VoIP technology to host video teleconferences from their officesworkspaces with other SEC users or conference rooms This metric will measure the average ldquouptimerdquo or availability of all VTC systems
FY 2013 FY 2013 FY 2014 FY 2015 Fiscal Year FY 2008 FY 2009 FY 2010 FY 2011 FY 2012 Plan Actual Estimate Request
Availability rate for VTC solutions Prior-year data not available 75 80 9999 9999
Responsible DivisionOffice Office of Information Technology
Data Source Telecommunications monitoring system
PERFORMANCE GOAL 424 Pursue continuous technology cost reductions and efficiencies
Description Recent technology enhancements ndash eg data center consolidation virtualization and maintenance contract reductions ndash are producing technical efficiencies and cost savings This metric will measure the amount of these costs savings
FY 2013 FY 2013 FY 2014 FY 2015 Fiscal Year FY 2008 FY 2009 FY 2010 FY 2011 FY 2012 Plan Actual Estimate Request
Percent reduction in operational run 1-3 187 1 2 cost leveraging technology and cost cost reduction reduction process efficiencies
Prior-year data not available reduction in steady
reduction in steady
in run costs
in run costs
state run state run costs costs1
Responsible DivisionOffice Office of Information Technology
Data Source OIT Network Operations Center (NOC)
The higher than expected FY 2013 actual of 187 percent is due to one-time technologies enhancements resulting from the data consolidation and virtualization 1
44
FY 2015 ANNUAL PERFORMANCE PLAN bull FY 2015 CBJ FY 2015 APP AND FY 2013 APR
PERFORMANCE GOAL 425 Enhance the SECrsquos enterprise data warehouse infrastructure and performance
Description The Enterprise Data Warehouse (EDW) infrastructure will enable the provisioning of data to Commission staff for search and analysis through a virtual data warehouse platform This metric will measure the availability of EDW and data sources
FY 2013 FY 2013 FY 2014 FY 2015 Fiscal Year FY 2008 FY 2009 FY 2010 FY 2011 FY 2012 Plan Actual Estimate Request
Availability rate for the EDW infrastructure components in Prior-year data not available NA NA 99 99 production
Responsible DivisionOffice Office of Information Technology
Data Source OIT Network Operations Center (NOC) ndash automated network monitoring tools
Strategic Objective 43 The SEC maximizes the use of agency resources by continually improving agency operations and bolstering internal controls
Goal Leader(s) Chief Financial Officer Chief Operations Officer
PERFORMANCE GOAL 431 Financial audit results
Description Under the Accountability of Taxpayer Dollars Act of 2002 the agency is required to meet all proprietary and budgetary accounting guidelines for federal agencies and to undergo annual audits The SECrsquos audits are conducted by the Government Accountability Office
FY 2013 FY 2013 FY 2014 FY 2015 Fiscal Year FY 2008 FY 2009 FY 2010 FY 2011 FY 2012 Plan Actual Estimate Request
Unqualified opinion Yes Yes Yes Yes Yes Yes Yes Yes Yes
Material weaknesses 0 1 2 0 0 0 0 0 0
Significant deficiency 3 6 0 4 2 0 1 0 0
Responsible DivisionOffice Office of Financial Management
Data Source GAO SEC Financial Audit Report
PERFORMANCE GOAL 432 Assurance statement on internal control over operations
Description In accordance with OMB A-123 and Section 961 of the Dodd-Frank Act the SEC conducts an annual assessment of the effectiveness of internal controls The SEC will continue to develop its Operational Risk program and enhance cross-organizational processes to support all division and office management assurance statements Success is measured by the quality of risk and control assessments and management self-identification and resolution of improvement opportunities
FY 2013 FY 2013 FY 2014 FY 2015 Fiscal Year FY 2008 FY 2009 FY 2010 FY 2011 FY 2012 Plan Actual Estimate Request
Unqualified opinion Yes Yes Yes Yes Yes Yes Yes Yes Yes
Material weakness 0 0 0 0 0 0 0 0 0
Responsible DivisionOffice Office of the Chief Operating Officer
Data Source SEC Financial Audit Report
45
FY 2015 CBJ FY 2015 APP AND FY 2013 APR bull FY 2015 ANNUAL PERFORMANCE PLAN
1
PERFORMANCE GOAL 433 Timely completion of corrective action on Office of Inspector General (OIG) and the GAO audit recommendations1
Description Timely completion of audit recommendations is an important SEC priority This metric measures how well the Commission is doing in completing corrective action on OIG audit recommendations within established timeframes
FY 2013 FY 2013 FY 2014 FY 2015 Fiscal Year FY 2008 FY 2009 FY 2010 FY 2011 FY 2012 Plan Actual Estimate Request
OIG recommendations completed in Prior-year data not available NA 78 80 80
less than one year
Responsible DivisionOffice Office of the Chief Operating Officer
Data Source Audit Recommendation Tracking System
This measure was developed as part of the FY 2014-2018 SEC strategic planning process Currently there is no methodology in place to capture data for tracking all GAO Audit recommendations OCOO will determine a timeframe for establishing a methodology during FY 2014
46
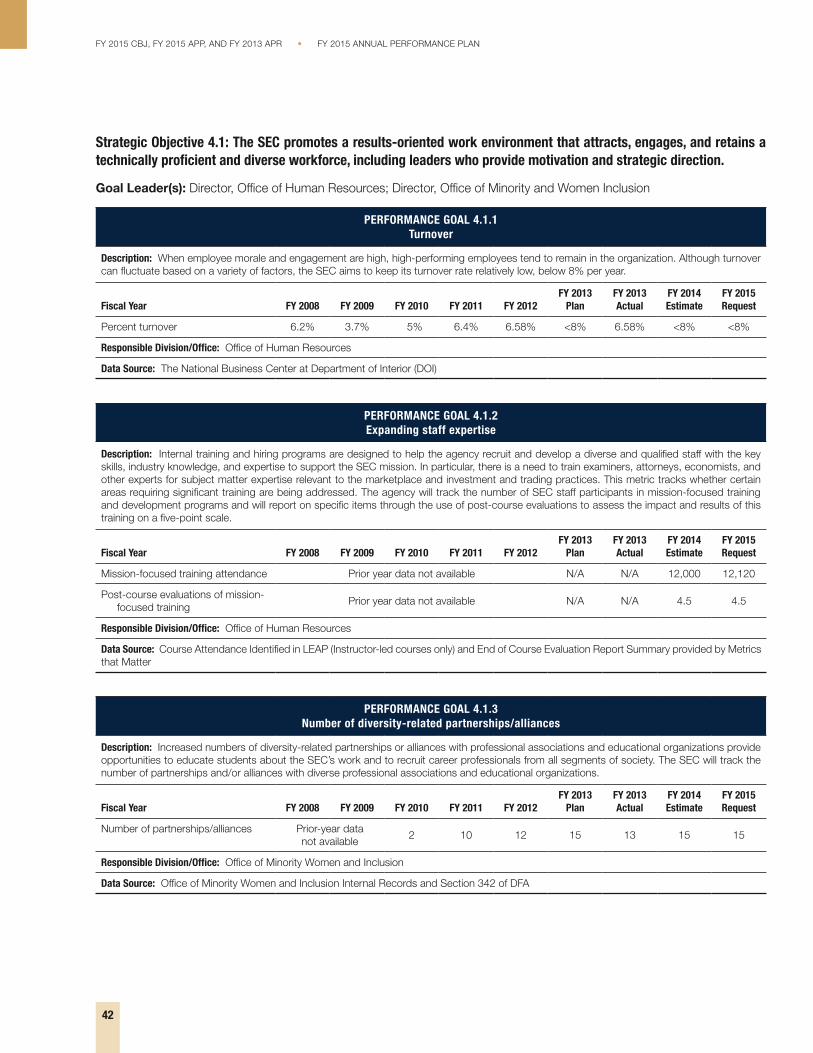
FY 2015 CBJ FY 2015 APP AND FY 2013 APR bull FY 2015 ANNUAL PERFORMANCE PLAN
Strategic Objective 41 The SEC promotes a results-oriented work environment that attracts engages and retains a technically proficient and diverse workforce including leaders who provide motivation and strategic direction
Goal Leader(s) Director Office of Human Resources Director Office of Minority and Women Inclusion
PERFORMANCE GOAL 411 Turnover
Description When employee morale and engagement are high high-performing employees tend to remain in the organization Although turnover can fluctuate based on a variety of factors the SEC aims to keep its turnover rate relatively low below 8 per year
FY 2013 FY 2013 FY 2014 FY 2015 Fiscal Year FY 2008 FY 2009 FY 2010 FY 2011 FY 2012 Plan Actual Estimate Request
Percent turnover 62 37 5 64 658 lt8 658 lt8 lt8
Responsible DivisionOffice Office of Human Resources
Data Source The National Business Center at Department of Interior (DOI)
PERFORMANCE GOAL 412 Expanding staff expertise
Description Internal training and hiring programs are designed to help the agency recruit and develop a diverse and qualified staff with the key skills industry knowledge and expertise to support the SEC mission In particular there is a need to train examiners attorneys economists and other experts for subject matter expertise relevant to the marketplace and investment and trading practices This metric tracks whether certain areas requiring significant training are being addressed The agency will track the number of SEC staff participants in mission-focused training and development programs and will report on specific items through the use of post-course evaluations to assess the impact and results of this training on a five-point scale
FY 2013 FY 2013 FY 2014 FY 2015 Fiscal Year FY 2008 FY 2009 FY 2010 FY 2011 FY 2012 Plan Actual Estimate Request
Mission-focused training attendance Prior year data not available NA NA 12000 12120
Post-course evaluations of mission-Prior year data not available NA NA 45 45
focused training
Responsible DivisionOffice Office of Human Resources
Data Source Course Attendance Identified in LEAP (Instructor-led courses only) and End of Course Evaluation Report Summary provided by Metrics that Matter
PERFORMANCE GOAL 413 Number of diversity-related partnershipsalliances
Description Increased numbers of diversity-related partnerships or alliances with professional associations and educational organizations provide opportunities to educate students about the SECrsquos work and to recruit career professionals from all segments of society The SEC will track the number of partnerships andor alliances with diverse professional associations and educational organizations
FY 2013 FY 2013 FY 2014 FY 2015 Fiscal Year FY 2008 FY 2009 FY 2010 FY 2011 FY 2012 Plan Actual Estimate Request
Number of partnershipsalliances Prior-year data 2 10 12 15 13 15
not available
Responsible DivisionOffice Office of Minority Women and Inclusion
Data Source Office of Minority Women and Inclusion Internal Records and Section 342 of DFA
15
42
FY 2015 ANNUAL PERFORMANCE PLAN bull FY 2015 CBJ FY 2015 APP AND FY 2013 APR
PERFORMANCE GOAL 414 Sur vey rankings
Description Annual and other rankings together with other metrics and indicators of federal government agencies will be used as one kind of metric to determine the SECrsquos overall success in improving employee morale and employee engagement
FY 2013 FY 2013 FY 2014 FY 2015 Fiscal Year FY 2008 FY 2009 FY 2010 FY 2011 FY 2012 Plan Actual Estimate Request
Best Places to Work ranking Ranked Ranked Ranked Ranked Ranked Ranked Ranked Ranked Ranked 3 11 24 27 19 20 15 5 5
Average of employee engagement Prior-year data not available NA 61 75 75
and global satisfaction index
Responsible DivisionOffice Office of Human Resources
Data Source Annual Partnership for Public Service calculated ranking based on Annual Employee Viewpoint Survey (EVS) administered by OPM and Average of Employee Engagement and Global Satisfaction Index from OPM Employee Viewpoint Survey (EVS)
PERFORMANCE GOAL 415 Bench strength
Description To maintain mission effectiveness it is essential that attrition in the leadership ranks is quickly addressed by having a highly qualified and diverse pool of candidates ready to assume those critical roles Success is measured by the percentage of key leadership positions for which the SEC has identified a pool of qualified candidates
FY 2013 FY 2013 FY 2014 FY 2015 Fiscal Year FY 2008 FY 2009 FY 2010 FY 2011 FY 2012 Plan Actual Estimate Request
Data point under development NA NA NA NA NA NA NA TBD TBD
Responsible DivisionOffice Office of Human Resources
Data Source TBD
Strategic Objective 42 The SEC encourages a collaborative environment across divisions and offices and leverages technology and data to fulfill its mission more effectively and efficiently
Goal Leader(s) Director Office of Information Technology
PERFORMANCE GOAL 421 Ensure SECrsquos systems and applications are available
Description The SEC aims to enhance its computing infrastructure to eliminate down time if systems at one site fail among other objectives This metric will capture the percentage of systems and applications that can fail over within 8 hours
FY 2013 FY 2013 FY 2014 FY 2015 Fiscal Year FY 2008 FY 2009 FY 2010 FY 2011 FY 2012 Plan Actual Estimate Request
Percentage of servers virtualized NA 12 22 38 79 85 93 94 95
Percentage fail over within 8 hours NA NA NA NA NA NA NA 100 100
Responsible DivisionOffice Office of Information Technology
Data Source OIT Network Operations Center (NOC) ndash automated network monitoring tools
43
FY 2015 CBJ FY 2015 APP AND FY 2013 APR bull FY 2015 ANNUAL PERFORMANCE PLAN
PERFORMANCE GOAL 422 Equip the SEC with an enhanced technology infrastructure to support enterprise infrastructure
Description The SEC aims to promote collaboration and information sharing across the enterprise To improve efficiency and knowledge management the SEC will consolidate and centralize its collaborative technologies to a commonly used enterprise set by 2020 This metric will measure the percentage of the SECrsquos offices and divisions that utilize centralized enterprise collaboration solutions
FY 2013 FY 2013 FY 2014 FY 2015 Fiscal Year FY 2008 FY 2009 FY 2010 FY 2011 FY 2012 Plan Actual Estimate Request
Number of enterprise solutions Prior-year data not 10 20 25 30 30 35 40
available
Responsible DivisionOffice Office of Information Technology
Data Source Approved software applications list
PERFORMANCE GOAL 423 Expand the SECrsquos video teleconferencing (VTC) capabilities to support an increasingly geographically dispersed workforce
Description The SEC seeks to develop a state of the art video teleconference solution that allows users to conduct a videoteleconference meeting between HQ regional offices and multiple endpoints simultaneously collaborate and share presentation materials and use VoIP technology to host video teleconferences from their officesworkspaces with other SEC users or conference rooms This metric will measure the average ldquouptimerdquo or availability of all VTC systems
FY 2013 FY 2013 FY 2014 FY 2015 Fiscal Year FY 2008 FY 2009 FY 2010 FY 2011 FY 2012 Plan Actual Estimate Request
Availability rate for VTC solutions Prior-year data not available 75 80 9999 9999
Responsible DivisionOffice Office of Information Technology
Data Source Telecommunications monitoring system
PERFORMANCE GOAL 424 Pursue continuous technology cost reductions and efficiencies
Description Recent technology enhancements ndash eg data center consolidation virtualization and maintenance contract reductions ndash are producing technical efficiencies and cost savings This metric will measure the amount of these costs savings
FY 2013 FY 2013 FY 2014 FY 2015 Fiscal Year FY 2008 FY 2009 FY 2010 FY 2011 FY 2012 Plan Actual Estimate Request
Percent reduction in operational run 1-3 187 1 2 cost leveraging technology and cost cost reduction reduction process efficiencies
Prior-year data not available reduction in steady
reduction in steady
in run costs
in run costs
state run state run costs costs1
Responsible DivisionOffice Office of Information Technology
Data Source OIT Network Operations Center (NOC)
The higher than expected FY 2013 actual of 187 percent is due to one-time technologies enhancements resulting from the data consolidation and virtualization 1
44
FY 2015 ANNUAL PERFORMANCE PLAN bull FY 2015 CBJ FY 2015 APP AND FY 2013 APR
PERFORMANCE GOAL 425 Enhance the SECrsquos enterprise data warehouse infrastructure and performance
Description The Enterprise Data Warehouse (EDW) infrastructure will enable the provisioning of data to Commission staff for search and analysis through a virtual data warehouse platform This metric will measure the availability of EDW and data sources
FY 2013 FY 2013 FY 2014 FY 2015 Fiscal Year FY 2008 FY 2009 FY 2010 FY 2011 FY 2012 Plan Actual Estimate Request
Availability rate for the EDW infrastructure components in Prior-year data not available NA NA 99 99 production
Responsible DivisionOffice Office of Information Technology
Data Source OIT Network Operations Center (NOC) ndash automated network monitoring tools
Strategic Objective 43 The SEC maximizes the use of agency resources by continually improving agency operations and bolstering internal controls
Goal Leader(s) Chief Financial Officer Chief Operations Officer
PERFORMANCE GOAL 431 Financial audit results
Description Under the Accountability of Taxpayer Dollars Act of 2002 the agency is required to meet all proprietary and budgetary accounting guidelines for federal agencies and to undergo annual audits The SECrsquos audits are conducted by the Government Accountability Office
FY 2013 FY 2013 FY 2014 FY 2015 Fiscal Year FY 2008 FY 2009 FY 2010 FY 2011 FY 2012 Plan Actual Estimate Request
Unqualified opinion Yes Yes Yes Yes Yes Yes Yes Yes Yes
Material weaknesses 0 1 2 0 0 0 0 0 0
Significant deficiency 3 6 0 4 2 0 1 0 0
Responsible DivisionOffice Office of Financial Management
Data Source GAO SEC Financial Audit Report
PERFORMANCE GOAL 432 Assurance statement on internal control over operations
Description In accordance with OMB A-123 and Section 961 of the Dodd-Frank Act the SEC conducts an annual assessment of the effectiveness of internal controls The SEC will continue to develop its Operational Risk program and enhance cross-organizational processes to support all division and office management assurance statements Success is measured by the quality of risk and control assessments and management self-identification and resolution of improvement opportunities
FY 2013 FY 2013 FY 2014 FY 2015 Fiscal Year FY 2008 FY 2009 FY 2010 FY 2011 FY 2012 Plan Actual Estimate Request
Unqualified opinion Yes Yes Yes Yes Yes Yes Yes Yes Yes
Material weakness 0 0 0 0 0 0 0 0 0
Responsible DivisionOffice Office of the Chief Operating Officer
Data Source SEC Financial Audit Report
45
FY 2015 CBJ FY 2015 APP AND FY 2013 APR bull FY 2015 ANNUAL PERFORMANCE PLAN
1
PERFORMANCE GOAL 433 Timely completion of corrective action on Office of Inspector General (OIG) and the GAO audit recommendations1
Description Timely completion of audit recommendations is an important SEC priority This metric measures how well the Commission is doing in completing corrective action on OIG audit recommendations within established timeframes
FY 2013 FY 2013 FY 2014 FY 2015 Fiscal Year FY 2008 FY 2009 FY 2010 FY 2011 FY 2012 Plan Actual Estimate Request
OIG recommendations completed in Prior-year data not available NA 78 80 80
less than one year
Responsible DivisionOffice Office of the Chief Operating Officer
Data Source Audit Recommendation Tracking System
This measure was developed as part of the FY 2014-2018 SEC strategic planning process Currently there is no methodology in place to capture data for tracking all GAO Audit recommendations OCOO will determine a timeframe for establishing a methodology during FY 2014
46
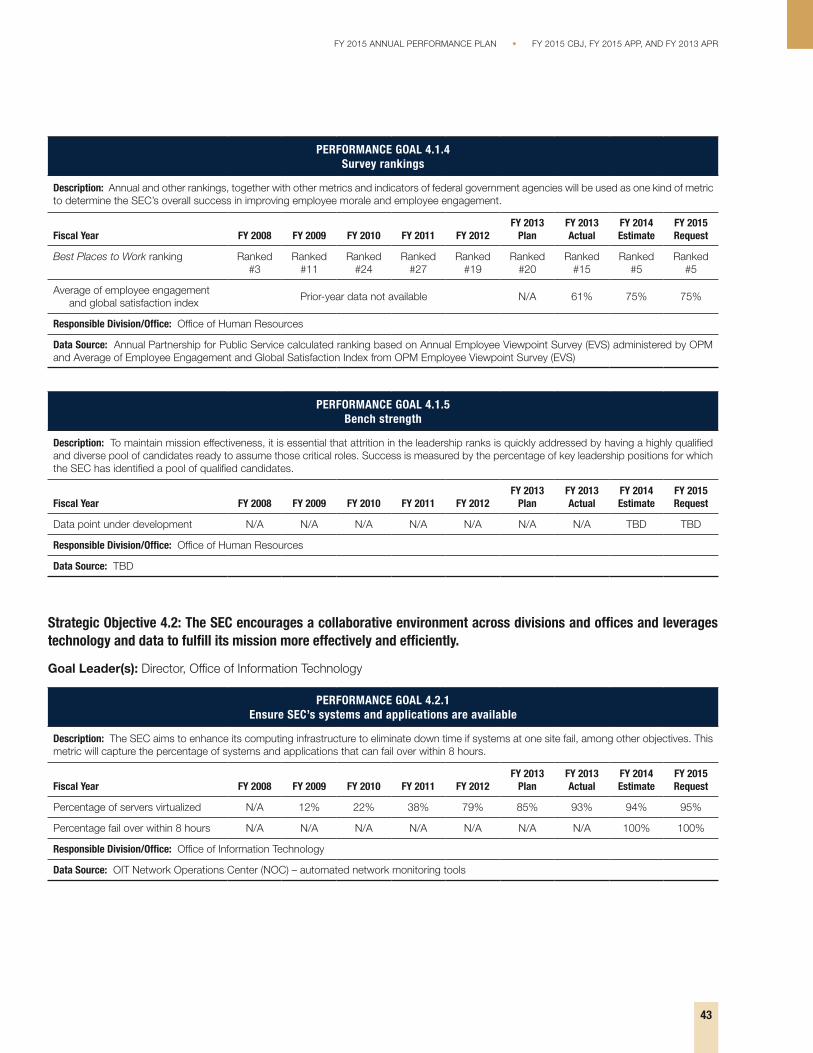
FY 2015 ANNUAL PERFORMANCE PLAN bull FY 2015 CBJ FY 2015 APP AND FY 2013 APR
PERFORMANCE GOAL 414 Sur vey rankings
Description Annual and other rankings together with other metrics and indicators of federal government agencies will be used as one kind of metric to determine the SECrsquos overall success in improving employee morale and employee engagement
FY 2013 FY 2013 FY 2014 FY 2015 Fiscal Year FY 2008 FY 2009 FY 2010 FY 2011 FY 2012 Plan Actual Estimate Request
Best Places to Work ranking Ranked Ranked Ranked Ranked Ranked Ranked Ranked Ranked Ranked 3 11 24 27 19 20 15 5 5
Average of employee engagement Prior-year data not available NA 61 75 75
and global satisfaction index
Responsible DivisionOffice Office of Human Resources
Data Source Annual Partnership for Public Service calculated ranking based on Annual Employee Viewpoint Survey (EVS) administered by OPM and Average of Employee Engagement and Global Satisfaction Index from OPM Employee Viewpoint Survey (EVS)
PERFORMANCE GOAL 415 Bench strength
Description To maintain mission effectiveness it is essential that attrition in the leadership ranks is quickly addressed by having a highly qualified and diverse pool of candidates ready to assume those critical roles Success is measured by the percentage of key leadership positions for which the SEC has identified a pool of qualified candidates
FY 2013 FY 2013 FY 2014 FY 2015 Fiscal Year FY 2008 FY 2009 FY 2010 FY 2011 FY 2012 Plan Actual Estimate Request
Data point under development NA NA NA NA NA NA NA TBD TBD
Responsible DivisionOffice Office of Human Resources
Data Source TBD
Strategic Objective 42 The SEC encourages a collaborative environment across divisions and offices and leverages technology and data to fulfill its mission more effectively and efficiently
Goal Leader(s) Director Office of Information Technology
PERFORMANCE GOAL 421 Ensure SECrsquos systems and applications are available
Description The SEC aims to enhance its computing infrastructure to eliminate down time if systems at one site fail among other objectives This metric will capture the percentage of systems and applications that can fail over within 8 hours
FY 2013 FY 2013 FY 2014 FY 2015 Fiscal Year FY 2008 FY 2009 FY 2010 FY 2011 FY 2012 Plan Actual Estimate Request
Percentage of servers virtualized NA 12 22 38 79 85 93 94 95
Percentage fail over within 8 hours NA NA NA NA NA NA NA 100 100
Responsible DivisionOffice Office of Information Technology
Data Source OIT Network Operations Center (NOC) ndash automated network monitoring tools
43
FY 2015 CBJ FY 2015 APP AND FY 2013 APR bull FY 2015 ANNUAL PERFORMANCE PLAN
PERFORMANCE GOAL 422 Equip the SEC with an enhanced technology infrastructure to support enterprise infrastructure
Description The SEC aims to promote collaboration and information sharing across the enterprise To improve efficiency and knowledge management the SEC will consolidate and centralize its collaborative technologies to a commonly used enterprise set by 2020 This metric will measure the percentage of the SECrsquos offices and divisions that utilize centralized enterprise collaboration solutions
FY 2013 FY 2013 FY 2014 FY 2015 Fiscal Year FY 2008 FY 2009 FY 2010 FY 2011 FY 2012 Plan Actual Estimate Request
Number of enterprise solutions Prior-year data not 10 20 25 30 30 35 40
available
Responsible DivisionOffice Office of Information Technology
Data Source Approved software applications list
PERFORMANCE GOAL 423 Expand the SECrsquos video teleconferencing (VTC) capabilities to support an increasingly geographically dispersed workforce
Description The SEC seeks to develop a state of the art video teleconference solution that allows users to conduct a videoteleconference meeting between HQ regional offices and multiple endpoints simultaneously collaborate and share presentation materials and use VoIP technology to host video teleconferences from their officesworkspaces with other SEC users or conference rooms This metric will measure the average ldquouptimerdquo or availability of all VTC systems
FY 2013 FY 2013 FY 2014 FY 2015 Fiscal Year FY 2008 FY 2009 FY 2010 FY 2011 FY 2012 Plan Actual Estimate Request
Availability rate for VTC solutions Prior-year data not available 75 80 9999 9999
Responsible DivisionOffice Office of Information Technology
Data Source Telecommunications monitoring system
PERFORMANCE GOAL 424 Pursue continuous technology cost reductions and efficiencies
Description Recent technology enhancements ndash eg data center consolidation virtualization and maintenance contract reductions ndash are producing technical efficiencies and cost savings This metric will measure the amount of these costs savings
FY 2013 FY 2013 FY 2014 FY 2015 Fiscal Year FY 2008 FY 2009 FY 2010 FY 2011 FY 2012 Plan Actual Estimate Request
Percent reduction in operational run 1-3 187 1 2 cost leveraging technology and cost cost reduction reduction process efficiencies
Prior-year data not available reduction in steady
reduction in steady
in run costs
in run costs
state run state run costs costs1
Responsible DivisionOffice Office of Information Technology
Data Source OIT Network Operations Center (NOC)
The higher than expected FY 2013 actual of 187 percent is due to one-time technologies enhancements resulting from the data consolidation and virtualization 1
44
FY 2015 ANNUAL PERFORMANCE PLAN bull FY 2015 CBJ FY 2015 APP AND FY 2013 APR
PERFORMANCE GOAL 425 Enhance the SECrsquos enterprise data warehouse infrastructure and performance
Description The Enterprise Data Warehouse (EDW) infrastructure will enable the provisioning of data to Commission staff for search and analysis through a virtual data warehouse platform This metric will measure the availability of EDW and data sources
FY 2013 FY 2013 FY 2014 FY 2015 Fiscal Year FY 2008 FY 2009 FY 2010 FY 2011 FY 2012 Plan Actual Estimate Request
Availability rate for the EDW infrastructure components in Prior-year data not available NA NA 99 99 production
Responsible DivisionOffice Office of Information Technology
Data Source OIT Network Operations Center (NOC) ndash automated network monitoring tools
Strategic Objective 43 The SEC maximizes the use of agency resources by continually improving agency operations and bolstering internal controls
Goal Leader(s) Chief Financial Officer Chief Operations Officer
PERFORMANCE GOAL 431 Financial audit results
Description Under the Accountability of Taxpayer Dollars Act of 2002 the agency is required to meet all proprietary and budgetary accounting guidelines for federal agencies and to undergo annual audits The SECrsquos audits are conducted by the Government Accountability Office
FY 2013 FY 2013 FY 2014 FY 2015 Fiscal Year FY 2008 FY 2009 FY 2010 FY 2011 FY 2012 Plan Actual Estimate Request
Unqualified opinion Yes Yes Yes Yes Yes Yes Yes Yes Yes
Material weaknesses 0 1 2 0 0 0 0 0 0
Significant deficiency 3 6 0 4 2 0 1 0 0
Responsible DivisionOffice Office of Financial Management
Data Source GAO SEC Financial Audit Report
PERFORMANCE GOAL 432 Assurance statement on internal control over operations
Description In accordance with OMB A-123 and Section 961 of the Dodd-Frank Act the SEC conducts an annual assessment of the effectiveness of internal controls The SEC will continue to develop its Operational Risk program and enhance cross-organizational processes to support all division and office management assurance statements Success is measured by the quality of risk and control assessments and management self-identification and resolution of improvement opportunities
FY 2013 FY 2013 FY 2014 FY 2015 Fiscal Year FY 2008 FY 2009 FY 2010 FY 2011 FY 2012 Plan Actual Estimate Request
Unqualified opinion Yes Yes Yes Yes Yes Yes Yes Yes Yes
Material weakness 0 0 0 0 0 0 0 0 0
Responsible DivisionOffice Office of the Chief Operating Officer
Data Source SEC Financial Audit Report
45
FY 2015 CBJ FY 2015 APP AND FY 2013 APR bull FY 2015 ANNUAL PERFORMANCE PLAN
1
PERFORMANCE GOAL 433 Timely completion of corrective action on Office of Inspector General (OIG) and the GAO audit recommendations1
Description Timely completion of audit recommendations is an important SEC priority This metric measures how well the Commission is doing in completing corrective action on OIG audit recommendations within established timeframes
FY 2013 FY 2013 FY 2014 FY 2015 Fiscal Year FY 2008 FY 2009 FY 2010 FY 2011 FY 2012 Plan Actual Estimate Request
OIG recommendations completed in Prior-year data not available NA 78 80 80
less than one year
Responsible DivisionOffice Office of the Chief Operating Officer
Data Source Audit Recommendation Tracking System
This measure was developed as part of the FY 2014-2018 SEC strategic planning process Currently there is no methodology in place to capture data for tracking all GAO Audit recommendations OCOO will determine a timeframe for establishing a methodology during FY 2014
46
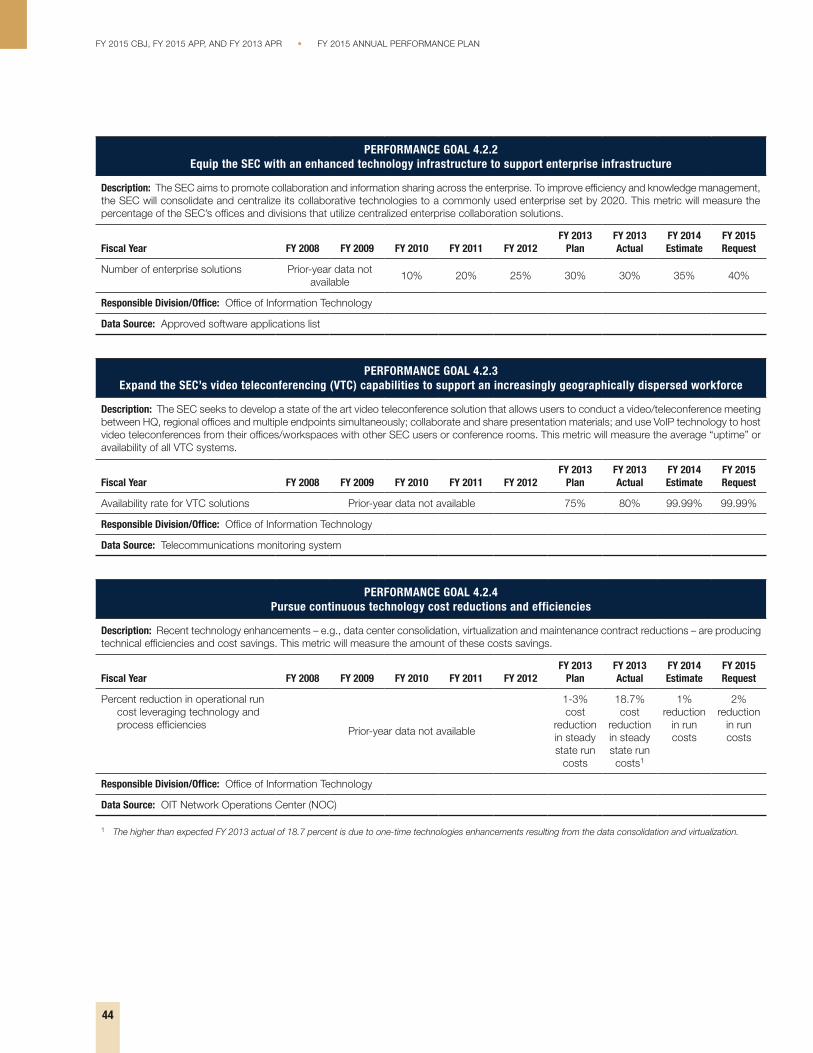
FY 2015 CBJ FY 2015 APP AND FY 2013 APR bull FY 2015 ANNUAL PERFORMANCE PLAN
PERFORMANCE GOAL 422 Equip the SEC with an enhanced technology infrastructure to support enterprise infrastructure
Description The SEC aims to promote collaboration and information sharing across the enterprise To improve efficiency and knowledge management the SEC will consolidate and centralize its collaborative technologies to a commonly used enterprise set by 2020 This metric will measure the percentage of the SECrsquos offices and divisions that utilize centralized enterprise collaboration solutions
FY 2013 FY 2013 FY 2014 FY 2015 Fiscal Year FY 2008 FY 2009 FY 2010 FY 2011 FY 2012 Plan Actual Estimate Request
Number of enterprise solutions Prior-year data not 10 20 25 30 30 35 40
available
Responsible DivisionOffice Office of Information Technology
Data Source Approved software applications list
PERFORMANCE GOAL 423 Expand the SECrsquos video teleconferencing (VTC) capabilities to support an increasingly geographically dispersed workforce
Description The SEC seeks to develop a state of the art video teleconference solution that allows users to conduct a videoteleconference meeting between HQ regional offices and multiple endpoints simultaneously collaborate and share presentation materials and use VoIP technology to host video teleconferences from their officesworkspaces with other SEC users or conference rooms This metric will measure the average ldquouptimerdquo or availability of all VTC systems
FY 2013 FY 2013 FY 2014 FY 2015 Fiscal Year FY 2008 FY 2009 FY 2010 FY 2011 FY 2012 Plan Actual Estimate Request
Availability rate for VTC solutions Prior-year data not available 75 80 9999 9999
Responsible DivisionOffice Office of Information Technology
Data Source Telecommunications monitoring system
PERFORMANCE GOAL 424 Pursue continuous technology cost reductions and efficiencies
Description Recent technology enhancements ndash eg data center consolidation virtualization and maintenance contract reductions ndash are producing technical efficiencies and cost savings This metric will measure the amount of these costs savings
FY 2013 FY 2013 FY 2014 FY 2015 Fiscal Year FY 2008 FY 2009 FY 2010 FY 2011 FY 2012 Plan Actual Estimate Request
Percent reduction in operational run 1-3 187 1 2 cost leveraging technology and cost cost reduction reduction process efficiencies
Prior-year data not available reduction in steady
reduction in steady
in run costs
in run costs
state run state run costs costs1
Responsible DivisionOffice Office of Information Technology
Data Source OIT Network Operations Center (NOC)
The higher than expected FY 2013 actual of 187 percent is due to one-time technologies enhancements resulting from the data consolidation and virtualization 1
44
FY 2015 ANNUAL PERFORMANCE PLAN bull FY 2015 CBJ FY 2015 APP AND FY 2013 APR
PERFORMANCE GOAL 425 Enhance the SECrsquos enterprise data warehouse infrastructure and performance
Description The Enterprise Data Warehouse (EDW) infrastructure will enable the provisioning of data to Commission staff for search and analysis through a virtual data warehouse platform This metric will measure the availability of EDW and data sources
FY 2013 FY 2013 FY 2014 FY 2015 Fiscal Year FY 2008 FY 2009 FY 2010 FY 2011 FY 2012 Plan Actual Estimate Request
Availability rate for the EDW infrastructure components in Prior-year data not available NA NA 99 99 production
Responsible DivisionOffice Office of Information Technology
Data Source OIT Network Operations Center (NOC) ndash automated network monitoring tools
Strategic Objective 43 The SEC maximizes the use of agency resources by continually improving agency operations and bolstering internal controls
Goal Leader(s) Chief Financial Officer Chief Operations Officer
PERFORMANCE GOAL 431 Financial audit results
Description Under the Accountability of Taxpayer Dollars Act of 2002 the agency is required to meet all proprietary and budgetary accounting guidelines for federal agencies and to undergo annual audits The SECrsquos audits are conducted by the Government Accountability Office
FY 2013 FY 2013 FY 2014 FY 2015 Fiscal Year FY 2008 FY 2009 FY 2010 FY 2011 FY 2012 Plan Actual Estimate Request
Unqualified opinion Yes Yes Yes Yes Yes Yes Yes Yes Yes
Material weaknesses 0 1 2 0 0 0 0 0 0
Significant deficiency 3 6 0 4 2 0 1 0 0
Responsible DivisionOffice Office of Financial Management
Data Source GAO SEC Financial Audit Report
PERFORMANCE GOAL 432 Assurance statement on internal control over operations
Description In accordance with OMB A-123 and Section 961 of the Dodd-Frank Act the SEC conducts an annual assessment of the effectiveness of internal controls The SEC will continue to develop its Operational Risk program and enhance cross-organizational processes to support all division and office management assurance statements Success is measured by the quality of risk and control assessments and management self-identification and resolution of improvement opportunities
FY 2013 FY 2013 FY 2014 FY 2015 Fiscal Year FY 2008 FY 2009 FY 2010 FY 2011 FY 2012 Plan Actual Estimate Request
Unqualified opinion Yes Yes Yes Yes Yes Yes Yes Yes Yes
Material weakness 0 0 0 0 0 0 0 0 0
Responsible DivisionOffice Office of the Chief Operating Officer
Data Source SEC Financial Audit Report
45
FY 2015 CBJ FY 2015 APP AND FY 2013 APR bull FY 2015 ANNUAL PERFORMANCE PLAN
1
PERFORMANCE GOAL 433 Timely completion of corrective action on Office of Inspector General (OIG) and the GAO audit recommendations1
Description Timely completion of audit recommendations is an important SEC priority This metric measures how well the Commission is doing in completing corrective action on OIG audit recommendations within established timeframes
FY 2013 FY 2013 FY 2014 FY 2015 Fiscal Year FY 2008 FY 2009 FY 2010 FY 2011 FY 2012 Plan Actual Estimate Request
OIG recommendations completed in Prior-year data not available NA 78 80 80
less than one year
Responsible DivisionOffice Office of the Chief Operating Officer
Data Source Audit Recommendation Tracking System
This measure was developed as part of the FY 2014-2018 SEC strategic planning process Currently there is no methodology in place to capture data for tracking all GAO Audit recommendations OCOO will determine a timeframe for establishing a methodology during FY 2014
46
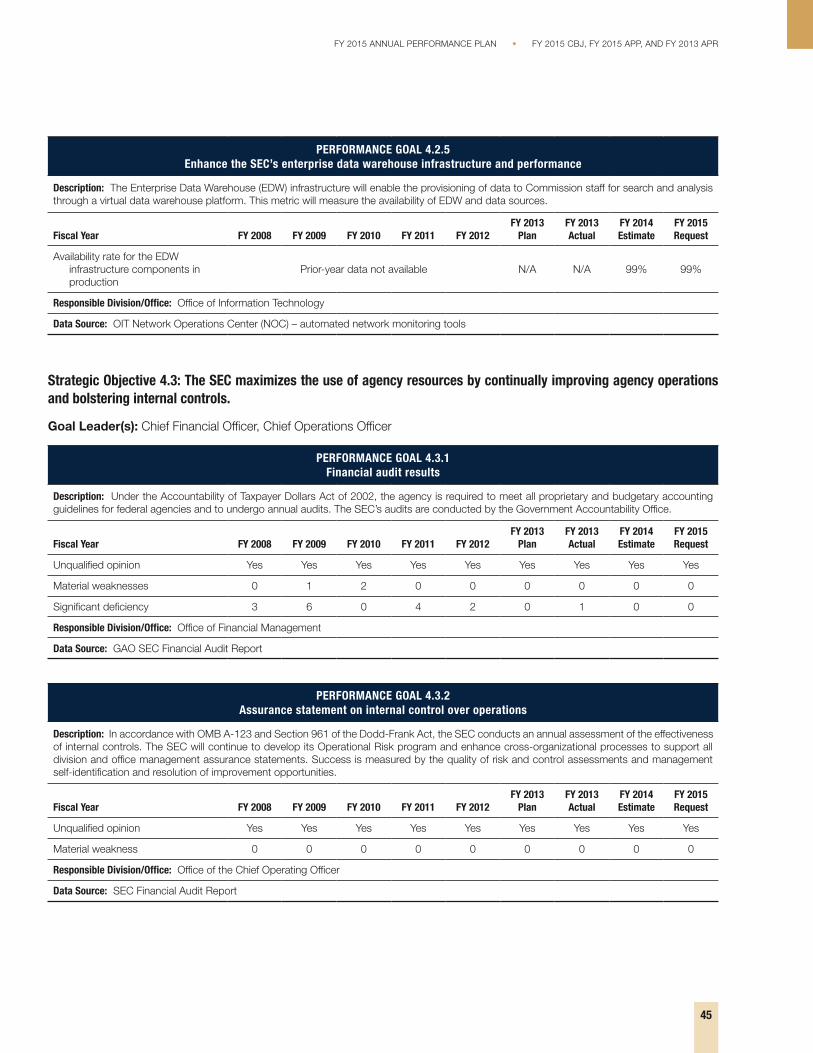
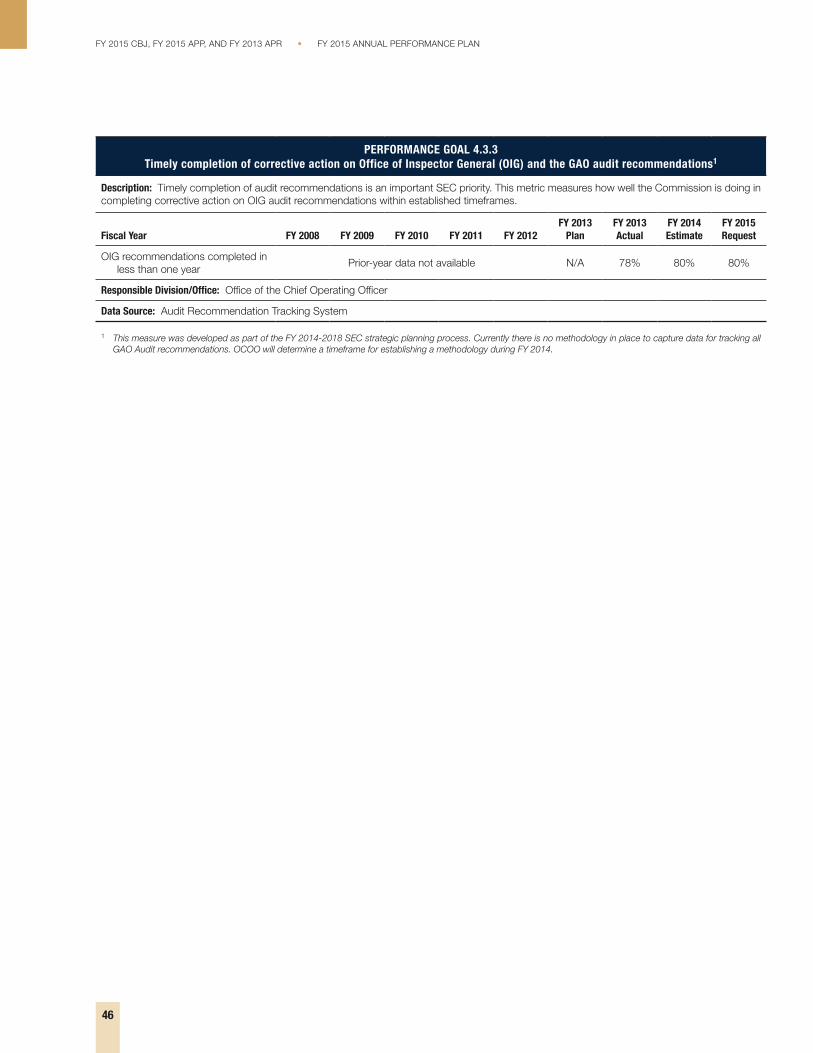