Embed Size (px)
Citation preview
March 3, 2015
FY 2014 Results Conference Call
Strategic progress and delivery of results
Karl-Ludwig Kley, CEO
Marcus Kuhnert, CFO

2
Disclaimer
Cautionary Note Regarding Forward-Looking Statements
This communication may include “forward-looking statements.” Statements that include words such as “anticipate,” “expect,” “should,” “would,” “intend,” “plan,” “project,” “seek,” “believe,” “will,”
and other words of similar meaning in connection with future events or future operating or financial performance are often used to identify forward-looking statements. All statements in this
communication, other than those relating to historical information or current conditions, are forward-looking statements. We intend these forward-looking statements to be covered by the safe
harbor provisions for forward-looking statements in the Private Securities Litigation Reform Act of 1995. These forward-looking statements are subject to a number of risks and uncertainties,
many of which are beyond control of Merck KGaA, Darmstadt, Germany, which could cause actual results to differ materially from such statements.
Risks and uncertainties relating to the proposed transaction with Sigma-Aldrich Corporation ("Sigma-Aldrich") include, but are not limited to: the risk that regulatory or other approvals required
for the transaction are not obtained or are obtained subject to conditions that are not anticipated; competitive responses to the transaction; litigation relating to the transaction; uncertainty of
the expected financial performance of the combined company following completion of the proposed transaction; the ability of Merck KGaA, Darmstadt, Germany, to achieve the cost-savings
and synergies contemplated by the proposed transaction within the expected time frame; the ability of Merck KGaA, Darmstadt, Germany, to promptly and effectively integrate the businesses
of Sigma-Aldrich and Merck KGaA, Darmstadt, Germany; the effects of the business combination of Merck KGaA, Darmstadt, Germany, and Sigma-Aldrich, including the combined company’s
future financial condition, operating results, strategy and plans; the implications of the proposed transaction on certain employee benefit plans of Merck KGaA, Darmstadt, Germany, and
Sigma-Aldrich; and disruption from the proposed transaction making it more difficult to maintain relationships with customers, employees or suppliers.
Additional risks and uncertainties include, but are not limited to: the risks of more restrictive regulatory requirements regarding drug pricing, reimbursement and approval; the risk of stricter
regulations for the manufacture, testing and marketing of products; the risk of destabilization of political systems and the establishment of trade barriers; the risk of a changing marketing
environment for multiple sclerosis products in the European Union; the risk of greater competitive pressure due to biosimilars; the risks of research and development; the risks of discontinuing
development projects and regulatory approval of developed medicines; the risk of a temporary ban on products/production facilities or of non-registration of products due to non-compliance
with quality standards; the risk of an import ban on products to the United States due to an FDA warning letter; the risks of dependency on suppliers; risks due to product-related
crime and espionage; risks in relation to the use of financial instruments; liquidity risks; counterparty risks; market risks; risks of impairment on balance sheet items; risks from pension
obligations; risks from product-related and patent law disputes; risks from antitrust law proceedings; risks from drug pricing by the divested Generics Group; risks in human resources; risks
from e-crime and cyber attacks; risks due to failure of business-critical information technology applications or to failure of data center capacity; environmental and safety risks; unanticipated
contract or regulatory issues; a potential downgrade in the rating of the indebtedness of Merck KGaA, Darmstadt, Germany, or Sigma-Aldrich; downward pressure on the common stock price
of Merck KGaA, Darmstadt, Germany, or Sigma-Aldrich and its impact on goodwill impairment evaluations; the impact of future regulatory or legislative actions; and the risks and uncertainties
detailed by Sigma-Aldrich with respect to its business as described in its reports and documents filed with the U.S. Securities and Exchange Commission (the “SEC”).
The foregoing review of important factors should not be construed as exhaustive and should be read in conjunction with the other cautionary statements that are included elsewhere, including
the Report on Risks and Opportunities Section of the most recent annual report and quarterly report of Merck KGaA, Darmstadt, Germany, and the Risk Factors section of Sigma-Aldrich’s
most recent reports on Form 10-K and Form 10-Q. Any forward-looking statements made in this communication are qualified in their entirety by these cautionary statements, and there can be
no assurance that the actual results or developments anticipated by us will be realized or, even if substantially realized, that they will have the expected consequences to, or effects on, us or
our business or operations. Except to the extent required by applicable law, we undertake no obligation to update publicly or revise any forward-looking statement, whether as a result of new
information, future developments or otherwise.
Executive overview
Strategy update
Financial review
Outlook and guidance
Agenda
4
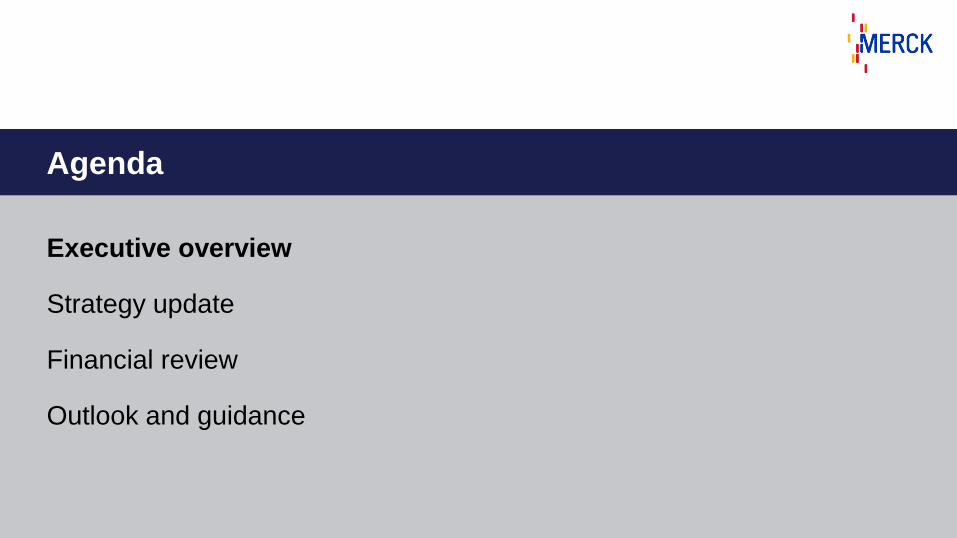
2014: A year of strategic progress
Execution of
“Fit for 2018”
growth strategy
Closing and successful integration of AZ Electronic Materials
Announcement of Sigma-Aldrich acquisition
Signing of alliance with Pfizer to leverage iOnc pipeline
Sound financial
performance
Rapid deleveraging following AZ acquisition
Organic growth across all divisions
Delivery on targets:
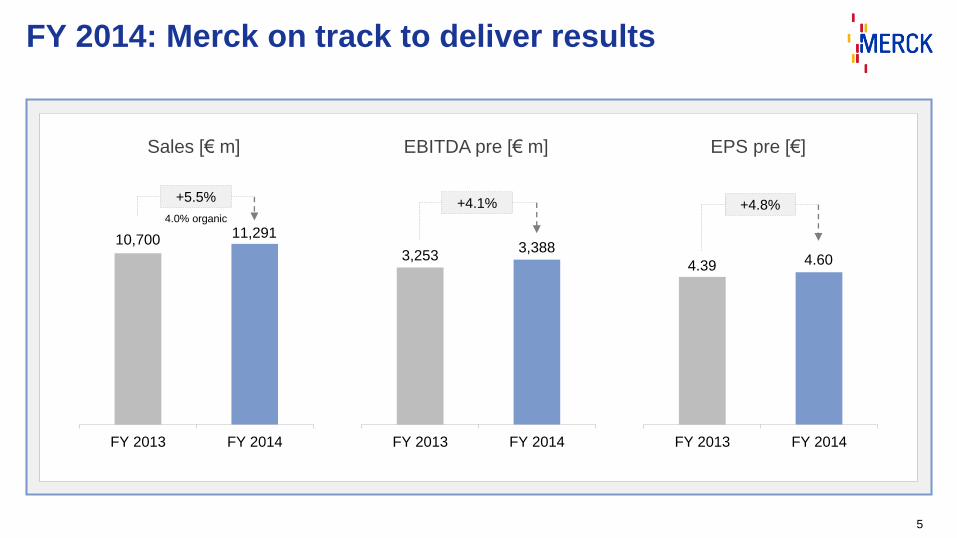
Sales €11.3 bn, EBITDA pre €3.388 bn, EPS pre €4.60
5
FY 2014: Merck on track to deliver results
FY 2013 FY 2014 FY 2013 FY 2014 FY 2013 FY 2014
Sales [€ m] EBITDA pre [€ m] EPS pre [€]
10,700 11,291
3,2533,388
4.39 4.60
+4.1%+5.5%+4.8%
4.0% organic

6
Emerging Markets – Growth continues
*Australia/Oceania, Africa
Merck Group FY 2014 sales by region Merck Group: Emerging Markets sales development
Emerging MarketsOrganic: +9.1%
North AmericaOrganic: +1.7%
38%
19%
35%
8%
EuropeOrganic: +0.2%
Japan & others*
Organic: +5.0%
[€ bn]
0
1.000
2.000
3.000
4.000
2008 2009 2010 2011 2012 2013 2014
CAGR 11.6%
Emerging Markets sales doubled within 6 years
1
2
3
4
7
Divisional overview – Merck Serono and Consumer Health
Merck
Serono
Consumer
Health
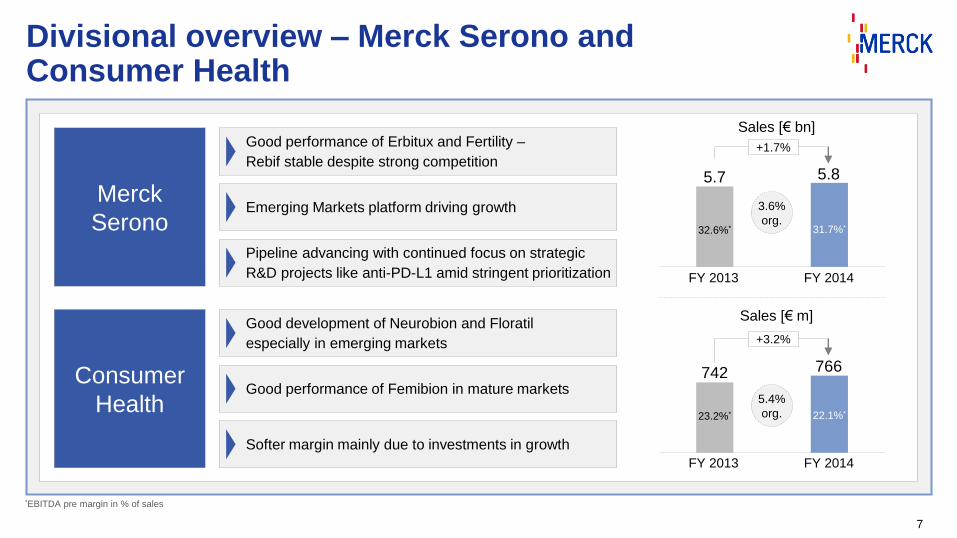
Good performance of Erbitux and Fertility –
Rebif stable despite strong competition
Emerging Markets platform driving growth
Pipeline advancing with continued focus on strategic
R&D projects like anti-PD-L1 amid stringent prioritization
5.8
FY 2014FY 2013
5.7
32.6%* 31.7%*
Sales [€ bn]
+1.7%
*EBITDA pre margin in % of sales
766
FY 2014FY 2013
742
23.2%* 22.1%*
Sales [€ m]
+3.2%
3.6%
org.
5.4%
org.
Good development of Neurobion and Floratil
especially in emerging markets
Good performance of Femibion in mature markets
Softer margin mainly due to investments in growth
8
Divisional overview – Performance Materials and Life Science
Performance
Materials
Merck
Millipore
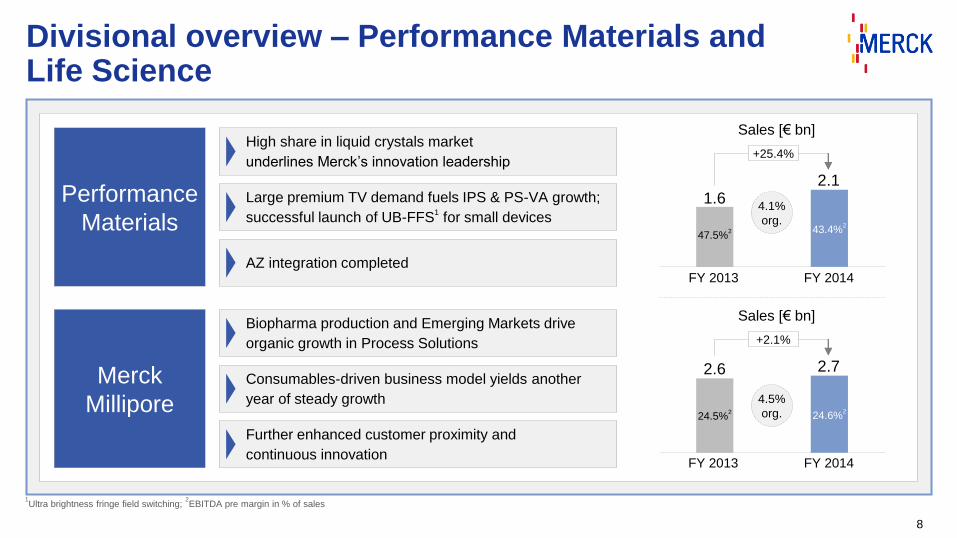
Biopharma production and Emerging Markets drive
organic growth in Process Solutions
Consumables-driven business model yields another
year of steady growth
Further enhanced customer proximity and
continuous innovation
High share in liquid crystals market
underlines Merck’s innovation leadership
Large premium TV demand fuels IPS & PS-VA growth;
successful launch of UB-FFS1
for small devices
AZ integration completed
1Ultra brightness fringe field switching;
2EBITDA pre margin in % of sales
2.1
FY 2014FY 2013
1.6
47.5%2 43.4%
2
Sales [€ bn]
+25.4%
2.7
FY 2014FY 2013
2.6
24.5%2 24.6%
2
Sales [€ bn]
+2.1%
4.1%
org.
4.5%
org.
9
Sustainable dividend development
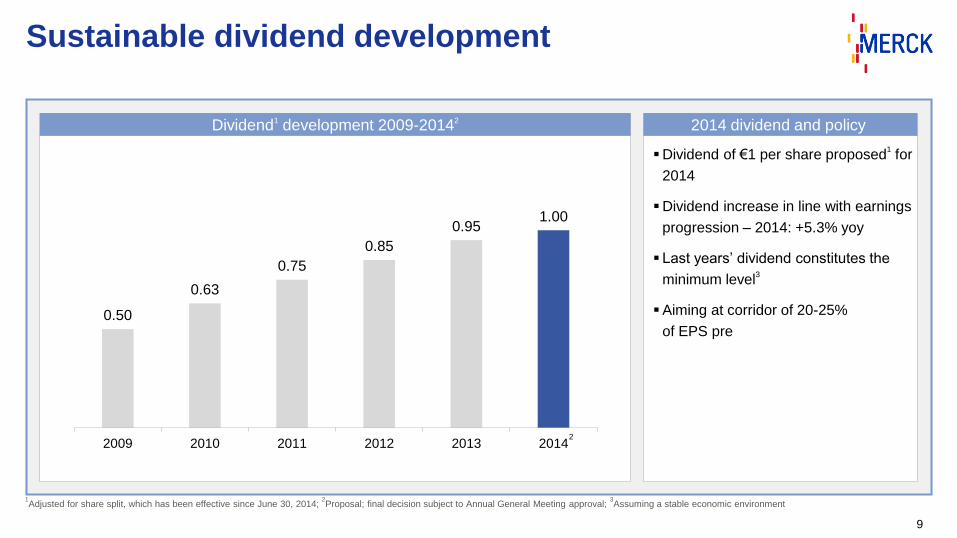
Dividend of €1 per share proposed1
for
2014
Dividend increase in line with earnings
progression – 2014: +5.3% yoy
Last years’ dividend constitutes the
minimum level3
Aiming at corridor of 20-25%
of EPS pre
Dividend1 development 2009-20142 2014 dividend and policy
1Adjusted for share split, which has been effective since June 30, 2014;
2Proposal; final decision subject to Annual General Meeting approval;
3Assuming a stable economic environment
0.50
0.63
0.75
0.85
0.951.00
2009 2010 2011 2012 2013 20142
Executive overview
Strategy update
Financial review
Outlook and guidance
Agenda
11
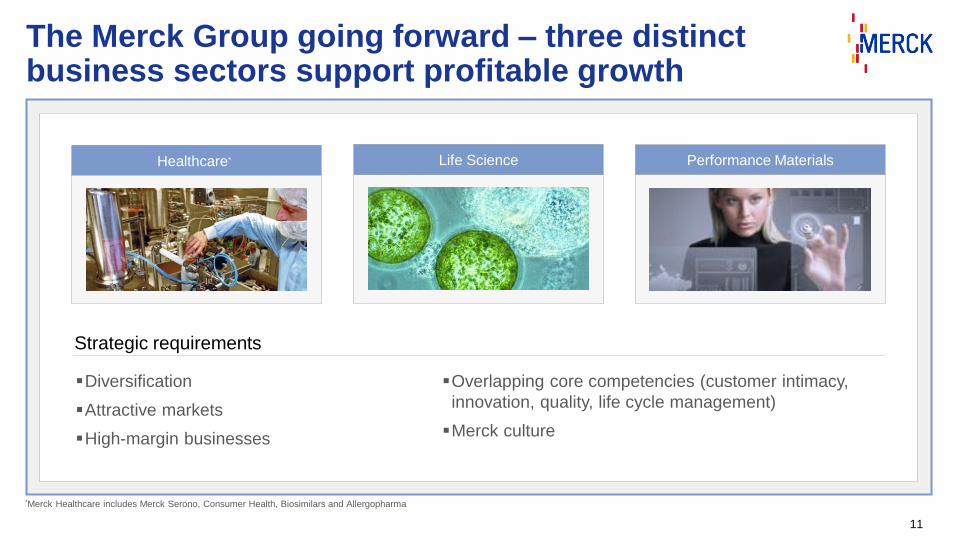
The Merck Group going forward – three distinct business sectors support profitable growth
*Merck Healthcare includes Merck Serono, Consumer Health, Biosimilars and Allergopharma
Diversification
Attractive markets
High-margin businesses
Overlapping core competencies (customer intimacy,
innovation, quality, life cycle management)
Merck culture
Performance MaterialsHealthcare* Life Science
Strategic requirements
12
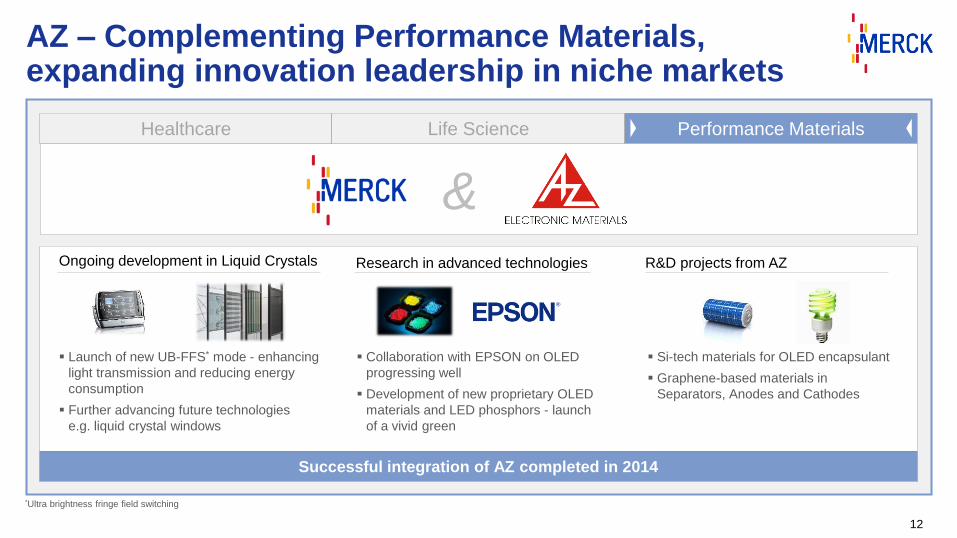
AZ – Complementing Performance Materials,expanding innovation leadership in niche markets
Healthcare Life Science Performance Materials
Successful integration of AZ completed in 2014
Si-tech materials for OLED encapsulant
Graphene-based materials in
Separators, Anodes and Cathodes
Ongoing development in Liquid Crystals Research in advanced technologies R&D projects from AZ
Collaboration with EPSON on OLED
progressing well
Development of new proprietary OLED
materials and LED phosphors - launch
of a vivid green
Launch of new UB-FFS* mode - enhancing
light transmission and reducing energy
consumption
Further advancing future technologies
e.g. liquid crystal windows
&
*Ultra brightness fringe field switching
13
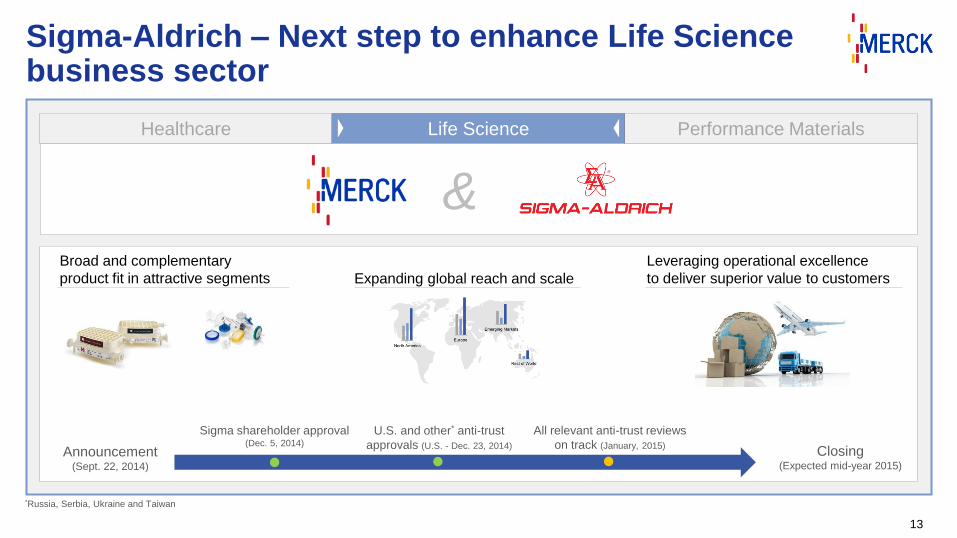
Sigma-Aldrich – Next step to enhance Life Science business sector
Healthcare Life Science Performance Materials
Broad and complementary
product fit in attractive segments Expanding global reach and scale
Leveraging operational excellence
to deliver superior value to customers
Announcement(Sept. 22, 2014)
Closing(Expected mid-year 2015)
Sigma shareholder approval (Dec. 5, 2014)
U.S. and other* anti-trust
approvals (U.S. - Dec. 23, 2014)
All relevant anti-trust reviews
on track (January, 2015)
&
*Russia, Serbia, Ukraine and Taiwan
14
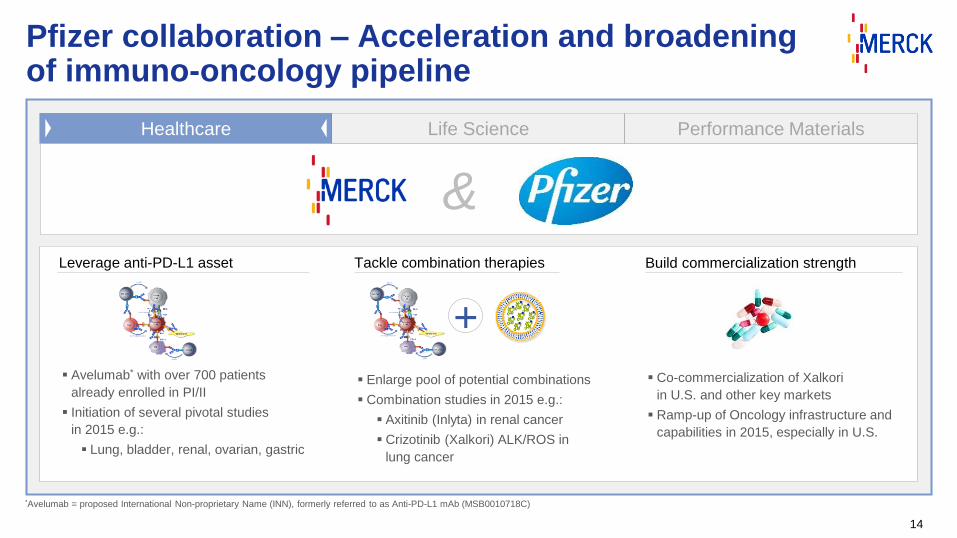
Pfizer collaboration – Acceleration and broadening of immuno-oncology pipeline
Healthcare Life Science Performance Materials
Avelumab* with over 700 patients
already enrolled in PI/II
Initiation of several pivotal studies
in 2015 e.g.:
Lung, bladder, renal, ovarian, gastric
Enlarge pool of potential combinations
Combination studies in 2015 e.g.:
Axitinib (Inlyta) in renal cancer
Crizotinib (Xalkori) ALK/ROS in
lung cancer
Co-commercialization of Xalkori
in U.S. and other key markets
Ramp-up of Oncology infrastructure and
capabilities in 2015, especially in U.S.
+
*Avelumab = proposed International Non-proprietary Name (INN), formerly referred to as Anti-PD-L1 mAb (MSB0010718C)
Leverage anti-PD-L1 asset Tackle combination therapies Build commercialization strength
&
15
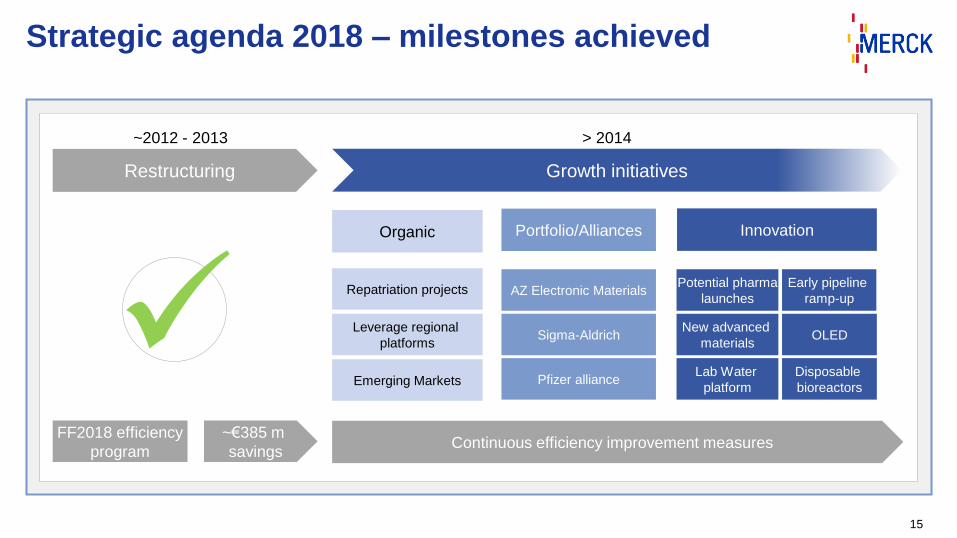
Strategic agenda 2018 – milestones achieved
FF2018 efficiency
program
Early pipeline
ramp-up
Continuous efficiency improvement measures~€385 m
savings
~2012 - 2013 > 2014
Restructuring Growth initiatives
Potential pharma
launches
Lab Water
platform
Disposable
bioreactors
InnovationOrganic
Repatriation projects
Leverage regional
platforms
Emerging Markets
AZ Electronic Materials
Portfolio/Alliances
Sigma-AldrichNew advanced
materialsOLED
Pfizer alliance
16
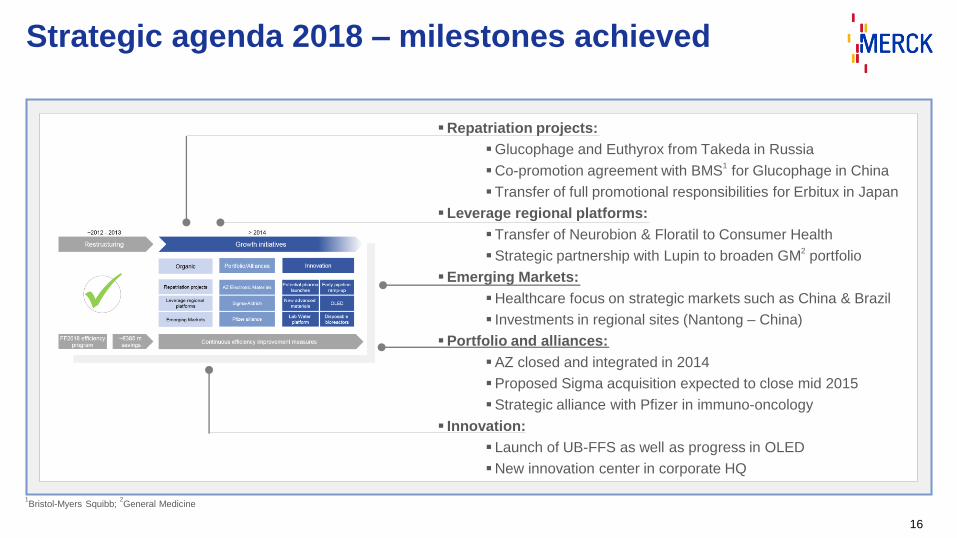
Strategic agenda 2018 – milestones achieved
1Bristol-Myers Squibb;
2General Medicine
Repatriation projects:
Glucophage and Euthyrox from Takeda in Russia
Co-promotion agreement with BMS1
for Glucophage in China
Transfer of full promotional responsibilities for Erbitux in Japan
Leverage regional platforms:
Transfer of Neurobion & Floratil to Consumer Health
Strategic partnership with Lupin to broaden GM2
portfolio
Emerging Markets:
Healthcare focus on strategic markets such as China & Brazil
Investments in regional sites (Nantong – China)
Portfolio and alliances:
AZ closed and integrated in 2014
Proposed Sigma acquisition expected to close mid 2015
Strategic alliance with Pfizer in immuno-oncology
Innovation:
Launch of UB-FFS as well as progress in OLED
New innovation center in corporate HQ
17
2014 – a solid foundation for future growth
Key steps in portfolio transformation taken
Continued implementation of “Fit for 2018” strategy
Poised for future growth
Solid financials – delivered on guidance
Operational discipline kept at high level
Executive overview
Strategy update
Financial review
Outlook and guidance
Agenda
[€ m]
19
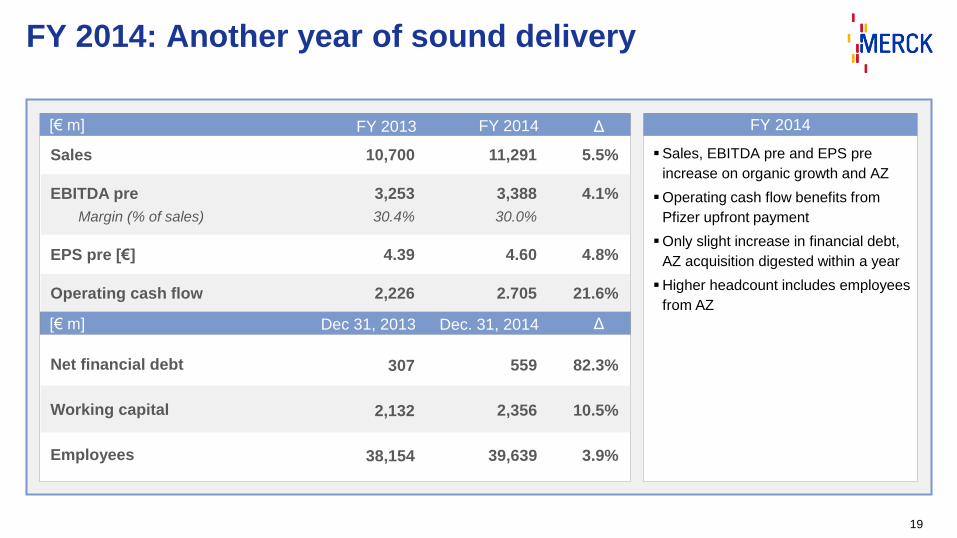
FY 2014: Another year of sound delivery
Sales, EBITDA pre and EPS pre
increase on organic growth and AZ
Operating cash flow benefits from
Pfizer upfront payment
Only slight increase in financial debt,
AZ acquisition digested within a year
Higher headcount includes employees
from AZ
FY 2014[€ m]
Sales
EBITDA pre
Margin (% of sales)
EPS pre [€]
Operating cash flow
11,291
3,388
30.0%
4.60
2.705
5.5%
4.1%
4.8%
21.6%
ΔFY 2014
Net financial debt
Working capital
Employees
559
2,356
39,639
82.3%
10.5%
3.9%
ΔDec. 31, 2014Dec 31, 2013
FY 2013
10,700
3,253
30.4%
4.39
2,226
307
2,132
38,154
EBITDA preFY 2013
MerckSerono
ConsumerHealth
PerformanceMaterials
MerckMillipore
Corporate &Other
EBITDA preFY 2014
20
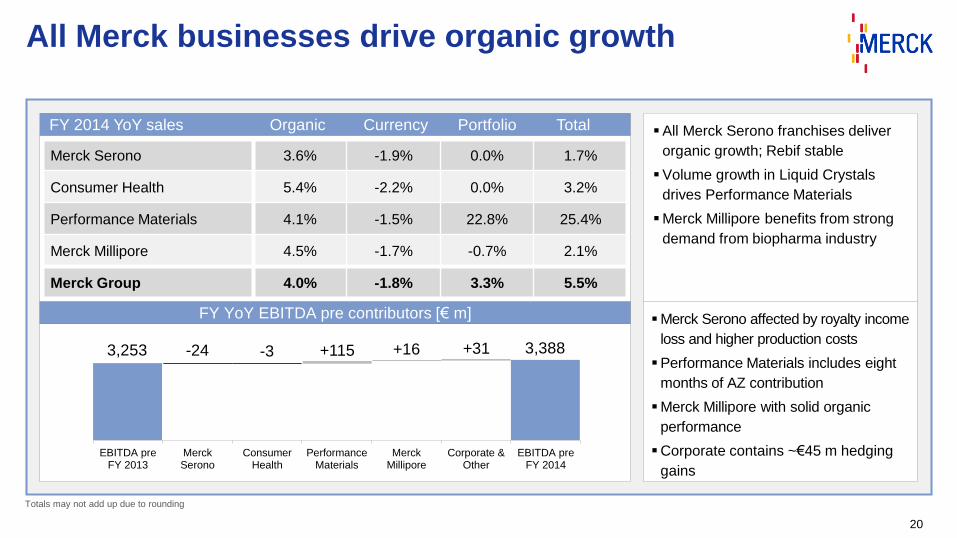
All Merck businesses drive organic growth
All Merck Serono franchises deliver
organic growth; Rebif stable
Volume growth in Liquid Crystals
drives Performance Materials
Merck Millipore benefits from strong
demand from biopharma industry
FY 2014 YoY sales Organic Currency Portfolio Total
Merck Serono 3.6% -1.9% 0.0% 1.7%
Consumer Health 5.4% -2.2% 0.0% 3.2%
Performance Materials 4.1% -1.5% 22.8% 25.4%
Merck Millipore 4.5% -1.7% -0.7% 2.1%
Merck Group 4.0% -1.8% 3.3% 5.5%
3,253 -24 -3 +115 +16 +31 3,388
FY YoY EBITDA pre contributors [€ m]Merck Serono affected by royalty income
loss and higher production costs
Performance Materials includes eight
months of AZ contribution
Merck Millipore with solid organic
performance
Corporate contains ~€45 m hedging
gains
Totals may not add up due to rounding
21
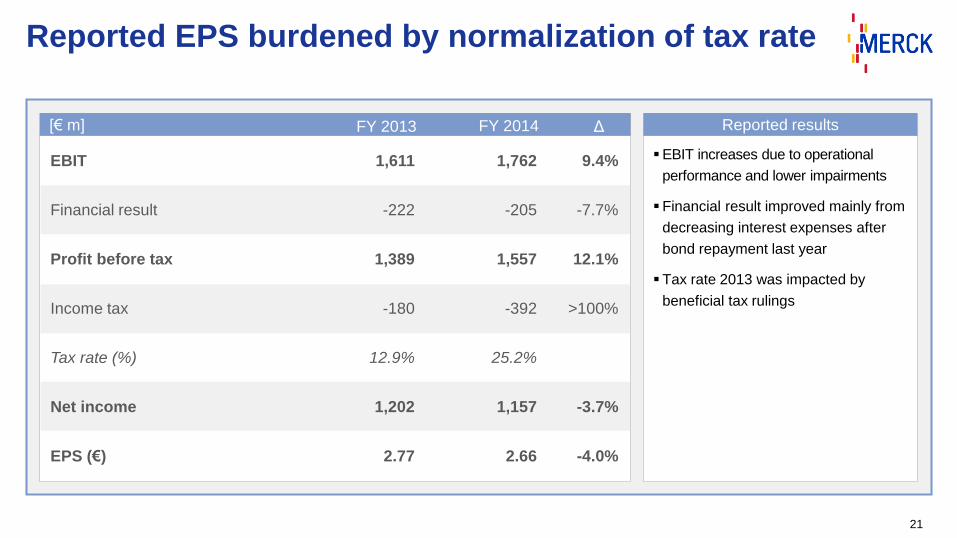
Reported EPS burdened by normalization of tax rate
EBIT increases due to operational
performance and lower impairments
Financial result improved mainly from
decreasing interest expenses after
bond repayment last year
Tax rate 2013 was impacted by
beneficial tax rulings
Reported results[€ m]
EBIT
Financial result
Profit before tax
Income tax
Tax rate (%)
Net income
EPS (€)
1,611
-222
1,389
-180
12.9%
1,202
2.77
1,762
-205
1,557
-392
25.2%
1,157
2.66
9.4%
-7.7%
12.1%
>100%
-3.7%
-4.0%
ΔFY 2014FY 2013
XXX
22
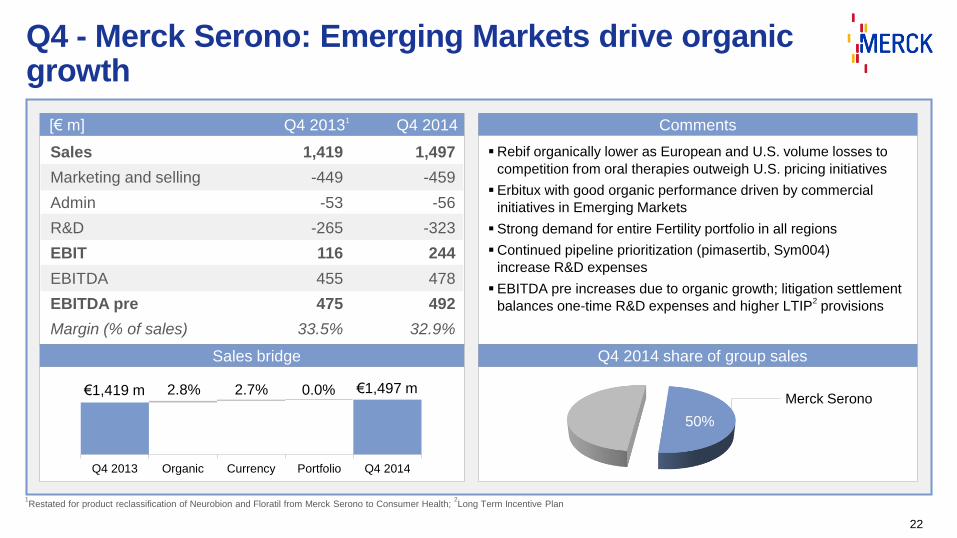
Q4 - Merck Serono: Emerging Markets drive organic growth
[€ m] Q4 20131 Q4 2014 Comments
Sales
Marketing and selling
Admin
R&D
EBIT
EBITDA
EBITDA pre
Margin (% of sales)
1,497
-459
-56
-323
244
478
492
32.9%
XXX XXX
Rebif organically lower as European and U.S. volume losses to
competition from oral therapies outweigh U.S. pricing initiatives
Erbitux with good organic performance driven by commercial
initiatives in Emerging Markets
Strong demand for entire Fertility portfolio in all regions
Continued pipeline prioritization (pimasertib, Sym004)
increase R&D expenses
EBITDA pre increases due to organic growth; litigation settlement
balances one-time R&D expenses and higher LTIP2
provisions
Q4 2013 Organic Currency Portfolio Q4 2014
2.8% 2.7% 0.0%€1,419 m €1,497 m
50%
Merck Serono
Sales bridge Q4 2014 share of group sales
1,419
-449
-53
-265
116
455
475
33.5%
1Restated for product reclassification of Neurobion and Floratil from Merck Serono to Consumer Health;
2Long Term Incentive Plan
XXX XXX
XXX
23
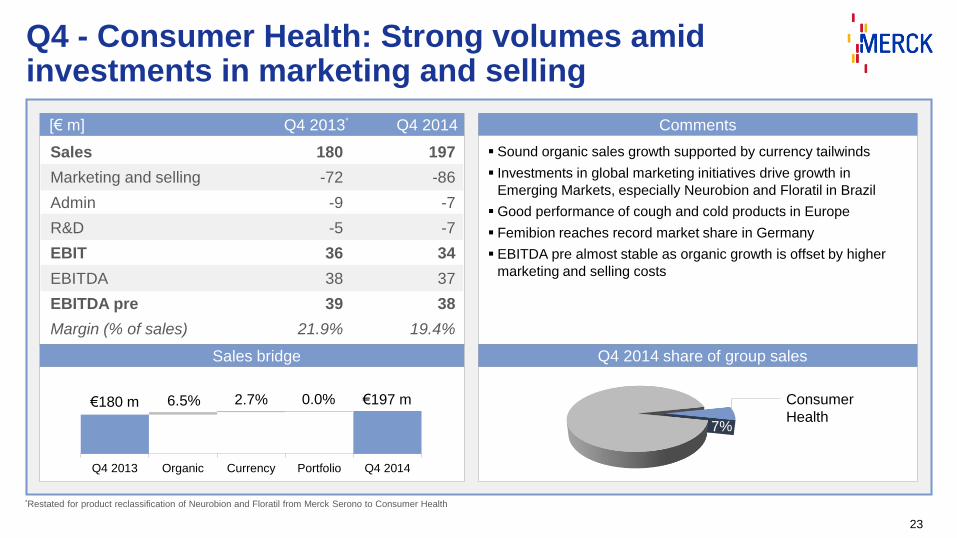
Q4 - Consumer Health: Strong volumes amid investments in marketing and selling
Comments
Sales
Marketing and selling
Admin
R&D
EBIT
EBITDA
EBITDA pre
Margin (% of sales)
197
-86
-7
-7
34
37
38
19.4%
Sound organic sales growth supported by currency tailwinds
Investments in global marketing initiatives drive growth in
Emerging Markets, especially Neurobion and Floratil in Brazil
Good performance of cough and cold products in Europe
Femibion reaches record market share in Germany
EBITDA pre almost stable as organic growth is offset by higher
marketing and selling costs
Q4 2013 Organic Currency Portfolio Q4 2014
6.5% 2.7% 0.0%€180 m €197 m Consumer
Health7%
*Restated for product reclassification of Neurobion and Floratil from Merck Serono to Consumer Health
Sales bridge Q4 2014 share of group sales
180
-72
-9
-5
36
38
39
21.9%
[€ m] Q4 2013* Q4 2014
XXX
XXX
24
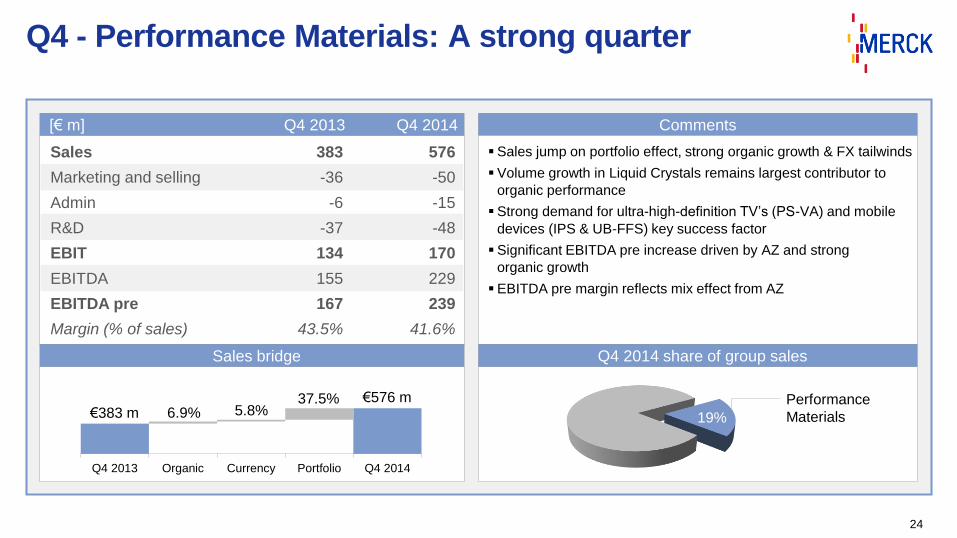
Q4 - Performance Materials: A strong quarter
[€ m] Q4 2013 Q4 2014 Comments
Sales
Marketing and selling
Admin
R&D
EBIT
EBITDA
EBITDA pre
Margin (% of sales)
576
-50
-15
-48
170
229
239
41.6%
Sales jump on portfolio effect, strong organic growth & FX tailwinds
Volume growth in Liquid Crystals remains largest contributor to
organic performance
Strong demand for ultra-high-definition TV’s (PS-VA) and mobile
devices (IPS & UB-FFS) key success factor
Significant EBITDA pre increase driven by AZ and strong
organic growth
EBITDA pre margin reflects mix effect from AZ
Performance
Materials19%
XXX
Q4 2014 share of group salesSales bridge
383
-36
-6
-37
134
155
167
43.5%
Q4 2013 Organic Currency Portfolio Q4 2014
6.9% 5.8%37.5%
€383 m€576 m

XXX XXX
XXX
25
Q4 - Merck Millipore: Process Solutions drives growth
[€ m] Q4 2013 Q4 2014 Comments
706
-231
-30
-43
55
135
163
23.0%
Good organic growth and FX, slightly offset by portfolio changes
Strong demand from biopharma industry for single-use equipment
and purification consumables drives growth at Process Solutions
Lab Solutions with good performance from price and volume
uptakes especially in lab water consumables
Bioscience almost flat as good development of separation and
preparation products is offset by low demand for antibodies
EBITDA pre affected by investments in marketing and selling,
higher LTIP* provisions and unfavorable product mix
Q4 2013 Organic Currency Portfolio Q4 2014
5.9% 3.4% -1.2%€654 m €706 mMerck
Millipore24%
Sales
Marketing and selling
Admin
R&D
EBIT
EBITDA
EBITDA pre
Margin (% of sales)
Sales bridge Q4 2014 share of group sales
654
-206
-25
-38
51
145
168
25.7%
*Long Term Incentive Plan
26
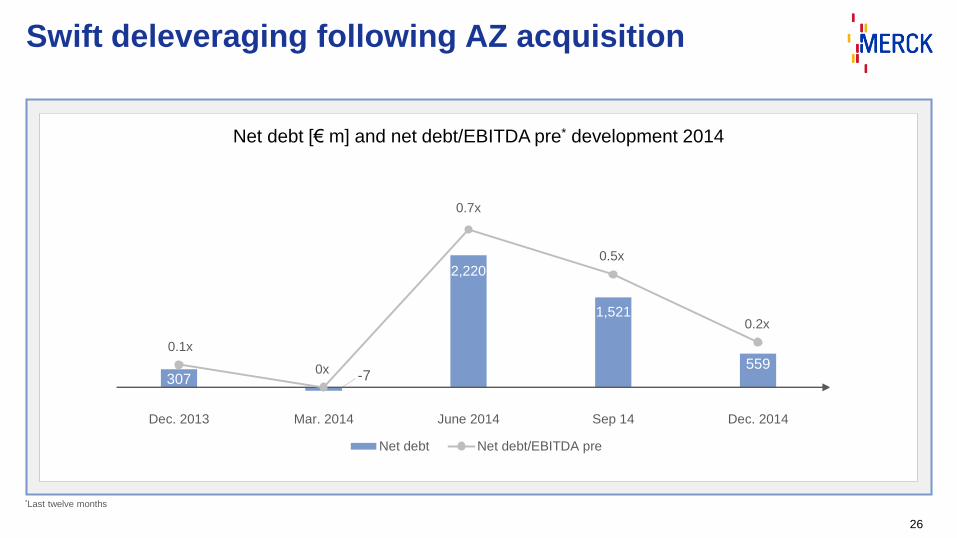
Swift deleveraging following AZ acquisition
0
0,2
0,4
0,6
0,8
0
1
2
3
Dec. 2013 Mar. 2014 June 2014 Sep 14 Dec. 2014
Net debt Net debt/EBITDA pre
[€ bn]
Net debt [€ m] and net debt/EBITDA pre* development 2014
0.8
0.1x
0.7x
0x
0
0.5x
0.2x
2,220
1,521
559307 -7
*Last twelve months

27
Balance sheet: Reflecting strategic M&A moves
Balance sheet reflects AZ acquisition and Pfizer collaboration
Issuance of hybrid bond impacts cash and debt
Provisions for pensions up due to lower interest rates
FX development accounts for ~€1 bn total balance sheet increase
Totals may not add up due to rounding
1.4 2.62.6
3.0
9.9
11.4
1.5
1.72.0
2.23,4
5,1
Dec. 31 2013 Dec. 31 2014
Intangible assets
Inventories
Other assets
Property, plant & equipment
Receivables
Cash & marketable securities
Net equity
20.8
26.0
20.8
26.0Assets [€ bn] Liabilities [€ bn]
Financial debt
Provisions for pensions / other
Other liabilities
Payables
3.85.2
0.9
1.81.4
1.5 3.7
5.6
11.1
11.8
Dec. 31 2013Dec. 31 2014
28
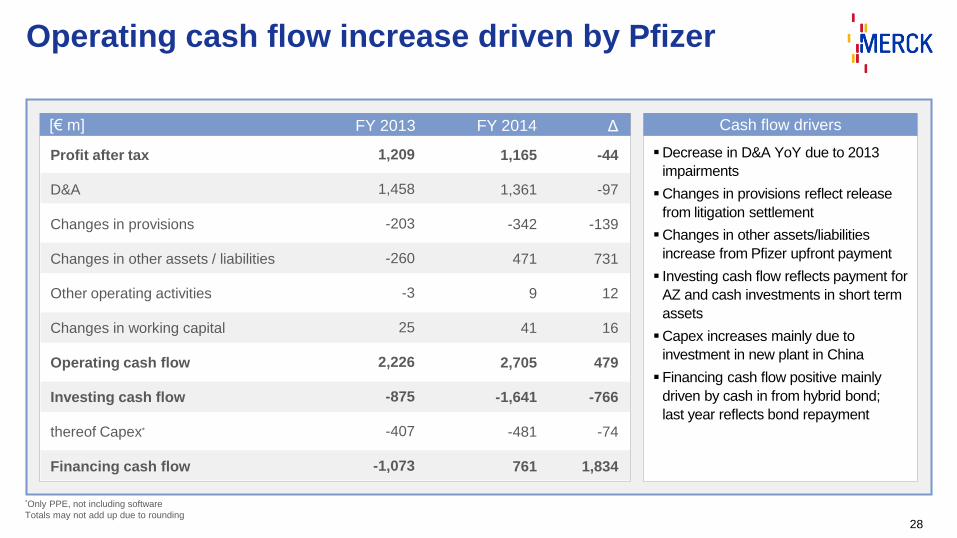
Operating cash flow increase driven by Pfizer
*Only PPE, not including software
Totals may not add up due to rounding
Decrease in D&A YoY due to 2013
impairments
Changes in provisions reflect release
from litigation settlement
Changes in other assets/liabilities
increase from Pfizer upfront payment
Investing cash flow reflects payment for
AZ and cash investments in short term
assets
Capex increases mainly due to
investment in new plant in China
Financing cash flow positive mainly
driven by cash in from hybrid bond;
last year reflects bond repayment
Cash flow drivers[€ m]
Profit after tax
D&A
Changes in provisions
Changes in other assets / liabilities
Other operating activities
Changes in working capital
Operating cash flow
Investing cash flow
thereof Capex*
Financing cash flow
1,165
1,361
-342
471
9
41
2,705
-1,641
-481
761
-44
-97
-139
731
12
16
479
-766
-74
1,834
ΔFY 2014
1,209
1,458
-203
-260
-3
25
2,226
-875
-407
-1,073
FY 2013

Executive overview
Strategy update
Financial review
Outlook and guidance
Agenda
30
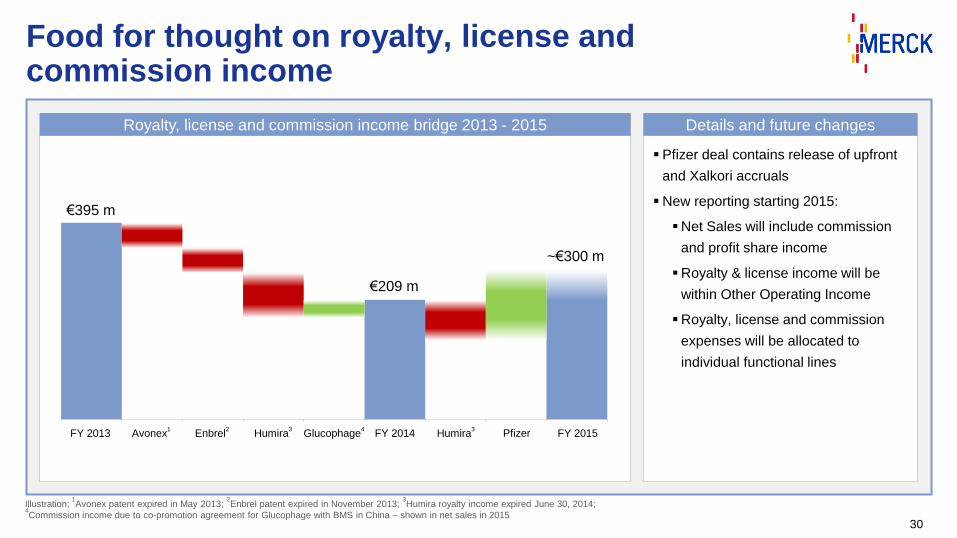
Food for thought on royalty, license and commission income
Royalty, license and commission income bridge 2013 - 2015
Pfizer deal contains release of upfront
and Xalkori accruals
New reporting starting 2015:
Net Sales will include commission
and profit share income
Royalty & license income will be
within Other Operating Income
Royalty, license and commission
expenses will be allocated to
individual functional lines
Details and future changes
€395 m
€209 m
~€300 m
FY 2013 Avonex1
Enbrel2
Humira3
Glucophage4
FY 2014 Humira3
FY 2015
Illustration;1Avonex patent expired in May 2013;
2Enbrel patent expired in November 2013;
3Humira royalty income expired June 30, 2014;
4Commission income due to co-promotion agreement for Glucophage with BMS in China – shown in net sales in 2015
Pfizer
31
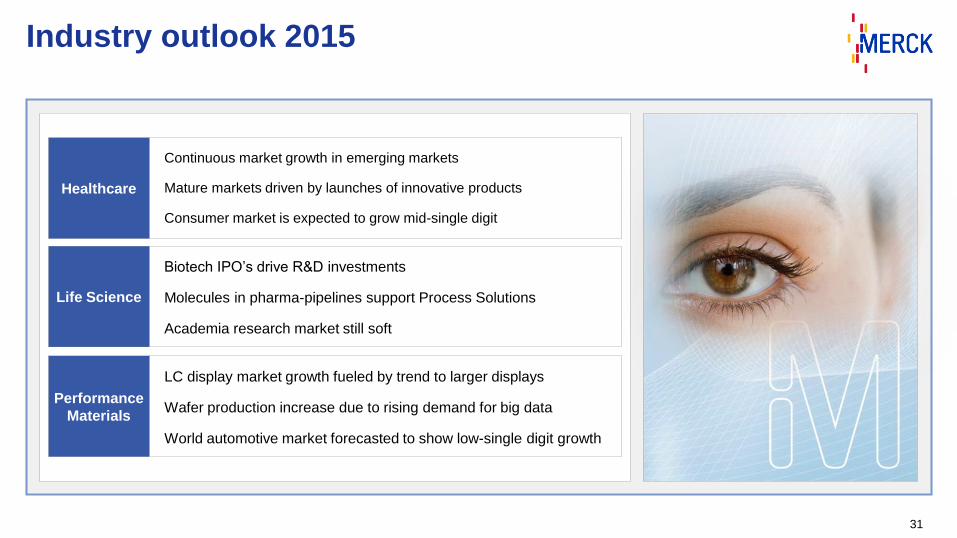
Industry outlook 2015
Continuous market growth in emerging markets
Mature markets driven by launches of innovative products
Consumer market is expected to grow mid-single digit
Healthcare
LC display market growth fueled by trend to larger displays
Wafer production increase due to rising demand for big data
World automotive market forecasted to show low-single digit growth
Biotech IPO’s drive R&D investments
Molecules in pharma-pipelines support Process Solutions
Academia research market still soft
Life Science
Performance
Materials
32
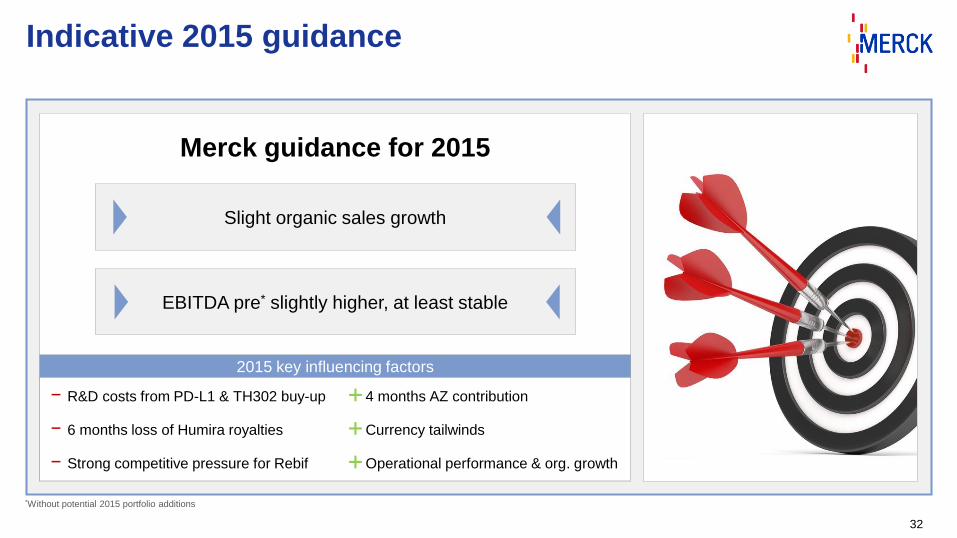
Indicative 2015 guidance
Slight organic sales growth
EBITDA pre* slightly higher, at least stable
2015 key influencing factors
Merck guidance for 2015
- R&D costs from PD-L1 & TH302 buy-up
- 6 months loss of Humira royalties
- Strong competitive pressure for Rebif
4 months AZ contribution
Currency tailwinds
Operational performance & org. growth
*Without potential 2015 portfolio additions

33
Business sector guidance
Healthcare Life Science Performance Materials
Organically stable top line
Rebif decline
Growth in other franchises
EBITDA pre slightly lower
Moderate organic sales growth
Process solutions key growth contributor
Moderate EBITDA pre increase
Slight organic growth
Strong AZ portfolio effect
leads to low double-digit
EBITDA pre increase
Merck Group 2015: EBITDA pre* slightly higher - at least stable Slight organic sales growth
*Without potential 2015 portfolio additions

Appendix
36
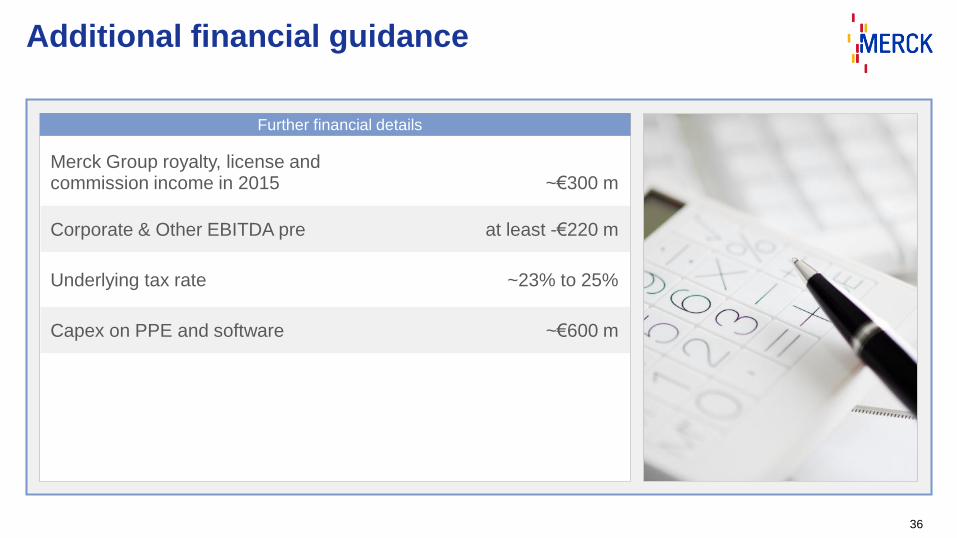
Additional financial guidance
Further financial details
Merck Group royalty, license and commission income in 2015
Corporate & Other EBITDA pre
Underlying tax rate
Capex on PPE and software
~€300 m
at least -€220 m
~23% to 25%
~€600 m

37
Underlying tax rate remains unchanged
Tax rate development 2009-2014
Underlying tax rate of 23 - 25%
due to beneficial tax rulings in
several countries
2012 and 2013 contained one-time
effects and exceptional tax gains
24% rate basis for EPS pre calculation
since Q1 2014
Tax rate rationale
Underlying tax rate
guidance of 23 to 25%
Previous range ~25 - 26% Current underlying
range ~23 - 25%
Reported tax rate
23%26% 26%
18%
13%
25%
00%
10%
20%
30%
40%
2009 2010 2011 2012 2013 2014 2015E
38
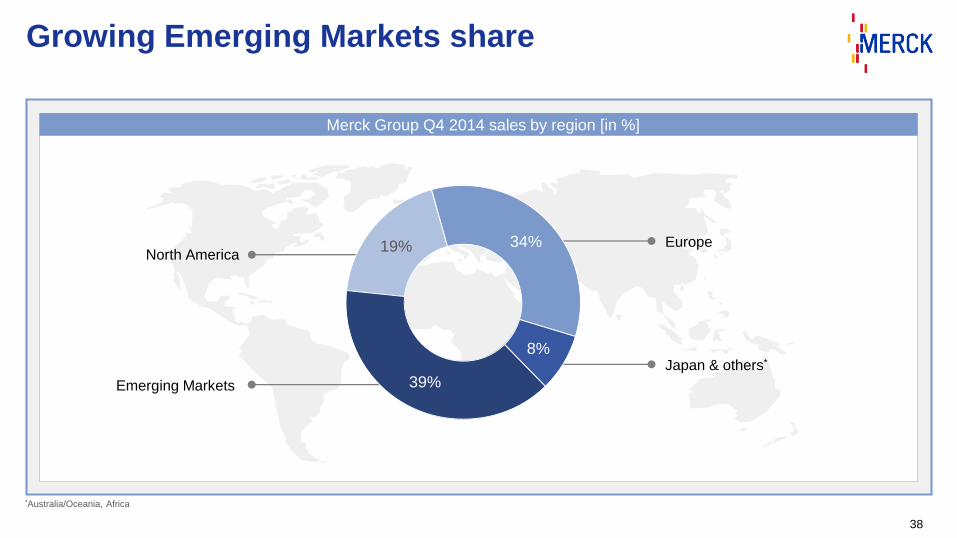
Growing Emerging Markets share
Merck Group Q4 2014 sales by region [in %]
*Australia/Oceania, Africa
Emerging Markets
North AmericaEurope
Japan & others*
19% 34%
8%
39%
39
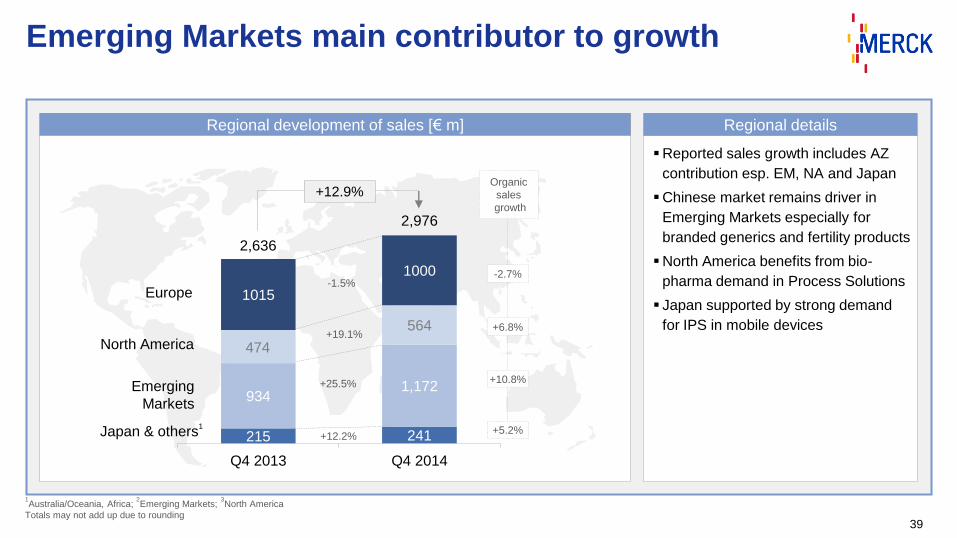
Emerging Markets main contributor to growth
Reported sales growth includes AZ
contribution esp. EM, NA and Japan
Chinese market remains driver in
Emerging Markets especially for
branded generics and fertility products
North America benefits from bio-
pharma demand in Process Solutions
Japan supported by strong demand
for IPS in mobile devices
Regional detailsRegional development of sales [€ m]
2,636
2,976
Japan & others1
Organic
sales
growth
-2.7%
+5.2%
+10.8%
+6.8%
Europe
North America
Emerging
Markets
+12.9%
-1.5%
+19.1%
+25.5%
+12.2%
1Australia/Oceania, Africa;
2Emerging Markets;
3North America
Totals may not add up due to rounding
215 241
9341,172
564
1015
1000
Q4 2013 Q4 2014
474

EBITDA preQ4 2013
MerckSerono
ConsumerHealth
PerformanceMaterials
MerckMillipore
Corporate &Other
EBITDA preQ4 2014
40
All divisions post organic growth, currency headwinds soften
Portfolio reflects the acquisition of
AZ Electronic Materials
Currency tailwinds mainly
driven by EUR/USD development
Q4 YoY sales Organic Currency Portfolio Total
Merck Serono 2.8% 2.7% 0.0% 5.5%
Consumer Health 6.5% 2.7% 0.0% 9.2%
Performance Materials 6.9% 5.8% 37.5% 50.2%
Merck Millipore 5.9% 3.4% -1.2% 8.1%
Merck Group 4.4% 3.3% 5.2% 12.9%
795 +17 -1 +73 -5 0 878
Q4 YoY EBITDA pre contributors [€ m] Performance Materials includes
strong organic performance and AZ
Hedging gains this quarter are leveled
out by higher gains last year (Δ ~€-6m)
Totals may not add up due to rounding
[€ m]
41
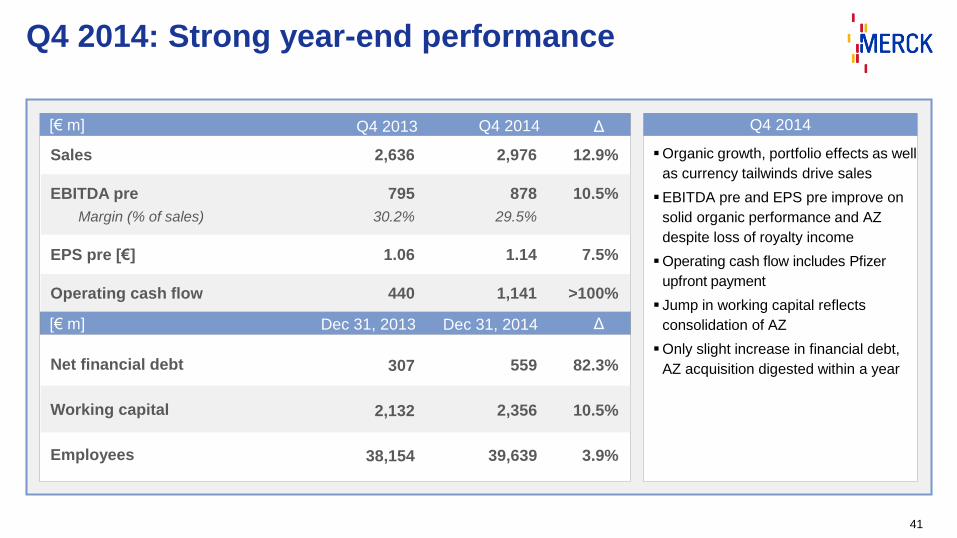
Q4 2014: Strong year-end performance
Organic growth, portfolio effects as well
as currency tailwinds drive sales
EBITDA pre and EPS pre improve on
solid organic performance and AZ
despite loss of royalty income
Operating cash flow includes Pfizer
upfront payment
Jump in working capital reflects
consolidation of AZ
Only slight increase in financial debt,
AZ acquisition digested within a year
Q4 2014[€ m]
Sales
EBITDA pre
Margin (% of sales)
EPS pre [€]
Operating cash flow
2,636
795
30.2%
1.06
440
2,976
878
29.5%
1.14
1,141
12.9%
10.5%
7.5%
>100%
ΔQ4 2014
Δ
Q4 2013
Dec 31, 2014Dec 31, 2013
Net financial debt
Working capital
Employees
559
2,356
39,639
82.3%
10.5%
3.9%
307
2,132
38,154
42
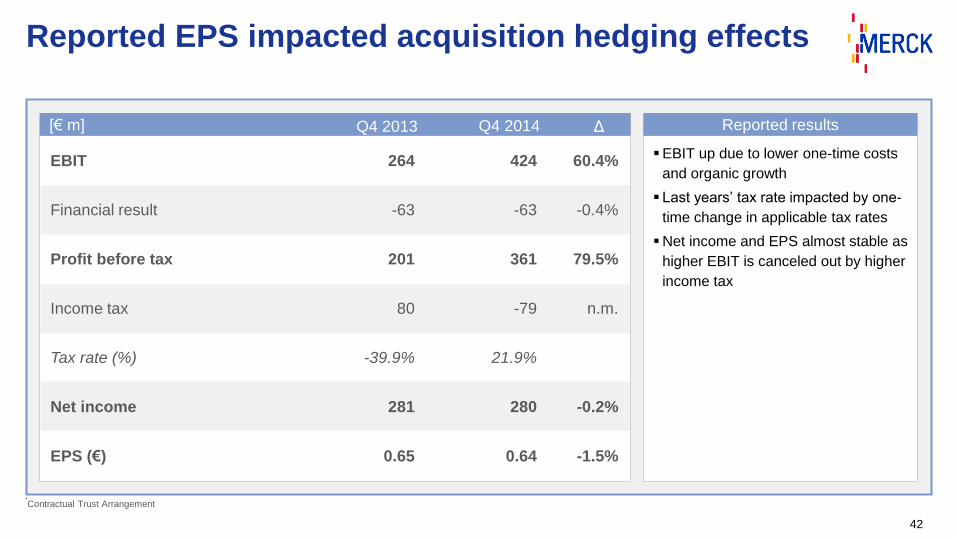
Reported EPS impacted acquisition hedging effects
EBIT up due to lower one-time costs
and organic growth
Last years’ tax rate impacted by one-
time change in applicable tax rates
Net income and EPS almost stable as
higher EBIT is canceled out by higher
income tax
Reported results[€ m]
EBIT
Financial result
Profit before tax
Income tax
Tax rate (%)
Net income
EPS (€)
264
-63
201
80
-39.9%
281
0.65
424
-63
361
-79
21.9%
280
0.64
60.4%
-0.4%
79.5%
n.m.
-0.2%
-1.5%
ΔQ4 2014Q4 2013
*Contractual Trust Arrangement
XXX
43
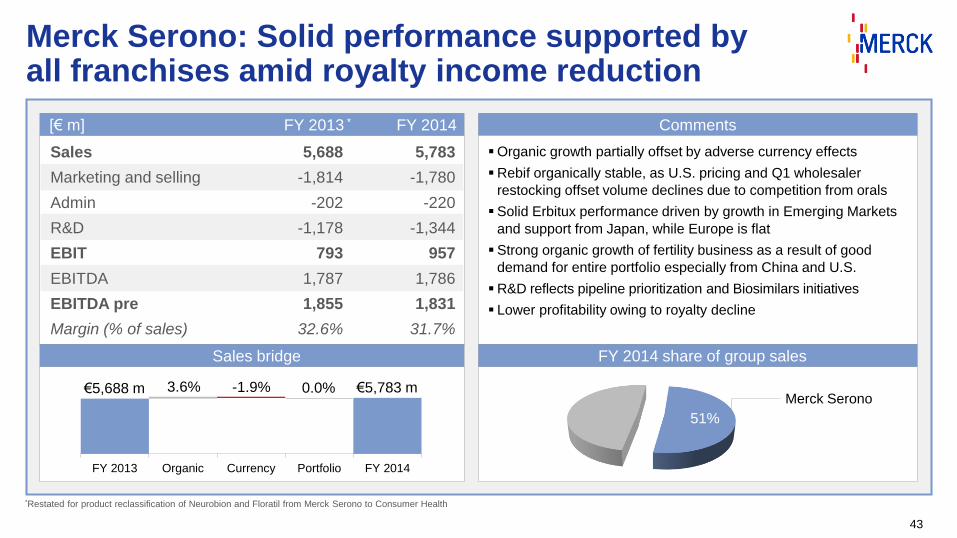
Merck Serono: Solid performance supported by all franchises amid royalty income reduction
[€ m] FY 2013 * FY 2014 Comments
Sales
Marketing and selling
Admin
R&D
EBIT
EBITDA
EBITDA pre
Margin (% of sales)
5,688
-1,814
-202
-1,178
793
1,787
1,855
32.6%
5,783
-1,780
-220
-1,344
957
1,786
1,831
31.7%
XXX XXX
Organic growth partially offset by adverse currency effects
Rebif organically stable, as U.S. pricing and Q1 wholesaler
restocking offset volume declines due to competition from orals
Solid Erbitux performance driven by growth in Emerging Markets
and support from Japan, while Europe is flat
Strong organic growth of fertility business as a result of good
demand for entire portfolio especially from China and U.S.
R&D reflects pipeline prioritization and Biosimilars initiatives
Lower profitability owing to royalty decline
51%
Merck Serono
Sales bridge FY 2014 share of group sales
*Restated for product reclassification of Neurobion and Floratil from Merck Serono to Consumer Health
FY 2013 Organic Currency Portfolio FY 2014
3.6% -1.9% 0.0%€5,688 m €5,783 m
XXX XXX
44
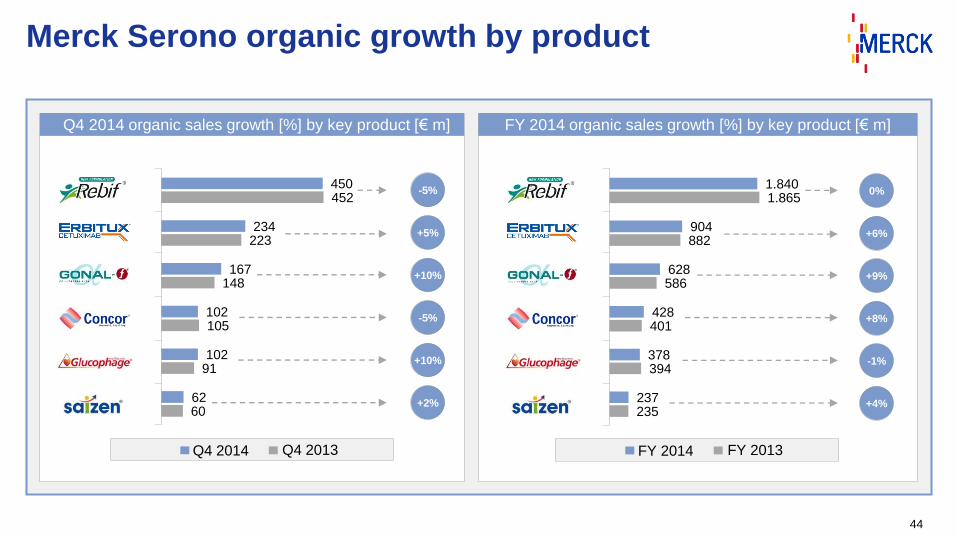
Merck Serono organic growth by product
Q4 2014 organic sales growth [%] by key product [€ m] FY 2014 organic sales growth [%] by key product [€ m]
Q4 2014 Q4 2013
60
91
105
148
223
452
62
102
102
167
234
450
FY 2014 FY 2013
235
394
401
586
882
1.865
237
378
428
628
904
1.840-5%
+5%
+10%
-5%
+10%
+2%
0%
+6%
+9%
+8%
-1%
+4%
100
150
200
Q4 2013 Q1 2014 Q2 2014 Q3 2014 Q4 2014
150
225
300
Q4 2013 Q1 2014 Q2 2014 Q3 2014 Q4 2014
Price
increase
45
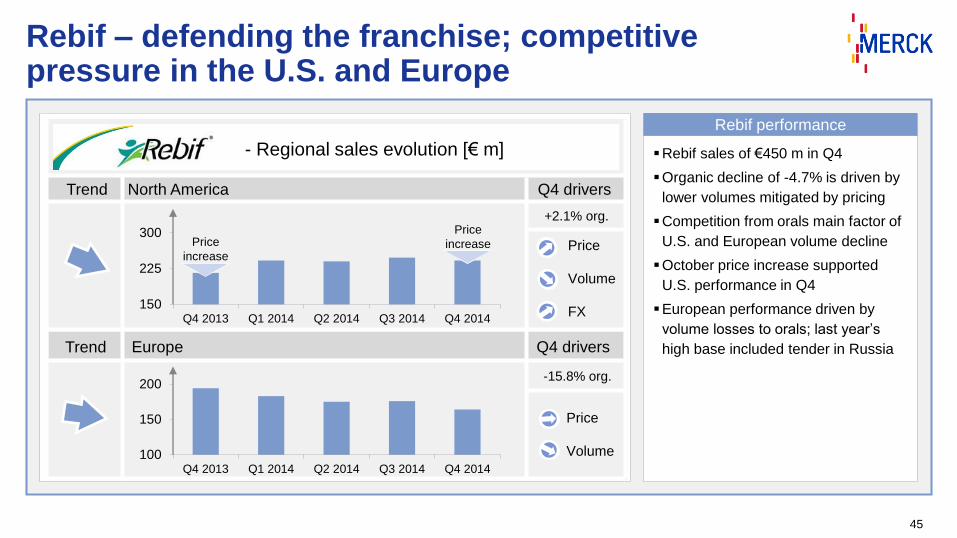
Rebif – defending the franchise; competitive pressure in the U.S. and Europe
Rebif sales of €450 m in Q4
Organic decline of -4.7% is driven by
lower volumes mitigated by pricing
Competition from orals main factor of
U.S. and European volume decline
October price increase supported
U.S. performance in Q4
European performance driven by
volume losses to orals; last year’s
high base included tender in Russia
Rebif performance
Trend North America Q4 drivers
- Regional sales evolution [€ m]
Trend Europe
Price
increase Price
Volume
FX
Price
Volume
Q4 drivers
+2.1% org.
-15.8% org.
46
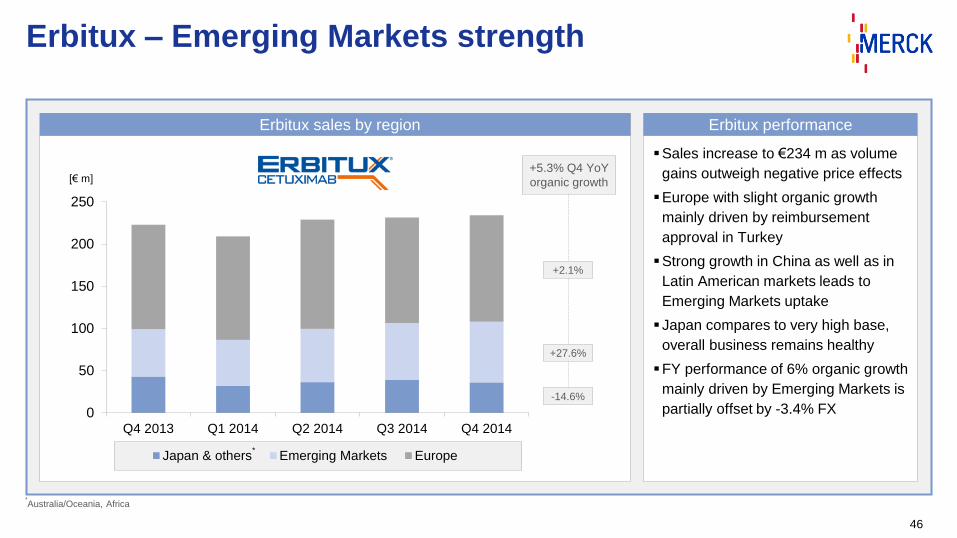
Erbitux – Emerging Markets strength
Sales increase to €234 m as volume
gains outweigh negative price effects
Europe with slight organic growth
mainly driven by reimbursement
approval in Turkey
Strong growth in China as well as in
Latin American markets leads to
Emerging Markets uptake
Japan compares to very high base,
overall business remains healthy
FY performance of 6% organic growth
mainly driven by Emerging Markets is
partially offset by -3.4% FX
Erbitux performanceErbitux sales by region
[€ m]+5.3% Q4 YoY
organic growth
+2.1%
-14.6%
+27.6%
*Australia/Oceania, Africa
*
0
50
100
150
200
250
Q4 2013 Q1 2014 Q2 2014 Q3 2014 Q4 2014
Japan & others Emerging Markets Europe
47
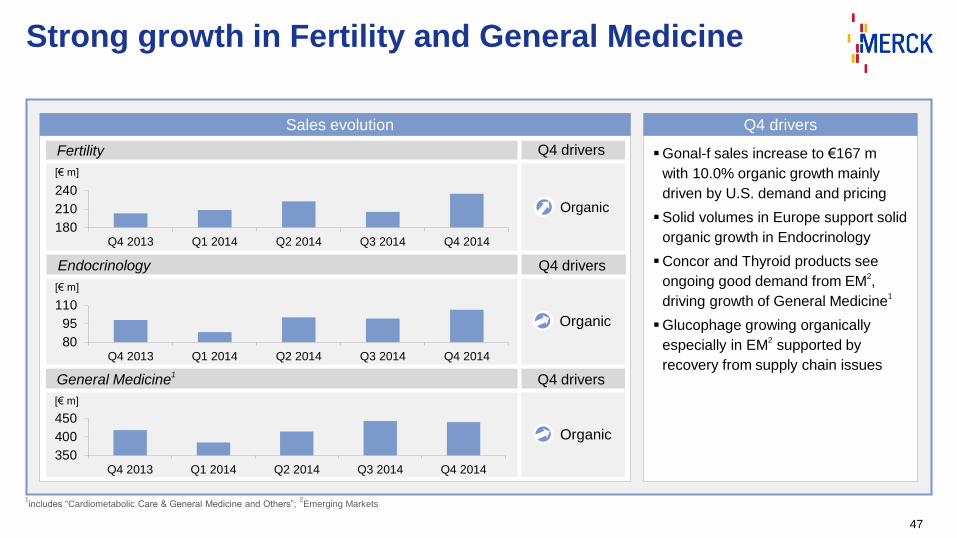
Strong growth in Fertility and General Medicine
Gonal-f sales increase to €167 m
with 10.0% organic growth mainly
driven by U.S. demand and pricing
Solid volumes in Europe support solid
organic growth in Endocrinology
Concor and Thyroid products see
ongoing good demand from EM2,
driving growth of General Medicine1
Glucophage growing organically
especially in EM2
supported by
recovery from supply chain issues
Q4 driversSales evolution
Organic
Fertility Q4 drivers
180
210
240
Q4 2013 Q1 2014 Q2 2014 Q3 2014 Q4 2014
[€ m]
Endocrinology Q4 drivers
80
95
110
Q4 2013 Q1 2014 Q2 2014 Q3 2014 Q4 2014
[€ m]
General Medicine1
Q4 drivers
350
400
450
Q4 2013 Q1 2014 Q2 2014 Q3 2014 Q4 2014
[€ m]
Organic
Organic
1includes “Cardiometabolic Care & General Medicine and Others”;
2Emerging Markets
48
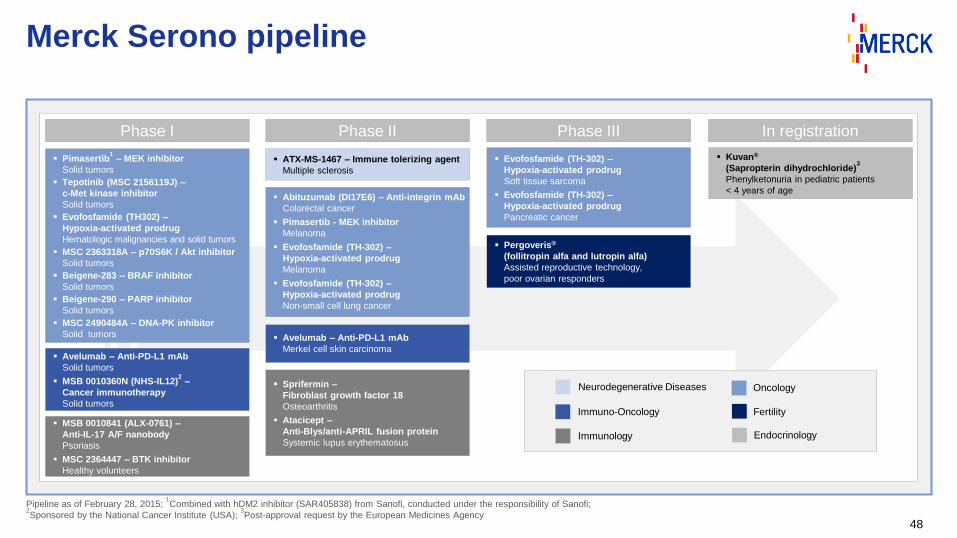
Merck Serono pipeline
Pipeline as of February 28, 2015; 1Combined with hDM2 inhibitor (SAR405838) from Sanofi, conducted under the responsibility of Sanofi;
2Sponsored by the National Cancer Institute (USA);
3Post-approval request by the European Medicines Agency
Neurodegenerative Diseases Oncology
Immuno-Oncology
EndocrinologyImmunology
Phase I Phase II Phase III In registration
ATX-MS-1467 – Immune tolerizing agent
Multiple sclerosis
Pimasertib1
– MEK inhibitor
Solid tumors
Tepotinib (MSC 2156119J) –
c-Met kinase inhibitor
Solid tumors
Evofosfamide (TH302) –
Hypoxia-activated prodrug
Hematologic malignancies and solid tumors
MSC 2363318A – p70S6K / Akt inhibitor
Solid tumors
Beigene-283 – BRAF inhibitor
Solid tumors
Beigene-290 – PARP inhibitor
Solid tumors
MSC 2490484A – DNA-PK inhibitor
Solid tumors
Avelumab – Anti-PD-L1 mAb
Solid tumors
MSB 0010360N (NHS-IL12)2
–
Cancer immunotherapy
Solid tumors
Abituzumab (DI17E6) – Anti-integrin mAb
Colorectal cancer
Pimasertib - MEK inhibitor
Melanoma
Evofosfamide (TH-302) –
Hypoxia-activated prodrug
Melanoma
Evofosfamide (TH-302) –
Hypoxia-activated prodrug
Non-small cell lung cancer
Sprifermin –
Fibroblast growth factor 18
Osteoarthritis
Atacicept –
Anti-Blys/anti-APRIL fusion protein
Systemic lupus erythematosus
Avelumab – Anti-PD-L1 mAb
Merkel cell skin carcinoma
MSB 0010841 (ALX-0761) –
Anti-IL-17 A/F nanobody
Psoriasis
MSC 2364447 – BTK inhibitor
Healthy volunteers
Kuvan®
(Sapropterin dihydrochloride)3
Phenylketonuria in pediatric patients
< 4 years of age
Evofosfamide (TH-302) –
Hypoxia-activated prodrug
Soft tissue sarcoma
Evofosfamide (TH-302) –
Hypoxia-activated prodrug
Pancreatic cancer
Pergoveris®
(follitropin alfa and lutropin alfa)
Assisted reproductive technology,
poor ovarian responders
Fertility
XXX XXX
XXX
49
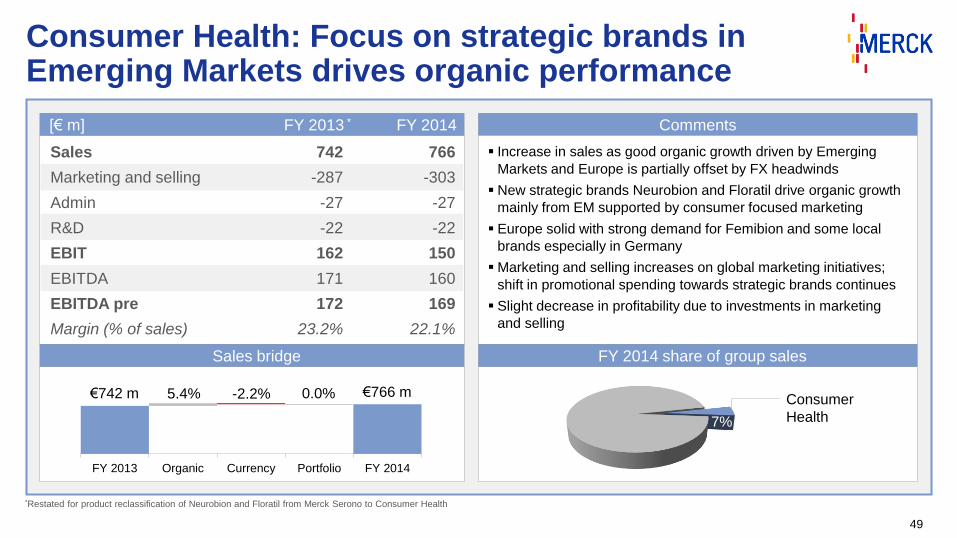
Consumer Health: Focus on strategic brands in Emerging Markets drives organic performance
[€ m] FY 2013 * FY 2014 Comments
Sales
Marketing and selling
Admin
R&D
EBIT
EBITDA
EBITDA pre
Margin (% of sales)
742
-287
-27
-22
162
171
172
23.2%
766
-303
-27
-22
150
160
169
22.1%
Increase in sales as good organic growth driven by Emerging
Markets and Europe is partially offset by FX headwinds
New strategic brands Neurobion and Floratil drive organic growth
mainly from EM supported by consumer focused marketing
Europe solid with strong demand for Femibion and some local
brands especially in Germany
Marketing and selling increases on global marketing initiatives;
shift in promotional spending towards strategic brands continues
Slight decrease in profitability due to investments in marketing
and selling
FY 2013 Organic Currency Portfolio FY 2014
5.4% -2.2% 0.0%€742 m €766 mConsumer
Health7%
Sales bridge FY 2014 share of group sales
*Restated for product reclassification of Neurobion and Floratil from Merck Serono to Consumer Health

XXX
XXX
50
Performance Materials: Growth fueled by display industry trends
[€ m] FY 2013 FY 2014 Comments
Sales
Marketing and selling
Admin
R&D
EBIT
EBITDA
EBITDA pre
Margin (% of sales)
1,642
-152
-28
-145
653
766
780
47.5%
2,060
-178
-56
-171
611
804
895
43.4%
Sales increase as good organic growth and portfolio effects from
AZ are slightly offset by negative FX effects
Liquid Crystals flagship technologies (IPS & PS-VA) see ongoing
good demand
Pigments with slight organic growth owing to good demand for
Xirallic products from coating industry
Cost base reflects portfolio effects from AZ
Increase in EBITDA pre contains organic growth and AZ
EBITDA pre margin reflects mix effect from AZ
Performance
Materials18%
XXX
FY 2013 Organic Currency Portfolio FY 2014
4.1% -1.5%22.8%
€1,642 m€2,060 m
FY 2014 share of group salesSales bridge
XXX XXX
XXX
51
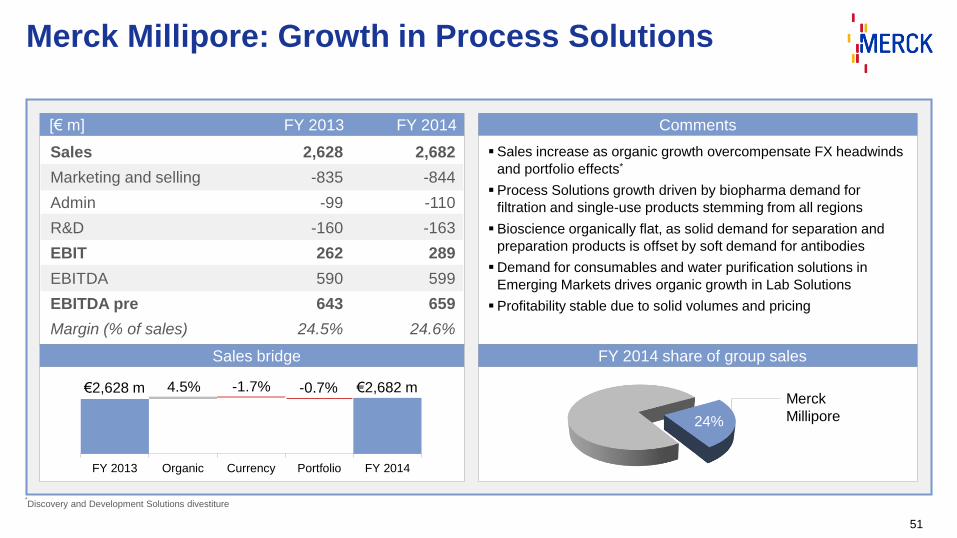
Merck Millipore: Growth in Process Solutions
[€ m] FY 2013 FY 2014 Comments
2,628
-835
-99
-160
262
590
643
24.5%
2,682
-844
-110
-163
289
599
659
24.6%
Sales increase as organic growth overcompensate FX headwinds
and portfolio effects*
Process Solutions growth driven by biopharma demand for
filtration and single-use products stemming from all regions
Bioscience organically flat, as solid demand for separation and
preparation products is offset by soft demand for antibodies
Demand for consumables and water purification solutions in
Emerging Markets drives organic growth in Lab Solutions
Profitability stable due to solid volumes and pricing
FY 2013 Organic Currency Portfolio FY 2014
4.5% -1.7% -0.7%€2,628 m €2,682 mMerck
Millipore24%
Sales
Marketing and selling
Admin
R&D
EBIT
EBITDA
EBITDA pre
Margin (% of sales)
Sales bridge FY 2014 share of group sales
*Discovery and Development Solutions divestiture
52
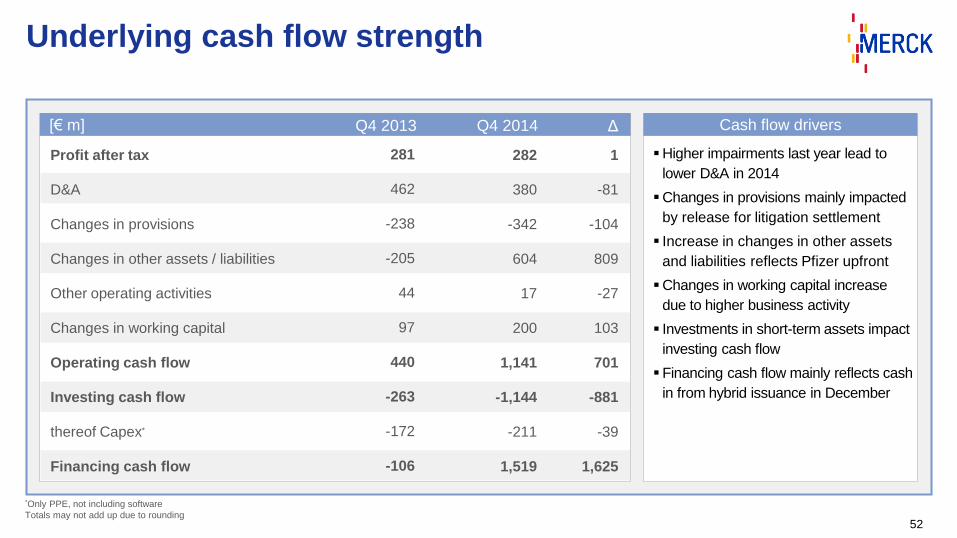
Underlying cash flow strength
Higher impairments last year lead to
lower D&A in 2014
Changes in provisions mainly impacted
by release for litigation settlement
Increase in changes in other assets
and liabilities reflects Pfizer upfront
Changes in working capital increase
due to higher business activity
Investments in short-term assets impact
investing cash flow
Financing cash flow mainly reflects cash
in from hybrid issuance in December
Cash flow drivers[€ m]
Profit after tax
D&A
Changes in provisions
Changes in other assets / liabilities
Other operating activities
Changes in working capital
Operating cash flow
Investing cash flow
thereof Capex*
Financing cash flow
282
380
-342
604
17
200
1,141
-1,144
-211
1,519
1
-81
-104
809
-27
103
701
-881
-39
1,625
ΔQ4 2014
281
462
-238
-205
44
97
440
-263
-172
-106
Q4 2013
*Only PPE, not including software
Totals may not add up due to rounding
53
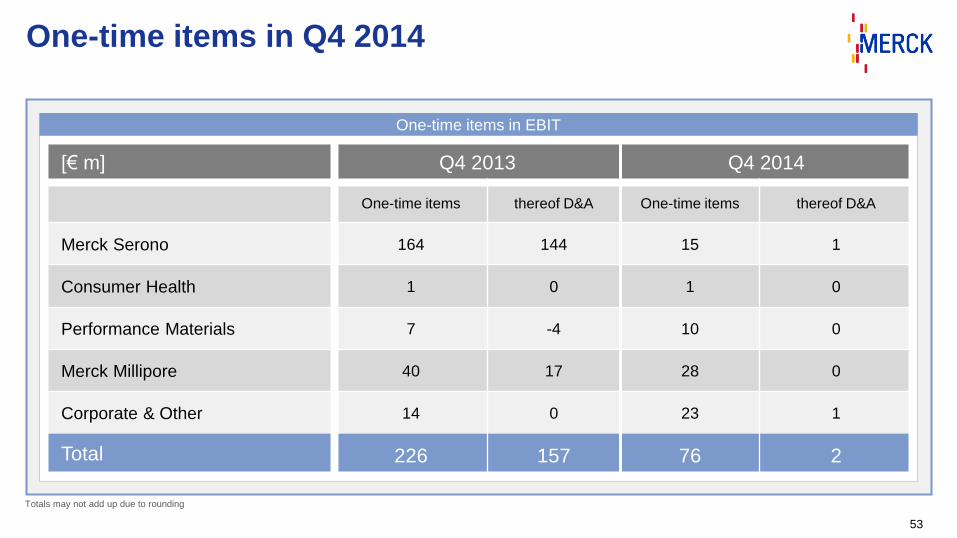
One-time items in Q4 2014
One-time items in EBIT
[€ m] Q4 2013 Q4 2014
One-time items thereof D&A One-time items thereof D&A
Merck Serono 164 144 15 1
Consumer Health 1 0 1 0
Performance Materials 7 -4 10 0
Merck Millipore 40 17 28 0
Corporate & Other 14 0 23 1
Total 226 157 76 2
Totals may not add up due to rounding

54
One-time items in FY 2014
One-time items in EBIT
[€ m] FY 2013 FY 2014
One-time items thereof D&A One-time items thereof D&A
Merck Serono 258 189 50 5
Consumer Health 1 0 9 0
Performance Materials 10 -4 91 0
Merck Millipore 70 17 60 0
Corporate & Other 47 0 65 5
Total 387 203 275 10
Totals may not add up due to rounding

55
New allocation of royalty, license and commissionincome and expenses
2014 P&L structure New 2015 P&L structure
Sales
Royalty, license and commission income
Commission income
Royalty & license income
Revenues
Cost of Sales
Gross profit
Marketing & selling expenses
Royalty, license and commission expenses
Commission expenses
Royalty & license expenses
Administration expenses
Other operating expenses/income
Research & development expenses
EBIT
Net sales
Royalty, license and commission income
Commission income
Royalty & license income
Revenues
Cost of Sales
Gross profit
Marketing & selling expenses
Royalty, license and commission expenses
Commission expenses
Royalty & license expenses
Administration expenses
Other operating expenses/income
Research & development expenses
EBIT
56
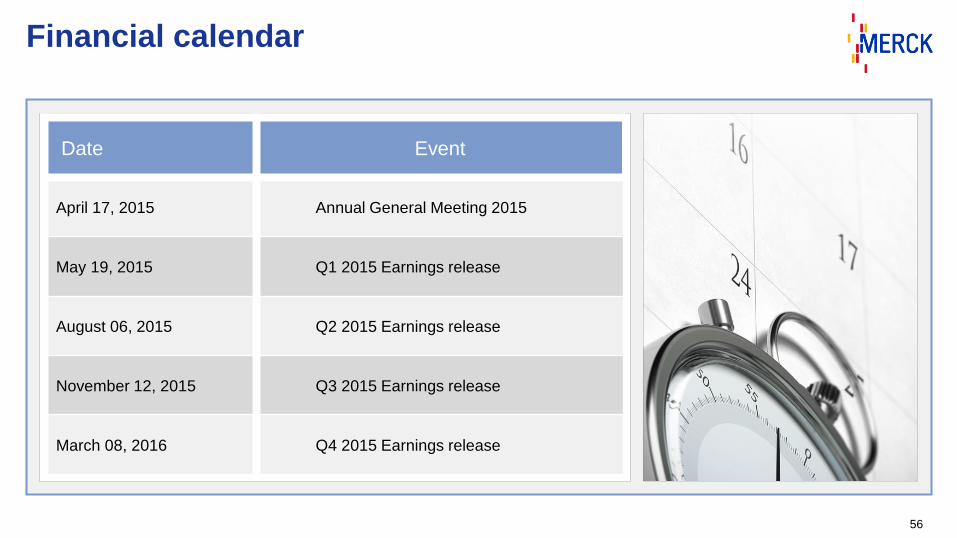
Financial calendar
Date Event
April 17, 2015 Annual General Meeting 2015
May 19, 2015 Q1 2015 Earnings release
August 06, 2015 Q2 2015 Earnings release
November 12, 2015 Q3 2015 Earnings release
March 08, 2016 Q4 2015 Earnings release
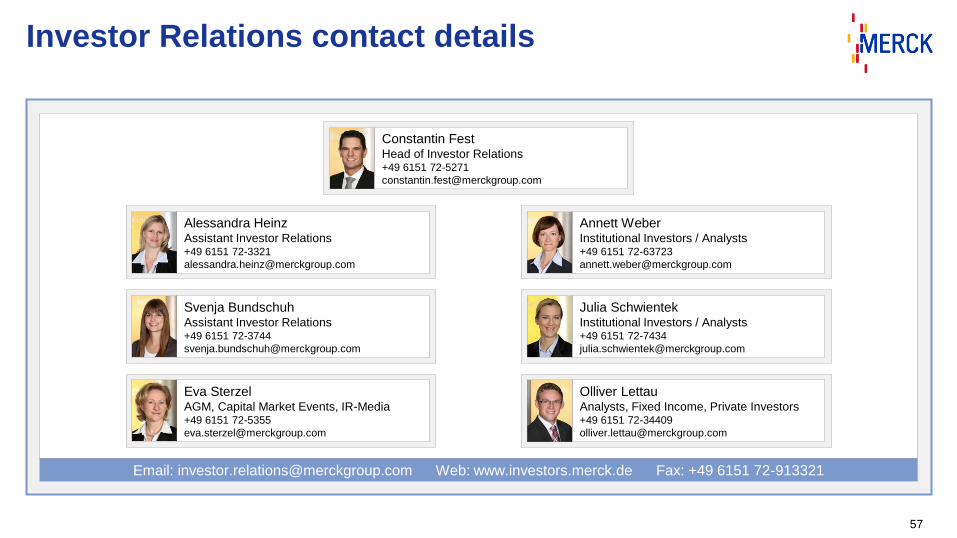
Email: [email protected] Web: www.investors.merck.de Fax: +49 6151 72-913321
57
Investor Relations contact details
Constantin FestHead of Investor Relations+49 6151 72-5271
Alessandra HeinzAssistant Investor Relations+49 6151 72-3321
Svenja BundschuhAssistant Investor Relations +49 6151 72-3744
Eva SterzelAGM, Capital Market Events, IR-Media +49 6151 72-5355
Annett WeberInstitutional Investors / Analysts +49 6151 72-63723
Julia SchwientekInstitutional Investors / Analysts +49 6151 72-7434
Olliver LettauAnalysts, Fixed Income, Private Investors+49 6151 72-34409


![Q4 FY 2016 Earnings Conference Call [Company Update]](https://img.pdfslide.us/doc/110x75/577c7a6b1a28abe054951e7e/q4-fy-2016-earnings-conference-call-company-update.jpg)