Embed Size (px)
Citation preview

16 April 2013
FY 2012-13
Financial Results

2 www.ril.com
Forward Looking Statements
This presentation contains forward-looking statements which may be identified
by their use of words like “plans,” “expects,” “will,” “anticipates,” “believes,”
“intends,” “projects,” “estimates” or other words of similar meaning. All
statements that address expectations or projections about the future,
including, but not limited to, statements about the strategy for growth, product
development, market position, expenditures, and financial results, are forward-
looking statements.
Forward-looking statements are based on certain assumptions and
expectations of future events. The companies referred to in this presentation
cannot guarantee that these assumptions and expectations are accurate or
will be realized. The actual results, performance or achievements, could thus
differ materially from those projected in any such forward-looking statements.
These companies assume no responsibility to publicly amend, modify or
revise any forward looking statements, on the basis of any subsequent
developments, information or events, or otherwise.

3 www.ril.com
FY 2012-13 : Corporate Highlights
Record performance for FY13: Net Profit of ` 21,003 crore, up 4.8% on Y-o-Y basis
Strong performance: 4Q FY13 net profit of ` 5,589 crore, up 31.9% on Y-o-Y basis
and up 1.6% on Q-o-Q basis
Progress on new projects – technology tie-ups signed for:
ROGC – Technip
Coke gasification – Phillips 66
PX – Lummus
Most petrochemical products including Polyester, Polymers and Chemical products
RIL-SIBUR JV : construction work began for new butyl rubber plant
Signed a 15 year heavy crude oil supply contract with PDVSA
MOU to further development of Venezuelan heavy oil fields
KG-D6 : FDP for the R-Series submitted for approval
RIL awarded the prestigious 'International Refiner of the Year' 2013 by HART Energy,
USA
Completed India’s largest share buy-back programme : 46.2 Mn shares with an
aggregate amount of ` 3,366 crore

4 www.ril.com
FY 2012-13 : Performance Highlights
Highest ever revenues, record exports
Turnover increased by 9.2% to ` 371,119 crore ($ 68.4 billion)
PBDIT decreased by 2.6% to ` 38,785 crore ($ 7.1 billion)
PBT increased by 2.1% to ` 26,284 crore ($ 4.8 billion)
Net profit increased by 4.8% to ` 21,003 crore ($ 3.9 billion).
Exports increased by 15% to ` 239,226 crore ($ 44.1billion)
Record crude throughput at 68.5 million tonnes and achieved an average GRM
of $ 9.2/bbl
Reliance Retail crosses ` 10,000 crore revenue mark – turns EBITDA positive
US shale: FY13 revenue and EBITDA at $ 616 million and $ 483 million
respectively, a Y-o-Y growth of 76% and 85% respectively
More than doubled US shale production during FY13 vs FY12 - production
volume at 118.5 BCFe, up 127%

5 www.ril.com
Financial Results

6 www.ril.com
Financial Results : FY 2012-13
Higher crude prices, record crude throughput and exchange rate resulted in
growth in turnover
PBDIT earnings and margin impacted by
reduction in oil & gas production
lower margin and volumes in petrochemical segment
Higher share of refining segment in the overall earnings mix
(in ` Crore) FY13 FY12 % Change
Turnover 371,119 339,792 9.2%
PBDIT 38,785 39,811 -2.6%
PBDIT Margin 10.5% 11.7%
Net Profit 21,003 20,040 4.8%
EPS (`) 64.8 61.2 5.9%

7 www.ril.com
Segment Results : FY13 vs FY12
Refining EBIT increased sharply due to higher GRM ($ 9.2/bbl vs. $ 8.6 /bbl)
and record crude throughput
Petrochemicals EBIT impacted due to weaker polyester margins and lower
volumes – partly offset by improved polymer margins
Sharp production decline resulting in lower EBIT for the upstream business
(in ` Crore) FY13 FY12 % change
Refining Volume Price
Revenues 333,774 294,734 13.2% 0.9% 12.4%
EBIT 12,788 9,654 32.5%
EBIT (% ) 3.8% 3.3%
Petrochemicals
Revenues 88,108 80,625 9.3% -1.3% 10.6%
EBIT 7,328 8,967 -18.3%
EBIT (% ) 8.3% 11.1%
Oil and Gas
Revenues 8,280 12,898 -35.8% -45.9% 10.1%
EBIT 2,887 5,250 -45.0%
EBIT (% ) 34.9% 40.7%
Sales Variance

8 www.ril.com
Financial Results : 4Q FY13
Strong performance in 4Q FY13 - net profit up 31.9% on a Y-o-Y basis driven
by strong improvement in refining margins ($ 10.1/bbl vs. $ 7.6/bbl)
Higher GRM on Q-o-Q basis resulting in 1.6% growth in net profit – partly
impacted by weakness in petrochemicals (polyester) margins
Improvement in PBDIT margin on Q-o-Q basis due lower turnover (base
effect) and on Y-o-Y basis on account of higher operating income
(in ` Crore) 4Q FY13 3Q FY13 4Q FY12% Change
4Q vs 3Q
% Change
4Q vs 4Q
Turnover 86,618 96,307 87,833 -10.1% -1.4%
PBDIT 10,068 10,113 8,859 -0.4% 13.6%
PBDIT Margin 11.6% 10.5% 10.1%
Net Profit 5,589 5,502 4,236 1.6% 31.9%
EPS (`) 17.3 17.0 12.9

9 www.ril.com
Segment Results : 4Q FY13 vs 3Q FY13
Refining EBIT declined marginally despite higher GRM ($ 10.1/bbl vs. $ 9.6/bbl)
due to lower crude throughput during the quarter
Lower petrochemical EBIT on account of reduced margin in polyester products
and lower volumes in PX, PE and Butadiene
Declining production in oil & gas business resulting in reduced EBIT
(in ` Crore) 4Q FY13 3Q FY13 % change
Refining Volume Price
Revenues 77,872 86,641 -10.1% -7.1% -3.1%
EBIT 3,520 3,615 -2.6%
EBIT (% ) 4.5% 4.2%
Petrochemicals
Revenues 22,158 22,053 0.5% -3.3% 3.8%
EBIT 1,895 1,937 -2.2%
EBIT (% ) 8.6% 8.8%
Oil and Gas
Revenues 1,597 1,921 -16.9% -18.8% 1.9%
EBIT 460 590 -22.0%
EBIT (% ) 28.8% 30.7%
Sales Variance

10 www.ril.com
Refining 77.4%
Petchem
20.5%
Oil & Gas 1.9%
Others 0.2%
Refining 55.0%
Petchem 31.5%
Oil & Gas
12.4%
Others 1.1%
Business Mix – FY13
Revenues EBIT
Refining business contribution increased sharply to 55% from 40% in FY12
– earnings significantly leveraged to improvement in refining margins

11 www.ril.com
Performance Bridge : FY13 vs FY12
Lower operating income for the year
was offset by higher other income and
lower depreciation charges
Other income increased on account of
higher investments and cash balances
Strong refining margins partly offset by
lower petrochemicals and oil & gas
operating profit
Net Profit EBIT

12 www.ril.com
Financial Ratios
Higher cash generation from businesses leading to high cash balance; this is
despite share buy-back and capex during the year
Investment grade rating retained: BBB positive outlook by S&P; Baa2 positive
outlook by Moody’s (both ratings are 1 notch above India’s sovereign rating) -
domestic debt rated AAA by CRISIL and FITCH
FY13 FY12
Cash Balance (` Crore) 82,975 70,252
Net Debt : Equity Debt Free Debt Free
Net Gearing Debt Free Debt Free
Gross Interest Cov er 11.3 12.9
ROCE (%) 11.0% 11.6%
ROE (%) (Adjusted) 12.7% 13.4%

13 www.ril.com
Consolidated Performance : FY13 vs FY12
Note: Figures for international subsidiaries are for CY 2012
Company
FY13 FY12 Change
RIL 38,785 39,811 -1,026
RHUSA 2,109 937 1,172
Recron Malaysia -89 153 -242
GAPCO 138 252 -114
Reliance Retail 78 -342 420
Others (incl. eliminations) -108 -109 1
RIL Consolidated 40,912 40,702 210
EBITDA - ` crore
Retail business turns EBITDA positive, driven by
strong growth in sales - up 42%
new store additions - added 184 stores during FY13, total no. of stores at 1466
same store sales growth of 7% – 18% across formats
continuing improvement in operational efficiencies
Sharp increase in operating performance of US shale
14 www.ril.com
Oil and Gas – Exploration and Production

15 www.ril.com
Business Environment
Regulatory environment turning supportive
o Exploration is allowed in production areas
Gas price environment:
o Rangarajan committee recommendations,
a move in right direction
o Efforts on to get a transition set out
towards achieving “arms-length market
determined” pricing as per PSC
Supply chain market
o Supply chain still tight for subsea
equipment
o Deep-water rig rates still high
30
55
80
91
0
20
40
60
80
100
8 10 12 12+
T
C
F
Gas price in $/mmbtu
CERA Study
Study CERA Indian Commercial Volumes in TCF
Unit : MMSCMD
16 www.ril.com
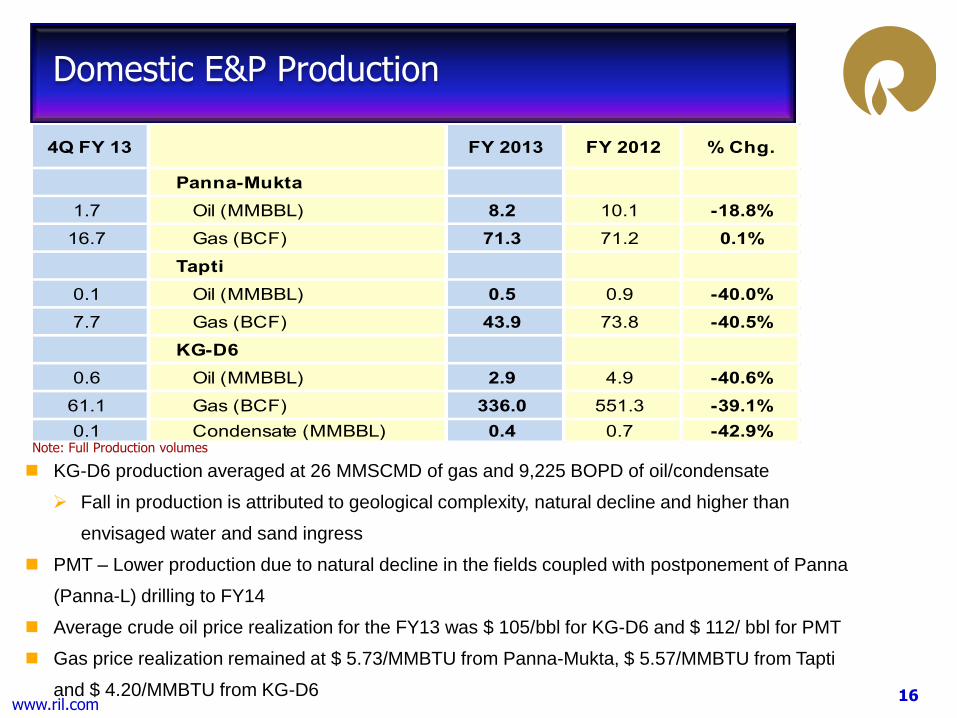
KG-D6 production averaged at 26 MMSCMD of gas and 9,225 BOPD of oil/condensate
Fall in production is attributed to geological complexity, natural decline and higher than
envisaged water and sand ingress
PMT – Lower production due to natural decline in the fields coupled with postponement of Panna
(Panna-L) drilling to FY14
Average crude oil price realization for the FY13 was $ 105/bbl for KG-D6 and $ 112/ bbl for PMT
Gas price realization remained at $ 5.73/MMBTU from Panna-Mukta, $ 5.57/MMBTU from Tapti
and $ 4.20/MMBTU from KG-D6
Domestic E&P Production
4Q FY 13 FY 2013 FY 2012 % Chg.
Panna-Mukta
1.7 Oil (MMBBL) 8.2 10.1 -18.8%
16.7 Gas (BCF) 71.3 71.2 0.1%
Tapti
0.1 Oil (MMBBL) 0.5 0.9 -40.0%
7.7 Gas (BCF) 43.9 73.8 -40.5%
KG-D6
0.6 Oil (MMBBL) 2.9 4.9 -40.6%
61.1 Gas (BCF) 336.0 551.3 -39.1%
0.1 Condensate (MMBBL) 0.4 0.7 -42.9%Note: Full Production volumes

17 www.ril.com
Panna-Mukta & Tapti Update
PMT JV achieved total oil and gas production of
500 MMBOE since inception
Ongoing projects to augment production
o Tapti - 2 ERD wells in MTA and 1 Infill well in
STA put to production and producing @ 0.80
MMSCMD. Further Infill wells to be taken up
in FY14
o Panna-Mukta – 6 PL wells to be drilled along
with further infill wells in Panna-Mukta in FY14
Mukta–B development - studies are being
undertaken for the continued assessment and
definition of a potential development plan
Exploratory wells are being evaluated to explore
presence of additional hydrocarbons in Tapti
area
Panna Mukta Tapti

18 www.ril.com
KG-D6 : Update
Cumulative production has crossed 2 TCF
To augment production from the block, key initiatives are underway:
Base management of current Fields
o D1-D3 RFDP submitted – work-overs / side track campaigns / MEG upgrade
o D26 RFDP approved - new well to maximize gas recovery & work-over /side
track (s)
o Compressor to maximize recovery from all the above (D1, D3, D26) fields
Next wave of projects to exploit the undeveloped discovered resources targeted
over the net 3 -5 years
o Development plan submitted for R-Series
o DoC review for other Satellite (D29, D30, D31) being pursued with MC
Well MJ1 targeting upsides in existing production area underway
Proposal for relinquishment of low prospectivity area submitted – 3,412 sq km of
area retained

19 www.ril.com
D1-D3 Area
M1
M3
M6
M4
M5
M2
CRP
OT MA field- FPSO
Satellite Area
Other
Satellite
Area
R Cluster
KG-D6 : Schematic
D26 Field - RFDP
Approved
R-Cluster - FDP
Submitted
New Exploration MJ1 Drilling Underway
D1-D3 RFDP
Submitted
FDP to be submitted
OFDP approved for 4
discoveries

20 www.ril.com
NEC-25 : Update
Integrated block development plan for
four discoveries (D-32, D-40, D-9 and
D-10) submitted to MC – phased
development proposed
Proposed for one DST (Drill Stem Test)
in J series discovery to DGH
First gas by mid-2019 subject to timely
approvals

21 www.ril.com
CBM Update
Relinquished Sonhat (North) block due to poor
prospectivity
RIL holds 2 blocks – Sohagpur East & West
o Extension for development phase granted up
to Oct’14 & Dec’14 for the SP(W) & SP (E)
respectively
o First gas – FY15
o FEED completed - Initiated contracting
process for long lead items
o Land acquisition activities is in progress
Gas pricing formula submitted for approval –
awaiting MoPNG’s approval
Reliance Gas Pipelines Limited submitted bids
for construction of Shadol Phulpur Natural Gas
Pipeline
Block Name (Area Sq. Km)
Sohagpur West 500
Sohagpur East 495
Total 995

22 www.ril.com
Domestic Exploration
High grading of portfolio by relinquishment of 7 blocks during the current year
Currently RIL holds 9 blocks other than KG-D6, NEC-25, PMT and 2 CBM blocks
o These are in in Gujarat Saurashtra, Krishna Godavari, Cauvery, Cambay and
Mahanadi basins
CY-D6:
o Appraisal program for discovery D53 reviewed by MC. 3D acquisition
completed and appraisal well drilled – results are under evaluation
CY-D5:
o DoC for one discovery – D35 (A1) submitted in March 2010 – approval awaited
from DGH. Plan to drill additional exploratory location in FY14
KG-V-D3:
o Revised DoC for D39 / D41 submitted in April 2012 – approval awaited from
DGH
o Phase 1 of exploration period is valid up to Dec’14 with additional possible
extension – new exploratory locations are being identified
CB-10 : DoC for 8 discoveries submitted August 2011 – approval awaited from DGH
Other blocks – In the first phase of exploration period - the prospectivity of these
blocks are being assessed for deciding the future course of action

23 www.ril.com
International Blocks
Continuing the rationalization, the following initiatives taken to prudently
upgrade the international portfolio
o Concluded divestment of Rovi and Sarta block in Kurdistan to subsidiaries
of Chevron and Block-9 in Yemen to Medco Yemen Malik Ltd.
o Relinquished Borjo North and South blocks in Columbia and W06-5 block
in Australia
o Current portfolio consists of 4 blocks – 2 in Yemen and 2 in Peru
Signed a MOU with PDVSA, Venezuela for exploring joint participation options
in upstream heavy oil projects of the Orinoco oil belt
RIL has also been pre-qualified by Iraq Government to participate in the
bidding round for Al-Nasiriya integrated project - upstream and 300 KBPD
refinery

24 www.ril.com
Shale Gas Business

25 www.ril.com
US Gas Price Environment
US gas prices recovered from multi-year lows, supported by higher demand
(driven by cold weather), lower gas drilling activity and lower storage levels
Gas-in-storage below its 5 years average and indicates positive sign for gas
price environment – current price $ 4.3/MMBTU
o End of season storage at 1,687 Bcf – about 37 Bcf below its 5 years
average and 779 Bcf less than last year at this time.
Gas Prices (Henry Hub)
__________________
Source: Historical data from EIA; NYMEX Strip prices
Gas in storage
$0.00
$1.00
$2.00
$3.00
$4.00
$5.00
$6.00
Apr-
10
Aug-1
0
De
c-1
0
Apr-
11
Aug-1
1
De
c-1
1
Apr-
12
Aug-1
2
De
c-1
2
Apr-
13
Aug-1
3
De
c-1
3
Apr-
14
Aug-1
4
De
c-1
4
Apr-
15
Aug-1
5
De
c-1
5
Q4 FY13 saw increase in gas price due to harsher winter
26 www.ril.com
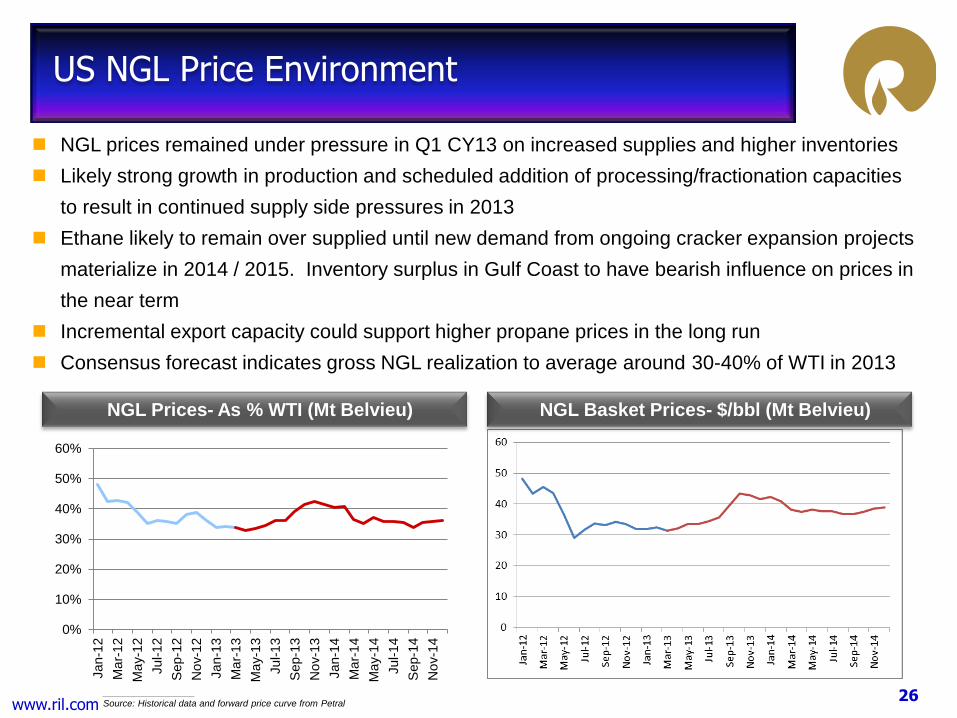
US NGL Price Environment
NGL prices remained under pressure in Q1 CY13 on increased supplies and higher inventories
Likely strong growth in production and scheduled addition of processing/fractionation capacities
to result in continued supply side pressures in 2013
Ethane likely to remain over supplied until new demand from ongoing cracker expansion projects
materialize in 2014 / 2015. Inventory surplus in Gulf Coast to have bearish influence on prices in
the near term
Incremental export capacity could support higher propane prices in the long run
Consensus forecast indicates gross NGL realization to average around 30-40% of WTI in 2013
NGL Prices- As % WTI (Mt Belvieu)
__________________
Source: Historical data and forward price curve from Petral
0%
10%
20%
30%
40%
50%
60%
Jan-1
2
Ma
r-1
2
Ma
y-1
2
Jul-1
2
Sep-1
2
No
v-1
2
Jan-1
3
Ma
r-1
3
Ma
y-1
3
Jul-1
3
Sep-1
3
No
v-1
3
Jan-1
4
Ma
r-1
4
Ma
y-1
4
Jul-1
4
Sep-1
4
No
v-1
4
NGL Basket Prices- $/bbl (Mt Belvieu)

27 www.ril.com
Strong growth momentum continued in Q4; Impressive overall performance in FY13
Significant ramp up of activities continued across all JVs during 4Q FY13
o Gross production rate crossed the “100,000 Boepd” milestone during the quarter in Pioneer JV
o Better than expected performance of Wyoming wells in Carrizo JV
440 wells online as at the year-end; 245 wells put on production across 3 JVs in FY13
Audited proved reserves grew by 135% to 1.9 Tcfe for the year ended Dec’12
Cumulative investment of $ 5.7 billion across all JVs since inception
Ongoing strategic initiatives and focus areas:
o Greater alignment with partners on development strategy - completion of carry in Pioneer & Carrizo JVs
o High grading development: focus on liquid rich areas, prudent lease holding strategy, and longer lateral
wells on multi-well pads
o Emphasis on improving capital and operational efficiencies
o Measured pace of gas focused development & appraisals to identify sweet spots for better economics
Performance Highlights
4Q FY13 % change over
3QFY13
FY13 % change
over FY12
Production (BCFe) 36.3 12% 118.5 127%
Revenues ($ Mn) 193 14% 616 76%
EBITDA ($ Mn) 155 23% 483 85%

28 www.ril.com
Shale Business Growth Trends
Development activities continued to have significant momentum during 4Q FY13
Reliance share of net volumes at 31.1 Bcfe – a growth of 12% over trailing quarter
Near doubling of sales volumes in last 4 quarters
128
181
259
323
390
460
514
568
0
100
200
300
400
500
600
Q1FY2012
Q2FY2012
Q3FY2012
Q4FY2012
Q1FY2013
Q2FY2013
Q3FY2013
Q4FY2013
Total Wells Drilled
3.2 4.7 6.3 7.9
10.3 13.9
16.4 19.0
1.6
2.8
4.2 4.6
4.6
5.5
6.3
6.9
0.8
2.0
2.8
3.1
3.3
4.3
5.1
5.2
0.0
5.0
10.0
15.0
20.0
25.0
30.0
35.0
Q1FY2012
Q2FY2012
Q3FY2012
Q4FY2012
Q1FY2013
Q2FY2013
Q3FY2013
Q4FY2013
RIL
Sh
are
of
Vo
lum
es
(Bcf
e)
Net Sales Volumes (Reliance Share)
NGLs
Condensate
Gas
5.6
13.3
9.4
15.6
18.3
23.8
27.8
31.1

29 www.ril.com
10 rigs operational
31 wells drilled and 35 wells put on production during 4Q
FY13
144 wells put on production in FY 2013; Cumulative number
of wells on line doubled to 281 wells at end of FY13
Production ramp-up impressive
o Gross production rate crossed 100,000 Boepd milestone
during the quarter
o Average gross JV production rate of 562.9 MMcfed in 4Q
FY13 vs. 530.5 MMcfed achieved in 3Q FY13
o Reliance’s share of gross production at 23 Bcfe in 4Q; full
year volumes at 79 Bcfe reflect ~90% growth YoY in FY13
o Liquid rich volumes: Condensate and NGL accounted for
35% and 26% of net sales in 4Q and of volumes in FY13
Midstream JV operations on target, supporting impressive
ramp-up
ITD Capex of $3.2 billion incl. investments in midstream JV*
Pioneer JV Progress Overview
Wells
drilled
Wells
Frac’ed
Wells
on Line
3Q’13 271 256 246
4Q’13 302 294 281
* (Midstream JV investments includes purchase considerations, cash
calls paid and Reliance share of retained earning)

30 www.ril.com
4 horizontal rigs and 2 frac crews in operation at end 4Q
Growth momentum sustained during 4Q FY13
o 20 wells put on production fueling strong production ramp-
up
o 75 wells put on production in FY13; Cumulative number of
wells on line grew 163% to 121 at end of FY 2013
o Average gross JV production rate at 204 MMcfed in 4Q –
reflects growth of 36% over trailing quarter
o Reliance’s share of gross production at 7.34 Bcfe in 4Q
and 21 Bcfe for FY13 - growth of 33% over trailing quarter
and 136% YoY respectively
Capital and operational efficiency of JV Partner is still below
desired levels; various improvement initiatives ongoing
o Thrust on pad drilling, cycle-time reduction, procurement
efficiencies and use of storage tank technology
continues and should help reduce unit development
costs from 2H 2013 onwards
Aggregate capex (including carry) of $ 1.7 billion since
inception
Chevron JV Progress Overview
Wells
drilled
Wells
Frac’ed
Wells
on Line
3Q’13 175 125 101
4Q’13 192 143 121

31 www.ril.com
One rig operation continues, with focus on NEPA development
Frac crew commenced operations in NEPA on Jan’13, after frac
holidays since Sept’12. Enabled turning 3 wells to sales ahead
of Plan in 4Q
Fewer wells drilled and completed during 4Q FY13 due to
certain operational constraints. Issues now resolved and expect
regaining of development momentum in 1Q FY14
NEPA development highlights:
o Wells put on production tripled to 38 in FY2013; Reflects
growth of 9% from 3Q levels
o Performance of Wyoming wells put on production during 3Q
FY13 remained strong and exceeded initial expectations
o Avg. gross JV production rate up 29% to 114 MMcfed in 4Q
vs. 88 MMcfed in 3Q FY13
o Reliance’s share of gross production at 6.2 Bcfe in 4Q,
reflects strong 27% growth over 3Q levels; FY13 production
at 18.4 Bcfe, reflects a growth of 962% YoY
Capex momentum slowing down with maturing NEPA
development
Aggregate capex of $ 0.8 billion since inception
Carrizo JV Progress Overview
NEPA Development Plan
Wyoming
Wells
drilled
Wells
Completed
Wells
on Line
3Q’13 68 39 35
4Q’13 74 42 38
Susquehanna

32 www.ril.com
Shale Gas Business Summary
Impressive overall growth in FY13; strong growth momentum continued in 4Q
Cumulative wells online nearly doubled to 440 in FY13 across all JVs
New production record across all JVs; over 100% growth in net sales volumes
Revenues and EBITDA nearly double in FY13
Audited Proved Reserves grew by 135% to 1.9 Tcfe at YE 2012
Pioneer and Carrizo JVs in the post-carry mode, allowing for improved
governance rights and increased alignment on activity levels
Achieved positive impact on JV partners in terms of operational and cost
efficiency improvements and forward development plans
Ramp up of development activities expected to continue in FY14

33 www.ril.com
Refining & Marketing

34 www.ril.com
Hart Energy-USA “International Refiner of the Year 2013”
GRM of $ 10.1/bbl for 4Q FY13 and $ 9.2 /bbl for FY13
Segment EBIT of ` 3,520 crore for the quarter and ` 12,788 crore for FY13
Highest ever crude throughput of 68.5 MMT at record utilization rate of 110%
Highest ever production of Diesel ,Gasoline & Alkylate achieved
10 new advantaged crudes from Venezuela, Brazil, Australia, Angola & Canada processed
6 new product grades of Diesel, MS and pet-coke launched
Over 1500 ships handled by Jamnagar marine facilities - record jetty & SPM occupancy rates
Two prestigious awards by British Safety Council, UK
o DTA Refinery : the “Sword of Honor 2012” for Occupational Health and Safety Management
System
o SEZ Refinery : the "Globe of Honor” for Environmental Management System
Performance Highlights - FY13
Yet another year of path breaking initiatives & strong performance delivery

35 www.ril.com
Business Environment…
Challenging economic environment through the year
– Sovereign debt issue, especially in Euro zone continue to hold the centre stage
– US economy still struggling with the Fiscal Cliff
– Economies in Euro-zone witness a double dip recession; growth in developed
economies soft
– Developing economies like China and India shows signs of weakness
– Demand growth for commodities, including oil remain muted
Geo-political environment continues to garner headlines
– Iran’s nuclear aspirations creates tensions in the Middle East, adding a risk
premium to oil price
– Subsequent US and EU sanctions on the Persian nation, severely affects oil
exports
– Saudi Arabia and Iraq ramp up the production to meet demand shortfall
– Tensions in other oil producing nations, Sudan, Nigeria, Libya, Yemen add to the
supply disruptions

36 www.ril.com
Range bound oil prices
– Geopolitical tensions add a risk premium to oil price
– Sluggish demand growth, and demand destruction
at high oil prices, caps the upside potential
– Eventually leading to a volatile, but a range bound
price environment
Net refining capacity reduces by around 250 kbd in
2012
– Closure of over 800 kbd in the West including
Hovensa, Aruba, Coryton, Markus Hook
Global refining margins strengthen, primarily as a
result of refinery shutdowns and unplanned
outages
– Singapore GRM near 10 year highs during the year
– US Midwest refiners continue benefit from
discounted WTI prices
Business Environment…
($/bbl) Source : Platts
80
100
120
A-12 M-12 J-12 J-12 A-12 S-12 O-12 N-12 D-12 J-13 F-13 M-13
Oil Price
Brent WTI Dubai
2.3
3.9
6.86.5
6.1
7.6
5.8
3.5
5.2
7.9 7.8
FY 03 FY 04 FY 05 FY 06 FY 07 FY 08 FY 09 FY 10 FY 11 FY 12 FY 13
Singapore GRM
($/bbl ); Source : Reuters
Amid a challenging business environment, margins remain supported by
refinery closures

37 www.ril.com
Business Environment : Singapore Product Cracks
Gasoline cracks strengthen across regions, boosted by stable demand and unplanned
refinery outages
Asian cracks strengthen substantially in the last quarter on account of healthy demand
from emerging economies like Indonesia, Vietnam, China & high refinery maintenance
Octane spreads widen on account of strong reformate values & high reforming margins
Naphtha cracks remained stable on renewed demand from petrochemical and an overall
strength in gasoline
Light distillates cracks remain supportive to Asian refining margins
6
10
14
18
A-12 M-12 J-12 J-12 A-12 S-12 O-12 N-12 D-12 J-13 F-13 M-13
Gasoline
-14
-10
-6
-2
2
A-12 M-12 J-12 J-12 A-12 S-12 O-12 N-12 D-12 J-13 F-13 M-13
Naphtha ($/bbl ); Source : Platts

38 www.ril.com
Business Environment : Singapore Product Cracks
Growing transportation fuels requirement along with robust demand from industrial and
agricultural sector supported gasoil cracks
Subsidy diesel in major Asian emerging economies further added to the demand strength
Amid a tight market, high refinery maintenance added to the strength in Middle Distillates
After a strong last year in 2012, Fuel Oil cracks weakened as demand from Japan stabilized
In addition to weak bunker fuel sales & reduced demand from Chinese teapot refiners, ample
supplies from West further depressed the crack to Dubai
Widening Gasoil Fuel Oil differentials boost complex refining margins
12
15
18
21
A-12 M-12 J-12 J-12 A-12 S-12 O-12 N-12 D-12 J-13 F-13 M-13
Gasoil
-14
-10
-6
-2
A-12 M-12 J-12 J-12 A-12 S-12 O-12 N-12 D-12 J-13 F-13 M-13
Fuel Oil ($/bbl ); Source : Platts
39 www.ril.com
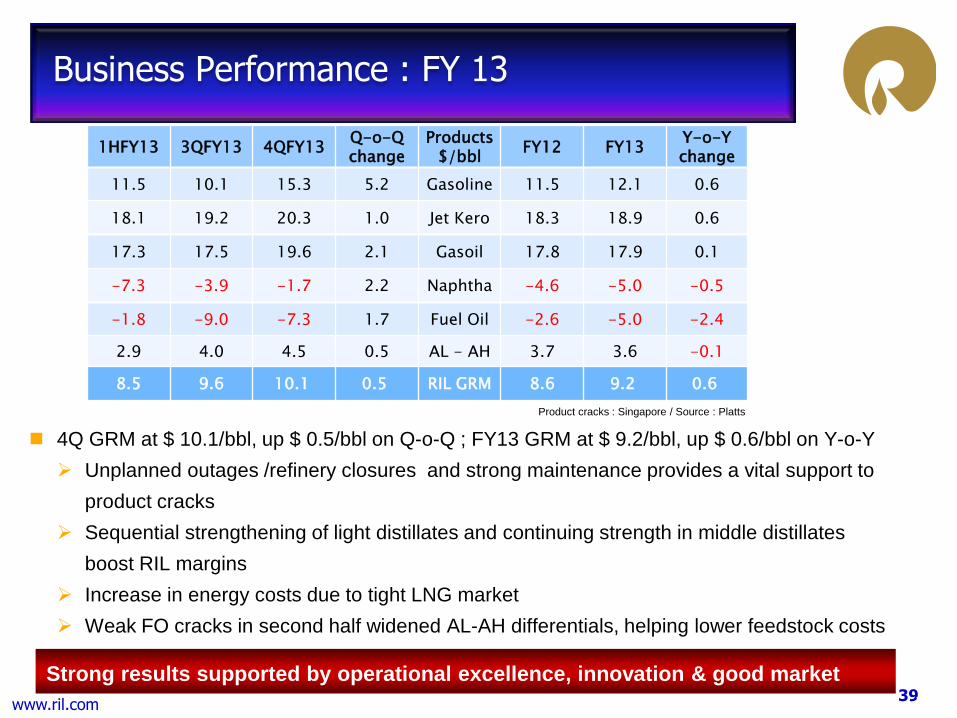
Business Performance : FY 13
39
$/bbl
4Q GRM at $ 10.1/bbl, up $ 0.5/bbl on Q-o-Q ; FY13 GRM at $ 9.2/bbl, up $ 0.6/bbl on Y-o-Y
Unplanned outages /refinery closures and strong maintenance provides a vital support to
product cracks
Sequential strengthening of light distillates and continuing strength in middle distillates
boost RIL margins
Increase in energy costs due to tight LNG market
Weak FO cracks in second half widened AL-AH differentials, helping lower feedstock costs
Strong results supported by operational excellence, innovation & good market
Product cracks : Singapore / Source : Platts
1HFY13 3QFY13 4QFY13 Q-o-Q change
Products $/bbl
FY12 FY13 Y-o-Y change
11.5 10.1 15.3 5.2 Gasoline 11.5 12.1 0.6
18.1 19.2 20.3 1.0 Jet Kero 18.3 18.9 0.6
17.3 17.5 19.6 2.1 Gasoil 17.8 17.9 0.1
-7.3 -3.9 -1.7 2.2 Naphtha -4.6 -5.0 -0.5
-1.8 -9.0 -7.3 1.7 Fuel Oil -2.6 -5.0 -2.4
2.9 4.0 4.5 0.5 AL - AH 3.7 3.6 -0.1
8.5 9.6 10.1 0.5 RIL GRM 8.6 9.2 0.6

40 www.ril.com
Large scale and highly complex refinery
World class logistics infrastructure
Efficient crude sourcing
Sophisticated supply and trading
Ability to meet most stringent product specs
Global reach with product storages at key
destinations
Operational excellence
– Refinery Utilization rates consistently
surpassing the global averages
– Operating costs per barrel amongst the
lowest globally
RIL’s “7 Key Advantages”
Inherent advantages coupled with operational excellence makes RIL the
industry leader
Source : ESAI
75%
85%
95%
105%
115%
Refinery Utilization Rates
RIL N. America Europe Asia

41 www.ril.com
At Jamnagar more than 50% of the total refinery crude diet is “Advantaged”
Crude selection using dynamic molecule management system & a model backed
by Linear, Non-Linear & Integer programming
We run the most differentiated crude portfolio in the world with a
– Wide API range, High Acid & Sulphur content & High Viscosity capability
Processed 119 different crudes grades till date - over 40% of world’s traded crude
Precision blending and sophisticated logistics infrastructure
Augmenting hardware to meet the increased availability of challenging crude grades
We signed a major crude supply agreement with PDVSA advancing long term
supply security
The Crude Advantage
The flexibility to process challenging crude grades helps reduce feedstock
costs

42 www.ril.com
The Product Advantage
Flexibility to quickly alter product slate and global presence gives RIL a
trading edge
Flexibility to quickly alter the product slate allows us to
take advantage of the market conditions
Well diversified portfolio of product placement, helping us
exploit the market upside emerging from seasonality,
turnarounds and unanticipated supply disruptions
7 new grades, including 4 country specific product grades,
help us penetrate the end user markets
Global trading offices at
– Houston / London / Singapore
Tankages at Strategic Location
– New York Harbour, Singapore, Mediterranean, North
West Europe
– Allows us to optimize freight, take advantage from the
dynamic market structure & participate in the price
setting mechanism
4%9%
24%
38%
25%
Product Placement - Gasoline
India Africa Americas Middle East South East Asia
25%
14%
12%12%3%
34%
Product Placement - Gasoil
India Africa Americas Middle East South East Asia Europe

43 www.ril.com
Operational Excellence - Marketing
Domestic Market : Product wise Demand
– Healthy domestic demand growth of 3.7%
– Demand growth skewed towards diesel on
account of subsidy
RIL Volume Placement
(Unit in KT) FY 13 FY 12 % Change
PSU 9,687 11,162 -13.2%
Exports 40,503 38,910 4.1%
Captive 10,277 9,956 3.2%
Domestic (Bulk + Retail
+ Industrial) 6,860 6,603 3.9%
Total – Refinery Sales 67,327 66,630 1.0%
Refinery Product Sales
– Increased throughput boosts refinery sales
– Commissioning of domestic refineries
marginally impact the domestic sales
– New country specific export grades launched
to offset the domestic decline
Aligned to meet the changing market requirements
Domestic Demand
Product (Unit in KT) FY 13 FY 12 %Change
MS 15741 14992 5.0%
HSD 69022 64680 6.7%
ATF 5270 5541 -4.9%
Kerosene 7501 8228 -8.8%
LPG 15199 14928 1.8%
Naphtha 10795 9453 14.2%
Others 23014 23441 -1.8%
Total 146546 141266 3.7%

44 www.ril.com
Global Macro economic environment on a path of slow but steady growth
– Economic indicators from US & other Non Euro economies signals recovery
– Positive policy actions in emerging economies, China and India, raises optimism of strong growth
Asia expected to lead the global oil demand growth
– Strong growth in the emerging economies likely to offset the demand decline in the OECD nations
– Middle distillates expected to lead the demand growth within the barrel
Global oil Supply side focus shifted to US
– Rising North Americas NGL production likely to reduce “Call on OPEC” in 2013
Oil prices expected to remain bound
– Downward pressure due to lower demand expected to be offset by geopolitical tensions
Global net CDU capacity additions expected to be in balance with demand growth
– Net expected CDU additions of 1.1 mbd/d for the year
– Strong demand in Asia & Middle East likely to offset the capacity addition
Rising age of refineries in the West increases chances of unplanned outages
R&M Business Outlook
Improving economic sentiments & strong gasoil demand growth likely to
support Asian refining margins

45 www.ril.com
Operating Efficiency
– Systematic approach and investment program to drive yield and throughput
improvements
Energy Conservation
– Programme of investments, built on a comprehensive review, to further improve
energy efficiency.
Major project – Gasification
– Delivering a step change reduction in energy costs, substituting imported LNG
with Coke / Coal
– Technology Partner for the project - Phillips 66; EPC Partner – Fluor
– Procurement of long lead equipments underway
– Looking for RIL’s accelerated delivery schedules with phased commissioning
– Expected to enhance the gross refining margins by over $ 2.5/bbl on completion
Refinery Focus Areas & Investments
Radical reduction in energy cost, support RIL’s next phase of growth

46 www.ril.com
Petrochemicals

47 www.ril.com
Petrochemicals
Polymers

48 www.ril.com
Business Environment
Volatile crude oil and naphtha price environment
Global ethylene balance begins to shift in favor of
producers in 2013/2014
Operating rates remained high in US
– stable operating rates in SE Asia
Shale gas revolution significant driver of
profitability in North American olefins and
polyolefin business
Healthy global polymer demand in
– China – up 6%
– India – up 12%
Overall margin improvement in PE and PVC
– Stable margins in PP
Improvement in sentiments to support demand recovery

49 www.ril.com
Global Ethylene Operating Rates
US operating rates remained high at 96% during the quarter; supported by low price
NGL feedstock based cracker economics
SE Asia - 95%: improved on stable demand
Western European - 87%: improved as capacity shutdowns were larger with some
long-term operational issues
75%
80%
85%
90%
95%
100%
105%
Q3 FY12 Q4 FY12 Q1 FY13 Q2 FY13 Q3 FY13 Q4 FY 13
US WE NEA SEA
US: 96 %
SEA: 95%
WE: 87 %
(Source: IHS)
NEA: 94 %
US ethylene operating rates at 90% for the year – much higher than last 5 year
average of 87%

50 www.ril.com
SE Asia Price Movement
Stable demand growth coupled with lower feedstock prices leading to
improved margins
$/MT 4QFY13 3Q FY13 % Change FY13 FY12 % Change
Crude Oil (Dubai
$/bbl) 108 107 1% 107 110 -3%
Naphtha 923 905 2% 891 931 -4%
Ethylene 1393 1282 9% 1261 1172 8%
Propylene 1354 1245 9% 1293 1341 -4%
EDC 384 281 37% 292 404 -28%
HDPE 1469 1351 9% 1373 1361 1%
PP 1502 1411 6% 1427 1481 -4%
PVC 1051 965 9% 994 1050 -5%
(Source: Platts)

51 www.ril.com
World Ethylene Supply/Demand Balance
82%
83%
84%
85%
86%
87%
88%
89%
0
25
50
75
100
125
150
175
2009 2010 2011 2012 2013 2014 2015
Capacity Demand Oper. Rate
Source:(IHS/CMAI)
(Source: IHS)
Global ethylene operating rates at 86% - higher than last 5 years average.
Operating rates expected to improve over the next 2-3 years on the back of
sustained demand growth and slow capacity additions
(In MMTPA)

52 www.ril.com
Asia + ME Asia: Incremental Ethylene Demand & Capacity Growth
84%
86%
88%
90%
92%
94%
96%
0
2
4
6
8
10
12
2009 2010 2011 2012 2013 2014 2015
Asia+ ME Capacity Growth
Asia + ME Demand Growth
Oper. Rate
(Source: IHS)
Asia plus ME Asia balance begins to shift in favor of producers in 2013-
2015 period
(In MMTPA)

53 www.ril.com
Global Ethylene Demand Growth
Asia, 38.2 Asia, 46.2
Asia, 62.5
North America, 31.6
North America, 30.2
North America, 36.8
Western Europe, 22.3
Western Europe, 19.6
Western Europe, 19.0 Rest of World,
22.6
Rest of World, 33.2
Rest of World, 39.8
0
20
40
60
80
100
120
140
160
2007 2012 2017
AsiaNorth AmericaWestern Europe
In Asia, India and China remains highest growth markets among all regions
Demand
Growth
Asia North
America
Western
Europe
Rest
of
World
2007-2012
%CARG
3.9% -1.0% -2.6% 8.0%
2012-2017
%CARG
6.2% 4.0% -0.6% 3.7%
(In MMTPA)
Asian ethylene demand growth
expected to be higher at 6.2% in
the next five year vis-à-vis
previous five years
(Source: IHS)

54 www.ril.com
US Ethylene Margins & Capacity Expansions
Country Company 2013 2014 2015 2016 2017 Process
U.S. Dow 386 Ethane/Propane
Equistar 385 EPB/Naphtha
Williams/SABIC 300 Ethane/Propane
Westlake 110 Ethane
ExxonMobil 1500 Ethane
FPC USA 800 Ethane
Chevron Phillips 1500 Ethane
Capacity
additions (in KTA) 1071 110 0 2300 1500
US shale gas revolution leading to higher profitability for North American
crackers
(Source: HIS / ICIS)
Year U.S ethylene margin ($/MT)
2007 218
2008 238
2010 166
2009 472
2011 606
2012 969
2013 to date 1228
2013 outlook favourable for US ethylene
More than five fold jump in US cracking margins over the
last five years
US ethylene fundamentals are poised to remain healthy
in 2013 supported by low price feedstocks as ethane and
propane supply/demand goes structurally long
(US ethylene margins= US spot ethane feed margins)

55 www.ril.com
Healthy global polymer demand growth
2012-2017
o CAGR : PE 5%, PP 4% &
PVC 4%
Asia, mainly China and India, to
account for larger share of growth in
global polymers demand
Global Demand Trend : 2012 vs 2017
3.4
18.9
5.1
8.7
11.9 13.3
26.8
32.4
0
5
10
15
20
25
30
35
IndianSubnt.
Rest ofAsia
WesternEurope
UnitedStates
China Rest ofWorld
2012 2017
2017 – 98.2 MMT
PE
Global Demand
2012 – 76.5 MMT
3.4
16.4
5.6 5.9
7.9
10.7
15.3
23.2
0
5
10
15
20
25
IndianSubnt.
UnitedStates
WesternEurope
Rest ofAsia
Rest ofWorld
China
2012 2017PP
Global Demand
2012 – 53.9 MMT
2017 – 68.6 MMT
2.3
13.8
3.4 5.0 4.8 5.3
10.1
17.7
0
5
10
15
20
IndianSubnt.
UnitedStates
WesternEurope
Rest ofAsia
Rest ofWorld
China
2012 2017PVC
Global Demand
2012 – 37.3 MMT
2017 – 46.2 MMT
(Source: IHS)

56 www.ril.com
RIL – Operating Highlights
Domestic end use demand across all the sectors remained strong during the
year
Maintained polymers (PP/PE/PVC) production level at 4.4 MMT for the year
Overall RIL’s polymers production share was 62% in FY13
– RIL remained major player in PP segment with market share of 64%
Introduction of new grades in PP
– Repol SR70N heat sealable grade (for food packaging application)
– SRX100NC grade (with improved clarity and gloss)
Highly integrated business model leading to best-in-class performance
57 www.ril.com
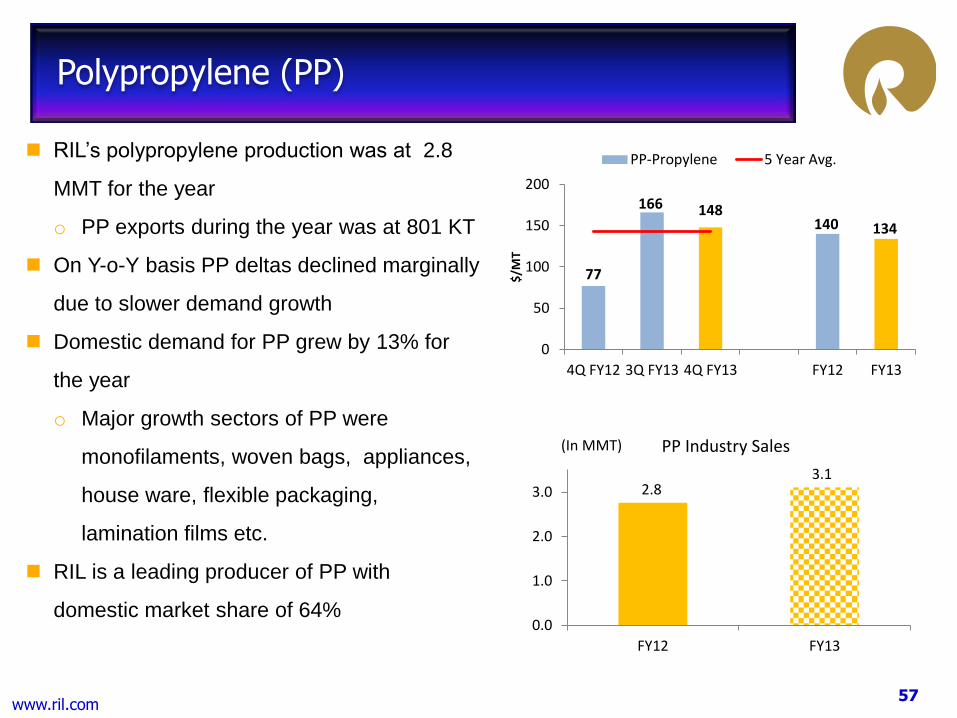
Polypropylene (PP)
RIL’s polypropylene production was at 2.8
MMT for the year
o PP exports during the year was at 801 KT
On Y-o-Y basis PP deltas declined marginally
due to slower demand growth
Domestic demand for PP grew by 13% for
the year
o Major growth sectors of PP were
monofilaments, woven bags, appliances,
house ware, flexible packaging,
lamination films etc.
RIL is a leading producer of PP with
domestic market share of 64%
2.8 3.1
0.0
1.0
2.0
3.0
FY12 FY13
(In MMT) PP Industry Sales
77
166 148 140 134
0
50
100
150
200
4Q FY12 3Q FY13 4Q FY13 FY12 FY13
$/M
T
PP-Propylene 5 Year Avg.

58 www.ril.com
Polyethylene (PE)
RIL’s PE production was at 979 KT for
the year
On Y-o-Y basis, PE deltas improved as
naphtha prices soften (growing supply
& demand concern) and PE prices
improved marginally
Domestic demand for PE grew by 10%
o Major growth sectors include
containers, rigid packaging,
lamination films, pouches, shrink
films, bags, pipes
RIL is a leading producer of PE with
domestic market share of 28%
3.1 3.4
0.0
1.0
2.0
3.0
4.0
FY12 FY13
(In MMT) PE Industry Sales
389 446
546
430 482
0
100
200
300
400
500
600
4Q FY12 3Q FY13 4Q FY13 FY12 FY13
$/M
T
HDPE-Naphtha 5 Year Avg.

59 www.ril.com
Polyvinyl Chloride (PVC)
RIL’s PVC production was at 620 KT
for the year
On Y-o-Y basis PVC deltas improved
due to sharp fall in EDC prices (-28%)
(Due to higher availability from US)
Domestic demand for PVC grew by
14% on Y-o-Y basis
o Key demand drivers included end
use sectors like pipe & fittings, wires
& cables, PVC sheets, films, profiles
and footwear
RIL is a leading producer of PVC with
domestic market share of 28%
2.0 2.3
0.0
1.0
2.0
3.0
FY12 FY13
(In MMT) PVC Industry Sales
507 511 507
488 535
0
100
200
300
400
500
600
4Q FY12 3Q FY13 4Q FY13 FY12 FY13
$/M
T
PVC-Nap-EDC 5 Year Avg.

60 www.ril.com
Polymers demand grew at CAGR of 10.3% in last 5 years
PP12%; PE11%; PVC9%
India’s per capita consumption of polymers expected to grow from 6.8 kg/person
in 2012 to 9.8 kg/person by 2017
India’s polymer market size expected to grow from 8.5 MMTPA to over
13 MMTPA by 2017, making it one of the largest growth markets globally
India’s Demand-Supply Trajectory
0.0
2.0
4.0
6.0
8.0
10.0
12.0
14.0
2007 2008 2009 2010 2011 2012 2013 2014 2015 2016 2017
Total Domestic Supply PVC Demand PE Demand
PP Demand Per Capita Cons.
(Source: IHS) (MMT)

61 www.ril.com
New Product Development: Crop Cover Application
Effect of frost
Covered crop
No frost effect PP Nonwoven crop cover generally used
as floating cover can save crop from
climatic & pest hazards
Provides protection from frost during
winter
Protection from pests, insects
It can work as boon for marginal farmers
as it works economical

62 www.ril.com
Expansion Plan : Project Update
RIL Current Capacity
(MMT)
RIL Proposed
Expansion (MMT)
RIL Total Capacity
(MMT)
Expected Indian
demand in FY17
(MMT)
ROGC
Ethylene 1.9 1.4 3.3 6.7
Propylene 3.0 0.2 3.1 5.1
LDPE 0.2 0.4 0.6 0.7
HDPE/ LLDPE 0.9 0.6 1.5 4.6
PP 2.8 0.14 2.9 4.9
Strong growth projects with potential for cyclical upside
RIL finalized services for project management and technology supplier:
Fluor Corporation to provide project management services
Technip selected as a technology supplier and engineering contractor for ROGC
Jacobs Engineering Group has been selected to provide engineering and
procurement for the construction of off-sites and utilities facilities

63 www.ril.com
Petrochemicals Outlook
Feedstock prices expected to remain volatile
Operating rates expected to improve over the next 2-3 years on the back of
sustained demand growth and slow capacity additions
Concerns over geopolitical issues in Middle East and global economic growth
rates
Asia naphtha prices expected to remain firm in 2013 – driven by higher spot
demand due to lighter cracker turnaround schedule
Domestic demand for polymers expected to grow at 2x of GDP growth rates
RIL to focus on maintaining high operating rates and domestic orientation
Maintain market shares in higher net back areas in view of higher imports
Improvement in market sentiments to support demand recovery

64 www.ril.com
Petrochemicals
Polyester and Fibre Intermediates

65 www.ril.com
Business Environment
Weaker economic environment in the first half impacted textile consumption in
developed countries
Slower than expected demand growth; inventory continues to remain high
Polyester deltas declined amidst slow demand and new capacity additions
Polyester chain delta improved, aided by strong PX and MEG margins
Domestic demand grew at 5% in FY13 as compared to 2% growth witnessed in
FY12
PSF/PET growth potential hampered by continued power shortage in
Southern India
Chinese strategic reserves buying supported global cotton prices
Record Chinese cotton yarn imports benefitted Indian sub-continent spinners

66 www.ril.com
Polyester Chain Delta
Long Term Avg: US$ 710/MT
Y-o-Y decline in chain delta due to erosion in PTA and polyester deltas
Recovery noticed in 2H FY13 on delta revival in MEG and polyester
Overall chain delta got support from PX delta, due to short markets
US$/MT
Source: Platts, ICIS
$ 810/MT
11-12: $876/MT
FY 12: $ 876/MT
FY 13: $ 729/MT

67 www.ril.com
Price Movement
$/MT 4QFY13 3Q FY13 % Change FY13 FY12 % Change
Crude oil
(Dubai $/bbl) 108 107 1% 107 110 -3%
Naphtha 923 905 2% 891 931 -4%
PX 1643 1595 3% 1534 1557 -1%
PTA 1161 1111 5% 1093 1195 -9%
MEG 1134 1090 4% 1041 1151 -10%
POY 1608 1560 3% 1544 1759 -12%
PSF 1579 1472 7% 1470 1647 -11%
PET 1565 1448 8% 1450 1626 -11%
Source: Opec, ICIS, Platts, PCI
Y-o-Y decline in polyester chain prices amidst extreme need-based and cautious buying
New capacity additions, mainly in PTA and polyester impacts prices
PX sentiments upbeat amidst strong demand and active trading

68 www.ril.com
Price Movement
Source: Cotlook, ICIS
USD/MT
Firmness in Cotlook A Index amidst continued reserve procurement by China
Current season YTD Cotlook A up 25% over long-term average of 69 c/lbs.($ 1521/MT)
Mar‘13 avg. Indian raw cotton prices increases 15% over season start (Oct‘12)
PSF
Cotlook A (FE)
Cotlook A (FE) Index $/MT
Long-Term 1521
YTD Mar '13 1895
% Change 25%

69 www.ril.com
Fibre Demand Projections
Global all fibre demand to exceed 100 MMT by 2020 from 81 MMT currently
Polyester to account for 68% of the incremental fibre demand
India to witness higher growth rate of 5.2% vis-à-vis global average of 3.2%
Source: PCI
CAGR (2020/2012)

70 www.ril.com
Polyester : Domestic Demand
Improvement in polyester demand compared to 2% growth seen in FY12
PET growth driven by good demand from beverage segment;
FDY segment growing at 10%
Many states announced new policies to attract textile investments
Government announces new measures to boost textiles exports
TUFS extended to 12th Five Year Plan period; apparel parks planned by Govt.
FY 12-13 over FY 11-12

71 www.ril.com
Polyester Staple Fibre (PSF)
MMT
Source: PCI, ICIS
Global
Demand/Supply
Delta
(PSF-PTA-MEG)
Lower delta amidst cautious demand, feedstock cost pressure and destocking
FY13 delta down 23%; 4Q delta up 36% on Q-o-Q basis
Improvement in Q4 from cost push and stock replenishment.
Gradual capacity addition in PSF to assist global operating rates and deltas
Indian PSF demand likely to witness robust CAGR of 11% between 2012 to 2015 period
RIL operated at full capacity; domestic market share maintained at 68%
US$/MT
5 yr Avg – US$ 200/MT

72 www.ril.com
Polyester Filament Yarn (PFY)
MMT
Delta impacted by cautious downstream demand and high inventory pressure
FY13 deltas down 27% Y-o-Y
Global over-capacity in PFY to impact operating rates and margins
Indian PFY demand likely to witness CAGR of 10% between 2012 to 2015 period
RIL’s PFY production down 4% amidst planned shutdowns
Global
Demand/Supply
US$/MT
Source: PCI, ICIS
5 yr Avg – US$ 311/MT
Delta
(PFY-PTA-MEG)

73 www.ril.com
Polyethylene Terephthalate (PET)
MMT
High capacity growth, mostly in China and poor weather conditions globally impacted
the demand and margins
FY13 delta down 24% Y-o-Y; however, 4Q delta recovers to five year average
Indian PET demand to witness robust CAGR of 14% between 2012 to 2015 period
RIL operated at full capacity; market share improves by 2% to 46%
Global
Demand/Supply US$/MT
5 yr Avg – US$ 182/MT
Source: PCI, ICIS
Delta
(PET-PTA-MEG)

74 www.ril.com
Paraxylene (PX)
MMT
Tight supply amidst lower capacity addition and delay in new capacity commissioning
PX deltas expected to remain high amidst strong demand and tight supply
4Q FY13 delta up 14% Y-o-Y
PX operating rates likely to remain high above long-term average
Indian demand expected to remain healthy; likely to witness a CAGR of 20% between
2012 to 2015 period
RIL production maintained steady at 2.0 MMT with 100% capacity utilization
Source: PCI, Platts
Delta
(PX-Naphtha)
5 yr Avg – US$ 490/MT
$/MT
Global
Demand/Supply

75 www.ril.com
Purified Terephthalic Acid (PTA)
MMT
Huge capacity addition during 2011-2013 – pressure on operating rates and margins
Significant erosion of PTA delta (down 52% Y-o-Y)
Around 80% of new capacity addition in China
Integrated producer better placed than standalone; likely closure of unviable capacity
Reducing gap between PTA capacity and demand growth – to aid prices and margins
Indian PTA demand to witness CAGR of 10% between 2012 to 2015 period
RIL maintains high operating rates of above 100% during the year
Source: PCI, ICIS
$/MT
Delta
(PTA-PX spot)
5 yr Avg – US$ 170/MT
Global
Demand/Supply

76 www.ril.com
Mono Ethylene Glycol (MEG)
MMT
Insufficient capacity addition keeps MEG supply tight
MEG delta sustains above long-term average; likely to remain firm in near term
No new MEG major capacity planned outside China in 2013-2015 period
China planning massive coal/MTO based MEG capacities (1.5 MMT expected in 2013)
Issue on acceptable specification for fiber application remains a big question
Indian MEG demand to grew at 12% between 2012 to 2015 period
RIL operated at nearly full capacity utilization
Source: PCI, Platts
Delta
(MEG-Naphtha)
5 yr Avg – US$ 402/MT
$/MT
Global
Demand/Supply

77 www.ril.com
RIL Operational Highlights
Largely stable feedstock production in FY13
Marginal decline in polyester production amidst planned shutdown in PFY
facility
Polyester Production FID Production KT KT

78 www.ril.com
Reliance: Product Innovation
For Textile and Clothes
Sapan: Look and feel as cotton
MCX, Sparkle : Special effect and appearance for fashionable requirements
Recron*Green : Environment friendly yarn produced from post- consumer waste
UV Resistant fibre : Strength retention of fabric on prolonged exposure to sun light
Recron*Superdye : Dyeable with Cationic dyes and imparts bright and brilliant shades
Recycling
1.6 Bn post-consumer PET bottles recycled
150 Collection centres
State of art processing technology
Sleep Products
Aura pillow : Filled with superfine micro fibre for superior comfort
Dr. Ortho’ pillow : Ergonomically designed for better neck support
For Construction Industry
Recron 3s: Replacing carcinogenic asbestos in roofing sheets and other applications
For Packaging Industry
Barrier Relpet : Barrier for oxygen and carbon-dioxide transmission;
Typical application include orange juice, beer, ketch-up, wine & non-food like paint,
nail-polish etc.

79 www.ril.com
Polyester Chain: Project Update
PX PTA MEG POY PET PSF
Location Jamnagar Dahej Jamnagar Silvassa Dahej Dahej
Capacity KTA 2328 2300 700 425 648 346
Licensor Lummus Invista Dow
Chemicals
CP:Chemtex
POY - Barmag
FDY Spg: TMT
CP: Chemtex
SSP: Buhler TBD
DEC Foster
Wheeler Aker Jacob Chemtex Chemtex TBD
Environmental
Clearance Yes Yes Yes Yes Yes Yes

80 www.ril.com
Polyester Outlook
Gradual recovery in economic growth expected to stimulate fibre demand
PX and MEG likely to witness higher operating rates amidst slower capacity
addition
Delta to remain healthy, success of Chinese coal based plants to be
crucial driver
Integrated players to benefit from complementing chain delta economics
Likely delay/cancellation/rationalisation of some standalone polyester chain
capacities
India: Polyester to witness healthier growth during the next five years
Favourable Indian Govt. policies – conducive environment for
downstream investments
Chinese reserve policies on cotton and likely drop in global acreage to guide
cotton prices

81 www.ril.com
Petrochemical Sector
Chemicals

82 www.ril.com
Benzene
Benzene deltas improved sharply in FY13
o Driven by strong Asian price which were
tracking US prices
o US prices increased due to restricted
supply on account of light feed cracking
RIL’s benzene production was at 743 KT in
FY13
Exports of benzene during year were mainly
to the US, Europe and Middle East
Domestic demand dropped by 4% on Y-o-Y basis due to moderate growth in
Caprolactum (major BZ derivative) mainly used in tyre industry
RIL’s market share softened to 44% from 51% as RIL export increased by 8%
Outlook:
o Margins over naphtha expected to be healthy - downstream demand is expected
to be moderate
o Domestic demand is expected to be flat
195
454 464
188
368
0
100
200
300
400
500
4Q FY12 3Q FY13 4Q FY13 FY12 FY13
$/M
T
Benzene-Naphtha 5 Year Avg.

83 www.ril.com
Butadiene deltas declined in FY13 due to
low BD prices which were led by weak
demand from downstream sectors
RIL produced 169 KT of butadiene in FY13
Domestic demand dropped by 1% due to
lower off-take from downstream sectors
including PBR, ABS and SB latex remained
subdued on Y-o-Y basis
RIL maintained its leadership position with market share of 97%
Outlook:
o Global supply likely to remain tight during FY14 with very few capacity additions
of BD planned - mainly in China
o Domestic demand is expected to grow due to new derivatives capacities being
set up (SBR and PBR capacities by RIL and other players)
Butadiene
2415
658 883
2280
1102
0
500
1000
1500
2000
2500
4Q FY12 3Q FY13 4Q FY13 FY12 FY13
$/M
T
Butadiene-LPG 5 Year Avg.

84 www.ril.com
Polybutadiene Rubber
PBR deltas improved by 12% in FY13 due
to softening of Butadiene prices
RIL is the sole producer of PBR in India
o Production was at 77 KT in FY13
Domestic demand improved by 5% on
Y-o-Y basis due to lower growth in auto
sector which was partly offset by higher
demand from the replacement market
RIL market share softened to 47% from 50% due to higher imports.
Outlook:
o Global demand likely to improve in 2013 as global auto sector and tyre sector are
expected to grow according to IRSG (International Rubber Study Group) & RMA
(Rubber Manufacturing Association) projections
o Domestic demand is expected to increase due to expected revival in commercial
vehicle and passenger car demand as projected by SIAM
239
941
695 753
847
0
200
400
600
800
1000
1200
4Q FY12 3Q FY13 4Q FY13 FY12 FY13
$/M
T
PBR-Butadiene 5 Year Avg.

85 www.ril.com
Linear Alkyl Benzene
LAB deltas were weak in FY13 vs. FY12
o Deltas declined largely in the second
half of the year – impacted by
cheaper imports especially from Iran
RIL is the largest producer of LAB in India
with production of 162 KT in FY13
Domestic demand witnessed a growth of
6%
RIL market share remained stable at 23% during the year
Outlook:
o South East Asia and Middle East to remain well supplied with reports of China
resuming LAB exports
o Easy availability of imported material may continue to impact the domestic market
sentiments
698 674
621
754 693
0
200
400
600
800
4Q FY12 3Q FY13 4Q FY13 FY12 FY13
$/M
T
LAB-Kerosene 5 Year Avg.

86 www.ril.com
Installed Capacity
(KTA) Proposed Expansion
(KTA) Total Capacity
(KTA)
Poly Butadiene Rubber 74 40 114
Styrene Butadiene
Rubber - 150 150
Butyl Rubber - 100 100
Projects Status
Leveraging captive feedstock from existing operations
RIL to maintain its leading position in elastomers sector in the Indian sub-continent
Setting up world-scale SBR plant at Hazira
o Technology tie up with Versalis (previously known as polimeri Europa)
Expanding PBR capacity by 40 KTA - technology tie-up with JSR, Japan
o Unique nickel/neodymium catalyst based swing PBR plant
RIL-SIBUR JV to set up facility to produce butyl rubber at Jamnagar, India

87 www.ril.com
Reliance Retail

88 www.ril.com
Crossed ` 10,000 crore revenue milestone
Revenue growth of 42% Y-o-Y
Achieved cash break even
Earnings before depreciation, finance
cost and tax expense (EBDIT) of
` 78 crore
Leadership position across all format
sectors
Like-for-Like store sales growth superior to
competition in challenging environment
Key Highlights
Rs. Crore FY 13 FY 12 %
Change
Revenue 10,800 7,599 42%
Earnings before
Depreciation,
finance cost and
Tax
78 (342) 123%

89 www.ril.com
Consistent growth in revenue across all
format sectors by
Relevancy of assortment
Superior in-store experience
Consistent value propositions in
price and promotions
Enhanced brand recognition
Revenue & CAGR Growth
1 3 8 7
42
61
1 5 11 12
46
76
2 8
16 21
61
108
-
20
40
60
80
100
120
Brands Jewellery Fashion &Lifestyle
Digital ValueFormat &Others
Total Sales
Rs.
00's
Cro
re
Revenue
2010-11 2011-12 2012-13
82% 57%
45%
76%
19%
33%
CAGR for 2
years
Revenue from Digital, Fashion and
Jewellery increasing consistently
Revenue contribution from format
sectors matches wallet-share of Indian
customers
56%
20%
15%
7% 2%
Revenue Mix - FY 13
Value Format & Others
Digital
Fashion & Lifestyle
Jewellery
Brands

90 www.ril.com
Strong Like-for-Like Sales Growth in Challenging
Macro-environment
10% 20%
Brands: 12%
Jewellery: 7%
Fashion & Lifestyle:
8%
Digital: 17%
Value Format &
Others: 18%
5% 15%
Witnessed strong LFL store sales growth ranging from 7% to 18% across format
sectors
Strong LFL growth supported by loyal customer base
“Reliance One” loyalty program – 13 million members
65% of sales contributed by loyalty customers
Loyalty average ticket value greater than twice that of non-loyalty ticket value
LFL Growth %

91 www.ril.com
579
3.6
478
3.0 107
0.7
302
1.7
Store Count
Area (sq. ft. in mn)
Store
Count
Store
Additions
FY 13
Brands 68 19
Jewellery 51 14
Fashion &
Lifestyle 448 95
Digital 139 46
Value and
Others 760 10
Total Stores 1,466 184
Pan-India Presence with Stores in 129 Cities
As on March 31, 2013

92 www.ril.com
Largest grocery retailer in the country with
rapidly increasing market share
Revenue growth is almost double the
growth of Modern trade*
Cash & Carry Wholesale format built on the
principle of offering inclusive growth
Caters to kiranas, institutions & HORECA
New store roll-out across multiple markets
Own product development/design capability
Less dependence on suppliers reducing
lead time and better response to market
Contribute 9% of revenues for Value
Formats
*AC Nielsen Analysis for Jan-Dec 2012
Value Formats – Grocer for the Nation

93 www.ril.com
Digital – India’s Largest Digital Retail Chain
Growth through combination of Digital and
Digital Express – Solution based product &
service offerings
Deep strategic partnerships with
international brands e.g. iStore with Apple
ResQ – Unique comprehensive service
capability across products and brands for
end to end product life cycle
‘Reconnect’ products (private label) built on
cutting edge technology and in partnership
with best global brands
Contributes 4% of revenues for Digital

94 www.ril.com
Trends – India’s Largest Fashion Destination
Superior end-to-end supply chain
capability from design-board to customer
wardrobe
Agility to respond to fashion trends
Vendor linkages in most
advantageous markets around the
world
Design capabilities built to support ‘fashion
quotient’ of discerning Indian customers
through range of private brands
Private brands contribute 65% of
revenues
95 www.ril.com
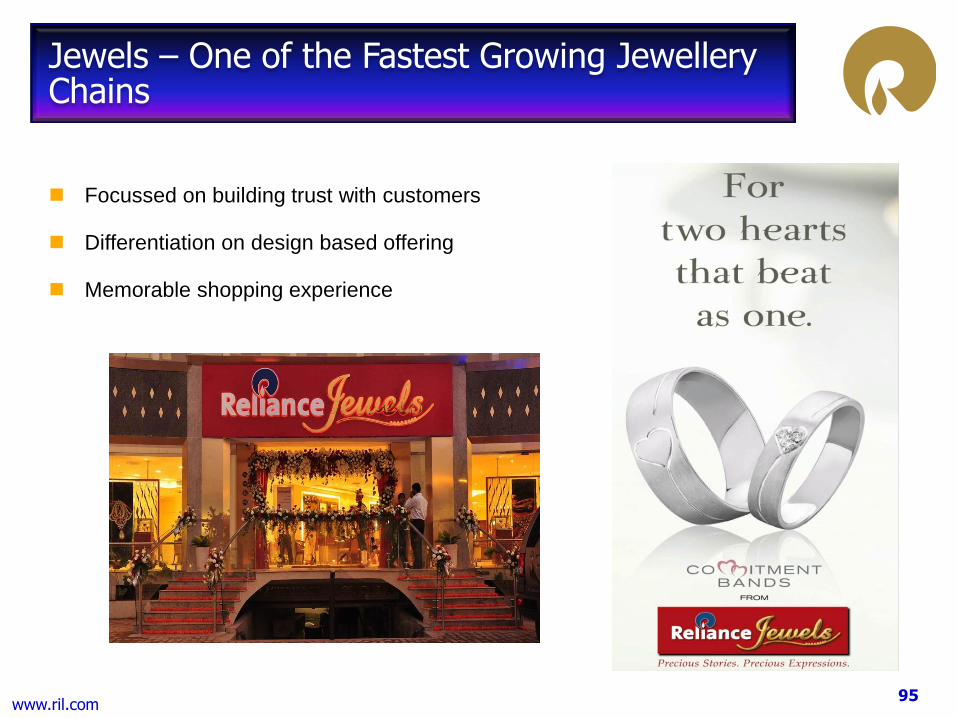
Jewels – One of the Fastest Growing Jewellery Chains
Focussed on building trust with customers
Differentiation on design based offering
Memorable shopping experience

96 www.ril.com
New Partnerships
Reliance Brands emerging as ‘partner of
choice’ for India operations
Despite the option of independent
presence open for International single
brand retailers
15 Partnerships comprising of 40 brands
Capability to adapt and implement brand
DNA
Unique portfolio of brands straddling all
segments – Luxury, Bridge to Luxury, High
Premium and High Street
E-commerce initiatives – launch of
Stevemadden.in
Brands – Emerging as “Partner of choice”

97 www.ril.com
Summary

98 www.ril.com
Summary
Sharp improvement in complex refining margin – RIL delivers record performance
Maximise benefit of being an integrated energy Company - Focus on energy business
in the growing markets
o Gasification : Building sustainable long-term advantage by producing syn gas at a
globally competitive cost
o ROGC : Leverage complex refining to build globally competitive cracker capacity
o Largest ever expansion in the entire polyester chain incl. PX, PTA, MEG, PFY, PET
Grow upstream business and develop resource base through exploration
o Meaningful ramp-up in US shale JVs – to benefit from increasing gas prices and
liquid rich portfolio
Significant ramp-up planned in the retail business – leadership position achieved in
key verticals including food, apparels, CDIT and Brands
Maintain strong balance sheet with liquidity to drive future growth
Roadmap set for accelerated growth in the next five years

Thank You