Embed Size (px)
Citation preview
SM
Maryland Transportation Authority
FY 2007-08 Business Plan
“For organizations to achieve their objectives- whether they are manufacturing or service, private or public, for profit or not-for-profit- all organizational participants need be aligned to the strategy.” (Kaplan & Norton, 2001)
September 2007
Draft Document Internal Use Only
Table of Contents
• Vision, Mission, Values 3
• Strategic Plan Goals/Business Plan Key Focus Areas and Objectives 4
• Introduction 5
• Industry Trends 5
• Role in Maryland’s Transportation System 6
• Facilities 7
• Organization 9
• Performance Management Team (PMT) 14
• Key Focus Areas 15
o Enhancing Facility Capacity 15
o Operate and Maintain Facilities 19
o Minimize Accidents 23
o Fiduciary Responsibility 28
o Efficient and Effective Business Process 42
o Timely, Polite, and Thorough Customer Services 56
o Internal Customer Services 58
• Existing and Future Challenges 60
• Existing Intra-agency Committees 61
• Organizational Relationships 62
2
Draft Document Internal Use Only
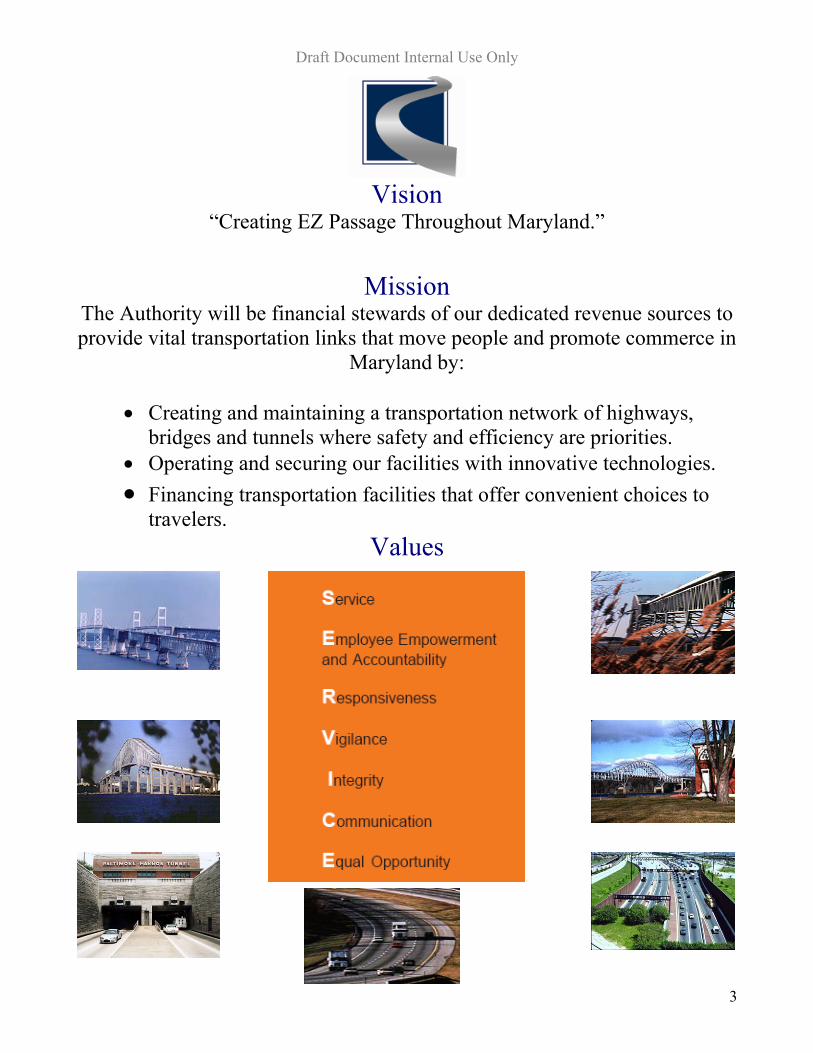
Vision
“Creating EZ Passage Throughout Maryland.”
Mission The Authority will be financial stewards of our dedicated revenue sources to provide vital transportation links that move people and promote commerce in
Maryland by:
• Creating and maintaining a transportation network of highways, bridges and tunnels where safety and efficiency are priorities.
• Operating and securing our facilities with innovative technologies. • Financing transportation facilities that offer convenient choices to
travelers. Values
3
Draft Document Internal Use Only
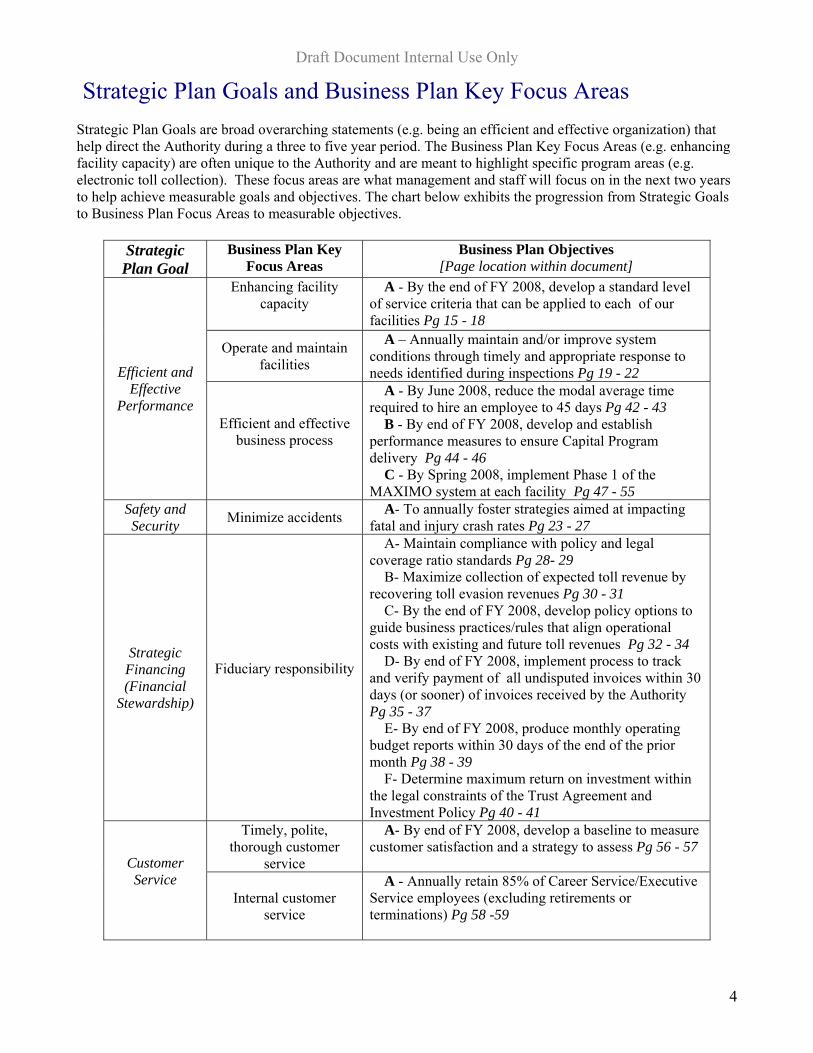
Strategic Plan Goals and Business Plan Key Focus Areas Strategic Plan Goals are broad overarching statements (e.g. being an efficient and effective organization) that help direct the Authority during a three to five year period. The Business Plan Key Focus Areas (e.g. enhancing facility capacity) are often unique to the Authority and are meant to highlight specific program areas (e.g. electronic toll collection). These focus areas are what management and staff will focus on in the next two years to help achieve measurable goals and objectives. The chart below exhibits the progression from Strategic Goals to Business Plan Focus Areas to measurable objectives.
Strategic Plan Goal
Business Plan Key Focus Areas
Business Plan Objectives [Page location within document]
Enhancing facility capacity
A - By the end of FY 2008, develop a standard level of service criteria that can be applied to each of our facilities Pg 15 - 18
Operate and maintain facilities
A – Annually maintain and/or improve system conditions through timely and appropriate response to needs identified during inspections Pg 19 - 22 Efficient and
Effective Performance
Efficient and effective business process
A - By June 2008, reduce the modal average time required to hire an employee to 45 days Pg 42 - 43 B - By end of FY 2008, develop and establish performance measures to ensure Capital Program delivery Pg 44 - 46 C - By Spring 2008, implement Phase 1 of the MAXIMO system at each facility Pg 47 - 55
Safety and Security Minimize accidents A- To annually foster strategies aimed at impacting
fatal and injury crash rates Pg 23 - 27
Strategic Financing (Financial
Stewardship)
Fiduciary responsibility
A- Maintain compliance with policy and legal coverage ratio standards Pg 28- 29 B- Maximize collection of expected toll revenue by recovering toll evasion revenues Pg 30 - 31 C- By the end of FY 2008, develop policy options to guide business practices/rules that align operational costs with existing and future toll revenues Pg 32 - 34 D- By end of FY 2008, implement process to track and verify payment of all undisputed invoices within 30 days (or sooner) of invoices received by the Authority Pg 35 - 37 E- By end of FY 2008, produce monthly operating budget reports within 30 days of the end of the prior month Pg 38 - 39 F- Determine maximum return on investment within the legal constraints of the Trust Agreement and Investment Policy Pg 40 - 41
Timely, polite, thorough customer
service
A- By end of FY 2008, develop a baseline to measure customer satisfaction and a strategy to assess Pg 56 - 57
Customer Service
Internal customer service
A - Annually retain 85% of Career Service/Executive Service employees (excluding retirements or terminations) Pg 58 -59
4
Draft Document Internal Use Only
Introduction
The Maryland Transportation Authority (the Authority) released its most recent Strategic Plan in January 2006. The document was the culmination of an extensive strategic planning process, which entailed numerous analyses of the Authority, its facilities, its capabilities, and its industry. These analyses continue as the Authority continues to grow in size and in its responsibilities to Maryland’s transportation system.
This Business Plan is the result of the Authority’s staff’s commitment to creating an EZ passage throughout Maryland. The Authority’s divisions considered the results of the strategic planning process and coordinated efforts to develop strategies to support the goals
and objectives set forth in the Strategic Plan. The Executive Secretary provided additional direction through the development of key focus areas for the current year. The Authority is committed to the completion of the strategies presented in this plan, and has developed a process to ensure this document is reviewed frequently to ensure progress is being made.
To remain agile and to support sustainability, this plan will be revisited annually. This process will allow us to focus on the fulfillment of our long-term goals by the accomplishment of our short-term strategies.
Current Industry Trends
Maryland’s transportation system has experienced tremendous growth during the past 20 years. To
accommodate continued growth and to maintain our current infrastructure requires a substantial investment in our system. As fiscal resources are limited, toll-revenue likely will play a larger role in the financing new transportation projects. The Authority has already begun to play a larger role considering the Express Toll Lanes Network Initiative, and the Intercounty Connector (ICC). A network of optional Express Toll Lanes (ETL s) will provide a cost-effective way for Maryland to manage congestion, increase roadway capacity, create an expanded regional transit system, and provide an option for relatively free-flowing highway travel - and to do so decades sooner than otherwise feasible.
SM
Advancements in technology continue to enhance opportunities for electronic toll collection (ETC). E-ZPass® use continues to grow, which has allowed transportation systems to reduce congestion, and increase throughput at toll plazas. New technologies such as video tolling will take electronic tolling to a new level. As we continue to investigate new technologies, efforts are also underway to modify existing facilities to maximize the effectiveness of the new devices. For example, wider lanes at the toll plazas will facilitate higher speed limits for dedicated E-ZPass lanes.
Recent transportation-industry research has included the concept of congestion pricing. Congestion pricing charges a premium toll to highway users who prefer to travel during peak periods. The toll amount varies according to the level of congestion with higher tolls being charged during peak hours or directions.
“Experience in other countries, particularly in France, demonstrates that congestion pricing does significantly reduce gridlock during peak traffic periods. America's top scientific organizations, including the prestigious National Academy of Sciences, also give high marks to congestion pricing…the academy praises congestion pricing as a potentially powerful tool to persuade people to carpool, use transit, telecommute, vary the times they travel, alter their routes, choose other destinations, or avoid or combine some trips” (U.S. Department of Transportation). As this trend continues to develop, the Authority must remain vigilant for opportunities to further reduce congestion for its customers.
5
Draft Document Internal Use Only
MdTA’s Role in Maryland’s Transportation System The Maryland Transportation Authority (MdTA or the Authority) was established July 1, 1971 as a result of authorizing legislation enacted by the Maryland General Assembly in 1970 (§4-102). The Authority serves as a policy-setting, decision-making, and governing body. It consists of the Secretary of Transportation, as Chairman, and eight members appointed by the Governor with advice and consent of the Senate. The Authority is funded by tolls it collects from motorists who use its facilities, concessions at service plazas, investment income, Transportation Trust Fund Sources (including the Seagirt Marine Terminal Lease, Masonville Auto Terminal Lease, MAA/MPA Reimbursement for Police Services) and other miscellaneous sources. The Capital Program is financed through a combination of revenue bonds (repaid from toll revenue) and the use of current toll revenues on a pay-as-you-go basis. Note: The ICC project has the following sources besides toll revenue bonds: GARVEE bonds, Transportation Trust Fund, Special Federal Funds, and State General Fund. Acting on behalf of the Maryland Department of Transportation, the Authority is responsible for the supervision, financing, construction, maintenance, operation, and repair of both current and future transportation facilities projects (§4-204(a)). Transportation facilities projects include:
• Current Authority facilities, and their “appurtenant” facilities (e.g., interchanges, entrance plazas, toll stations [toll plazas], service facilities [maintenance facilities] (§4-101(i)(1));
• Any other project for transportation facilities that the Authority authorizes to be acquired or constructed (§4-101(i)(2)); and,
• Any authorized additions, improvements, or enlargements to transportation facilities projects (§4-101(i) (2)).
The Authority is able to issue revenue bonds in order to finance the cost of transportation facilities projects. When bonds are issued, the Authority is able to determine matters related to the form, terms, conditions, issuance, sale, and delivery of the bonds (§4-302). These bonds are issued by the Authority without the consent of any agency or unit of the State (§4-306). Bonds issued by the Authority are backed by the expectation of future revenue from Authority projects. The Chairman of the Authority is the Secretary of Maryland Department of Transportation (MDOT). MDOT includes all modes of transportation under one centralized department. It has a Consolidated Transportation Trust Fund used to finance inter-modal transportation programs and projects. The single most important benefit of the consolidated structure of the Department and its Transportation Trust Fund is that it allows the Governor to respond quickly and flexibly to current priorities. The relationship between the Authority and MDOT provides Maryland with the resources necessary to meet its growing transportation needs. The Authority provides MDOT with valuable funding assistance for transportation-related revenue producing projects within its modal administrations. This partnership has resulted in revenue-backed funding assistance for projects including the recent expansion of the Baltimore/Washington Thurgood Marshall International Airport, improvements to facilities at the Port of Baltimore, and transit-related projects for the Maryland Transit Administration (MTA). This relationship will remain important as projects such as the ICC and Express Toll Lanes (ETLs) are constructed to enhance Maryland’s transportation system.
6
Draft Document Internal Use Only
Facilities The Authority is responsible for more than 100 highway miles, two tunnels, and five bridges. Each of the Authority’s seven facilities are supported by the Authority’s 1,600 employees, who operate, secure, maintain, and improve the physical structures, the buildings, equipment, and vehicles they utilize to do their jobs.
Northern Thomas J. Hatem Memorial Bridge (formerly the Susquehanna River Toll Bridge) spans the Susquehanna River from a point near Perryville, Cecil County, to a point near Havre de Grace, Harford County. Opened to traffic in August 1940, the Bridge is 1.4 miles long. In 1986, the Bridge was renamed for Thomas J. Hatem (1925-1985) who represented Harford County in the Maryland House of Delegates from 1955 to 1958. John F. Kennedy Memorial Highway (formerly the Northeastern Expressway) was constructed with revenue bond proceeds authorized in 1956 (Chapter 1, Acts of the Special Session of 1956). A part of Interstate 95, this toll road opened to traffic in November 1963. It extends 50 miles from Delaware south to the northern limits of Baltimore City. In the Spring of 2006, construction of the I-95 ETLs began on the most congested portion of I-95 north of Baltimore City. This 10-mile segment stretches from the I-895 (N) split in east Baltimore City, to north of MD 43 in White Marsh, Baltimore County. Once complete, there will be two ETLs and four general-purpose lanes in each direction. Motorists will have the option of using the general-purpose lanes at no cost or paying a toll to use the ETLs.
Baltimore Metro Baltimore Harbor Tunnel is a 1.4-mile, four-lane tunnel that opened to vehicular traffic in November 1957 and is part of a 20-mile system of approach roadways and ramps. Designated I-895, the facility connects major north/south highways and many arterial routes in Baltimore City’s industrial sections. Fort McHenry Tunnel is the largest, underwater highway tunnel, as well as the widest vehicular tunnel ever built by the immersed-tube method. It is located just south of Fort McHenry between Locust Point and Canton, crossing Baltimore's harbor under the Patapsco River. It links the southern and eastern areas of Baltimore City. Completion of this facility closed the final gap of Interstate 95 through Maryland. The Tunnel opened to traffic in November 1985. Francis Scott Key Bridge opened to traffic in March 1977, spanning the Patapsco River between Sollers Point in Baltimore County and Hawkins Point in Baltimore City. It is also the final link in the 52-mile Baltimore Beltway (I-695).
Southern William Preston Lane, Jr., Memorial Bridge often referred to as the Bay Bridge, is one of the longest over-water steel structures in the world. It spans 4.35 miles of the Chesapeake Bay between Sandy Point on the Western Shore to a point near Stevensville on the Eastern Shore. Traffic lanes between the suspension towers are 2,922 1/2 feet in length and 1981/2 feet above the Bay. The bridge rises to a total height of 354 feet. The original span, a two-lane bridge, was opened to traffic in July 1952. At the request of the Maryland General Assembly, the State Roads Commission renamed the Chesapeake Bay Toll Bridge as the William Preston Lane, Jr., Memorial Bridge in 1967 (Joint Resolution no. 21, Acts of 1967). William Preston Lane, Jr. (1892-1967), served as governor from 1947 to 1951. In 1968, Bridge and Tunnel Revenue Bonds were issued to construct a parallel bridge across the Chesapeake Bay. In June 1973, the parallel three-lane (west-bound) span opened to traffic.
7
Draft Document Internal Use Only
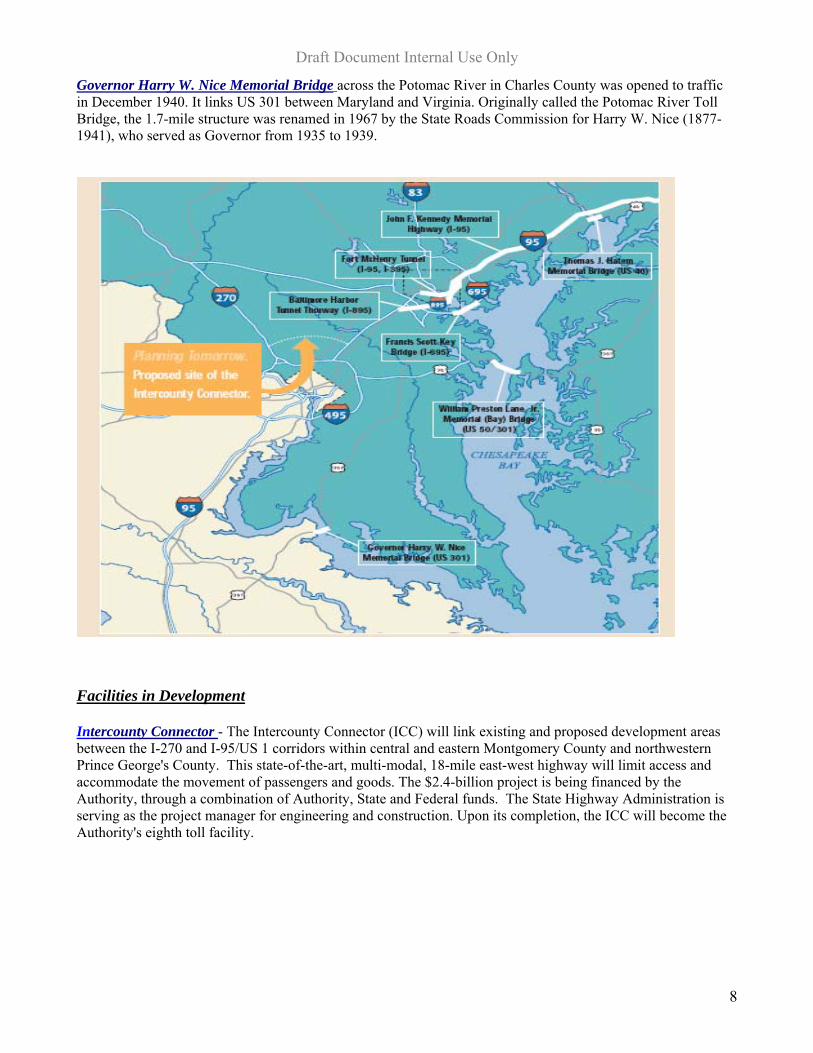
Governor Harry W. Nice Memorial Bridge across the Potomac River in Charles County was opened to traffic in December 1940. It links US 301 between Maryland and Virginia. Originally called the Potomac River Toll Bridge, the 1.7-mile structure was renamed in 1967 by the State Roads Commission for Harry W. Nice (1877-1941), who served as Governor from 1935 to 1939.
Facilities in Development Intercounty Connector - The Intercounty Connector (ICC) will link existing and proposed development areas between the I-270 and I-95/US 1 corridors within central and eastern Montgomery County and northwestern Prince George's County. This state-of-the-art, multi-modal, 18-mile east-west highway will limit access and accommodate the movement of passengers and goods. The $2.4-billion project is being financed by the Authority, through a combination of Authority, State and Federal funds. The State Highway Administration is serving as the project manager for engineering and construction. Upon its completion, the ICC will become the Authority's eighth toll facility.
8
Draft Document Internal Use Only
Organization Governing Members By law, the Maryland Transportation Authority is a group of eight citizens (Members) who are appointed by the Governor (and confirmed by the Senate). The Members serve as the Authority’s policy-setting, decision-making, and governing body. Maryland's Secretary of Transportation presides as the Authority's Chairman. As of January 1, 2007: each Member serves a four-year term and term expirations are staggered. Members are eligible for reappointment to the Authority; however, there is a three-consecutive-term limit.
Pictured are the current Chairman and Members, as of April 2007.
Chairman John D. Porcari
Members
UNDER CONSTRUCTION
9
Draft Document Internal Use Only
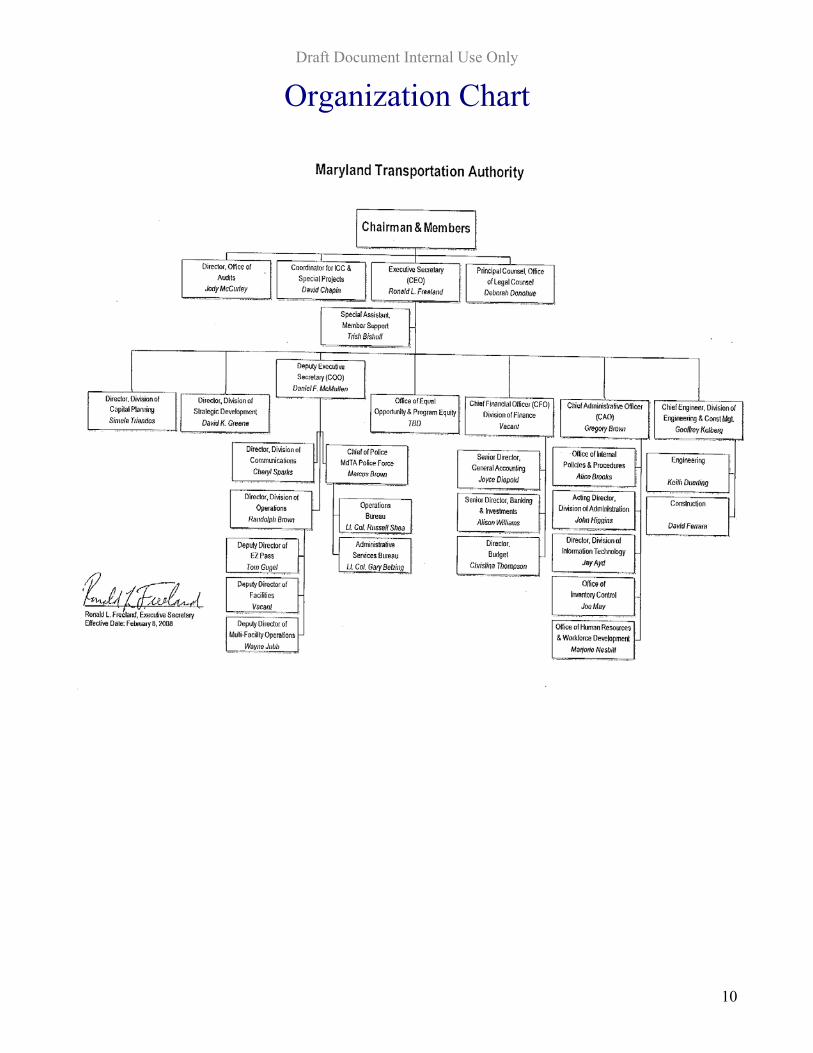
Organization Chart
10
Draft Document Internal Use Only
Executive Secretary’s Office (10 positions) The Executive Secretary’s Office reports directly to the Chairman and members of the Authority. The Executive Secretary is responsible for the overall operation, maintenance and coordination of the Authority’s facilities. The Executive Secretary exercises overall management and operational responsibility for the Maryland Transportation Authority, including the Maryland Transportation Authority Police. A dedicated team of professionals staffs the office and provides the support necessary to meet the demands of the executive direction function. Office of Legal Counsel (7 positions) The Office of Legal Counsel provides a full range of legal services to the Authority. Legal services include: representing the agency in litigation and claims in Federal and State courts and before administrative agencies; acting as issuer’s counsel in revenue bond sales; drafting and/or approving contracts, agreements, and transactional documents; providing legal advice to agency management and to the agency’s 400+ member police force; and drafting and review of legislation, rules and regulations. Office of Audits (4 positions) The Office of Audits assists the Executive Secretary and the Authority’s Audit Committee in fulfilling its oversight responsibilities for the financial reporting process, the system of internal control, the audit process, and the organization’s process for monitoring compliance with laws, regulations, and policies. The Office is responsible for developing and conducting periodic risk assessments and audit plans. Additionally, the Office is responsible for conducting performance, finance and compliance, economy and efficiency, and program results audits. Coordinator for ICC & Special Projects (1 position) The Coordinator for ICC & Special Projects works exclusively on Intercounty Connector related activities involving the Authority, the State Highway Administration and the Maryland Department of Transportation. These activities include development of the project’s conceptual finance plan, development of the application for credit assistance under the TIFIA program, preparations for issuance of GARVEE bonds, intergovernmental agreements, traffic and revenue studies, and toll policy development. Division of Engineering and Construction Management (85 positions) The Division of Engineering and Construction has the primary responsibility for the inspection, evaluation, assessment, analysis, surveys, design, engineering, rehabilitation, construction and reconstruction of all infrastructure owned and operated by the Authority. The office includes a staff of 73 individuals who have expertise in structural, highway, traffic, building, maintenance and remedial engineering. Employees also include construction managers and inspectors, electrical engineers and architects. Division of Communications (9 positions) The primary function of the Division of Communications (DOC) is to manage and market the Authority’s public image. The DOC serves as an official voice of the Authority with employees, news and traffic reporters, and motorists, elected officials, business leaders and the general public. Staff also markets the agency's customer services, including E-ZPass.
11
Draft Document Internal Use Only
Division of Operations (837 positions) The Division of Operations oversees five bridges, two tunnels, and more than 100 miles of roadway under the Authority’s jurisdiction. The Division is also responsible for the E-ZPass electronic toll collection system and manual toll collection operations at these seven facilities. Oversight involves administrative functions and services to users, including facility operations, traffic management, customer response units, equipment fleet management, telecommunications systems, and the E-ZPass operations contract. The facility administrator is responsible for facility and roadway maintenance, response to weather and highway incidents, traffic control, and the collection, disposition, and safeguarding of tolls. Along the John F. Kennedy Memorial Highway, the administrator also oversees the operation of service plazas, restaurants, and service stations. MdTA Police (632 positions) The nationally accredited Maryland Transportation Authority Police takes its commitment to serve and protect seriously. Officers risk their lives daily keeping millions of the State’s citizens and visitors safe and secure as they use vital transportation assets like Authority toll facilities, the Port of Baltimore, and Baltimore/Washington International Thurgood Marshall Airport. Division of Finance (40 positions) The Division of Finance is responsible for most of the fiscal activities of the Authority including general internal accounting and reporting, toll collection audit, budgeting and long-range financial planning, and cash and debt management. The Division oversees the investment of Authority funds; prepares and maintains all financial records, reports and statistics; establishes procedures and methods for monitoring the collection, safeguarding, and deposit of toll revenues; and prepares the audits and records of toll collectors’ transactions. The responsibility for the revenue bond administration program includes the management, accounting and disclosure requirements for revenue bonds issued to finance the Authority’s own capital program as well as other revenue-producing transportation projects in the State Division of Administration (46 positions) The Division of Administration assists the Authority in accomplishing its mission and its vision for "Creating EZ Passage Throughout Maryland" by providing the finest quality workforce, the best tools and resources, and the safest work environment. These endeavors are accomplished through the following offices: Director's Office, Human Resources, Risk Management, Procurement, Fleet and Supplies Office, and Print Shop/Mail Room. Office of Equal Opportunity and Program Equity Division of Information Technology (22 positions & 10 on-site full time contractors) The Division of Information Technology (DoIT) is responsible for the planning, implementation, and support of the Authority’s computer systems. DoIT’s Offices of Planning, Project Management, and Operations & Support provide information technology assistance for all phases of the IT life cycle. DoIT supports more than 1,700 users, 1,400 computers and peripheral devices, and has an average monthly Help Desk call volume of more than 900 calls per month.
12
Draft Document Internal Use Only
Division of Strategic Development (12 positions) The Division of Strategic Development (DSD) has responsibility for facilitation and implementation of the Authority’s Strategic and Business Plans; monitoring, reporting and improvement of goals, objectives, and performance measures; development of new and innovative programs to assist in the delivery of self supporting transportation facilities; acquisition of real estate for the benefit of the Authority; and management, development and oversight of real estate assets not directly related to the operation of bridges, tunnels, and highways. Division of Capital Planning (12 positions) The responsibility of Capital Planning is to develop, continuously assess and communicate short and long term capital planning, legislative, public outreach and programming needs that assure the safe and efficient movement of people and goods traveling through the facilities owned, operated, and financed by the Authority.
13
Draft Document Internal Use Only
Performance Management Team
On May 15, 2006, the Authority convened its first Performance Management Team (PMT) meeting. Comprised of employees from each of the Authority’s Divisions, the team was tasked with monitoring and assisting in the accomplishment of the goals, objectives, and action plans set forth in the 2006 Strategic Plan. The PMT’s key activities include:
• Conducting regularly scheduled reviews of performance data and supporting action plans.
• Identifying opportunities for process improvements within the Authority’s performance management program and assisting in the development of relevant action plans.
• Developing reports, visual aids, and presentations to inform the Authority (Chairman, Members, and staff) of its overall performance toward accomplishing its goals and objectives.
• Assisting in the determination of the usefulness of performance indicators and benchmarks. Identifying the need for additional or alternative performance indicators as appropriate.
Led by the Chief Administrative Officer (CAO), the team has been instrumental in the development of this Business Plan. As the Authority continues to address its current and future challenges, this team will assist the Authority in accomplishing its goals and objectives.
“High-performing organizations do not measure things just for the sake of measurement. Rather, they report, evaluate, and use performance information as integral parts of their performance measurement systems to:
• inform various levels of management and employees about performance information;
• determine whether corrective action is necessary; and
• determine whether changes are necessary in the performance measurement system, to the measures themselves, or to the organization's goals.”
National Performance Review, 1997
14
Draft Document Internal Use Only
1 - Key Focus Area: Enhancing Facility Capacity (Supports Strategic Plan Goal > Efficient and Effective Performance)
A - Objective: By the end of FY 2008, develop a standard level of service criteria that can be applied to each of our facilities
Performance Measures: Pages 16 – 18 contain update information from the Division of Engineering and Construction Management. Update/progress report information supplied by the Division of Engineering as of September 28, 2007
Discussion of Performance Traffic congestion at Authority facilities is a function of the capacity of the entire facility and not just throughput at toll plazas. To mitigate congestion, multiple factors need to be evaluated such as peak hour throughput, average wait times, level of service, and toll lane utilization (E-ZPass and Manual). E-ZPass usage is the most visible “level of service” measure from a customer viewpoint. This measure is defined in the annual MFR (Managing For Results) submission, and there has been a steady increase in the percentage of tolls collected electronically. This is due in part to improvements to the lane configurations, dedicated E-ZPass only lanes, and increased public awareness due to marketing initiatives. To date, the Authority has focused on three major activities to address performance issues: (1) engineering studies and improvements; (2) operational management including E-ZPass operations; (3) marketing to influence E-ZPass usage and demand by time of trip (e.g. “Go Early - Stay Late”). To date, measurement has focused on E-ZPass usage and throughput at the harbor crossings. In the future, the Authority needs improved measures to better explain the need for capital projects (e.g. Open Road Tolling) and operational changes (e.g. E-ZPass versus ticket usage). In the near future the strategy of pricing of trips will play a major role in managing capacity on facilities such as I-95 (ETLs) and the ICC. Future decisions need to be made based on the performance of each facility ensuring that capital projects continue to impact the level of facility capacity that can be attained. Strategies:
1. Define facility capacity, facility capacity limitations, and potential levels of service through the use of previously completed and ongoing facility studies [Engineering & Operations]
2. Identify practical means to collect data to define facility capacity and differentiate levels of service [Engineering & Operations]
3. Define a model for data analysis [Engineering & Operations] 4. Outline program costs of obtaining and maintaining measurement data options [Engineering &
Operations] 5. Develop a Concept of Operations (ConOps) for congestion management that will define the manner in
which information is collected, disseminated and used by the Authority. [Strategic Development, Communications, Engineering & Operations]
6. Develop a draft toll policy for price-managed facilities that considers criteria outlined in strategies under Key Focus Area - Fiduciary Responsibility; Objective 4C – To develop efficient and cost-effective business operations and initiatives [Strategic Development, Finance, Capital Planning, Communications, Operations & Engineering (ORT)]
7. By the end of FY 2008, increase E-ZPass usage to 57% of total toll transactions [Operations, Engineering & Communications]
8. Continue to modify existing facilities by adjusting the number of dedicated E-ZPass only lanes at the facilities, consistent with E-ZPass use levels. [Operations]
9. Coordinate with SHA to identify potential similarities with their measure and definition - “Composite Level of Service” [Strategic Development, Operations & Engineering]
10. Outreach/marketing to influence demand by time of trip" for our efforts related to off-peak travel, congestion/delay information and construction/capital project outreach. [Communications]
15
Draft Document Internal Use Only
16
Draft Document Internal Use Only
17
Draft Document Internal Use Only
18
Draft Document Internal Use Only
2 - Key Focus Area: Operate and Maintain Facilities (Supports Strategic Plan Goal > Efficient and Effective Performance)
A - Objective: Annually maintain and/or improve system condition through timely and appropriate response to needs identified during inspections Performance Measures:
(Outcome) System Condition – Minimize the number of inspection issues that deteriorate to high priority on an annual basis (Input) System Condition – Development of measurement: response time to correction of high priority* and critical* items identified in the annual inspections
(Input) Number of items specified as high priority and critical in the Annual Inspection (Input) Number of items specified as high priority and critical in the Annual Inspection that have been corrected (Output) % of items specified as high priority and critical in the Annual Inspection that have been corrected
Discussion of Performance The Maryland Transportation Authority has a strategic goal of Efficiency and Effectiveness: Moving People and Goods. In order to do this, the Authority must maintain all facilities in good condition so that disruptive and expensive repairs are minimized. In the past, the Authority has focused on maintaining the facilities by taking corrective action on deficiencies identified in the annual condition inspection reports. Further, the Authority’s annual inspection reports previously focused on existing needs versus potential and/or developing needs. In the interest of being more proactive and comprehensive so that all elements, types and components of each of the facilities are inspected and improved, the agency has revised the approach to move toward a system-wide preventative maintenance and preservation focus. Emphasis over the next few years will be an advanced response to needs identified in the annual inspection reports. Strategies:
1. Maintain timely reporting on annual facility inspections. [Engineering]
2. Continue implementation of the Maximo system (see Key Focus Area: Efficient and Effective Time Management). [Information Technology and Operations]
3. Develop master contracts for non highway, bridge or tunnel assets to cover inspections, remedial repairs, and preventative maintenance. [Engineering & Operations] [Information Technology-Contract management & tracking system]
4. Develop Facility System Preservation Master plans. [Engineering]
* Critical deficiencies include both emergency and non-emergency items. Emergency items are addressed immediately. An appropriate response to a critical deficiency is to achieve a resolution, or to begin necessary repairs, within one year of identification. High-priority items are deficiencies that have the potential of becoming more serious if not corrected within the next several years. As defined
within the Managing for Results submission document.
19
Draft Document Internal Use Only
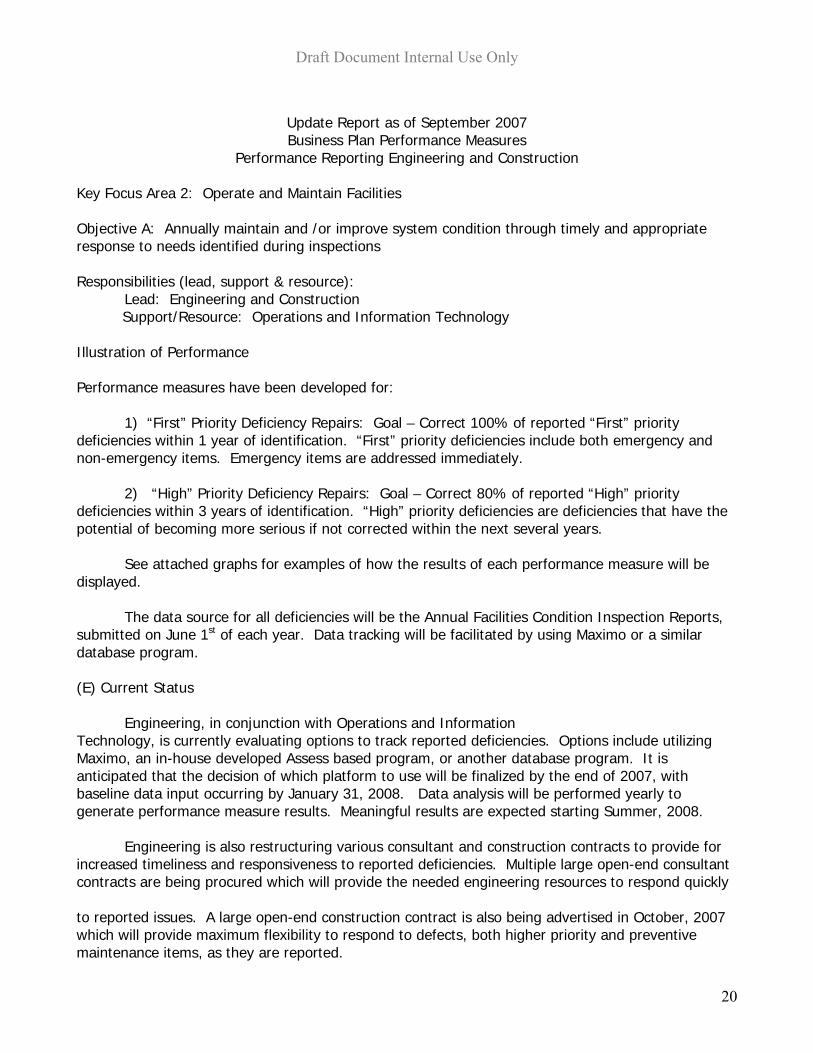
Update Report as of September 2007 Business Plan Performance Measures
Performance Reporting Engineering and Construction Key Focus Area 2: Operate and Maintain Facilities Objective A: Annually maintain and /or improve system condition through timely and appropriate response to needs identified during inspections Responsibilities (lead, support & resource):
Lead: Engineering and Construction Support/Resource: Operations and Information Technology Illustration of Performance Performance measures have been developed for:
1) “First” Priority Deficiency Repairs: Goal – Correct 100% of reported “First” priority
deficiencies within 1 year of identification. “First” priority deficiencies include both emergency and non-emergency items. Emergency items are addressed immediately.
2) “High” Priority Deficiency Repairs: Goal – Correct 80% of reported “High” priority
deficiencies within 3 years of identification. “High” priority deficiencies are deficiencies that have the potential of becoming more serious if not corrected within the next several years. See attached graphs for examples of how the results of each performance measure will be displayed. The data source for all deficiencies will be the Annual Facilities Condition Inspection Reports, submitted on June 1st of each year. Data tracking will be facilitated by using Maximo or a similar database program.
(E) Current Status
Engineering, in conjunction with Operations and Information Technology, is currently evaluating options to track reported deficiencies. Options include utilizing Maximo, an in-house developed Assess based program, or another database program. It is anticipated that the decision of which platform to use will be finalized by the end of 2007, with baseline data input occurring by January 31, 2008. Data analysis will be performed yearly to generate performance measure results. Meaningful results are expected starting Summer, 2008. Engineering is also restructuring various consultant and construction contracts to provide for increased timeliness and responsiveness to reported deficiencies. Multiple large open-end consultant contracts are being procured which will provide the needed engineering resources to respond quickly to reported issues. A large open-end construction contract is also being advertised in October, 2007 which will provide maximum flexibility to respond to defects, both higher priority and preventive maintenance items, as they are reported.
20
Draft Document Internal Use Only
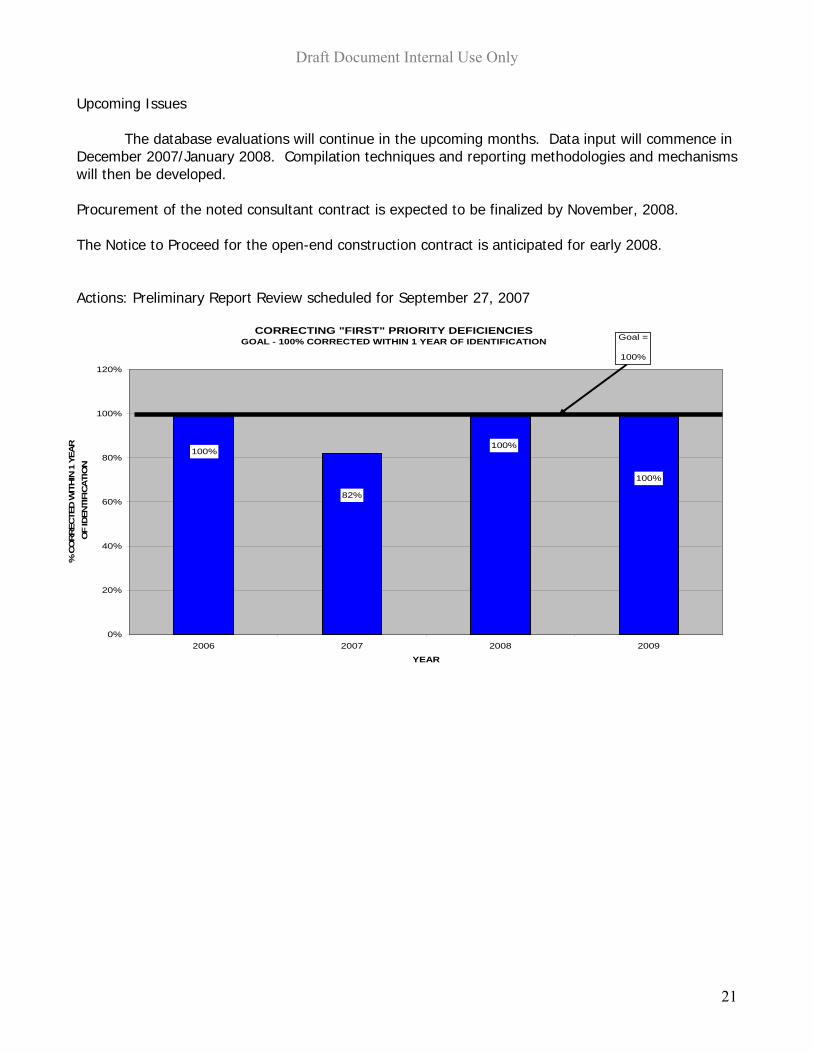
Upcoming Issues
The database evaluations will continue in the upcoming months. Data input will commence in December 2007/January 2008. Compilation techniques and reporting methodologies and mechanisms will then be developed. Procurement of the noted consultant contract is expected to be finalized by November, 2008. The Notice to Proceed for the open-end construction contract is anticipated for early 2008.
Actions: Preliminary Report Review scheduled for September 27, 2007
CORRECTING "FIRST" PRIORITY DEFICIENCIESGOAL - 100% CORRECTED WITHIN 1 YEAR OF IDENTIFICATION
100%
100%100%
82%
0%
20%
40%
60%
80%
100%
120%
2006 2007 2008 2009
YEAR
% C
OR
REC
TED
WIT
HIN
1 Y
EAR
OF
IDEN
TIFI
CA
TIO
N
Goal =
100%
21
Draft Document Internal Use Only
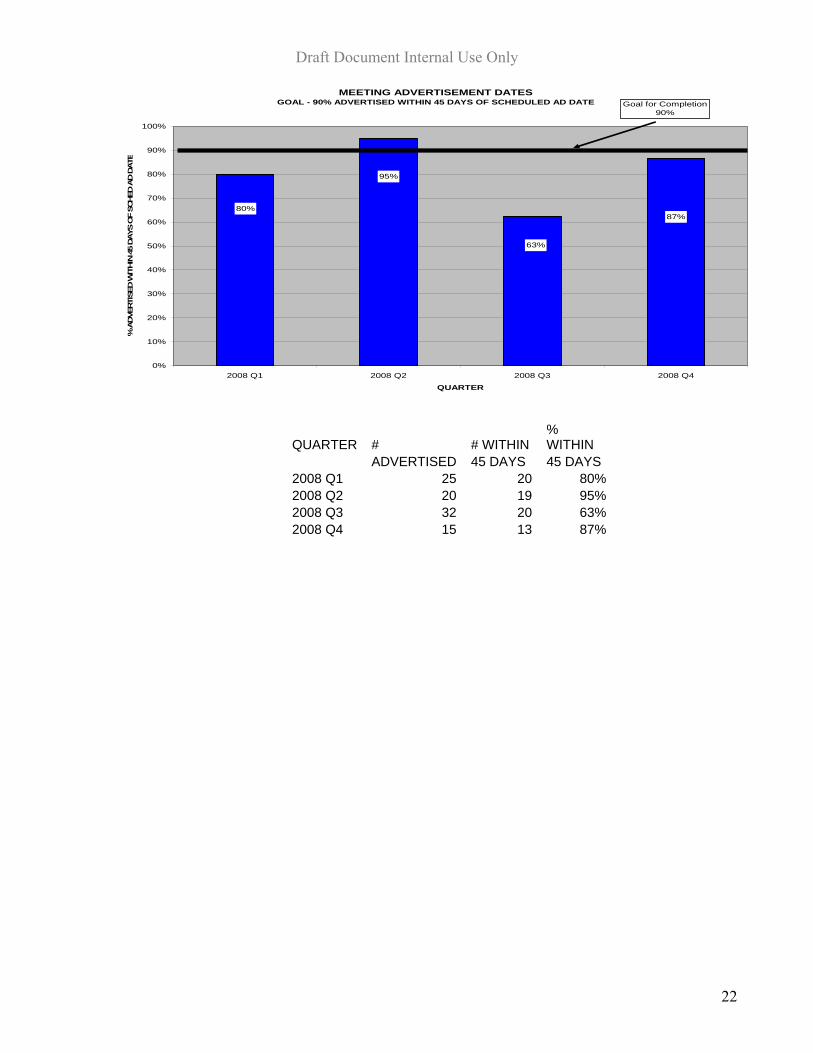
MEETING ADVERTISEMENT DATESGOAL - 90% ADVERTISED WITHIN 45 DAYS OF SCHEDULED AD DATE
87%
63%
80%
95%
0%
10%
20%
30%
40%
50%
60%
70%
80%
90%
100%
2008 Q1 2008 Q2 2008 Q3 2008 Q4
QUARTER
% A
DVE
RTI
SED W
ITHIN
45
DAYS
OF
SCHED
AD D
ATE
Goal for Completion90%
QUARTER # # WITHIN % WITHIN
ADVERTISED 45 DAYS 45 DAYS 2008 Q1 25 20 80% 2008 Q2 20 19 95% 2008 Q3 32 20 63% 2008 Q4 15 13 87%
22
Draft Document Internal Use Only
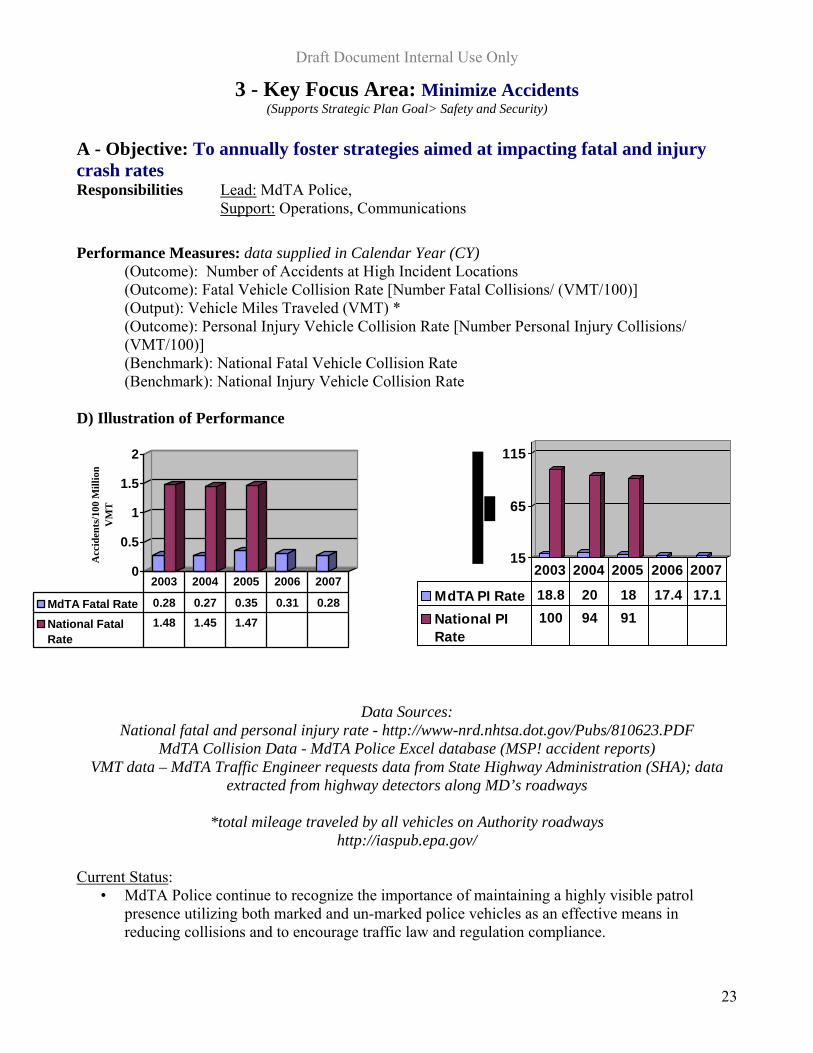
3 - Key Focus Area: Minimize Accidents (Supports Strategic Plan Goal> Safety and Security)
A - Objective: To annually foster strategies aimed at impacting fatal and injury crash rates Responsibilities Lead: MdTA Police, Support: Operations, Communications
Performance Measures: data supplied in Calendar Year (CY) (Outcome): Number of Accidents at High Incident Locations (Outcome): Fatal Vehicle Collision Rate [Number Fatal Collisions/ (VMT/100)] (Output): Vehicle Miles Traveled (VMT) * (Outcome): Personal Injury Vehicle Collision Rate [Number Personal Injury Collisions/ (VMT/100)] (Benchmark): National Fatal Vehicle Collision Rate (Benchmark): National Injury Vehicle Collision Rate
D) Illustration of Performance
Data Sources: National fatal and personal injury rate - http://www-nrd.nhtsa.dot.gov/Pubs/810623.PDF
MdTA Collision Data - MdTA Police Excel database (MSP! accident reports) VMT data – MdTA Traffic Engineer requests data from State Highway Administration (SHA); data
extracted from highway detectors along MD’s roadways
*total mileage traveled by all vehicles on Authority roadways http://iaspub.epa.gov/
Current Status
15
65
115
0
0.5
1
1.5
2
Acc
iden
ts/1
00 M
illio
n V
MT
:
MdTA Police continue to recognize the importance of maintaining a highly visible patrol • prese in reducing collisions and to encourage traffic law and regulation compliance.
nce utilizing both marked and un-marked police vehicles as an effective means
MdTA Fatal Rate 0.28 0.27 0.35 0.31 0.28
National FatalRate
1.48 1.45 1.47
2003 2004 2005 2006 2007MdTA PI Rate 18.8 20 18 17.4 17.1National PIRate
100 94 91
2003 2004 2005 2006 2007
23
Draft Document Internal Use Only
• COMSTAT p ncreased police presence because of increased co nge in pattern of collision areas or an observed need for increased enforcement activity.
ntinue to participate in the conducting of Traffic Safety Initiatives such as: Saturation
• afety initiatives at
• 3 was 81.08% lower than national average,
• Rate for MdTA Facilities for 2003 was 81.20% lower than national average,
• participate in organized safety events such as Smooth Operator, Click It or
• ic es and enforcing speed compliance and toll lane use at the various facility toll plazas.
r,
• of H.E.A.T. and CVSU-ADU routinely are assigned to assist patrol at various
Upcom
rocess is used to identify facility areas that may be in need of illision frequency or cha
• Police coPatrols, DUI Checkpoints, Seatbelt/Child Safety Seat enforcement and Aggressive Drivingidentification. Detachment Commanders are encouraged to develop and implement traffic stheir respective detachments on a regular basis as a means of increasing compliance to trafficregulations. Collision Fatality Rate for MdTA Facilities for 2002004 was 81.38% lower than national average and 2005 was 76.19% lower than the national average. Collision Injury2004 was 78.72% lower than national average and 2005 was 80.20% lower than national average. MdTA PoliceTicket, CVSA -Operation Airbrake and CVSA Road check. Partnering with MdTA Operations and MdTA Engineering, MdTA Police are identifying traffsafety issu
• MdTA Police utilize technology to enhance ability to detect traffic violators (I.E. Radar, LaseMDC’s, License Plate Readers, PBT’s, PrePass.) Membersfacilities to enhance the visible presence of police at those facilities as a means of increaseregulatory compliance.
ing Issues: • Construction/Rehabilitation projects at the Bay Bridge and the Hatem Bridge. During these
types of projects, there is an increased need for enforcement presence as collisions are more
Future
likely to occur due to congestion and driver impatience.
Actions
• CVIEW (CVISN) will be introduced and utilized by MdTA Police CVSU personnel during the fy
rting data – data supplied from MdTA Police
Commercial Vehicle Inspection process which will bring information from several State andFederal databases to the inspector/officer during the conducting of an inspection better identiMotor Carrier compliance to regulations.
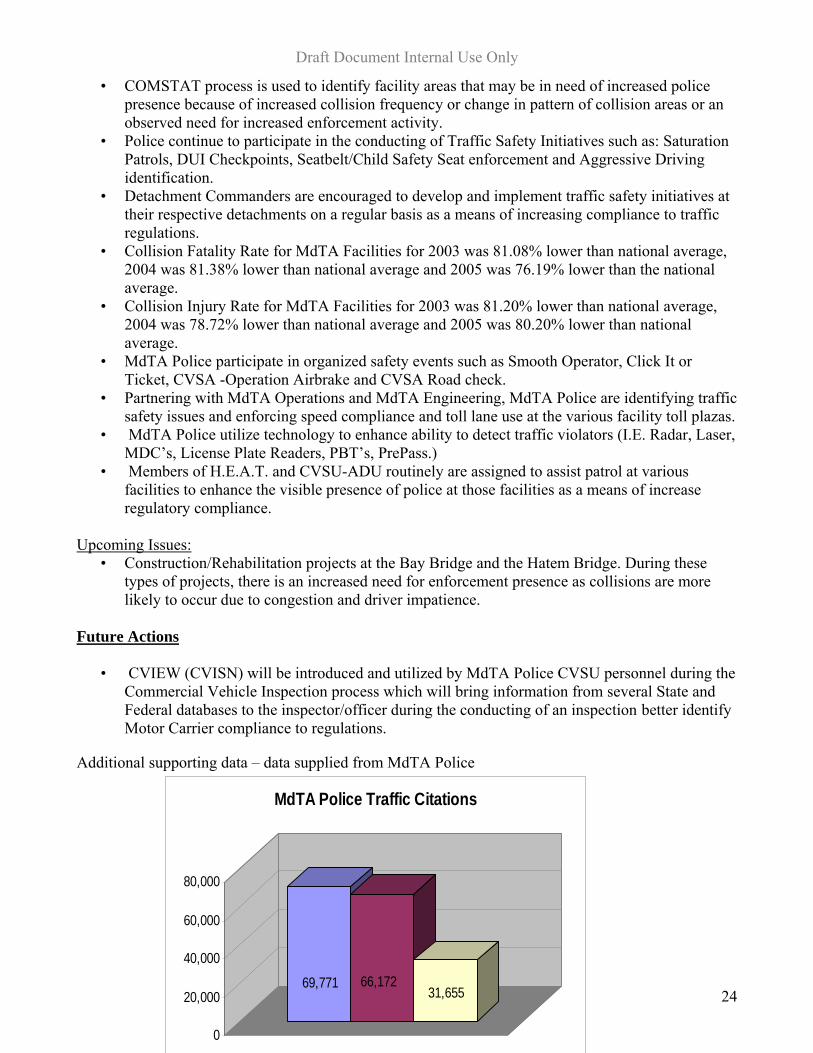
Additional suppo
80,000
2469,771 66,172
31,655
0
20,000
40,000
60,000
MdTA Police Traffic Citations
Draft Document Internal Use Only
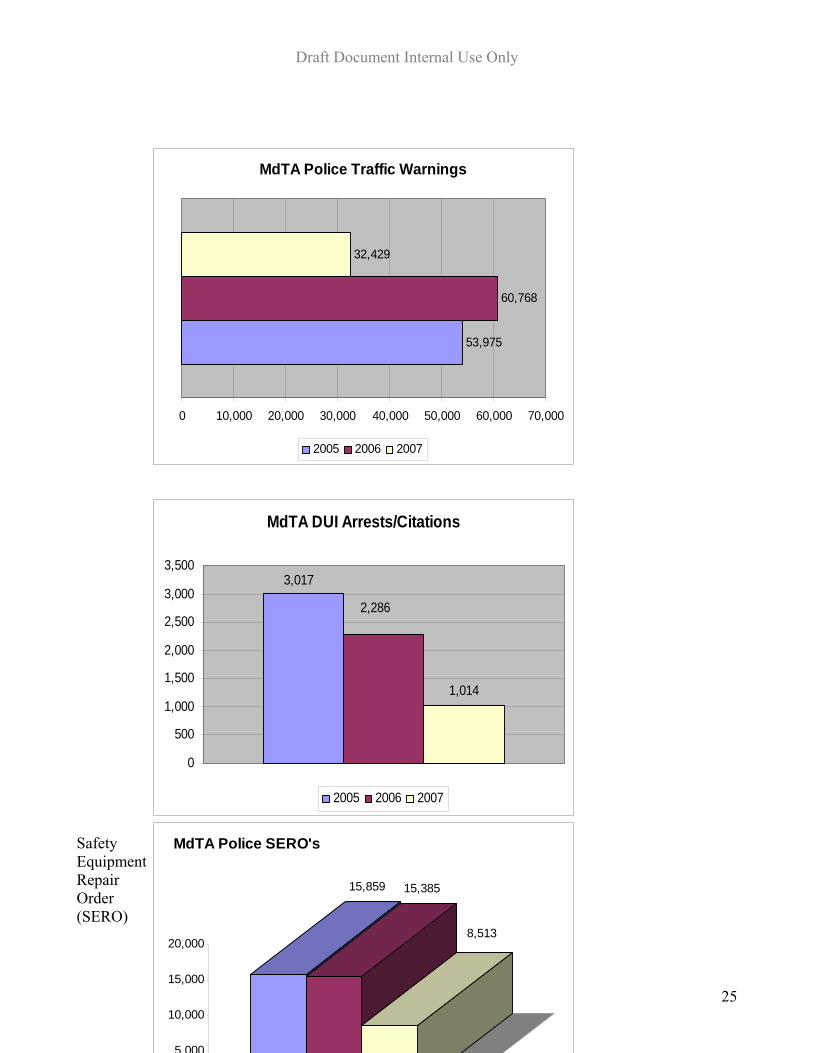
MdTA Police Traffic Warnings
53,975
60,768
32,429
0 10,000 20,000 30,000 40,000 50,000 60,000 70,000
2005 2006 2007
afety ent
epair rder ERO)
SEquipmRO(S
25
MdTA DUI Arrests/Citations
3,0173,500
1,014
2,286
0
500
1,000
1,500
2,000
2,500
3,000
2005 2006 2007
15,859 15,385
8,513
5 000
10,000
MdTA Police SERO's
15,000
20,000
Draft Document Internal Use Only
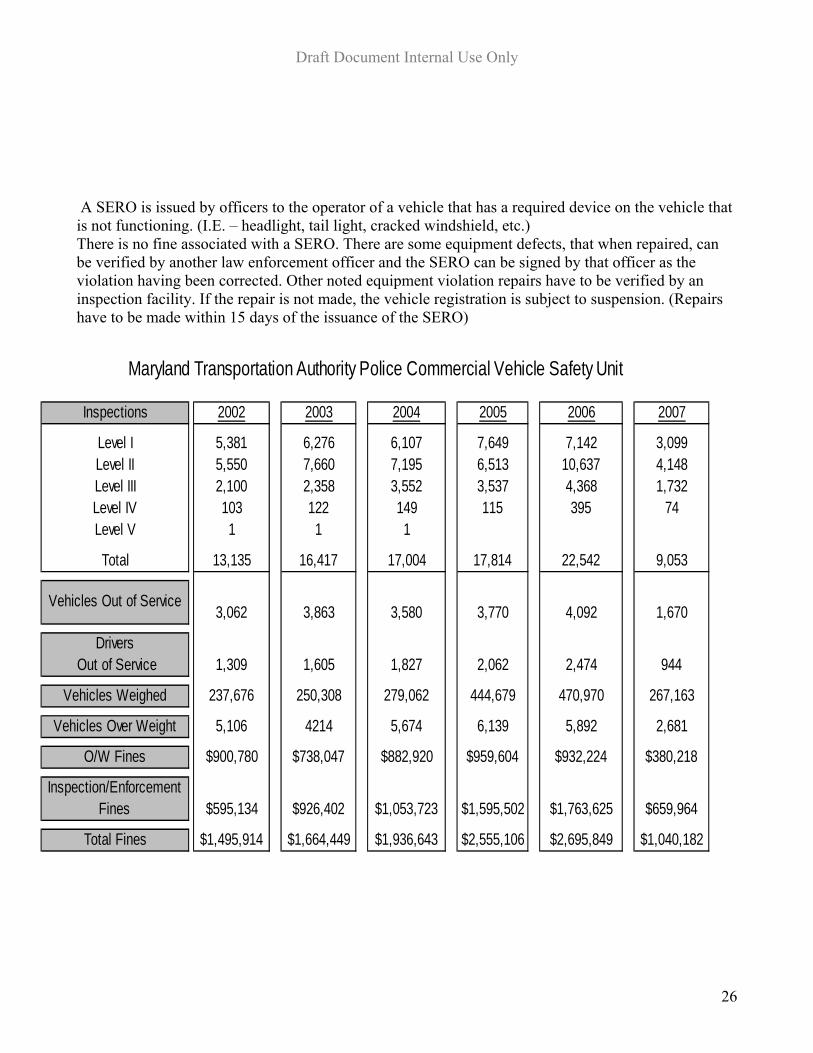
A SERO is issued by officers to the operator of a vehicle that has a required device on the vehicle that
not functioning. (I.E. – headlight, tail light, cracked windshield, etc.) There is no fine associated with a SERO. There are some equipment defects, that when repaired, can e verified by another law enforcement officer and the SERO can be signed by that officer as the
violation having been corrected. Other noted equipment violation repairs have to be verified by an
is
b
inspection facility. If the repair is not made, the vehicle registration is subject to suspension. (Repairs have to be made within 15 days of the issuance of the SERO)
2002 2003 2004 2005 2006 2007
5,381 6,276 6,107 7,649 7,142 3,0995,550 7,660 7,195 6,513 10,637 4,1482,100 2,358 3,552 3,537 4,368 1,732103 122 149 115 395 741 1 1
13,135 16,417 17,004 17,814 22,542 9,053
237,676 250,308 279,062 444,679 470,970 267,163
5,106 4214 5,674 6,139 5,892 2,681
$900,780 $738,047 $882,920 $959,604 $932,224 $380,218
$1,495,914 $1,664,449 $1,936,643 $2,555,106 $2,695,849 $1,040,182
944
$659,964
Total Fines
Veh les Over Weight
1,827
O/W Fines
Inspection/Enforcement Fines $595,134 $926,402 $1,053,723 $1,595,502 $1,763,625
2,062 2,474
Vehicles Weighed
Drivers Out of Service 1,309 1,605
Total
Vehic es Out of Service3,062 3,863 3,580 3,770 4,092 1,670
Level IVLevel V
Level IILevel III
Level I
l
ic
Maryland Transportation Authority Police Commercial Vehicle Safety Unit
Inspections
26
Draft Document Internal Use Only
Commercial Vehicle Inspections – Level I - IV descriptions
North American Standard Level I Inspection. This is the most comprehensive inspection and includes the Level III Driver/Credential review. It also includes the inspection everything required for a Level II walk-around. The Level I inspection, however, requires a physical inspection of the underside of the vehicle, for such things as the brake system, coupling devices, exhaust system, frame, fuel system, steering mechanism, suspension and tires.
North American Standard Level II Inspection: Walk-Around Driver/Vehicle Inspection. Level II inspections include a Level III Driver/Credential review. In addition, the Level II inspection includes examination of all of the following, to the extent such items can be examined without requiring the inspector to get under the vehicle: turn signals, brake lamps, tail lamps, head lamps, lamps on projecting loads, safe loading, frame, tires, van and open-top trailer bodies, wheels and rims, windshield wipers, brake system, coupling devices, exhaust system, fuel system, steering mechanism, suspension, emergency exits on buses, and HM requirements, as applicable.
North American Standard Level III Inspection: Driver/Credential Inspection. As a minimum, Level III inspections must include, where required and/or applicable, examination of the driver’s license, medical certification, Skill Performance Evaluation (SPE) Certificate, driver’s record of duty status, hours of service, seat belt, vehicle inspection report, and HM requirements. Those items not indicated in the North American Standard Level III Driver/Credential Inspection Procedure shall not be included on a Level III inspection
Special Inspections – Level IV: Inspections under this heading typically include a one-time examination of a particular item. These examinations are normally made in support of a study or to verify or refute a suspected trend.
27
Draft Document Internal Use Only
4 - Key Focus Area: Fiduciary Responsibility (Supports Strategic Plan Goal > Strategic Financing: Financial Stewardship)
The Authority has a fiduciary duty to use its customers’ funds effectively and efficiently to perform its mission
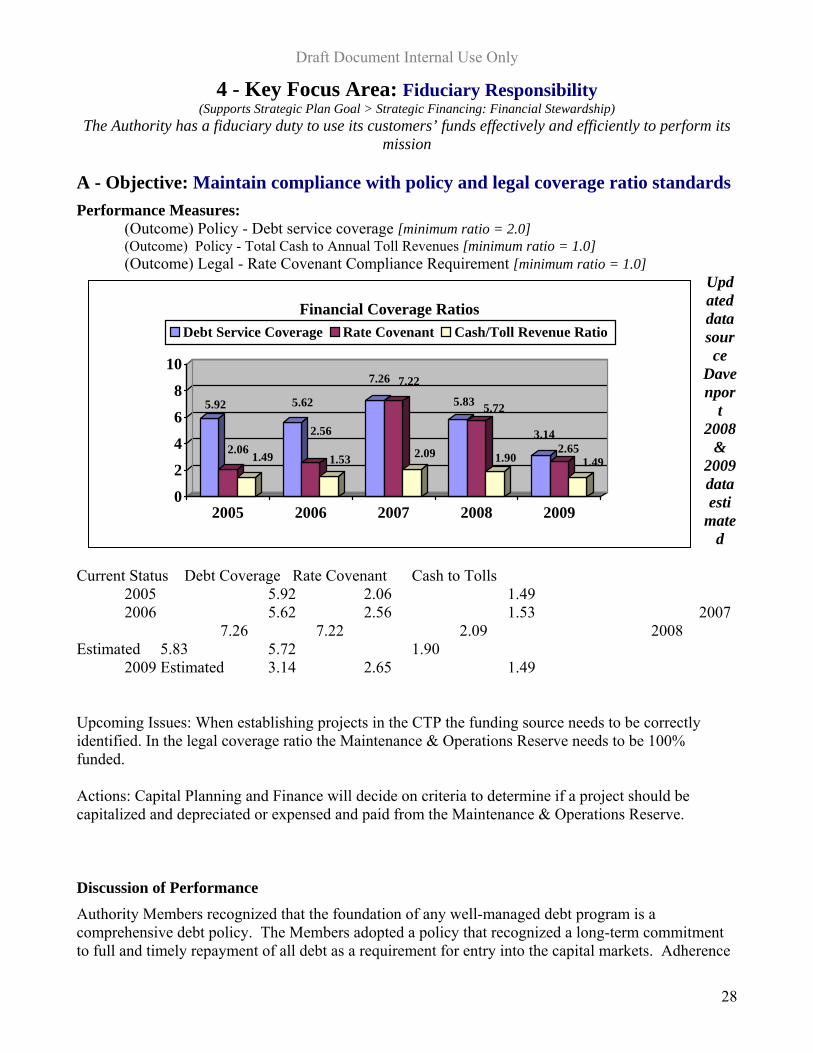
A - Objective: Maintain compliance with policy and legal coverage ratio standards Performance Measures:
(Outcome) Policy - Debt service coverage [minimum ratio = 2.0] (Outcome) Policy - Total Cash to Annual Toll Revenues [minimum ratio = 1.0] (Outcome) Legal - Rate Covenant Compliance Requirement [minimum ratio = 1.0]
Updated data source
Davenpor
t 2008
& 2009 data esti
mated
5.92
2.06 1.49
5.62
2.56
1.53
7.26 7.22
2.09
5.83 5.72
1.90
3.142.65
1.49
0
2
4
6
8
10
2005 2006 2007 2008 2009
Financial Coverage RatiosDebt Service Coverage Rate Covenant Cash/Toll Revenue Ratio
Current Status Debt Coverage Rate Covenant Cash to Tolls 2005 5.92 2.06 1.49 2006 5.62 2.56 1.53 2007 7.26 7.22 2.09 2008 Estimated 5.83 5.72 1.90 2009 Estimated 3.14 2.65 1.49
Upcoming Issues: When establishing projects in the CTP the funding source needs to be correctly identified. In the legal coverage ratio the Maintenance & Operations Reserve needs to be 100% funded.
Actions: Capital Planning and Finance will decide on criteria to determine if a project should be capitalized and depreciated or expensed and paid from the Maintenance & Operations Reserve.
Discussion of Performance Authority Members recognized that the foundation of any well-managed debt program is a comprehensive debt policy. The Members adopted a policy that recognized a long-term commitment to full and timely repayment of all debt as a requirement for entry into the capital markets. Adherence
28
Draft Document Internal Use Only
to the policy helps to ensure that the Authority maintains a sound debt position and that its credit quality is protected. This in turn should impact positively on the Authority’s costs to borrow money.
In the debt policy, the Authority has established a debt service coverage ratio of 2.0. This policy standard means that after paying for our operating costs from toll revenues, that the net revenues remaining should be at least twice our annual debt service payments. This coverage level is also consistent with “AA” rated toll roads and provides a cushion for unexpected events.
Authority Members have established a higher debt service coverage standard than that required by the legal Trust Agreement between the Transportation Authority and the Trustee Bank. The Trust Agreement requires a lower debt service coverage ratio of 1.2 and additionally requires that net revenues cover budgeted requirements for the Maintenance and Operations (M&O) Reserve Account. The latter Account was established to pay for the costs of extraordinary maintenance or repairs to the facilities. Thus, the legal coverage ratio must be 1.0 or higher and is a combination of net revenues covering annual debt service requirements by not less than 120% and M&O costs by not less than 100%.
The Authority has also established a policy to maintain total cash reserves each year at a level equal to one year’s toll revenues. These reserves include a Debt Service Reserve Fund equal to maximum annual debt service on the Authority’s bonds and other funds established under the Trust Agreement including operating reserves, and any other funds which may be available or planned for capital expenditures, extraordinary maintenance, or any other lawful purpose. This level of reserves is consistent with those maintained by most AA rated toll systems in the United States and provides protection against unanticipated events that could interrupt the Authority’s plans.
Current financial ratio projections through FY 2008 for debt service coverage, M&O Account coverage, and cash reserves are well above policy standards and legal requirements. Given the magnitude of the Authority’s capital program, including the incorporation of the Intercounty Connector (ICC) project, maintaining the current sound financial position of the Authority will be a challenging task. To maintain financial standards at required minimum levels will require an ongoing strategic process.
Strategies:
1. On a continuing basis, adjust/revise toll rates to generate the necessary revenues to support what is determined to be the essential operating and capital program spending requirements and to adhere to financial standards. [Strategic Development, Finance, Capital Planning, Operations, and Engineering (ORT)]
2. Careful priortization of projects in the six-year capital program, including evaluating the ability of the Authority to actually complete work within projected timeframes. [Capital Planning and Engineering]
3. Long-range planning beyond the six-year capital program that projects potential program needs as well as financial capabilities. [Capital Planning and Engineering]
29
Draft Document Internal Use Only
4 - Key Focus Area: Fiduciary Responsibility (Supports Strategic Plan Goal > Strategic Financing: Financial Stewardship)
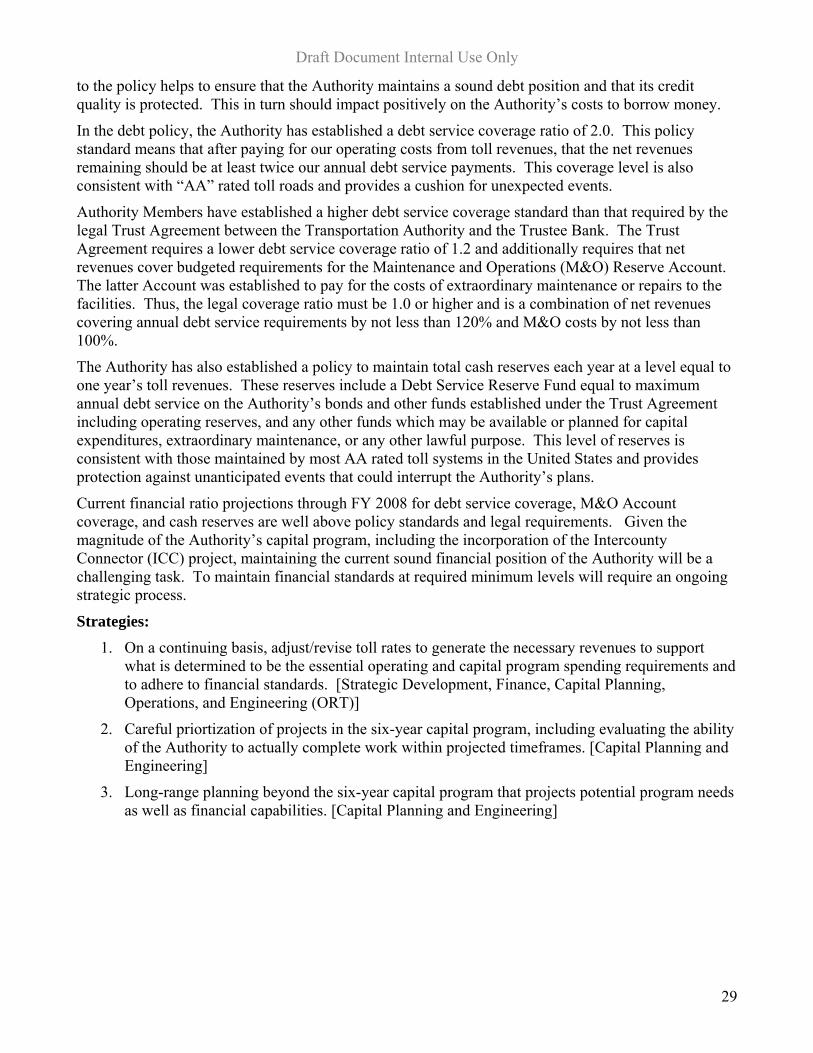
B - Objective: Maximize collection of expected toll revenue by recovering toll evasion revenue Performance Measures:
(Outcome) Percent Toll Evasion Revenue Resolved
0.0%0.2%0.4%0.6%0.8%1.0%1.2%1.4%1.6%1.8%2.0%
FY 2004 FY 2005(as of 10/06)
FY 2006(as of 10/06)
FY 2007(Thru 4/07 a/o
8/07)
Toll Evasion % Expected RevenueTolls Outstanding % Expected Revenue
Toll Evasion Resolved
62.2%70.3% 81.0%
37.9%
76.1%
53.9% 40.6%25.1%0%
20% 40% 60% 80%
100%
FY 2004 FY 2005(as of 10/06)
FY 2006 (As of 10/06)
FY 2007(Thru 04/07) a/o
8/07
Toll Evasion Revenue Resolved% Outstanding Receivable to Break Even
Data supplied by Operations July 2007
30
Draft Document Internal Use Only
Current Status:
The trends are positive: The violation rate has dropped to less than 1% of traffic; toll violations as a % of expected revenue have declined to 1.5%; tolls outstanding as a % of expected revenue have declined to less than 0.4%; and toll evasion resolved has increased to over 80%.
(Upcoming Issues:
(1) The utilization of the existing Violation Enforcement System with the concurrent integration of the ETC-Next Generation equipment and system integration software will require close observation to insure there are no viruses or inconsistencies in the video capture and subsequent reporting process.
(2) The significant number of outstanding violations attributable to the rental and leased vehicle fleets will be addressed using the existing business rules, COMAR, and Maryland statutes. These currently represent more than 50% of the chronic toll violation accounts.
Actions:
(1) The E-ZPass Staff Group continues to work closely with the MVA and CCU to pursue the chronic toll violators. A Police vehicle has been equipped with License Plate Recognition Cameras to support this initiative and several toll violators have been apprehended during the last 4-6 weeks while this system has been in use.
(2) Two plaza violation enforcement exercises have been conducted (FSK 7/19 and BHT 8/24) with MdTA Police issuing more than 15 citations. Subsequent enforcement exercises during the next quarter will be conducted at the FSK, BHT, and JFK toll plazas. The related media releases on these should prompt additional local and national media coverage.
(3) Media has planned a “Keep Your Account Current” campaign to reduce the number of careless E-ZPass customer violations.(Note: Approximately 40% of all toll violators are Maryland E-ZPass customers. Discussion of Performance Throughout the toll industry as ETC use has increased so has the number of toll violations. The efforts to recover this lost toll revenue by the Authority have been expanded since FY 2003 and significant results have been achieved. Continued efforts in development and implementation for recovery of toll evasion revenue should increase the amount of recovered toll revenue realized.
Strategies:
1. Research viable programs with rental and lease vehicle agencies to significantly reduce associated violations. [E-ZPass Operations]
2. Expand violation look-up scope to include additional commercial vehicles from more states with look-up fees; work with MVA to achieve no-charge reciprocity.[Information technology – AAMVA interface or MVA IRP] [E-ZPass Operations] (Joe N. to include note on CCU)
3. Use appropriate media events and publicity to emphasize the significance of account management and toll enforcement to enhance the overall violation collection effort and to deter potential violators. [Communications and E-ZPass Operations]
4. Improve violation correspondence procedures and apply available enforcement tools earlier to improve collection rates. [E-ZPass Operations]
5. Increase enforcement activities of Authority Police using fixed and mobile OCR cameras and uniformed officers dedicated to the apprehension of chronic toll violators and targeted enforcement measures. [Information technology – data storage & server capacity] [MdTA Police and E-ZPass Operations]
31
Draft Document Internal Use Only
4 - Key Focus Area: Fiduciary Responsibility (Supports Strategic Plan Goal > Strategic Financing: Financial Stewardship)
C - Objective: By the end of FY 2008, develop policy options to guide business practices/rules that align operational costs and toll revenues. Performance Measures:
(Efficiency): Cost per manual transaction ($0.40) (Efficiency): Cost per ETC transaction ($0.36) (Outcome): TBD
Illustration of Performance – to be developed (see Actions listed below) Finance The Cost per manual transaction and electronic transaction may not be accurate. The Cost per transaction was determined with a wide range of variables. Please consider using the information from the consultant. NOTE from Operations: this objective has so many variables that it does not lend itself to a graphic representation in the whole. However, there may be some sub-sets that can be represented pictorially, e.g. accounts closed; image capture rates; number of commercial commuters Current Status: Finance PB Consultant, Inc. is currently in the processing of completing an analysis to determine cost per transaction based on actual revenues and expenses for FY06 & FY07. They will forecast cost per transaction FY08 – FY12 based on the budget. A draft copy will be delivered to MdTA on August 31st. Operations (1) Policy Considerations Based on Cost Categories:
(a) Strategic has hired a consultant to develop a cost per transaction model and estimate. This consultant has obtained all of the background information from Operations and E-Zpass that was used to generate our previous internal staff estimates of $0.40 per manual transaction and $0.36 per ETC transaction. (b) Inactive Accounts: No change from previous situation: ACS has place approximately 13,000 accounts in an inactive status and is not billing the Authority for monthly account management fees. These accounts and a large number of other inactive accounts need to be formally closed. (c) Although the Image Review Process has improved, the cameras continue to be the “weakness” in the Violation Enforcement System. The monthly and annual reports from ACS regarding Images Reviewed reflect that we should develop a graph that portrays the % of Toll Violations Noticed (41% in FY07) and the % Rejected (52%). (d) The current Toll Revenue Study is considering the cost recovery options associated with both transponder costs and monthly account management fees.
(2)Policy Considerations Based on Customers: The current Toll Revenue Study is exploring all of the items contained in this particular Objective, including: commuter discount rates, post-paid commercial rebates; and the duration of the commuter plan. (3) Congestion Management and ORT: A Concept of Operations document has been developed by Engineering with outside consultant assistance. The toll policy options for the ICC (ORT including video accounts) and the ETL (E-ZPass Only) have been discussed but specific toll rates have not been developed. Congestion Management studies have also been conducted by outside consultants.
32
Draft Document Internal Use Only
Upcoming Issues: Finance August 31, 2007 - Delivery of the draft copy cost per transaction completed by the consultant. Operations The Toll Revenue Study implementation will have a direct effect on several of the reportable items in this objective. The decisions in this regard will subsequently require specific actins that can be reported.
Actions Finance Once MdTA receives the draft copy, Finance will complete the Performance Measures. Operations E-ZPass Operations will develop and maintain the data related to Inactive Accounts and Image Rejection Rates. The trends for both of these items can be easily portrayed on graphs. The long-standing issue of Inactive Accounts deserves greater attention by the Authority’s staff. The Congestion management and ORT reports must be finalized and reported as necessary.
Discussion of Performance Over the past few years, the MdTA has taken on expanded roles and responsibilities in numerous aspects of its program – capital development, security, preventive maintenance, and customer service (ETC, ITS, VRT’s, Bay Span, etc). To address this expanded role, additional maintenance, operational, and management expenses have been necessary. With this realization, the Authority has embarked upon a wide ranging business analysis to determine the costs associated with the various aspects of the programs, to look for changes to existing business practices that will produce meaningful revenue or cost reductions to off set costs. In addition, a thorough review of our toll pricing schedule, discount plans, and business accounts will be completed to look for additional revenue sources to cover costs as well as to provide some needed equity among customers using our different facilities.
The divisions of Finance and Operations have developed a rudimentary cost per transaction for electronic toll collection ($0.36) and for manual toll collection. However, there is a need for overall guidance or policy to determine degrees of direct and indirect costs to be covered within the Authority’s toll structure (e.g. the indirect cost including only the immediate Operations/Finance staffs (i.e.: toll audits), not all other MdTA overheads like maintenance, police, executive office, etc.) There had been a previous preliminary attempt by Finance to assign maintenance and police costs to Manual and ETC, with the end result of almost doubling the cost per transaction.
Strategies: Consideration of policies based on certain cost categories -
1. Establish cost-per electronic transaction model / formula (currently working with a contractor to develop this product) [Operations, Finance]
2. Consider policy options that align E-ZPass account maintenance costs with toll revenue generated, and/or associated administrative costs. [Strategic Development, Finance, Capital Planning, Operations, and Engineering (ORT)]
2.1. Explore the policy effect of closing inactive E-ZPass accounts or applying administrative fees for non-use to cover annual costs. [Strategic Development, Finance, Capital Planning, Operations, and Engineering (ORT)]
2.2. Consider policy options that improve image capture rates (to be addressed with new camera in ETC-Next Generation) for the toll system and consider the costs of excessive I-toll use by individuals. [Strategic Development, Finance, Capital Planning, Operations, and Engineering (ORT)]
33
Draft Document Internal Use Only
3. Assess the policy implications of achieving cost recovery for the cost of new and replacement transponders [Strategic Development, Finance, Capital Planning, Operations, and Engineering (ORT)]
Strategies: Consideration of toll policies based on types of customers
4. Explore policy options that consider equity goals for discount programs, including commuter plans, frequent traveler plans, and post-paid commercial discounts [Strategic Development, Operations, Communications and Finance]
4.1. Consider the policy affect of business rule changes to eliminate the "commercial commuter" loophole for 2 axle vehicles on registered to business accounts. [Strategic Development, Finance, Capital Planning, Operations, and Engineering (ORT)]
4.2. Review policy options that consider the impact of the existing Post-Paid Discount program (affect of increased eligibility thresholds and reduction to discount percentages). [Strategic Development, Finance, Capital Planning, Operations, and Engineering (ORT)]
4.3. Assess policy options to address the time period for commuter discount programs. [Strategic Development, Finance, Capital Planning, Operations, and Engineering (ORT)]
5. Develop model to determine the impact of various vehicle classes on system maintenance by facility(Highway Cost Allocation Study) [Strategic Development, DoIT – server and network capacity] (was #2)
Strategies: Preparing for congestion management and Open Road Tolling (ORT)
6. Evaluate policy options that consider open road toll rates and the cost of video tolls. [Strategic Development, Finance, Capital Planning, Operations, Communications and Engineering (ORT)]
7. Develop a price-management policy considering and selecting from the following criteria: o
Start-up pricing levels required for minimum financial revenue Basic Rate Structure
o “Preset” variable rate periods (daily, weekly, annual) o Point-to-point rate structure for each class of vehicle o Minimum and maximum distance toll rates o
o Transaction Applications, Methodologies, and Costs o
Video pre-arranged EZ-Pass
o Video pre-paid o Video post-paid o Violations o
Rate adjustment methodology o Formula for periodic adjustments due to inflation o Level-of-Service (LOS) target to assure “free flow” conditions o Methodology for monitoring LOS and formula for rate adjustments to maintain target LOS o Marketing, Signing, and public outreach o Posting of rates – media options (highway signage at point of entry, website, email, etc.) o Transaction feedback o Call-in procedures for video-toll options o Service/Stop-in Centers o
[Strategic Development, Finance, Capital Planning, Operations, Communications and Engineering (ORT)]
34
Draft Document Internal Use Only
4 - Key Focus Area: Fiduciary Responsibility (Supports Strategic Plan Goal > Strategic Financing: Financial Stewardship)
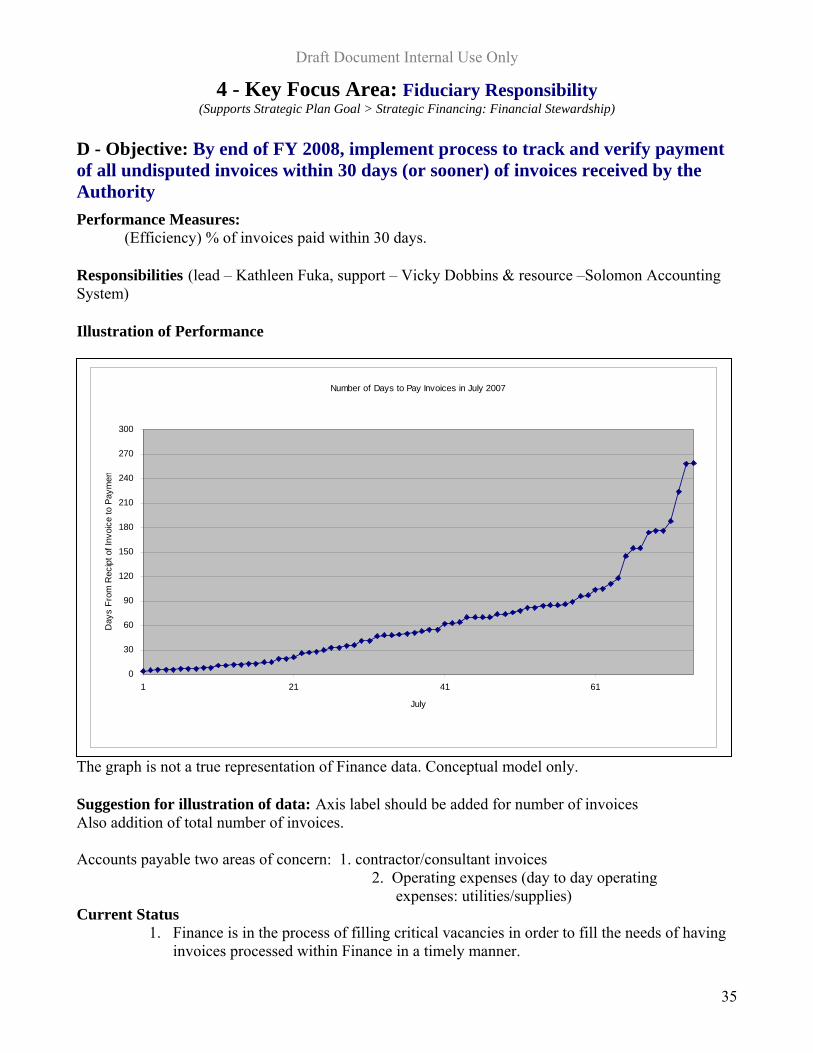
D - Objective: By end of FY 2008, implement process to track and verify payment of all undisputed invoices within 30 days (or sooner) of invoices received by the Authority Performance Measures:
(Efficiency) % of invoices paid within 30 days. Responsibilities (lead – Kathleen Fuka, support – Vicky Dobbins & resource –Solomon Accounting System) Illustration of Performance
The graph is not a true representation of Finance data. Conceptual model only.
Number of Days to Pay Invoices in July 2007
0
30
60
90
120
150
180
210
240
270
300
1 21 41 61
July
Day
s Fr
om R
ecip
t of I
nvoi
ce to
Pay
men
Suggestion for illustration of data: Axis label should be added for number of invoices Also addition of total number of invoices. Accounts payable two areas of concern: 1. contractor/consultant invoices 2. Operating expenses (day to day operating expenses: utilities/supplies) Current Status
1. Finance is in the process of filling critical vacancies in order to fill the needs of having invoices processed within Finance in a timely manner.
35
Draft Document Internal Use Only
a. Critical Vacancies i Construction/Consultant Invoice Review Dept
· Accountant Advanced – Construction/Consultant Review department – recruited and selected. Offer to be made to candidate by COB 8/24/07.
ii. iA/P Department · Two (2) Toll Revenue Clerk II positions – positions posted – 8/17/07. Closing date – 9/10/07. Interviews to be scheduled for week of 9/24/07
2. Finance is developing internal systems and procedures to maintain a constant workflow
within Accounts Payable. a. Construction/Consultant Invoice Review Dept
i. Coordinating with engineering paperwork flow essential to invoice approval
· Developing system to track invoices to ensure payment within 30 days b. A/P Department · Developing work flow processes to ensure payment within 30 days
3. Information and instruction materials are being written for training of all Authority
Divisions. a. Once materials are completed by A/P Supervisor, materials will be proofed by
Finance to ensure logical flow and completeness i. Training materials will be tested in Finance Division ii. Training materials will be tested on another Division
Finance will develop processes for payment, training staff to payment process. All staff must be flexible as Finance learns what works and what does not. Finance will need input and assistance from all Divisions while this process is fully developed and implemented.
Upcoming Issues
1. Training Coordination 2. Who will train 3. Tracking of invoices to determine 30 Day payment
a. Invoices are received either in Finance OR at Facilities i. Invoices received in Finance may have to be sent to Facilities for approvals, back up documentation, etc
(External auditors expect documentation to backup for invoice approval)
4. Turn around time
a. Training will instruct on turn around time.5Tracking of invoices sent to Facilities for approval i. Manual process
36
Draft Document Internal Use Only
ii. Copies to Facilities iii. Tracking by copy
5. Formulate process to extract information from Solomon regarding disputed and undisputed invoices
i.This process will give data on chronic issues
6. Develop Crystal Reports to capture required data and graph data Should avail itself to drive down data to employee – graphs should be generated through Crystal Reports
a. Determine proper data fields in Solomon to use for reports Accurate definition is in process of development and partial implementation. Finance will begin to track the number of transactions that actually come into the Division and the number of invoices each clerk handles so that work load can be more evenly spread for more efficient turn around time of payment.
Actions
1. Complete A/P Invoice Training Materials 2. Coordinate with DOD, etc to hold trainings
Finance to begin training in January 2008 (Administration volunteered to go first as part of the pilot program. Print shop volunteered to print pamphlets etc.) Facilities are not consistent in practices for purchasing – MAXIMO will assist this effort because of consistent coding. Credit Card Expenditures; annually bought items can be purchased through contract to purchase at best price. Discussion of Performance The Authority lacks a systematic process to ensure invoices are sent to Finance in a timely manner. This causes Finance to receive the invoices too late to pay them on time. The result is late-fees and penalties, which are counter to the Authority’s Key Focus Area of Fiduciary Responsibility. Tracking invoices from receipt to payment presents a data collection challenge. Senior leaders will work together to resolve this challenge to monitor our progress in this area.
Strategies: 1. Invoices will be date stamped upon receipt by Finance [Accounts Payable] 2. Work with RCs to reduce the time required by them to review invoices and return them to
Finance. [Finance – coding process, with review and approval process] 3. Employees in Authority Divisions will be trained on the requirements of invoice coding,
invoice backup and timeliness of forwarding invoices to Finance [Finance] 4. Develop and implement an Authority-wide process and practice (much like the HR Hiring
Practices development) for the receipt and payment of undisputed invoices. [Finance will lead the effort, however, all Divisions will be involved in the development and implementation of the process and practice]
* Invoice dates exist, payment dates exist. Need Finance or Authority received date.
Title 15, subtitle1 [Finance plus Procurement] COMAR 21.07.01.18
37
Draft Document Internal Use Only
4 - Key Focus Area: Fiduciary Responsibility (Supports Strategic Plan Goal > Strategic Financing: Financial Stewardship)
E - Objective: By end of FY 2008, produce monthly operating budget reports within 30 days of the end of the prior month Performance Measures:
(Outcome): % of financial reports produced within 30 days (Efficiency): Average amount of days to produce monthly financial reports
Responsibilities (lead – Kathleen Fuka, support – Vicky Dobbins & resource –Susan Matura, Solomon Accounting System) Illustration of Performance No illustration as of August 28, 2007. (Suggested illustration would show number of invoices and number of days to pay invoices – lends itself to reporting on quarterly basis with the ability to drill done data to monthly basis) Current Status
1. Finance is in the process of filling critical vacancies in order to fill the needs of having monthly budget reports posted within 30 days of the end of the prior month
a. Critical Vacancies i. G/L Department
· One (1) Toll Revenue Clerk II position – position posted on 8/17/07. Closing date – 9/10/07. Interviews to be scheduled for week of 9/24/07 · One (1) Toll Revenue III position – in the process of being reclassed from TRC II
◦ Once position is reclassed, position will be posted
2. Finance is developing internal systems and procedures to maintain a constant workflow within the General Ledger Department (Business Analyst to assist in coding implementation)
a. Developing work flow processes with A/P to ensure payment within 30 days (Purchasing Cards, Payroll Posting, etc) Steps as they are now followed:
1. Invoice received by Finance and charge line 2. Budget-coding done by RC’S 3. Then approval by manager 4. Then sent back to Finance for allocation and payment
This process will be streamlined to become more efficient and effective as a business process for the Authority
Track: Responsibility to ensure timeliness of payment process. Suggested that this be part of annual EMPRES Evaluation’
38
Draft Document Internal Use Only
(F) Upcoming Issues
1. Hiring TRC II and TRC III 2. Streamline payroll credit processes 3. Streamline Purchasing Card allocation process a. Purchasing Cards i. Streamline process by which purchasing cards are received, reviewed and allocated
(G) Actions
1. Complete A/P Invoice Training Materials 2. Coordinate with DOD, etc to hold trainings
NOTE: Actions are the same for Objective D & E as both Objectives are intertwined. Discussion of Performance The Division of Finance has historically attempted to have operating budget reports distributed to Authority divisions no later than 30 days after month-end. Over the last year, the Division has fallen considerably behind in providing the reports.
Strategies:
1. Hire and retain necessary accounting staff to insure that the monthly reports will be completed and distributed in a timely manner. [Finance]
2. Research and implement an upgrade to the current financial management software application. [Finance –– Solomon reports: define which reports and format, Information Technology]
3. Work with ITA to make Business Portal available to managers. This will greatly facilitate budget and expenditure review. [Finance – On the intranet, need training & modification of the format]
39
Draft Document Internal Use Only
4 - Key Focus Area: Fiduciary Responsibility (Supports Strategic Plan Goal > Strategic Financing: Financial Stewardship)
F - Objective: Maximize returns on invested capital within the constraints of the Trust Agreement, Investment Policy, and cash flow needs. Performance Measures:
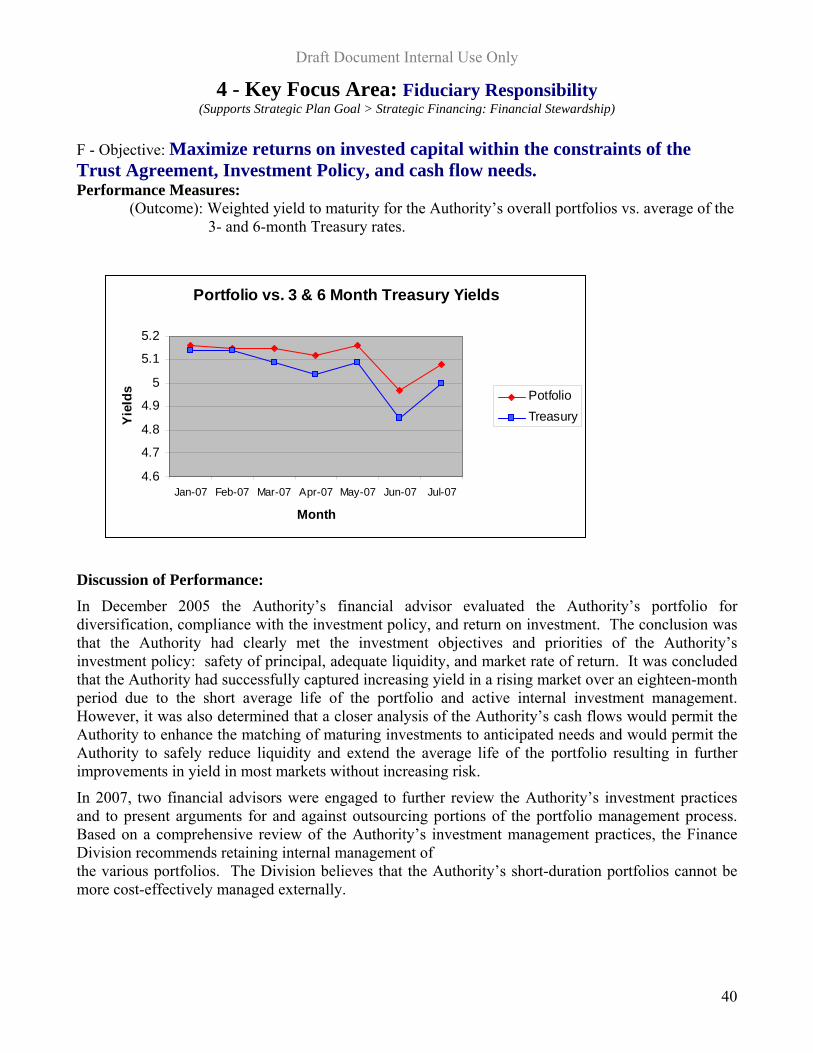
(Outcome): Weighted yield to maturity for the Authority’s overall portfolios vs. average of the 3- and 6-month Treasury rates.
Portfolio vs. 3 & 6 Month Treasury Yields
4.6
4.7
4.8
4.9
5
5.1
5.2
Jan-07 Feb-07 Mar-07 Apr-07 May-07 Jun-07 Jul-07
Month
Yie
lds Potfolio
Treasury
Discussion of Performance: In December 2005 the Authority’s financial advisor evaluated the Authority’s portfolio for diversification, compliance with the investment policy, and return on investment. The conclusion was that the Authority had clearly met the investment objectives and priorities of the Authority’s investment policy: safety of principal, adequate liquidity, and market rate of return. It was concluded that the Authority had successfully captured increasing yield in a rising market over an eighteen-month period due to the short average life of the portfolio and active internal investment management. However, it was also determined that a closer analysis of the Authority’s cash flows would permit the Authority to enhance the matching of maturing investments to anticipated needs and would permit the Authority to safely reduce liquidity and extend the average life of the portfolio resulting in further improvements in yield in most markets without increasing risk.
In 2007, two financial advisors were engaged to further review the Authority’s investment practices and to present arguments for and against outsourcing portions of the portfolio management process. Based on a comprehensive review of the Authority’s investment management practices, the Finance Division recommends retaining internal management of the various portfolios. The Division believes that the Authority’s short-duration portfolios cannot be more cost-effectively managed externally.
40
Draft Document Internal Use Only
Strategies 1. Continue to structure the investment portfolio with periodic maturities based on available cash
flow information and prudent estimates. [Finance]
2. Purchase investments in each fund based on targeted time horizons and the outlook for the term structure of interest rates. [Finance]
3. Receive at least three competitive bids from dealers. [Finance]
(Address highest yield and keep dealings ethical)
4. Set security type target allocations. [Finance]
5. Calculate monthly the market value of the portfolio. [Finance]
Discussion of Performance: In December 2005 the Authority’s financial advisor evaluated the Authority’s portfolio for diversification, compliance with the investment policy, and return on investment. The conclusion was that the Authority had clearly met the investment objectives and priorities of the Authority’s investment policy: safety of principal, adequate liquidity, and market rate of return. It was concluded that the Authority had successfully captured increasing yield in a rising market over an eighteen-month period due to the short average life of the portfolio and active internal investment management. However, it was also determined that a closer analysis of the Authority’s cash flows would permit the Authority to enhance the matching of maturing investments to anticipated needs and would permit the Authority to safely reduce liquidity and extend the average life of the portfolio resulting in further improvements in yield in most markets without increasing risk.
41
Draft Document Internal Use Only
5 - Key Focus Area: Efficient and Effective Business Process (Supports Strategic Plan Goal > Efficiency and Effectiveness)
A - Objective: By June 2008, reduce the modal* average time required to hire an employee to 45 days (“SHARP”) Performance Measures:
(Efficiency): Modal average time required to fill an ES position (Efficiency): Modal average time required to fill a CS position
Responsibilities
Lead: HR Administrator Support: DOA Director, HR Staff, IT Project Manager Resource: Work Flow Specialty Contractor (Momentum)
Illustration of Performance Not yet implemented Measures: Modal average time required to fill ES position Modal average time required to fill CS position Clock pauses for out-of-process activities such as a required classification study (the time for C&C to review for determination of the need for such a study is part of the metric)
Current Status
• Initial step was documentation of multi-step recruitment process; completed early 2006 • Mid – 2006 decided to automate process to help improve process and help gather
metrics • Received proposal for HR Hiring Process from RESI dated December 21, 2006
(subcontracted to Momentum) • IT Project Manager Mike Carson provided by DoIT • System design team includes customers (Hiring Managers) and IT experts • First HR Design Session: April 19, 2007 • System given the name “SHARP” • PIN Control Process is being reviewed (see Actions)
Upcoming Issues
• First demo of basic SHARP system: June 22, 2007 • Further refinement of features will continue • Target launch date: December 2007
Actions
• Substantial system design and testing work remains
42
Draft Document Internal Use Only
• The PIN Control process redesign is also being undertaken. This, among other things, is intended to jump start the SHARP process for new PINS be priming the organization to fill them as they become available.
• Elements of the improved process have been informally adopted already, and will be observed to see if they are a good fit in the final product. These include:
• contacting interviewees by telephone in lieu of mailing appointment letters; • reducing job announcement posting time from 30 days to 14 days; • encouraging submission of hiring packet to EO directly from the hiring manager vs HR
serving as conduit
Discussion of Performance The Authority must work within the guidelines of Maryland’s Transportation Human Resource System. The time required to hire an employee impacts the Authority’s productivity and its ability to hire the best quality applicant. In an effort to improve the efficiency of the hiring process, the Authority formed a Hiring Process Review Committee. The work of this committee and the Division of Administration have resulted in a more comprehensive understanding of the steps in the hiring process and the role each step plays in the amount of time necessary to complete the process. It is anticipated that the recommended process improvements will reduce the average time required to hire an employee. Strategies:
1. By December 2007 implement hiring process changes initiated in the document workflow project called Streamlined Hiring and Recruitment Process (SHARP) which also includes automation of the "Recruitment" and "Position Determination" business processes. [Administration]
2. Revise recruitment application/advertisement templates to more accurately communicate employment offerings and incorporate agency branding [Administration & Communications]
43
Draft Document Internal Use Only
5 - Key Focus Area: Efficient and Effective Business Process (Supports Strategic Plan Goal > Efficiency and Effectiveness)
B - Objective: By end of FY 2008 develop and establish performance measures to ensure Capital Program delivery Performance Measures:
(Efficiency) Time to Design Projects – Example: Completion of design work within X weeks of estimated date (Efficiency) Time to Procure (Bid, Award and provide Notice To Proceed) Construction Contracts – Example: Advertisement of X% of all construction projects within the quarter assumed in the most recent CTP or Percent of projects that receive NTP within X weeks of advertisement. (Efficiency) Time to Complete Construction Contracts as compared to allowed days – Example: Percent of projects completed within 10%t of the number of days allowed in the original contract (Outcome) Percent of construction projects completed within X% of both the estimated cost and estimated completion timeline (Output) Achieve a 90% annual expenditure within three years of the amount in the final CTP (currently at 72 %?)
Responsibilities Lead: Engineering and Construction Support/Resource: Capital Planning Illustration of Performance
44
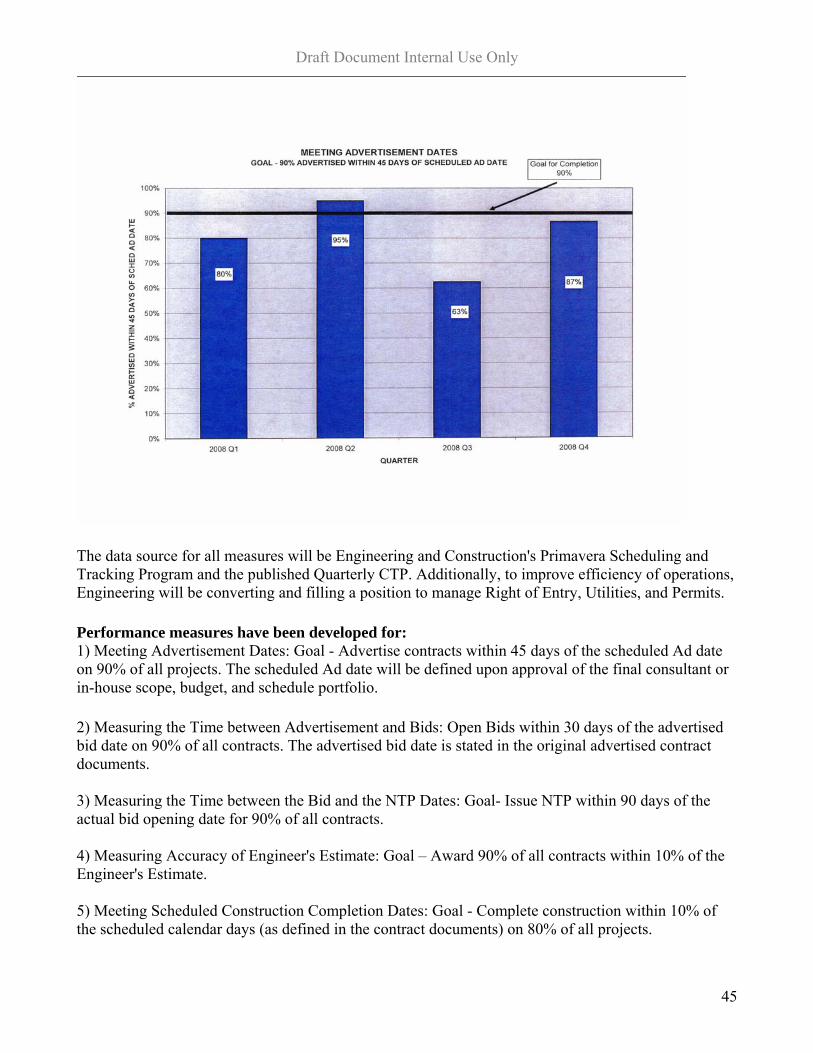
Draft Document Internal Use Only
The data source for all measures will be Engineering and Construction's Primavera Scheduling and Tracking Program and the published Quarterly CTP. Additionally, to improve efficiency of operations, Engineering will be converting and filling a position to manage Right of Entry, Utilities, and Permits. Performance measures have been developed for: 1) Meeting Advertisement Dates: Goal - Advertise contracts within 45 days of the scheduled Ad date on 90% of all projects. The scheduled Ad date will be defined upon approval of the final consultant or in-house scope, budget, and schedule portfolio. 2) Measuring the Time between Advertisement and Bids: Open Bids within 30 days of the advertised bid date on 90% of all contracts. The advertised bid date is stated in the original advertised contract documents. 3) Measuring the Time between the Bid and the NTP Dates: Goal- Issue NTP within 90 days of the actual bid opening date for 90% of all contracts. 4) Measuring Accuracy of Engineer's Estimate: Goal – Award 90% of all contracts within 10% of the Engineer's Estimate. 5) Meeting Scheduled Construction Completion Dates: Goal - Complete construction within 10% of the scheduled calendar days (as defined in the contract documents) on 80% of all projects.
45
Draft Document Internal Use Only
6) Meeting Construction Bid Cost: Goal - Complete all Construction contracts within 10% of the bid price for 90% of all contracts. Current Status The Primavera Program is currently being populated with baseline schedules and costs. This program will be continually updated at each project milestone. Data analysis will be performed quarterly to generate performance measure results. Meaningful results are expected starting Summer, 2008. Upcoming Issues The database will continue to be populated in the upcoming months. Data compilation techniques will be developed. Discussions will be held with SHA concerning reporting requirements for StateStat. Actions: Preliminary Report Review scheduled for July 26, 2007 Discussion of Performance: The Authority’s capital program has grown significantly in the past three years and is more reliant on bond financing. In order to better serve the traveling public, stakeholders and internal customers, the Authority needs to: (1) accurately predict capital program cash flows; (2) deliver projects on a timely basis; and, (3) improve its ability to track delivery of the capital program that is published in the annual Consolidated Transportation Program (CTP). This means the Authority needs to be responsive yet realistic about the placement of projects in the CTP and efficient and effective in the design, procurement, construction management and expenditure of capital project dollars. In the past, the Authority has expended approximately 75 – 80% of the capital budget on an annual basis. With the recent addition of a Capital Program Division in FY 2006, significant expansion in the Division of Engineering and completion of a Peer Review by the Division of Engineering in FY 2006, it is now possible to track and improve performance in this area.
Strategies: 1. Define and develop meaningful performance measures for the various stages of capital program
delivery [Engineering]
2. Establish baseline data in each performance measurement [Engineering]
3. Continue to refine the capital programming process. [Capital Program – CPMS & Solomon]
4. Establish a draft internal list of Long Range (20 years) Capital Needs by July 1, 2007 [Capital Planning and Engineering]
5. Refine quarterly Capital Program process, minimize changes in project schedules costs [Capital Planning, Engineering]
6. Create and fill a dedicated position with the Division of Engineering to manage Right of Entry permits required for delivery of the Capital Program [Engineering, Strategic and HR]
7. Complete integration and roll out of Solomons and CPMS by July 1, 2007 [Capital Planning]
8. Improve on the timely payment of invoices as indicated in the Business Plan, Focus Area 4, Objective D, page 22 [Finance, All Divisions]
9. Build effective systems and processes for project management. [Engineering, Capital Planning]
46
Draft Document Internal Use Only
5 - Key Focus Area: Efficient and Effective Business Process (Supports Strategic Plan Goal > Efficiency and Effectiveness)
C – Objective: By Spring 2008, implement Phase I of the Maximo System at each facility Project History
Our history with Maximo dates back to a 7/2/96 contract with the SHA. MDOT’s current Maximo project includes the MdTA and began in 1998 with release 3.x. After 8 years, our implementation of Maximo 4.11 remains largely incomplete. In 12/06, the Authority approved, in principal, MdTA’s independent acquisition and
implementation of Maximo 6.x, effectively separating the MdTA from MDOT’s Maximo project.
By Spring 2008, implement Phase I of the Maximo System at each facility.
Maximo 4.11 (current system): Continue, conclude implementation at 11 MdTA facilities thru CY 2007
Maximo 6.2: Procurement of IBM software and services by MdTA Migrate Maximo 4.11 implementation to Maximo 6.2
Performance Measures Input
Number of facilities targeted to utilize Maximo: 11 Output
Number of facilities utilizing Maximo: 4 Completed; 1 in Progress Outcome
Current percentage of Maximo implementation: 45% Quality
Percent discrepancy in inventory reports (by facility): TBD Key Tasks (Maximo 4.11)
Purchasing Microsoft Dynamics (Solomon) Interface Online Stock Requisitions Fixed Asset Process Automotive Maintenance Electronics and Radio Maintenance Highway and Facility Maintenance
Key Tasks (Maximo 6.2) Procurement
Shepherd purchase of IBM Maximo software and services through final BPW approval
Software Implementation Load software, datasets, schedule training, etc.
Migration Establish parallel implementation of Maximo 6.2
Cutover Shut down Maximo 4.11 (except archives) Continue Agency-wide implementation of Maximo at 6.2 release level
Responsibilities (lead , support & resource)
47
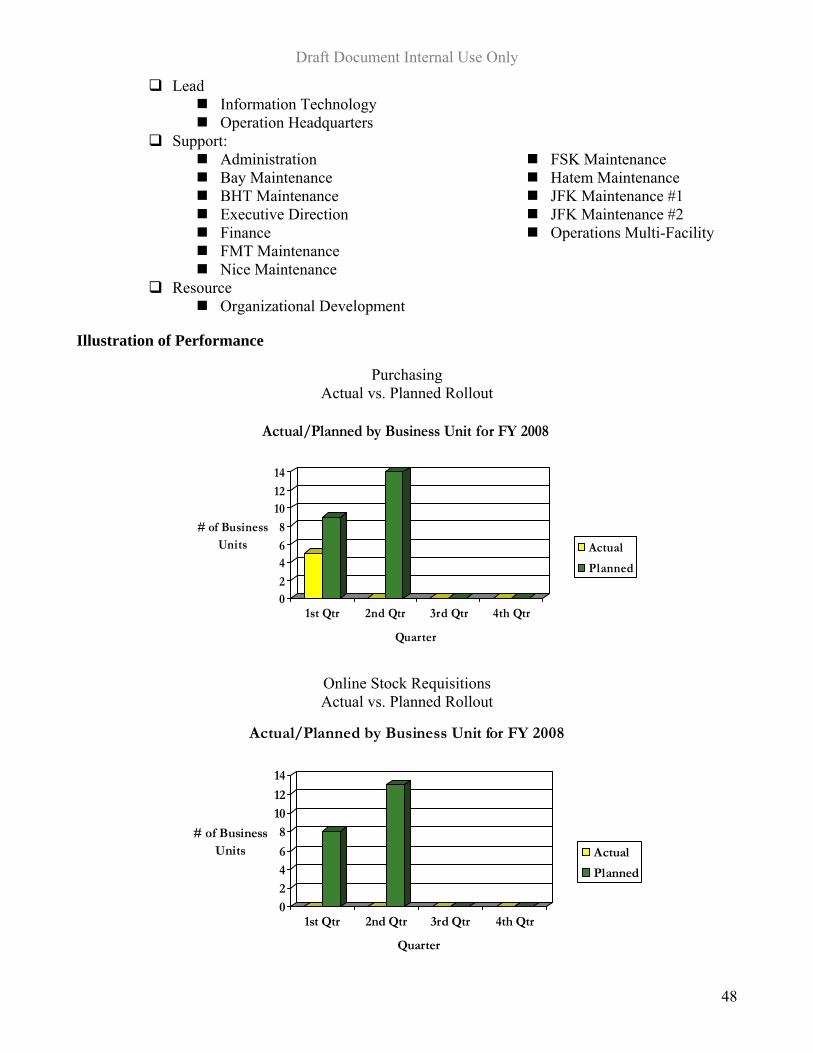
Draft Document Internal Use Only
Lead Information Technology Operation Headquarters
Support: Administration Bay Maintenance BHT Maintenance Executive Direction Finance FMT Maintenance
FSK Maintenance Hatem Maintenance JFK Maintenance #1 JFK Maintenance #2 Operations Multi-Facility
Nice Maintenance Resource
Organizational Development
Illustration of Performance
Purchasing Actual vs. Planned Rollout
02
46
8
1012
14
# of Business Units
1st Qtr 2nd Qtr 3rd Qtr 4th Qtr
Quarter
Actual/Planned by Business Unit for FY 2008
Actual
Planned
Online Stock Requisitions Actual vs. Planned Rollout
0
2
4
6
8
10
12
14
# of Business Units
1st Qtr 2nd Qtr 3rd Qtr 4th Qtr
Quarter
Actual/Planned by Business Unit for FY 2008
Actual
Planned
48
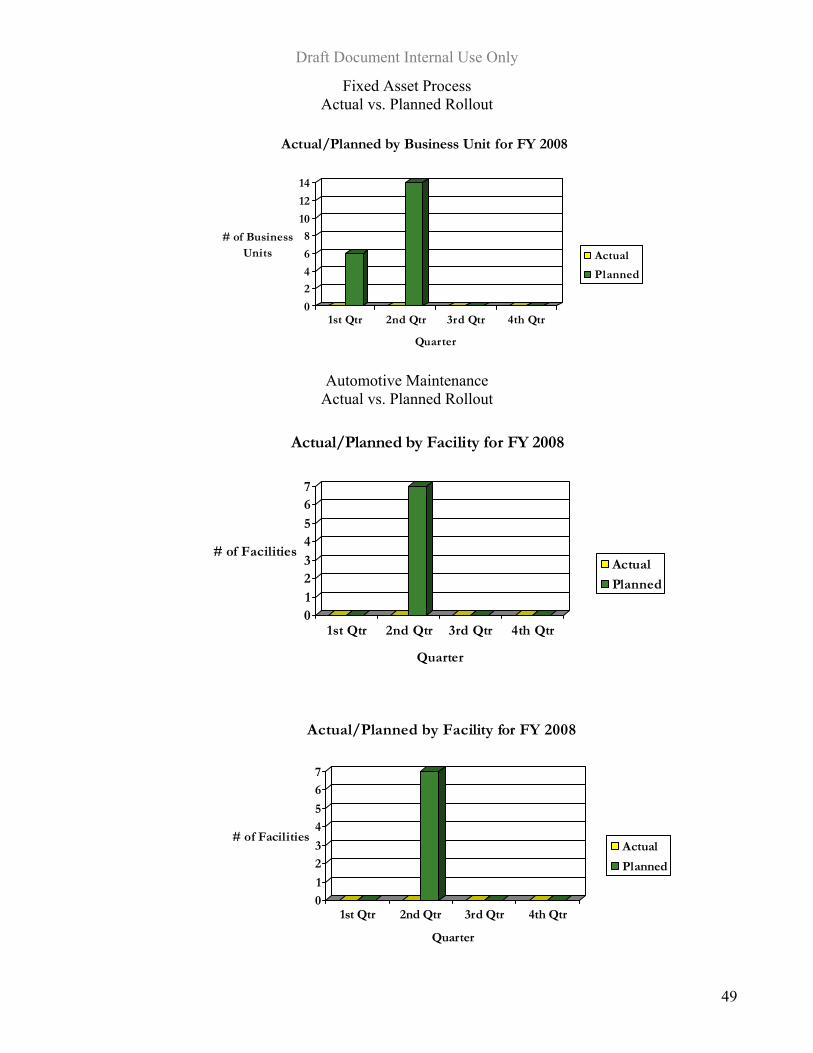
Draft Document Internal Use Only
Fixed Asset Process Actual vs. Planned Rollout
0
2
4
6
8
10
12
14
# of Business Units
1st Qtr 2nd Qtr 3rd Qtr 4th Qtr
Quarter
Actual/Planned by Business Unit for FY 2008
Actual
Planned
Automotive Maintenance Actual vs. Planned Rollout
01234567
# of Facilities
1st Qtr 2nd Qtr 3rd Qtr 4th Qtr
Quarter
Actual/Planned by Facility for FY 2008
Actual
Planned
0
1
2
3
4
5
6
7
# of Facilities
1st Qtr 2nd Qtr 3rd Qtr 4th Qtr
Quarter
Actual/Planned by Facility for FY 2008
Actual
Planned
49
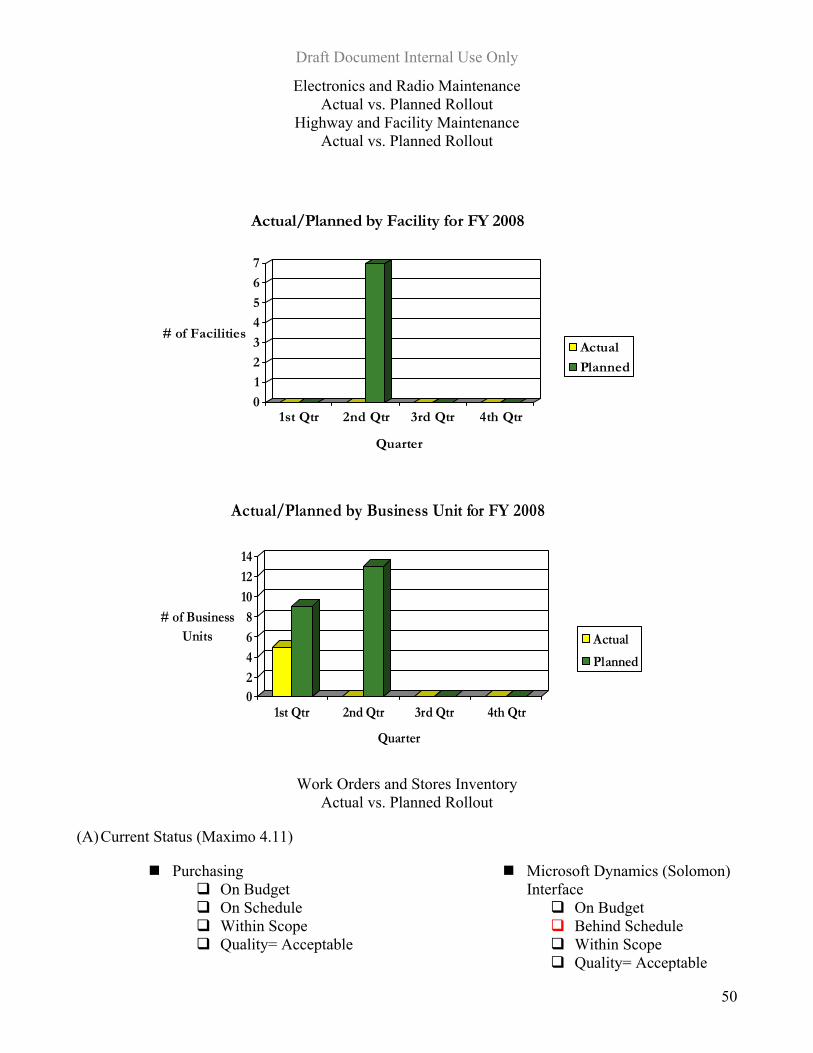
Draft Document Internal Use Only
Electronics and Radio Maintenance Actual vs. Planned Rollout
Highway and Facility Maintenance Actual vs. Planned Rollout
0
1
2
3
4
5
6
7
# of Facilities
1st Qtr 2nd Qtr 3rd Qtr 4th Qtr
Quarter
Actual/Planned by Facility for FY 2008
Actual
Planned
02
4
6
8
10
12
14
# of Business Units
1st Qtr 2nd Qtr 3rd Qtr 4th Qtr
Quarter
Actual/Planned by Business Unit for FY 2008
Actual
Planned
Work Orders and Stores Inventory
Actual vs. Planned Rollout
(A) Current Status (Maximo 4.11)
Purchasing On Budget On Schedule Within Scope Quality= Acceptable
Microsoft Dynamics (Solomon) Interface
On Budget Behind Schedule Within Scope Quality= Acceptable
50
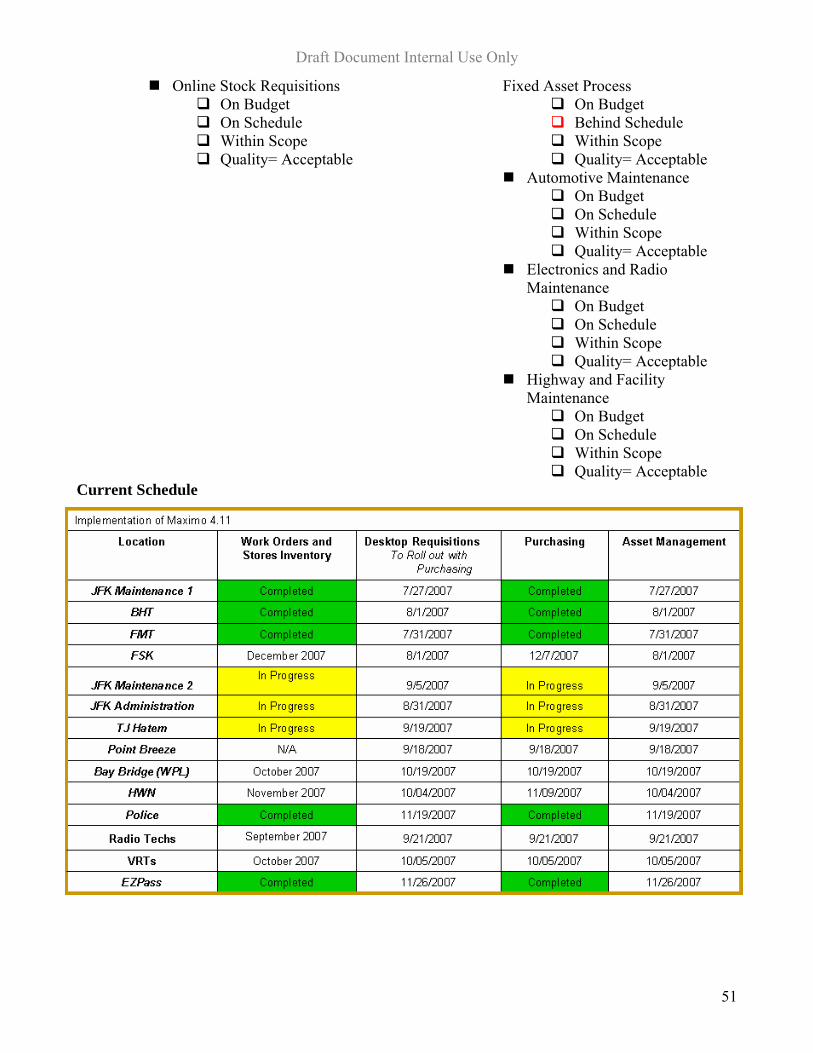
Draft Document Internal Use Only
51
Online Stock Requisitions Fixed Asset Process On Budget On Budget On Schedule Behind Schedule Within Scope Within Scope Quality= Acceptable Quality= Acceptable
Automotive Maintenance On Budget On Schedule Within Scope Quality= Acceptable
Electronics and Radio Maintenance
On Budget On Schedule Within Scope Quality= Acceptable
Highway and Facility Maintenance
On Budget On Schedule Within Scope Quality= Acceptable
Current Schedule
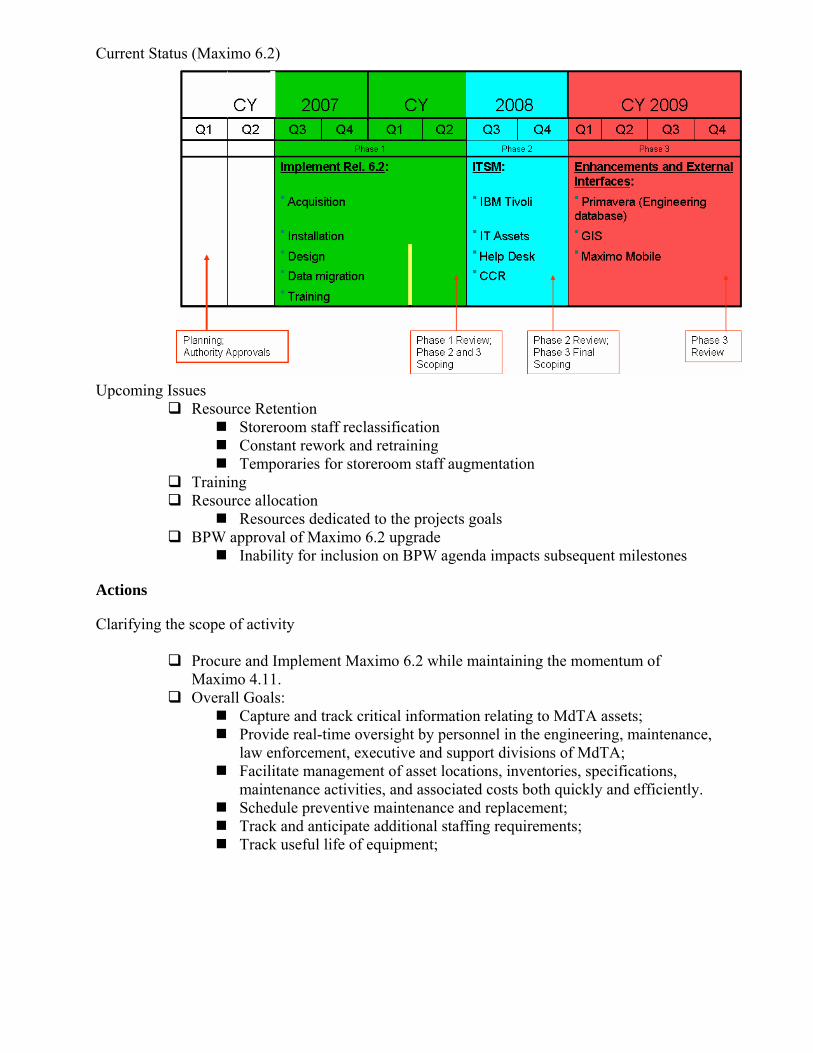
Current Status (Maximo 6.2)
Upcoming Issues Resource Retention
Storeroom staff reclassification Constant rework and retraining Temporaries for storeroom staff augmentation
Training Resource allocation
Resources dedicated to the projects goals BPW approval of Maximo 6.2 upgrade
Inability for inclusion on BPW agenda impacts subsequent milestones
Actions
Clarifying the scope of activity
Procure and Implement Maximo 6.2 while maintaining the momentum of Maximo 4.11.
Overall Goals: Capture and track critical information relating to MdTA assets; Provide real-time oversight by personnel in the engineering, maintenance,
law enforcement, executive and support divisions of MdTA; Facilitate management of asset locations, inventories, specifications,
maintenance activities, and associated costs both quickly and efficiently. Schedule preventive maintenance and replacement; Track and anticipate additional staffing requirements; Track useful life of equipment;
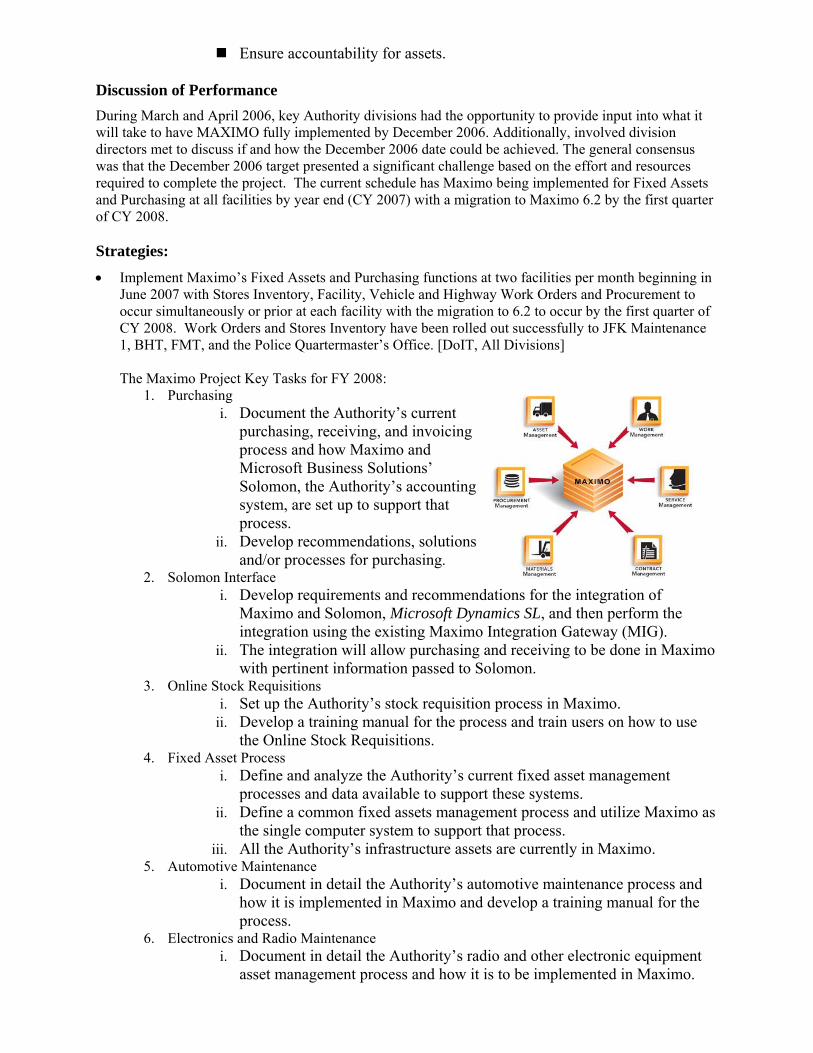
Ensure accountability for assets. Discussion of Performance During March and April 2006, key Authority divisions had the opportunity to provide input into what it will take to have MAXIMO fully implemented by December 2006. Additionally, involved division directors met to discuss if and how the December 2006 date could be achieved. The general consensus was that the December 2006 target presented a significant challenge based on the effort and resources required to complete the project. The current schedule has Maximo being implemented for Fixed Assets and Purchasing at all facilities by year end (CY 2007) with a migration to Maximo 6.2 by the first quarter of CY 2008.
Strategies: • Implement Maximo’s Fixed Assets and Purchasing functions at two facilities per month beginning in
June 2007 with Stores Inventory, Facility, Vehicle and Highway Work Orders and Procurement to occur simultaneously or prior at each facility with the migration to 6.2 to occur by the first quarter of CY 2008. Work Orders and Stores Inventory have been rolled out successfully to JFK Maintenance 1, BHT, FMT, and the Police Quartermaster’s Office. [DoIT, All Divisions] The Maximo Project Key Tasks for FY 2008:
1. Purchasing i. Document the Authority’s current
purchasing, receiving, and invoicing process and how Maximo and Microsoft Business Solutions’ Solomon, the Authority’s accounting system, are set up to support that process.
ii. Develop recommendations, solutions and/or processes for purchasing.
2. Solomon Interface i. Develop requirements and recommendations for the integration of
Maximo and Solomon, Microsoft Dynamics SL, and then perform the integration using the existing Maximo Integration Gateway (MIG).
ii. The integration will allow purchasing and receiving to be done in Maximo with pertinent information passed to Solomon.
3. Online Stock Requisitions i. Set up the Authority’s stock requisition process in Maximo.
ii. Develop a training manual for the process and train users on how to use the Online Stock Requisitions.
4. Fixed Asset Process i. Define and analyze the Authority’s current fixed asset management
processes and data available to support these systems. ii. Define a common fixed assets management process and utilize Maximo as
the single computer system to support that process. iii. All the Authority’s infrastructure assets are currently in Maximo.
5. Automotive Maintenance i. Document in detail the Authority’s automotive maintenance process and
how it is implemented in Maximo and develop a training manual for the process.
6. Electronics and Radio Maintenance i. Document in detail the Authority’s radio and other electronic equipment
asset management process and how it is to be implemented in Maximo.
For Internal Use Only
3/4/2008 “Creating EZ Passage Throughout Maryland” 54
ii. Review and recommend changes if needed based on industry accepted best practices.
iii. Implement the process in Maximo and train users. 7. Highway and Facility Maintenance
i. Document in detail in a report the Authority’s highway and facility maintenance process and how it is implemented in Maximo.
ii. Review and recommend changes if needed based on industry accepted best practices.
iii. Calculate and track maintenance costs by facility. iv. Implement the process in Maximo and train users.
• In order to begin the rollout of Fixed Assets and Purchasing, the remaining tasks must first be
completed:
Determine “Best Practices” for purchasing, constructing, receiving, maintaining, transfer and disposal of Assets
Communicate the Authority’s accepted procedures Adopt of “Best Practices” as uniform procedure Authority wide Clean up all databases for all fixed asset classes Import all data from asset databases into Maximo Build interface between Solomon and Maximo to eliminate duplication of data entry; Create storerooms where they do not exist Write procedures for inventory control. Research, gather costs and determine the current value of our infrastructure assets, including all
improvements
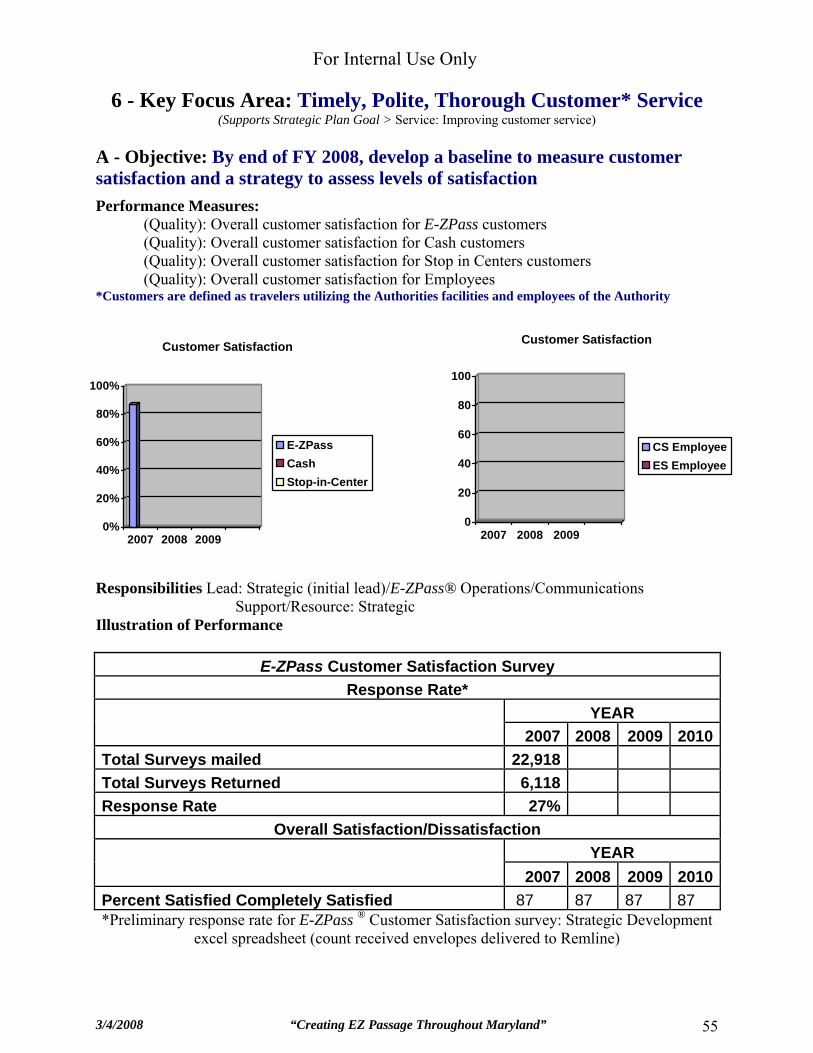
For Internal Use Only
3/4/2008 “Creating EZ Passage Throughout Maryland” 55
6 - Key Focus Area: Timely, Polite, Thorough Customer* Service (Supports Strategic Plan Goal > Service: Improving customer service)
A - Objective: By end of FY 2008, develop a baseline to measure customer satisfaction and a strategy to assess levels of satisfaction Performance Measures:
(Quality): Overall customer satisfaction for E-ZPass customers (Quality): Overall customer satisfaction for Cash customers (Quality): Overall customer satisfaction for Stop in Centers customers (Quality): Overall customer satisfaction for Employees
*Customers are defined as travelers utilizing the Authorities facilities and employees of the Authority
0
20
40
60
80
100
2007 2008 2009
Customer Satisfaction
CS EmployeeES Employee
Responsibilities Lead: Strategic (initial lead)/E-ZPass® Operations/Communications Support/Resource: Strategic Illustration of Performance
E-ZPass Customer Satisfaction Survey Response Rate*
YEAR 2007 2008 2009 2010Total Surveys mailed 22,918 Total Surveys Returned 6,118 Response Rate 27%
Overall Satisfaction/Dissatisfaction YEAR 2007 2008 2009 2010Percent Satisfied Completely Satisfied 87 87 87 87 *Preliminary response rate for E-ZPass ® Customer Satisfaction survey: Strategic Development
excel spreadsheet (count received envelopes delivered to Remline)
0%
20%
40%
60%
80%
100%
2007 2008 2009
Customer Satisfaction
E-ZPassCashStop-in-Center
For Internal Use Only
3/4/2008 “Creating EZ Passage Throughout Maryland” 56
Current Status Strategic, Communications and E-ZPass Operations are waiting for the preliminary report from Remline (deliverable date second week of July. Final report due end of July. Assessment of data and final report.
Upcoming Issues
Employee survey (January 2008) and other toll customer survey (end of FY 2008) to be developed and implemented.
Development and implementation (April 2008) of second annual E-ZPass customer survey.
Actions - Preliminary Report Review (E-ZPass Customer Survey) scheduled for Monday July 16, 2007.
- Gather input from Management regarding questionnaire design for the development of employee survey.
- Development of web-base survey questionnaires for Employee survey and future E-ZPass surveys.
- Need for additional input regard cash/ticket customers and techniques for implementation. Discussion of Performance The Authority’s Strategic Plan states we will “communicate and respond professionally to customers’ needs for assistance and information,” and “improve and expand customer services.” To ensure that we are indeed meeting and exceeding our customers’ needs, we must measure their satisfaction and establish methods for open communication. The Authority will begin a comprehensive customer satisfaction management program in the fall of 2007 for both external and internal customers. Once a baseline measure is established, we can identify methods to maintain or improve our customer service. Strategies:
1. By April 2007, develop and administer E-ZPass customer surveys to measure baseline customer satisfaction. [Strategic Development, E-ZPass Operations and Communications]
2. By January 2008, develop and administer an employee survey program to monitor employee satisfaction. [Strategic Development and Communications]
3. By end of FY 2008, design, develop, and implement two customer satisfaction surveys (Stop-in Centers and Cash Customers). [Strategic Development/ Communications/E-ZPass Operations]
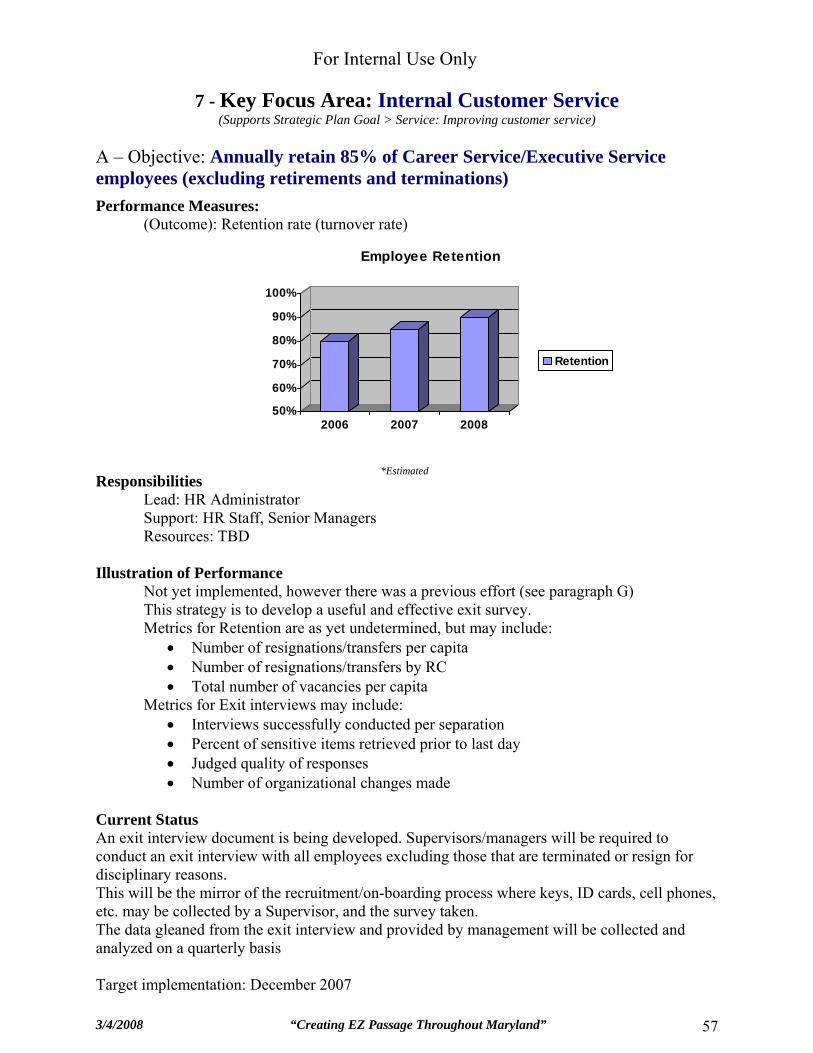
For Internal Use Only
3/4/2008 “Creating EZ Passage Throughout Maryland” 57
7 - Key Focus Area: Internal Customer Service (Supports Strategic Plan Goal > Service: Improving customer service)
A – Objective: Annually retain 85% of Career Service/Executive Service employees (excluding retirements and terminations) Performance Measures:
(Outcome): Retention rate (turnover rate)
Responsibilities
Lead: HR Administrator Support: HR Staff, Senior Managers Resources: TBD
Illustration of Performance
Not yet implemented, however there was a previous effort (see paragraph G) This strategy is to develop a useful and effective exit survey. Metrics for Retention are as yet undetermined, but may include:
• Number of resignations/transfers per capita • Number of resignations/transfers by RC • Total number of vacancies per capita
Metrics for Exit interviews may include: • Interviews successfully conducted per separation • Percent of sensitive items retrieved prior to last day • Judged quality of responses • Number of organizational changes made
Current Status An exit interview document is being developed. Supervisors/managers will be required to conduct an exit interview with all employees excluding those that are terminated or resign for disciplinary reasons. This will be the mirror of the recruitment/on-boarding process where keys, ID cards, cell phones, etc. may be collected by a Supervisor, and the survey taken. The data gleaned from the exit interview and provided by management will be collected and analyzed on a quarterly basis Target implementation: December 2007
50%
60%
70%
80%
90%
100%
2006 2007 2008
Employee Retention
Retention
*Estimated
For Internal Use Only
3/4/2008 “Creating EZ Passage Throughout Maryland” 58
Upcoming Issues Implementation issues (see G) How will interview results be used?
Actions A quarterly exit survey was developed and implemented by HR in FY06. This approach proved ineffective as more than 85% of the survey questionnaires were not returned. This effort did not yield enough data for a valid analysis. It was determined that an anonymous survey was not effective
To be Done: • Questionnaire drafted, reviewed, tested, finalized • List of “check off” items to be collected by supervisor • Determination of metrics • Review by management • Method of identifying resignees/transfers • Exploration of strategies to ensure interview takes place • Training of supervisors • Plan on methods to analyze results and respond with organizational changes
Discussion of Performance Our current retention rate is in the 80-82% range. There are several classifications with higher turnover rates, for example, toll collection and maintenance. Therefore, even when we begin filling vacant positions quicker we'll still struggle with retention in certain RCs in Operations. As we continue to research and monitor this area, we should gain the ability to develop retention targets for specific classifications of employees. Strategies:
1. By December 2007 develop an exit interview procedure. Enhance retention efforts by responding to matters identified in exit interview data. [Administration]
2. By June 2008 develop an “Onboarding” Program that includes a redesign of our new employee orientation and coordination with DOD on providing mentors for each new hire for a period of 12 months. [Administration]
3. By January 2007, develop and implement a Mentorship Program, which will provide mentees an opportunity to gain practical knowledge of the Authority and build self-confidence. [Organization Development]
4. Develop and implement a revised employee performance evaluation process that recognizes agency, division, office/section goals and objectives to individual employee goals and objectives. [Administration, Strategic Development]
5. Revise agency training program, career development program and training curriculums to complement the retention of core skills and trades. [Organizational Development]
6. Develop a diversity strategy that contributes to overall recruitment and retention efforts and that demonstrate an open, inclusive environment as a key element in fostering employee retention. [Organizational Development, Administration, Communications]
7. Develop a coordinated internal communications strategy that integrates employee improvement and development programs and engages employees as stakeholders in the agency. [Communications, Administration, Organizational Development]
For Internal Use Only
3/4/2008 “Creating EZ Passage Throughout Maryland” 59
Existing and Future Challenges The Maryland Transportation Authority faces major challenges in meeting its rapidly escalating level of responsibility – including delivering a substantially larger capital program; issues associated with hiring, training, and retaining staff with newly required expertise; coordination challenges among state transportation agencies; and the need to maximize its financial resources and capacity. To address the Authority’s challenging future role and begin to address the intricate balance and need for resources, the Authority retained an outside management consultant, MAXIMUS and its subcontracting partners, to generally perform the following:
• Analyze the current environment and the changes that have been made to accommodate the Agency’s growth, and
• Advise the agency as to how and where we can improve the effectiveness and efficiency of the organization
The scope of the engagement included a series of interviews, data collection, peer information gathering, application of industry practices, and the development of specific recommendations, which were presented to the Chairman and Members in November 2006. Principal recommendations were recommended in the following areas:
• Governance and Strategic Management • Capital Planning and Financial Management • Information Technology • Toll Operations • Police Operations • Asset and Fleet Management, and • Human Resources
Where applicable, the consultant’s recommendations have been considered in the development of this Business Plan and/or will be incorporated in individual Division strategies.
For Internal Use Only
3/4/2008 “Creating EZ Passage Throughout Maryland” 60
Existing Intra-agency Committees Security Coordinating Council (SCC) Objectives/Purpose: The SCC exchanges information about security initiatives undertaken by various Authority organizational units to ensure efficiency and effectiveness. It makes recommendations and decisions concerning general issues regarding goals and specific questions of implementation, and serves as the governing body for the oversight of security initiatives within the Authority. Operations, Maintenance, Police (OMP) and Incidence Management Group Objective/Purpose: The OMP encourages inoperability by improving communication, cooperation and understanding, while considering cross-functional operational issues amongst three of the Authority’s largest divisions. The OMP reviews policies and procedures prior to submittal to the Management Group. The Incidence Management Group conducts post mortems of major incidences, to enhance response times, cooperation among jurisdictional Police and the Authority Police, and to resolve issues regarding preparedness and response to incidence. Diversity Advisory Council (DAC) Objectives/Purpose: The DAC assists in programs that address cultural diversity and recognize unique individual differences and contributions of the workforce. It also assists in the development of ideas regarding communicating the efforts being made to achieve realistic EEO and Diversity Programs; and encourages effective communications, fellowship, and goodwill among Authority employees. Procurement Review Group (PRG) Objectives/Purpose: The PRG analyzes procurement opportunities, monitors the Authority’s MBE annual goal achievement, encourages maximum small and minority owned business participation through appropriate procurement methods, reviews procurement solicitations, and provides MBE goal and waiver (approval/denial) recommendations to the Executive Secretary. IT Council Objectives/Purpose: The IT Council reviews and directs the prioritization of the IT project portfolio. The resulting priority ranked portfolio of projects enables managers and work teams to adjust their work schedules according to priorities set by executive management. Legislative Planning Committee (LPC) Objective/Purpose: The Legislative Planning Committee (LPC) facilitates the coordinated strategic planning for the Authority’s advocacy and outreach efforts to the Maryland General Assembly. The LPC consists of representatives from each division within the Authority. Principally, the LPC members work collaboratively to design effective strategies to allow MdTA to best present its message to the General Assembly as a whole. Additionally, the committee meets on a periodic basis during the annual legislative session to discuss individual pieces of legislation, and any other ongoing developments that may require a formal agency response.
For Internal Use Only
3/4/2008 “Creating EZ Passage Throughout Maryland” 61
Organizational Relationships The Authority partners with a number of organizations to help it fulfill its vision and mission. These partnerships are critical to the accomplishment of this plan.
The Greater Baltimore Committee (GBC)
The GBC is comprised of leading businesses, nonprofits, educational and civic institutions from Baltimore City, Anne Arundel, Baltimore, Carroll, Harford and Howard counties. Its mission is to improve the business climate of the Baltimore region by organizing its corporate and civic leadership to develop solutions to the problems that affect the region's competitiveness and viability. Founded in 1955 by a small group of business leaders that included renowned developer James Rouse, the GBC played a key role in Baltimore's acclaimed downtown 'renaissance' and today continues to focus the considerable resources of its members on strengthening the Baltimore region's business climate. The synergy between central cities and the jurisdictions around them is critical to a region’s success. A thriving urban area energizes a region and serves as a catalyst for economic and cultural growth. In Greater Baltimore, strengthening regional ties and collaboration benefits the entire region. http://www.gbc.org
E-ZPass® Interagency Group (IAG)
The E-ZPass Interagency Group (IAG) was formed in 1990 with three states (NY, NJ & PA) and seven agencies (PA Turnpike, PANY&NJ, NJ Turnpike, Garden State Parkway, MTA B&T, NYS Thruway, and Atlantic City Expressway). The first deployment of E-ZPass was on the New York State Thruway at the Spring Valley barrier on August 3, 1993. Currently the IAG has over 9 million account holders, utilizing over 16 million transponders for electronic toll collections at 22 agencies in 11 states. The 22 member agencies operate 45 roads, bridges and tunnels in the Northeast. The Authority is one of the 17 full member agencies; agencies with voting privileges. The IAG strives to promote a regionally compatible system, provide participating customers with seamless travel in a highly mobile region, and to promote common operating protocols and policies to advance customer service. http://www.e-zpassiag.com
I-95 Corridor Coalition The I-95 Corridor Coalition is an alliance of transportation agencies, toll authorities, and related organizations, including law enforcement, from the State of Maine to the State of Florida, with affiliate members in Canada. The Coalition provides a forum for key decision and policy makers to address transportation management and operations issues of common interest. This volunteer, consensus-driven organization enables its myriad state, local and regional member agencies to work together to improve transportation system performance far more than they could working individually. The Coalition has successfully served as a model for multi-state/jurisdictional interagency cooperation and coordination for over a decade. http://www.i95coalition.org
For Internal Use Only
3/4/2008 “Creating EZ Passage Throughout Maryland” 62
The American Association of State Highway and Transportation Officials (AASHTO) The American Association of State Highway and Transportation Officials
es in their efforts to efficiently and safely move people and
goods. Its goals are to re-estab
he International Bridge, Tunnel and Turnpike Association (IBTTA)
advocates transportation-related policies and provides technical servicto support stateslish transportation as a national priority, advocate and communicate to
achieve AASHTO’s goals, provide world-class technical services, and assist state departments of transportation with leadership and performance. http://www.transportation.org T
he International Bridge, Tunnel and Turnpike Assodge and ideas to promote and
rations
n
T ciation (IBTTA) is the worldwide alliance of toll operators and associated industries that provides a forum for sharing knowleenhance toll-financed transportation services. Founded in 1932, IBTTA is the only association representing the worldwide toll industry. IBTTA’s priority is helping members stay abreast of trends that will see the toll industry emerge as one of the most important forces in highway finance and opearound the world. Finance Summits, meetings, exhibitions, and workshops are offered throughout the year. IBTTA membership is comprised of 280 members in 25 countries on six continents. In addition tothe United States, there is significant representation from European toll operators in Italy, France, Spaiand Portugal as well as Australia, South Africa, Japan and Brazil. IBTTA members are leaders in technological innovation with expertise in the ways technology is reshaping road financing, organizational models and service delivery. http://www.ibtta.org