Embed Size (px)
Citation preview

FY ‘20 RESULTS AND 2021-23 PLAN
TIM GROUP
Beyond Connectivity
24 February 2021

2FY ‘20 RESULTS AND 2021-23 PLAN
Disclaimer
This presentation contains statements that constitute forward looking statements regarding the intent, belief or current expectations of future growth in the differentbusiness lines and the global business, financial results and other aspects of the activities and situation relating to the TIM Group. Such forward looking statementsare not guarantees of future performance and involve risks and uncertainties, and actual results may differ materially from those projected or implied in the forwardlooking statements as a result of various factors.
The financial results of the TIM Group are prepared in accordance with International Financial Reporting Standards issued by the International Accounting StandardsBoard and endorsed by the EU (designated as “IFRS”).The accounting policies and consolidation principles adopted in the preparation of the financial results for FY20, Q4’20 and for 2021-2023 Plan of the TIM Group arethe same as those adopted in the TIM Group Annual Audited Consolidated Financial Statements as of 31 December 2019, to which reference can be made, except forthe amendments to the standards issued by IASB and adopted starting from January 1, 2020.As of today, the audit work by our independent auditors on the FY20 results have not yet been completed.
Alternative Performance MeasuresThe TIM Group, in addition to the conventional financial performance measures established by IFRS, uses certain alternative performance measures for the purposesof enabling a better understanding of the performance of operations and the financial position of the TIM Group. In particular, such alternative performancemeasures include: EBITDA, EBIT, Organic change and impact of non-recurring items on revenue, EBITDA and EBIT; EBITDA margin and EBIT margin; net financialdebt (carrying and adjusted amount) and Equity Free Cash Flow. Moreover, following the adoption of IFRS 16, the TIM Group uses the following additional alternativeperformance indicators:* EBITDA adjusted After Lease ("EBITDA-AL"), calculated by adjusting the Organic EBITDA, net of non-recurring items, of the amounts related to the accountingtreatment of lease contracts according to IFRS 16;* Adjusted Net Financial Debt After Lease, calculated by excluding from the adjusted net financial debt the net liabilities related to the accounting treatment oflease contracts according to IFRS 16;* Equity Free Cash Flow After Lease, calculated by excluding from the Equity Free Cash Flow the amounts related to lease payments.
Such alternative performance measures are unaudited.

3FY ‘20 RESULTS AND 2021-23 PLAN
▪ Promised, delivered
▪ 2020 achievements
▪ Solid Q4 financials
▪ What next? A better macro and telco outlook
▪ TIM ready to ride all opportunities in connectivity and beyond in Italy and Brazil
▪ Financial and ESG Guidance. Closing remarks
▪ Q&A
Agenda

PROMISED, DELIVERED

5FY ‘20 RESULTS AND 2021-23 PLAN
Promised, delivered…TIM Group
Created optionality for value creation
▪ Inwit-Vodafone towers merger▪ Co-investing in FiberCop with KKR and Fastweb▪ Google partnership, cloud/data centers carve out
Foundations of transformation set in 2019
2020 plan: “Operations TIMe”
Equity Free Cash Flow generation
▪ € 1.6bn in ‘20 and € 1.5bn in ’19(1)
▪ Reinstated dividends on ordinary shares
Stabilized governance
▪ Positive dynamics in board▪ Exiting BOD proposed its slate for next 3 years
Debt reduction
▪ €4.7bn debt reduction(1) in 2 years
Developed Brazil
▪ Acquisition of Oi mobile assets with Vivo and Claro(2)
▪ Strengthened the core ▪ Network sharing partnership with Vivo
Stabilized customer base
▪ Fixed CB growing in Q4 ’20 for the first time since 2001
▪ Mobile MNP stabilized
Improving pricing environment
▪ Upper end mobile since Q1 ’19, low end since Q1 ‘21▪ Fixed acquisition prices on healthy trend
Cost cutting
TIM Vision▪ Richest content platform in Italy: partnerships
with Netflix, Disney+, DAZN, NowTV
Customer base stabilization reached in Q4
ESG plan executed
▪ OPEX(3) -15% in ‘19-20 ▪ Addressable costs(3) -9.5% YoY in ’20
▪ Ecoefficiency hikes monetized (white certificates)▪ Inaugural Sustainability Bond issued
2019 plan: “Deliver & Delever”
(1) After lease(2) Pending regulatory approval(3) Domestic

6FY ‘20 RESULTS AND 2021-23 PLAN
…and created optionality by developing, sharing and monetizing infrastructureTIM Group
2 years of evolutionary revolution for TIM’s key infrastructures…
mobile fixed
cloud & data centers
Infrastructure sharing through merger with
Vodafone Towers and partial monetization
Creation of the leading Italian fiber company
and partial monetization
Carve out of the leading Italian Cloud and Data
Centers company
Strong partnership with world class public
cloud provider
€1.8bnproceeds ‘21
€2.3bnproceeds ‘20
€1bnRevenues ’24 (1)
€0.4bn EBITDA (1)
…and more specialized “factories” to create optionality are being developed
(1) TIM forecast

7FY ‘20 RESULTS AND 2021-23 PLAN
The new plan raises the bar: “beyond connectivity” towards growthTIM Group
plan 2020-2022
“Operations time”
plan 2021-2023
“Beyond Connectivity”
2019 2020 2021 2022 2023
plan 2019-2021
“Deliver & Delever”
Main focus: execution and evolution of the operating model to stabilize the core
Main focus: capturing cash conversion and creating the basis for future business optionality
Central role ofenvironmental, social and corporate
governance (ESG) objectives
Further improvedoperational excellence
Besttechnological infrastructure
Uniquecommercial proposition
to drive growth
Leanerorganizational
model
“Beyond Connectivity” - plan’s pillars

2020 ACHIEVEMENTS

9FY ‘20 RESULTS AND 2021-23 PLAN
TIM Domestic
DomesticService Revenues
(€ bn)
DomesticEBITDA
After Lease(€ bn)
1.4 1.4 1.5 1.3 1.2 1.3 1.3 1.3
Q1 Q2 Q3 Q4 Q1 Q2 Q3 Q4
3.2 3.2 3.1 3.1 2.9 2.9 2.9 3.0
Q1 Q2 Q3 Q4 Q1 Q2 Q3 Q4
2019 2020
-3.9% -3.8%
-8.0%-8.6% -8.8% -9.1%
-8.2%
-2.0%
Q1 '19 Q2 Q3 Q4 Q1 '20 Q2 Q3 Q4
Fixed Services Mobile Services Domestic Service Revenues
YoY change
▪ No price increases on CB
▪ CSP(1) cleaning in mobile
▪ Stricter commercial conduct
In ‘19/20 TIM took tough decisions to make revenues sustainable for L/T
Reasons for 2020 service revenue decline now mostly over, namely:
▪ ~50% due to sustainable commercial conduct(2) & COVID (3)
▪ ~50% CB decline, now stabilized
Mobile market: positive signs in the low-end of the market (upper-end already healthier)
Fixed market: back to growth after years leaving space for all players, BB penetration still below Europe
In 2021 ready for improving landscape
Telco market became irrational
In 2018
(1) Content Service Provider (2) Including CSP cleaning, Consip renegotiation al lower prices, SME loyalty program and retention campaign(3) Including roaming revenues
Stabilized the core: service revenues and EBITDA flattened YoY in Q4 2020

10FY ‘20 RESULTS AND 2021-23 PLAN
(1) Equivalent to 14.6k excluding sub-cabinets, 10k in white areas
Positive net adds and accelerating UBB take-up
-216-185
-60
-160
+5
Q4 '19 Q1 '20 Q2 Q3 Q4
Q4 '19 Q3 '20 Q4 '20
2019 2020
UBB retail net adds
UBB customer base (retail+wholesale)
Retail fixed net adds
+24%
+135%+172%
Increased coverage
ICT Q4 revenues
+28% YoY
Push on digital services
Cloud revenues
FY ‘20+21% YoY
Enhanced convergent portfolio
fixed -5.2pp YoYmobile -1.8pp YoY
Higher quality, lower churn in fix and mobile
85% HHs UBB covered, +4pp increase YoY
(91% of families with a fixed line)
+18.1k FTTx cabinets (1)
opened in 2020
Certified WiFi
Unlimited gigafor the family
TIMVISION
Smart home
TIM UNICA
Q4 '19 Q4 '20
CSI fixed CSI mobile
Q4 '19 Q4 '20
Churn‘20 FY
fixed & mobile
+2.1% +3.2%
-10.4% -10.1%-8.5%
-5.4%
-0.2%
Q4 '19 Q1 '20 Q2 Q3 Q4
YoY change
2019 2020
-118-166
-260
-114
-47 -57 -43 -35
Q1 Q2 Q3 Q4 Q1 Q2 Q3 Q4
Fixed Service Revenues flat in Q4
MNP balance improving
TIM Domestic
“Fix the fixed” delivered results: line losses turned positive in Q4 for the first time since 2001. Convergence helping mobile as well

11FY ‘20 RESULTS AND 2021-23 PLAN
Change in customers habits inverted fixed-to-mobile substitution trend……and Telcos will play an even bigger role in the “after COVID” reconstruction
1) Source: Osservatori Politecnico di Milano2) Source: AGCOM and internal elaborations on Analysis Mason’s estimates3) Preliminary assignment to TIM, Fastweb and Intred (Regional player wholesaling on TIM)
TIM Domestic
Next Gen. EU
DIGITAL€ 46.3bn
Resources directly allocated to digital in the National Recovery and Resiliency Plan
…and public funding is yet to boost connectivity / digital services
Vouchers
Grey Areas
Schools
€0.2bn
€ 0.4bn
€ 1.1bn
€0.9bn
Public tender expected in 2021
Received approval from the EU CommissionPublic tender being assigned (3)
Phase 1: kick off in mid-November, >75% still available for ‘21
Phase 2: available for ‘21 – Pending EU approval, kick-off expected by the end of Q1
Traffic on Network
▪ +44% fixed network
▪ +40% mobile network
▪ 10x video communication
Remote Working
▪ ~5.4m smart workers in Italy (+9.4x YoY)(1)
Digital Skills
“Risorgimento digitale” project for teaching digital skills to the population
20.6 20.219.6 19.6
20.8
2017 '18 '19 '20 2023e
-0.4 -0.6 =
Italian wireline marketMillion lines
(2)
+1.2
Inversion of F-M
substitution trend
In 2020 fixed lines stopped falling YoY…

12FY ‘20 RESULTS AND 2021-23 PLAN
TIM Domestic
▪ Voluntary exits and staff rejuvenation
▪ Processes reengineering in E2E perspective
▪ Selective implementation of “Agile” models
▪ Commercial policies review▪ New “Early Warning System”
Bad debt▪ Enhanced self-care▪ Diffused AI for faults prediction
Operations
▪ Channel mix optimization: push to pull ▪ Increased penetration of digital
CommercialIT &
Technology▪ Legacy decommissioning▪ SimplificationImproved
processes
Examples of process improvement initiatives
Greater operational performance
Headcount reduced
6.5k exits
1.3k hirings
2018 2020
-11%Leaner organization
KPIs
Mobile offers# of mobile offers
2019 2020
-65%
FTTx activations drop rate
2019 2020
-16pp
Energy consumption
2019 2020
-
Channel mix
9%21%
2019 2020
Digital
Stores
Pull +19pp YoY
Overall CSI
2019 2020
+3.2%
Bad Debt
2019 2020
-31%
-€124m
Leaner organization/processes for better engagement and CSI with lower costs

13FY ‘20 RESULTS AND 2021-23 PLAN
2020 addressable cost base -9.5%: 3-year target reached in 1 year
2020 addressable baseline
▪ VAS content -34% YoY mainly for CSP cleanup
▪ Commissioning -3% YoY for increased web sales
▪ Caring -5% YoY for process digitization
▪ Bad debt -31% YoY for improved process
▪ Energy costs -11% YoY: lower energy prices and volumes
▪ Real estate -24% YoY for rightsized office space
▪ Lower headcount: -2.6k YoY (after -2.7k last year, o/w 3.6k exits) plus 1k hirings
Key OPEX variation drivers3-year plan’s target
reached in 1 year
P&L view
€ bn
-9.5%
-10% 3-year plan’s target (1)Commercial 1.3 (14.2%)
Industrial 1.0 (4.5%)
G&A 0.3 (12.5%)
Labour 1.9 (6.6%)
4.6* (9.5%)
* ~63% of total 2020 OPEX baseline
Tot. addressablebaseline
€ bn Delta YoY
TIM Domestic
(1) Upgraded from -8% in 2019-21 plan

14FY ‘20 RESULTS AND 2021-23 PLAN
1,534 1,615
24.922.5 22.9 23.3 21.9
18.6
Group Equity FCF
€ m
Group Net Debt AL
Adjusted, € bn
Equity FCF
90% of 3-year target for ‘19-21 (€ 3.5bn) reached in 2 years
Historical trend of Equity FCF and Net Debt
Net Debt AL
-€ 3.3bn in 2020
After LeaseIAS 17
20.5 initial guidance
2015 ‘16 ‘17 ‘18 ‘19 ‘20
TIM Group
(1) Adjusted debt AL / organic EBITDA AL(2) Initial guidance: 2019-21; upgraded guidance: 2020-22; new guidance: 2021-23
€4.7bn debt cut in 2 years. 2020 EFCF fully on track for upgraded guidance
90% of ‘19-21 initial guidance
1/3 of upgraded ‘20-22 guidance
< 18.0
2015 ‘16 ‘17 ‘18 ‘19 ‘20
3.0x3.2xNet Debt AL / EBITDA AL (1)
’21Guidance (2)
upgradedguidance
new guidance
~ 16.5

15FY ‘20 RESULTS AND 2021-23 PLAN
2020 ESG guidance met or beaten. On track on all L/T targets
On track on all targets
Targets (1)
2030
2025
Carbon Neutrality (2)
Indirect emissions (2)
Eco-efficiency +50%
Renewable energyon total energy (%)
+5pp/yr
-70%
2022
2024
New VC fund size
Green Smartphone
IoT and Security service revenues
€ 50m
+20%
>15%
EmployeesEngagement
Reskilled people
Churn ofYoung employees
+14pp
2,000
<15%
Inaugural Sustainability Bond issued: € 1bn, 8 year maturity, 1.625% coupon
TIM Group
2020 actions and achievements
Increased infrastructure energy efficiency
▪ Optimizing fixed and mobile networks
▪ Transforming data centers
▪ White certificates program
▪ Circular economy for infrastructure and workplaces
▪ Engagement over performed, 3-year target topped in one year
▪ Agile & sustainable building
▪ Digital initiatives in response to COVID emergency
▪ Increased digital inclusion
▪ Launched «TIM Green»
▪ Enabled Italian enterprises’ sustainability
▪ Supported and invested in ESG startups
▪ Launched “TIM with Green Pea”
Sparkle data center certified for renewable energy
(1) “Operation Time” plan targets, baseline 2019. Domestic, except for indirect emissions and carbon neutrality (Group)(2) Group target

SOLID Q4 FINANCIALS

17FY ‘20 RESULTS AND 2021-23 PLAN
Strong topline and EBITDA trends improvement vs. Q3, Equity FCF +57% YoY
(1) Excluding exchange rate fluctuations, non recurring items and change in consolidation area(2) Adjusted Net Debt
Organic data (1), IFRS 16, € m
TIM Group
Equity FCF After Lease
+57%
FX & one offs
Q4 ‘20 FY ‘20
2,992
3,669
Q4 '20
1,270
1,571
ServiceRevenues
EBITDAAfter Lease
37.9%
-0.8%
-1.7%
+3.0%
D% YoY
-1.2%
+1.9%
-2.0%Domestic
Brazil
Domestic
Brazil
Margin
11,643
11,441
FY '20
5,135
6,249
39.4%
-6.1%
-7.8%
+2.5%
D% YoY
-5.6%
+0.4%
-7.0%
21,893
20,741
18,594
FY '19
9M '20
FY '20
Net Debt After Lease (2)
-3,299-15.1% YoY
-2,147
Service revenues and EBITDA AL trends improved both in Italy and Brazil.
Q4 domestic EBITDA AL +0.4% YoY like for like: no solidarity in Q4 ‘20 (vs. 4 days in Q4 ‘19) implies 2.1pp YoY drag.
Q4 Equity Free Cash Flow AL € 622m (+57% YoY)
Net Debt AL down €2.1bn QoQ in Q4

18FY ‘20 RESULTS AND 2021-23 PLAN
TIM Domestic
UBB growth accelerated
34% 40% 41% 42%
Q3 '19 Q4 '19 Q1 '20 Q2 Q3 Q4
UBB POPcoverage
UBBtake upretail & wholesale
81% 81% 82%85%
UBB coverage and take up (1)
(2)
Retail net adds back to positive in Q4
Line losses QoQk lines
-265
-331
-217 -216-185
-60
-160
+5
Q1 Q2 Q3 Q4 Q1 Q2 Q3 Q4
2019 2020
Retail UBB net adds doubled QoQ
4,063 4,220
4,127 4,407
8,190 8,627
Q3 '20 Q4 '20
Wholesale Retail
+24% YoY
+157+233 in Q4 ’19
+280+103 in Q4 ’19
UBB Customer Basek lines
1.6%1.3%
Q4 '19 Q4 '20
Churn improved, lower disconnectionsfrom F-M substitution and delinquent clients
Churnmonthly average
1.7%1.3%
FY '19 FY '20
-919 -742
1,047 911
2019 2020
UBB
ULL
169k positive balance
+32% YoY
Positive balance btw UBB net adds and ULL losses grew YoY
Net adds FYk lines
-170 in Q4-175 in Q3
No fixed line losses in Q4, 2 years ahead of target
Vouchers helped but >75% of first €200m tranche still available plus 100% of €900m tranche
Improvement attributable to “Fix the Fixed” plan
18.1k cabinets opened to FTTx in 2020 (reaching ~91% coverage of fixed active lines)
Fixed retail lines back to growth, one of the strongest quarters ever in retail UBB
(1) UBB take up calculated on technical HHs covered by UBB(2) Equivalent to 91% of families with a fixed line

19FY ‘20 RESULTS AND 2021-23 PLAN
FSR flat YoY: QoQ improvement across the board: both retail and wholesaleTIM Domestic
▪ Retail YoY trend improving vs Q3 (-4.4% YoY vs -8.2% in Q3). Positive swing in Q4 vs. Q3 thanks to:
- CB evolution: ~ +0.9pp
- Consumer ARPU: ~ +0.7pp
- ICT revenues: ~ +1.3pp with 28% YoY growth (+18% in Q3) mainly for increased cloud services
Fixed RevenuesOrganic data€ m
233 249
506 553
1,515 1,448
269 265
Q4 '19 Q4 '20
2,548
Intern. Wholesale+6.9%
2,274
National Wholesale+9.4%
Retail -4.4%
Service -0.2%
Total -0.3%
2,279
2,539
Equipment
-1.4%
due tolockdown
Fixed Service Revenues flat YoY in Q4
▪ National Wholesale +9.4% vs. +1.7% in Q3 thanks to better mix in revenues (VULA vs ULL) and OLOs’ deals impact
▪ International Wholesale +6.9% vs. -1.8% in Q3 thanks to data business
ARPU trend improving QoQ
€/month
31.9 32.925.3 25.2
Q3 '20 Q4 '20
ARPU Consumer ARPU BB
-3.9% -3.0%
-5.9%-4.1%
YoY
-10.4% -10.1% -8.5%-5.4%
-0.2%
Q4 '19 Q1 '20 Q2 Q3 Q4
Fixed Service Revenues
YoY change

20FY ‘20 RESULTS AND 2021-23 PLAN
-35
Mobile KPIs showing improvements on all frontsTIM Domestic
Mobile Customer Base
19,894 19,795
10,272 10,375
30,165 30,170
Q3 '20 Q4 '20Human Not Human
k lines
Human net adds improved
Human net adds QoQk lines
-410
-579
-269 -261
-98
Q4 '19Q1 '20 Q2 Q3 Q4
Churn reduced YoYFurther step toward customer base stabilization: impact on MSR from CB reduction improved ~1pp QoQ (after ~2pp QoQ in Q3)
CSI +3.2% YoY in Q4
Churn reduced 1.0pp QoQ
NPS improving further QoQ and still well above large operators’
Calling lines net adds improved
Human Calling line lossesk lines
MNP balance keeps improving, TIM still the best among big 3
TIM MNP balancek lines
32
-182
-46-118
-166-260
-114-47 -57 -43 -35
Q2 Q3 Q4 Q1 Q2 Q3 Q4 Q1 Q2 Q3 Q4
Op.1
Op.2
Op.3
TIM
Q4 ‘202018 2019 2020
-658 -182
-1263
-664
FY '19 FY '20
Market MNP -19% YoY to 2.9m
5.5% 5.3%
4.0%5.2%
4.2%
Q4 '19 Q1 '20 Q2 Q3 Q4
Churn rate%
+5k

21FY ‘20 RESULTS AND 2021-23 PLAN
MSR more than halved YoY decline vs. Q3; discontinuities to fade-off in 2021TIM Domestic
Mobile RevenuesOrganic data € m
120 145
790 707
220177
Q4 '19 Q4 '20
1,029
Wholesale& Other+20.8%
852Service-6.4%
Retail-10.5%
910
1,130
Equipment-19.6%
(1) Including roaming, CSP cleaning and Consip contract renegotiated at lower prices
TIM human ARPUChange YoY %
Mobile ARPU better trend both YoY and QoQ
-4.4% -1.3% -1.0%-8.5% -4.2%
3.8% 3.8% -1.7% 0.1%
ReportedARPU
12.4 12.3 12.4 11.8 11.9
Q4 '19 Q1 '20 Q2 Q3 Q4
MSR improving: -6.4% YoY vs. -13.7% in Q3. YoY fall is explained by:
▪ One-off drags(1): ~ -3pp (vs. ~ -6pp in Q3), set to fade off in 2021
▪ CB trend: ~ -3pp (vs. ~ -4pp in Q3)
▪ Price dynamics: > +1pp (vs. ~ -2pp in Q3)
~3.3pp drags affecting Q4 are expected <1pp in ‘21
MTR price reduction explains -1.1pp drag (-0.7pp in Q3)
ARPU increasing 0.1% YoY excluding 4.4pp of one offs of which:
▪ 2.8pp CSP cleaning (+1.9pp QoQ),
▪ 1.5pp Roaming (flat QoQ)
▪ 0.1pp Consip contract at lower prices (+0.6pp QoQ)
Total-8.9%
Excludingone-offsimpact

22FY ‘20 RESULTS AND 2021-23 PLAN
Addressable cost base -7.4% YoY in Q4
-29
502
88
275
355
208
327
312
Interconnection
Equipment
CoGS
Commercial
Industrial
G&A & IT
Labour
Other
OPEXOrganic data, IFRS 16, € m
2,038
Q4 ’20
-3.4% (-72)
(2)
(3)
(1) Net of deferred costs, on a cash view, the reduction reaches € 74m (-3.3% vs -3.0% in Q3). Net of deferred costs, total OPEX amounts to € 2,194m in Q4 ’20 and € 2,268m in Q4 ’19. On a cash view, YoY changes differ in CoGS (+36%), Commercial (-7%), Industrial (+9%), G&A & IT (-15%) and Labour (-5%)
(2) Net of capitalized costs(3) Includes other costs/provision and other income
TIM Domestic
YoY change (1)
-6%
+3%
-18%
-4%
+11%
-16%
+38%
▪ Labour -4% YoY for FTE reduction (-2.4k YoY). Fall would be -9% net of ~€27m drag due to no solidarity in Q4 vs. 4 days of solidarity in Q4 ’19
▪ G&A -18% YoY thanks to lower indirect personnel and consulting, lower fleet management and civil building costs
▪ Industrial: lower energy costs (-6% YoY). Higher industrial building due to mobile sites co-sharing
▪ Commercial -6% for lower commissioning and bad debt partly offset by advertising
▪ CoGS increase related to ICT revenue growth
▪ Equipment down due to Covid-19
▪ Interconnection increase for higher international and retail traffic volumes
Addressable costs-7.4% YoY

23FY ‘20 RESULTS AND 2021-23 PLAN
CAPEX: lower YoY despite push on FTTxTIM Group
Organic data, € m
1,186 1,168
212 235
1,398 1,403
Q4 '19 Q4 '20
-1.5%
+9.7%
+0.4%
Domestic
Brazil
CAPEX: domestic FY guidance achieved
Group CAPEX flat YoY
Accelerated expansion in white areas (~10k new cabinets opened in FY) offset by improved efficiencies
Brazilian CAPEX increased in Q4 to catch up plans affected by COVID in previous quarters
(1) SKY payment, litigations and settlements, increased payments to personnel for exits ex. art. 4 Fornero Law
3,118 2,855 2,748
FY '18 FY '19 FY '20
Group Operating Working Capital outflow improving €534m YoY
Brazilian tax benefits and FX more than offsetting domestic negative one offs(1) (€209m)
€373m YoY improvement excluding YoY swing in non recurring items
Group Operating WC improving € 534m YoY
FY ’19 FY ’20
(560)
(26)
(53)
(214)
(613)
(240)Group
+373
Net Working CapitalIFRS 16, € m
D YoY
Operating WC Non recurring items
+534

24FY ‘20 RESULTS AND 2021-23 PLAN
Deleverage: €4,342m debt cut in 2020 (-€3,299m YoY After Lease view)TIM Group
€ m; (-) = Cash generated, (+) = Cash absorbed, excluding call-outs
Dividends& Change in Equity
FY ’19Net Debt
After Lease
OFCF FinancialExpenses
Cash Taxes &Other (1)
FY ’19Net Debt
(2,357)107Δ vs. 2019
25,270 28,328(1,819) 2412019
FY ‘19FY ’18 +2,398
274**204 ex Inwit
707
(103) -5,033
Leaseimpact
Leaseimpact
21,095
Leaseimpact
EBITDACAPEXΔWC & Others
1,621(1,403)
712Op.FCF ex. Licence 930
H1 ‘20Net Debt
(990) 324 228 1 27,891
(2,422)(5)(87)(24)51
9M ‘20Net Debt
FY ’20Net Debt
After Lease
-€ 2,147m
3,929**o/w 3,553 FTA IFRS 16
(1) Includes Inwit deconsolidation and monetization(2) Cash taxes and other includes license payments
-€ 354m
20,741
Dividends& Change in Equity
OFCF FinancialExpenses
Cash Taxes &Other (2)
FY ‘20Net Debt
Dividends& Change in Equity
OFCF FinancialExpenses
Cash Taxes &
Other
-€ 798m
Leaseimpact
(1,016) 341 425 27 27,668 (5775) 21,893
86 (59) (602) (1,345) (4,342) 1,043 (3,299)

25FY ‘20 RESULTS AND 2021-23 PLAN
Reported data, € m, Rounded numbers
Net Interest & Net Income/ Equity/ Disc. Operations
EBIT Net Income Reported
Taxes Net Incomebefore
Minorities
MinoritiesEBITDAOrganic
EBITDAReported
Depreciation & Amortization
& Other
Non recurring
items
FY ‘19 3,175 (1,420) (513) 1,242 (326) 9168,151 (4,976)7,505 646
Δ vs. FY ‘19 341 (1,071) 713 6,468 6,110 198 6,308(1,412)(442) (970)
FY ‘20
TIM Group
Net Income post minorities +6,308m YoY
Inwit gain following the merger 452Inwit equity share 18Net financial expenses (1,179)
COVID-19 impactPersonnel and other
(108)(216)
€78m net of realignment of intangible asset tax value
FY Net Income grew €6.3bn YoY, +€0.4bn net of tax asset value realignment

26FY ‘20 RESULTS AND 2021-23 PLAN
TIM Group
▪ Decree-Law 104/2020 allows for realignment of intangible asset tax value to the book value
▪ 3% substitute tax to be paid on the amount redeemed
▪ Future income taxes will benefit from intangible asset tax amortization
Realignment of the tax value
▪ Overall tax benefit: € 5.9bn (28.5% of tax basis) net of substitute tax
▪ Benefit will occur over 18 years
TIM SpA intangible assets redeemed
▪ To be paid in 3 annual instalments (€ 0.2bn per year), from June 2021Substitute tax (3%): € 0.7bn
Realignment of intangible asset tax value

WHAT NEXT? A BETTER MACRO AND TELCO OUTLOOK
28FY ‘20 RESULTS AND 2021-23 PLAN
Macro context: 2021 GDP growth swing YoY expected one of the largest in modern history. EU recovery fund set to boost economy and telco sector
1.2%3.8%
2.3%2.4%
2022
-8.9%
3.5%
202320212020
Including Next Generation EU contribution
GDP expected to grow in 2021-23 (1)
Italy GDP growthYoY %
+2.5pp expected GDP impact from Next Generation EUover 2021-23 vs. base scenario
Health
€ 19.7bn
Green revolution
€ 69.8bn
Education
€ 28.5bn
Social€ 27.6bn
Digitalization€ 46.3bn
Infrastructure
€ 32bn
Transition 4.0€ 18.8bn
UBB, 5G & satellites€ 4.2bn
Supply chain & internationalization € 2.0bn
SMEs digitalization € 0.8bn
PA modernization€ 1.5bn
PA digitalization€ 8.0bn
Justice€ 2.3bn
Microprocessors € 0.8bn
Culture & Tourism€ 8.0bn
1) Source: Banca d'Italia, "Proiezioni macroeconomiche per l’economia Italiana" as of July 2020 and January 2021
Next Generation EU fueling economic recovery and digitization:€ 209bn funds allocated to Italy
On top of >€ 150bn allocated by the Government for liquidity and solvency measures

29FY ‘20 RESULTS AND 2021-23 PLAN
Telco context: new reasons to close the penetration gaps vs. Europe and grow
Growing fixed market...
Fixed market (1)
Million lines
...and B2B demand
2019 value pool, € bn
’19-24 CAGR, %
+19.0%3.3
+8.4% (2)1.6
+4.5%9.1
+10.8%4.3
+7.6%5.7
Cloud
Cyber-security
IOT Merchant services
IOT Urban services
IOT Industrial services
2020 '21 '22 '23
Fixed 1.6% CAGRBB 2.7% CAGR
o/wBB lines
Broadband «Mobile-only» families
Source: Eurostat
...pushed by B2C...
Cloud Gaming
2020 '23
4.7x
Smart Home
2020 '23
1.7x
PayTV OTT
2020 '23
1.8x
Source: Polimi/Statista, Analysis Mason, OMDIA Source: Gartner, IDC, Assintel, PoLiMi
Fixed market growth expected to become structuralNew habits and needs bring mobile-only BB users back to fixed, closing >10pp gap vs. other EU Countries
1) Source: AGCOM, internal elaborations on Analysis Masons’ estimates 2) Overall market growth rate (CAGR ’19-22)

TIM READY TO RIDE ALL OPPORTUNITIES IN CONNECTIVITY AND BEYOND
- ITALY -

31FY ‘20 RESULTS AND 2021-23 PLAN
Further improve
operational excellence
Improved KPIs and reduced cost structure
Unique commercial proposition
Connectivity quality leader provider in Italy
Integrated platform to develop new digital services through an
ecosystem of tech partners
Best technological infrastructure
Further UBB deployment & technological upgrading
Leaner organizational
modelSuperior capabilities
and efficiency
Central role of ESG objectives
plan 2021-23
“Beyond Connectivity”
2021-23 TIM Strategic planTIM Group
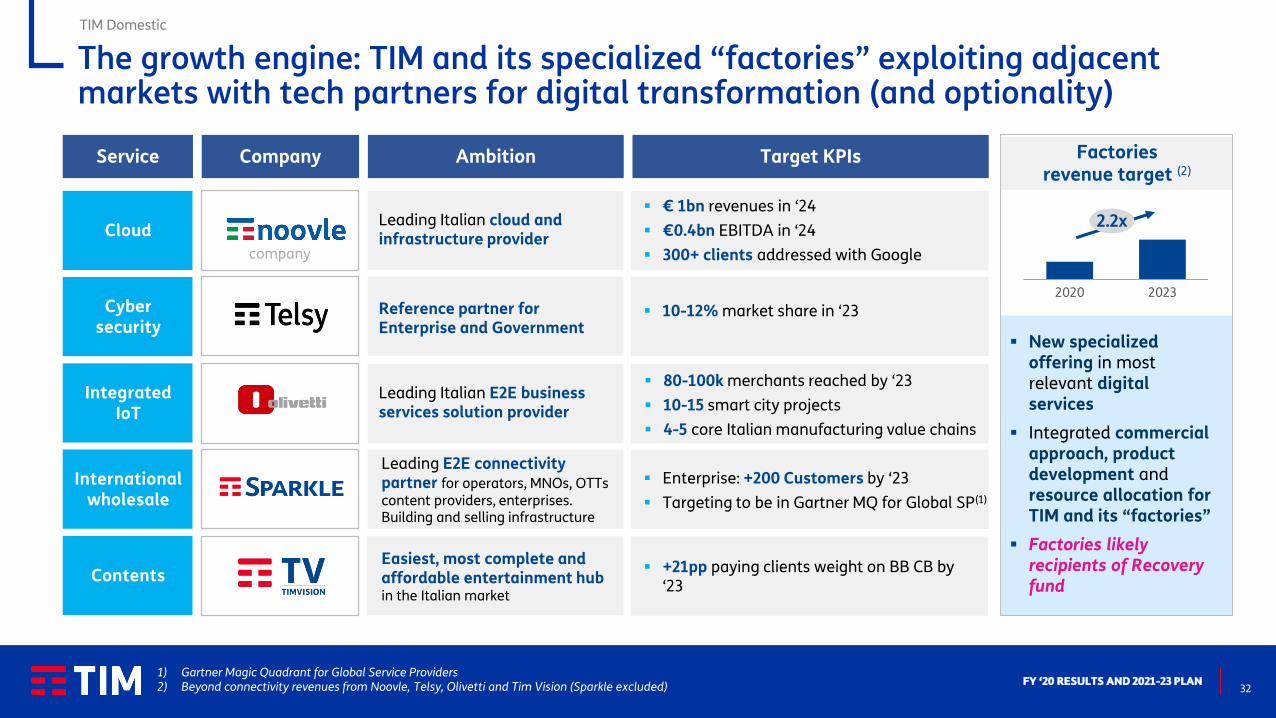
32FY ‘20 RESULTS AND 2021-23 PLAN
Factories revenue target (2)
▪ New specialized offering in most relevant digital services
▪ Integrated commercial approach, product development and resource allocation for TIM and its “factories”
▪ Factories likely recipients of Recovery fund
Integrated IoT
Cyber security
Cloud
Contents
International wholesale
▪ € 1bn revenues in ‘24
▪ €0.4bn EBITDA in ‘24
▪ 300+ clients addressed with Google
Reference partner for Enterprise and Government
▪ 10-12% market share in ‘23
Leading Italian E2E business services solution provider
Leading Italian cloud and infrastructure provider
Ambition Target KPIs
Easiest, most complete and affordable entertainment hub in the Italian market
Leading E2E connectivity partner for operators, MNOs, OTTs content providers, enterprises. Building and selling infrastructure
▪ 80-100k merchants reached by ‘23
▪ 10-15 smart city projects
▪ 4-5 core Italian manufacturing value chains
▪ Enterprise: +200 Customers by ‘23
▪ Targeting to be in Gartner MQ for Global SP(1)
▪ +21pp paying clients weight on BB CB by ‘23
CompanyService
1) Gartner Magic Quadrant for Global Service Providers2) Beyond connectivity revenues from Noovle, Telsy, Olivetti and Tim Vision (Sparkle excluded)
company
The growth engine: TIM and its specialized “factories” exploiting adjacent markets with tech partners for digital transformation (and optionality)
TIM Domestic
2020 2023
2.2x
33FY ‘20 RESULTS AND 2021-23 PLAN
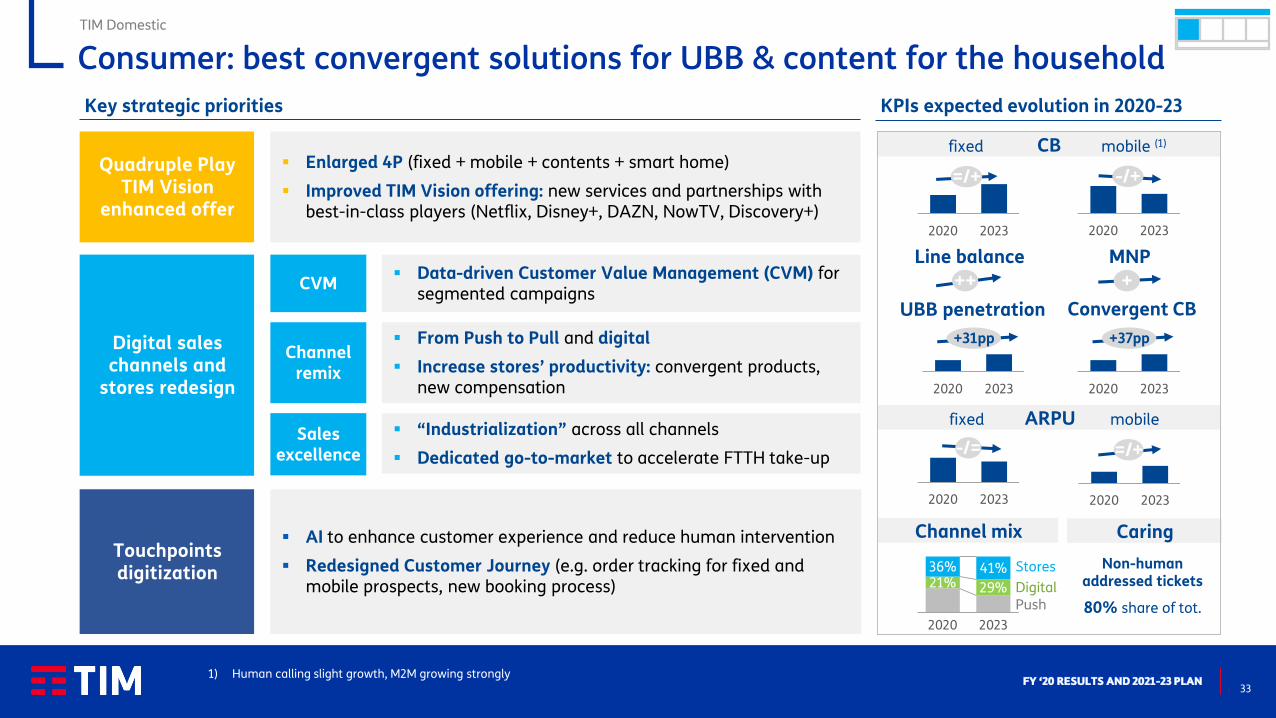
▪ AI to enhance customer experience and reduce human intervention
▪ Redesigned Customer Journey (e.g. order tracking for fixed and mobile prospects, new booking process)
Touchpoints digitization
Quadruple Play TIM Vision
enhanced offer
Digital sales channels and
stores redesign
Key strategic priorities
▪ Enlarged 4P (fixed + mobile + contents + smart home)
▪ Improved TIM Vision offering: new services and partnerships with best-in-class players (Netflix, Disney+, DAZN, NowTV, Discovery+)
▪ Data-driven Customer Value Management (CVM) for segmented campaigns
CVM
Channel remix
Sales excellence
▪ From Push to Pull and digital
▪ Increase stores’ productivity: convergent products, new compensation
▪ “Industrialization” across all channels
▪ Dedicated go-to-market to accelerate FTTH take-up
Consumer: best convergent solutions for UBB & content for the householdTIM Domestic
1) Human calling slight growth, M2M growing strongly
ARPU
2020 2023
KPIs expected evolution in 2020-23
2020 2023
mobilefixed
=/+
2020 2023
-/+
2020 2023
=/+-/=
MNPLine balance
CB mobile (1)fixed
++ +
21% 29%
36% 41%
2020 2023
Digital
Stores
Convergent CB
2020 2023
+37pp
Channel mix
Push
Non-human addressed tickets
80% share of tot.
Caring
UBB penetration
2020 2023
+31pp

34FY ‘20 RESULTS AND 2021-23 PLAN
TIM’s networks: the largest coverage at the highest speed, HD Video ready
coverage
FTTC FTTHMobile, FWA
& satellite
speed Mbps
VIDEO HD contemporary
streams (2)
30-200 >1,000 >40 4G >200 5G
6-40 >200 >8 4G >40 5G
2020 2025
Already 91%(1) of active linesand 85% of
technical units
85%
2020
20%
56%Already 99%
with 4G
2020
99%
1) To reach 93% in 20232) Note: 5 Mbps for Video HD bandwidth requirements (YouTube/Netflix)
TIM Domestic

35FY ‘20 RESULTS AND 2021-23 PLAN
▪ Dedicated support for high-value accounts with “1-to-1” approach
Improved caring and assistance
Unique one-stop-shop solution
Evolved distribution
model
Key strategic priorities for TOP
▪ Comprehensive cloud solution package and end-to-end IoT solutions
▪ Capability building program
▪ New Sales & Marketing tools: account planning, CRM, marketing campaigns
KPIs expected evolution in 2020-23
Sales excellence
& CVM
Channel remix
▪ Re-engineered salesforce channel to win in ICT
Enterprise resources to be trained
▪ Turnkey ICT offering, jointly developed with “factories” and partners: Payments, VoIP, Cybersecurity, Cloud
▪ Redesigned caring processes and systems to sustain premium positioning
▪ Push convergence and ICT products
▪ Improve segmentation with dedicated loyalty offerings
▪ New dedicated SoHo channel
▪ New incentives scheme
Key strategic priorities for SME
2020 2023 2020 2023
+10pp +12pp
Revenue share of digital services
Enterprise SME
Enterprise sales per representative
2020 2023
+15%
Faults closed in next business day
81% 90%
2020 2023
SME
2,000
Business: new offering / new channels for SME and SOHO. End-to-end IoT/Cloud solutions for Enterprise and P.A.
TIM Domestic

36FY ‘20 RESULTS AND 2021-23 PLAN
▪ Co-investment: commercial agreements to develop FTTH with both existing and new customers
▪ “Turn-key” offers (One-Step) to increase customer satisfaction
▪ Increase competitiveness of Bitstream/NGA
CB protection through
UBB expansion and offer breadth (suits different level of
infrastructure and geographical footprint)
Key strategic priorities KPIs expected evolution in 2020-23
Fiber accesses
VULA + BTS NGA, million accesses
▪ Strengthen TIM's offering and role as backhaul provider
▪ Review commercial offer of High Quality Connectivity (Gea and Giganet)
▪ Expand offering to Data Center Services
Growth of not regulated
services
GEA'000 links
Giganet'000 links
2020 2023
+48%
2020 2023
+56%
Growth targeting new segments
and geographies
▪ Core Connectivity and E2E Enterprise partnerwith new integrated portfolio of Security, IoT and Cloud services
▪ Cross segment enablers: e.g. co-building partnerships with Hyperscalers/OTTs and collaboration with TIM Factories
National Wholesale
2020 2023
1.6x
2020 2023
+8pp
Not regulated
Percent of Wholesale revenues
Sparkle gross revenues% on total gross revenues
64% 47%
28%37%
8% 16%
2020 2023
Data Enterprise
Data Wholesale
Voice/Mobile
TIM Domestic
Wholesale: UBB/solutions provider in regulated and non regulated markets

37FY ‘20 RESULTS AND 2021-23 PLAN
Addressable cost base to be further optimized. Some initiatives yet to unfold full potential
(1) Issued by GSE to certify energy savings (1 certificate per ton of oil equivalent saved), con be traded (current value € 250 -260)(2) 2020-22 plan’s targets based on IFRS 9-15 accounting standards
Addressable base evolution Main initiatives
▪ Continue using early retirement schemes
▪ Optimize channel mix (web sales +8pp by 2023),
▪ Keep working on bad debt (-32% planned by ‘23)
▪ Increase self-care and faults prediction through AI
▪ Optimize real estate footprint
▪ Think our of the box, e.g. white certificates
▪ Extend adoption of new operating models (automation, remotization, consolidation)
▪ Streamline procurement through massive insourcing, demand shaping, Should-Cost and Design-to-Value
2019 '20 '23
Costs on revenues %
2019 '20 '23
P&L view
Cash view
Example of initiatives not yet showing their full benefit
-1pp-2pp
-1pp-1pp
White certificates(1): revenues generated from eco-efficiency improvements (see details in Apendix)
FIXED - Copper to fiber switch▪ FTTC 60% more efficient than ADSL ▪ FTTH 20x more efficient than ADSL
MOBILE - 4G upgrade and 5G roll-out▪ Evolved 4G 20% more efficient vs 4G (2)
▪ 5G (5x more efficient than 4G)
Approvedprojects
Potential next steps
▪ Data Centers▪ Special projects
White certificates P&L benefit estimate
Cumulated P&L benefit in 6 years∑ = €0.25-0.4bn
before data centers and special projects2021 '22 '23 '24 '25 '26
Approval pending
Already approved
Progressive yearly accruals based on internal accounting of the actual efficiency vs 2019 baseline, first settlement and TEE issue on 2023
TIM Domestic

38FY ‘20 RESULTS AND 2021-23 PLAN
CAPEX: ~€2.9bn p.a. for strong FTTH/5G coverage expansion
▪ ROI-driven mobile/fixed access development (4G and 5G, FWA, FTTx) to close digital divide
▪ FTTH roll out with new model delivery, assurance, deployment
▪ Decommissioning of legacy systems. Getting ready for 3G switch off during 2022
▪ Enable B2B use cases with low latency (e.g. connected cars)
Grow & Transform Capex evolution and mix
Co-investment scheme according to EU Telecommunication
Code art.76 (regulation eased)
In Jan 2021 TIM published a public offer for co-investment:
▪ Scope: FTTH secondary access network
▪ Coverage: 1,610 municipalities, reaching 76% of technical units (12.9m), in black and grey areas
▪ Target: operators taking volume commitments (pay per use or IRU)
▪ Timing: 2021-25
2020 ‘21 ‘22 ‘23
Grow & transform (TIM)Run (TIM)
~2.7 ~2.9 ~2.9 ~2.9
Grow & transform (FiberCop)Run (FiberCop)
FiberCop
at regime
(1) Technical units = residential or business sites which have had a fixed line connection in the last 10 years, corresponding to c. 5m occupied premises based on ISTAT Black areas = high density urban areas; grey areas = mid density urban areas
Extensive FTTH roll-out plan through FiberCop
▪ 2020: 10 cities (90% Milan)
▪ 2021: all major cities, tourist areas and industrial districts
▪ 2025: national coverage
5G coverage
2019 '20 '21 '22 '23 '24 '25 '26
Black Areas FTTH Grey Areas FTTH FTTC
FTTH Coverage @2025
56%Italy
76%Black+Grey Areas
100%Black Areas
FTTH
56%
FTTC
85%
BlackAreas
GreyAreas
WhiteAreas
25%33%
42%51%
Coverage of technical units (1)
TIM Domestic

39FY ‘20 RESULTS AND 2021-23 PLAN
Strategic initiatives update
Develop TIM Brasil
▪ Carve-out finalized
▪ Co-investment scheme published and open to all operators
▪ 2021 revenues E1.2-1.3bn, EBITDA c. 0.9bn, debt/EBITDA 3.4x
▪ EBITDA – CAPEX positive from 2025; CAPEX/sales <10% at regime
▪ €1.8bn cash-in from KKR to buy 37.5% of FiberCop
▪ Oi mobile business auction in December 2020 awarded to TIM Brasil, VIVO and Claro
▪ Assets allocation to TIM: ~14.5m customers, ~7.2k mobile sites, ~49 MHz frequencies
▪ Execution pending CADE approval
AccessCo▪ Enel announced disposal of its stake in OF to Macquarie
▪ Technical due-diligence of OF and FiberCop completed, confirming our initial expectations
Data centerscarve out
FiberCop
▪ Carve out of Noovle completed
▪ €0.5bn revenues and €0.2bn EBITDA generated in 2020, in line with plan
▪ €1bn revenues and €0.4bn EBITDA targeted for 2024
TIM Group

TIM READY TO RIDE ALL OPPORTUNITIES IN CONNECTIVITY AND BEYOND
- BRAZIL -

41FY ‘20 RESULTS AND 2021-23 PLAN
TIM Brasil: Delivering growth in a more challenging macro scenarioTIM Brasil
ARPU +4.9% YoY
to 24.9 R$/month
Human Postpaid ARPU +3.4% YoY
Prepaid ARPU+4.9% YoY
Revenues +27.9% YoY
CB +14.0% YoY to 645k
ARPU +7.8% YoY to R$ 87.2
Postpaid+1.9% YoY
flat MSR YoY
FSR+11.1% YoY
driven by TIM Live
Mobile TIM Live
Reported data
Service Revenues improved (+0.4% YoY in FY ‘20)with positive contributions from both mobile postpaid and fixed
OPEX below inflation(+1.0% YoY vs IPCA2 4.5%)
Bad debt back on track(2.3% of gross revenues)
Focus on value and service quality driving churn rate
reduction
Special Projects
Signing with Oi
Fiber Co: Network last mile carveout
ESG
One of the best ranked stocks in the B3 and S&P ESG index
New ESG committee
Infrastructure Development
FTTH coverage +43% YoY(3.2 mln HHs covered)
Best 4G coverage experience and availability
(95% urban pop. coverage in 3.9k cities)
Massive MIMO rollout(200 cities implemented)
Network Sharing Agreement(3G/4G expansion: 730 cities in 1H21e)
EBITDA1 expansion with the highest Latam margin, leading to cash flow and
net debt improvement: Net Cash on b/sheet more than doubled YoY
(1) Normalized(2) Last 12M IPCA as of December 2020
1.7%
-3.4%
1.3% 1.9%
1Q20 2Q20 3Q20 4Q20
(YoY)Net Service Revenues

42FY ‘20 RESULTS AND 2021-23 PLAN
Better macro and telecoms outlookTIM Brasil
Acceleration in
digital consumption
Mobile market
consolidation
Monetization of
Consumer Platform
IoT and M2M
technology
Paving the way for
5G
Dynamic
Data demand growth
for mobile and fixed,
further accelerated by
Covid-19
Moving from 5 to 4
after Nextel
acquisition and from 4
to 3 after deal with Oi
mobile is completed
Increasing numbers
of digital business
leveraging Telco’s
Consumer Platform
(e.g. digital wallet,
data monetization)
Exponential number
of use cases in
several industries
(e.g. agribusiness,
connected cars,
utilities, health)
Preparation to launch
5G, with 5G DSS as
marketing positioning,
auction and vendor
analysis
Increasing initiatives
of network
separation (InfraCo
vs. ServCo)
Wave of asset
separation
Revenue growth on data monetization
Increase pressure over network cash costs
Geographical expansion of fiber
Foster more balanced
competitive
landscape (e.g.
pairing spectrum gap)
New revenue sources
for telco operators
leveraging new digital
disruptors (e.g.
fintech, data provider,
OTT content)
Expand business
beyond connectivity
(e.g. applications,
data monetization,
implementation)
Focus on 5G network
rollout with proposed
auction framework,
Release 16 as catch
up for the country
Partnership
negotiation to finance
network expansion
and modernizationImplications
and
Opportunities

43FY ‘20 RESULTS AND 2021-23 PLAN
Solid results in 2020 confirm the consistency of our strategic plan TIM Brasil
Strategic Paths
Transformational Enablers
Capture ultrabroadband market growth opportunity with new financial and business models
Fill current infrastructure gap with M&A, also fostering inorganic growth and capturing potential synergies
Boost disruptive efficiencies through digitalization, automation and new operating models, leveraging skills and capabilities enhancement
Boost disruptive efficiencies
Strengthen sustainability
Strengthen and consolidate ESG proposition making a positive transformation
Build the future
Expand new sources of value (e.g. IoT, C6, Mobile Advertising, Customer Data Monetization, Health, Education) leveraging the customer base platform through ecosystem and partnerships
Strengthen the core
Enhance and accelerate the transition from volume to value, to sustain mobile business growth, focusing on customer experience
Implement transformational projects on infrastructure (e.g. 5G, ORAN, M-MIMO, cloudification)
Imagine as possibilidades

44FY ‘20 RESULTS AND 2021-23 PLAN
“Imagine as possibilidades”: Our aspirations for 2023 reflect market opportunities and trends
TIM Brasil
Create at least 3 new businesses as a Consumer Platform
Become the preferred mobile player for customers
Turn into an ESGreference in Brazil
Develop distinctive IoT value propositions, creating ecosystems
Set industry benchmarks, scaling digitization and improving processes
Increase share in the growing FTTH market
Fill the spectrum frequency gap
Imagine as possibilidades

45FY ‘20 RESULTS AND 2021-23 PLAN
Oi’s assets integration could transform TIM Brasil by 2023TIM Brasil
(1) Includes Oi assets integration, IFRS15/16, and does not include 5G related capex (e.g. spectrum license and cleaning, network capex rollout) and last mile carveout project (FiberCo)
(2) Incremental due to both Oi's assets incorporation and new market dynamics

46FY ‘20 RESULTS AND 2021-23 PLAN
Market guidance 21-23 shows Revenue and EBITDA growth, and positive impact coming from M&A
TIM Brasil
Note: Oi’s assets expected impacts refer to the portion of the assets that would be transferred to TIM after the closing and considers split assumptions contained in the SPA contract.
GOALSSHORT TERM TARGETS
(2021)LONG TERM TARGETS
Revenue Growth
Sustainability
Service Revenues Growth:
Mid single digit (YoY)
Service Revenues Growth (CAGR ‘20-’23):
Mid single digit standalone
High single digit combining Oi’s assets
Improve Profitability
EBITDA Growth:
Mid single digit (YoY)
(Including preparation costs)
EBITDA Growth (CAGR ‘20-’23):
Mid single digit standalone
Double digit combining Oi’s assets
Infrastructure Development
Capex:
~R$ 4.4 bln
(including preparation investments)
Capex (cumulated 2021-’23):
~R$ 13.0 bln standalone
~R$ 13.5 bln combining Oi’s assets
(Capex on revenues declining starting in 2022 combining Oi’s assets)
Expand Cash Generation
EBITDA-Capex on Revenues:
~24%
(including preparation costs and investments)
EBITDA-Capex on Revenues:
≥ 29% in 2023 combining Oi’s assets

FINANCIAL AND ESG GUIDANCE CLOSING REMARKS

48FY ‘20 RESULTS AND 2021-23 PLAN
New plan confirms cash generation, dividend guidance and deleverage
TIM Group
▪ €0.7bn to be spent in 2021-23 as tax realignment cost (€5.9bn tax asset net of realignment cost to be used mostly after the plan period)
▪ ~€0.3bn anticipation of 2100 MHz spectrum prepayment with €40m financial benefit, affecting 2021 net debt (not Equity Free Cash Flow)
€ bn, after lease
Tax realignment cost (~€ 0.7bn) and FX impact
2019-’21EFCF guidance
2020-’22EFCF guidance
2021-’23EFCF guidance
3.54.5-5.0
~4.0
Cumulated Equity Free Cash Flow guidancefor 2021-23 similar to 2020-22
Anticipating a few payments
▪ ordinary: floor of €1 cent per share, aiming at distributing 20-25% of yearly organic Equity FCF. Payout policy above floor subject to deleverage execution
▪ savings: €2.75 cents per share throughout 2021-23
Long term ambition: distribute 50% of yearly organic Equity Free Cash Flow
2021-23 >2023
Dividend distribution guidance unchanged

49FY ‘20 RESULTS AND 2021-23 PLAN
Guidance 2021-23: proceeds from FiberCop included, Oi’s acquisition not yetreflected
(1) Guidance based on IFRS 16 for EBITDA in Brazil(2) Including proceeds from FiberCop (€1.8bn), including anticipation of 2100 MHz spectrum prepayment (~€0.3bn), and excluding Oi’s mobile acquisition(3) Based on Organic EBITDA AL; 2.7x based on Reported EBITDA AL P/L figures @ average exchange-rate actual 5,9 REAIS/EUR
Organic Service revenues
Low single digit growth
CAPEX
Eq FCF AL Cumulated ~€ 4.0 bn
Adjusted Net Debt AL
YoY growth rates,IFRS 16 / After Lease
2021
Group Domestic Brazil (1)
2022-23 2021 2022-23 2021 2022-23
Organic EBITDA AL
Low to Mid single digit growth
Low single digit growth
Dividendordinary: floor of € 1 cent per share, aim to distribute 20-25% of yearly Equity FCF subject to deleverage execution
savings: €2.75 cents per share throughout 2021-23
~€ 16.5 bnexcluding Oi (2)
Stable to Low single digit growth
Stable Mid single digit growth
Mid single digit growth
~R$ 13.0 bn~R$ 13.5 bn with Oi
Net of ~€0.7bn tax realignment cost
Mid single digit growthHigh single digit growth(CAGR ‘20-’23) with Oi
Mid single digit growthDouble digit growth
(CAGR ‘20-’23) with Oi
Stable to Low single digit growth
Stable
2.6x Net Debt AL / EBITDA AL (3)
by 2023
~€ 2.9 bn per year
Stable to Low single digit growth
TIM Group

50FY ‘20 RESULTS AND 2021-23 PLAN
ESG plan and guidance confirmed or raised
(1) New “Beyond Connectivity” plan targets, baseline 2019. Domestic, except for indirect emissions and carbon neutrality (Group)(2) Scope 2, TIM Group(3) TIM Group(4) Through a mix of GO, PPA, including direct sourcing from windfarm reblading and photovoltaic power plants
Gender equality and inclusion targets in management remuneration
Implement EU Taxonomy and SASB reporting
Climate strategy
Carbon free energy for infrastructures (data centers, fixed and mobile networks)
Science Based Targets initiative validated goals
Scope 3 calculation
Carbon offsetting of CO2 emissions by ‘23
Renewable energy increase(4)
Carbon calculator tool for business clients
Sustainable supply chain improvement
Circular economy standardsfor infrastructure and workplaces
Agile and sustainable buildings
Circular economy
Reduce digital Divide and social exclusion through extensive infrastructure
5G development to push adoption green and socialIoT services
Digital initiatives in response to COVID-19 emergency, on top of “Operazione Risorgimento Digitale”
Digital inclusion
Incremental actions 2021-23
2023
Targets (updated)(1)
Employees engagement
Hours of training forreskilling and upskilling
Churn of young employees
+19pp
6.4m hrs
<15%
2024
New VC fund size
Green Smartphone
IoT and Security service revenues (CAGR)
€ 60m
+20%
>15%
2030
2025
Carbon Neutrality(3)
Indirect emissions(2)
Eco-efficiency +50%
Renewable energyon total energy (%) +5pp/yr
-70%
E E
G
NEW
NEW
S
Promote sustainabilitythrough strategic alliances (Eco-rating, B Lab)
NEW
NEW
TIM Group
NEW

51FY ‘20 RESULTS AND 2021-23 PLAN
Closing remarks
▪ Revenues and EBITDA stabilized in Q4
▪ ESG and financial guidance delivered
▪ Improving macro scenario for Italy and the telco sector
▪ TIM ready to ride all opportunities in connectivity and beyond, both in
Italy and in Brazil
▪ Confident with our guidance of domestic and group revenue growth
▪ Making the world a better place to live in
TIM Group

Q&A

ANNEX

54FY ‘20 RESULTS AND 2021-23 PLAN
IFRS 16 and IFRS 16 After Lease viewTIM Group
€ m, organic
Gro
up
Q4 ’19 EBITDA
1931,790 (206)
Leaseimpact
1,584 1,764
Q4 ‘19 EBITDA AL
Q4 ‘20 EBITDA AL
1,571
Q4 ‘20 EBITDA
(0.8%)(1.5%)
Leaseimpact
€ m, organic
Do
me
stic 126
1,432 (140) 1,292 1,3961,270
(1.7%)
(2.5%)
Q4 ‘19 EBITDA
Leaseimpact
Q4 ‘20 EBITDA
Leaseimpact
Q4 ‘19 EBITDA AL
Q4 ‘20 EBITDA AL
EBITDA After Lease
Equity Free Cash Flow After Lease
EFCFQ4 ’19
126639 (242)
IFRS 16& IAS17
397748
EFCF ALQ4 ’19
EFCF ALQ4 ’20
622
EFCFQ4 ’20
+225+109
IFRS 16& IAS17
€ m, reported
Net DebtFY ‘19
4,73227,668 (5,775)
IFRS 16& IAS17
21,893 23,326
Net Debt ALFY ‘19
Net Debt ALFY ’20
18,594
Net DebtFY ’20
(3,299)(4,342)
Net Debt After Lease
IFRS 16& IAS17
€ m, reported
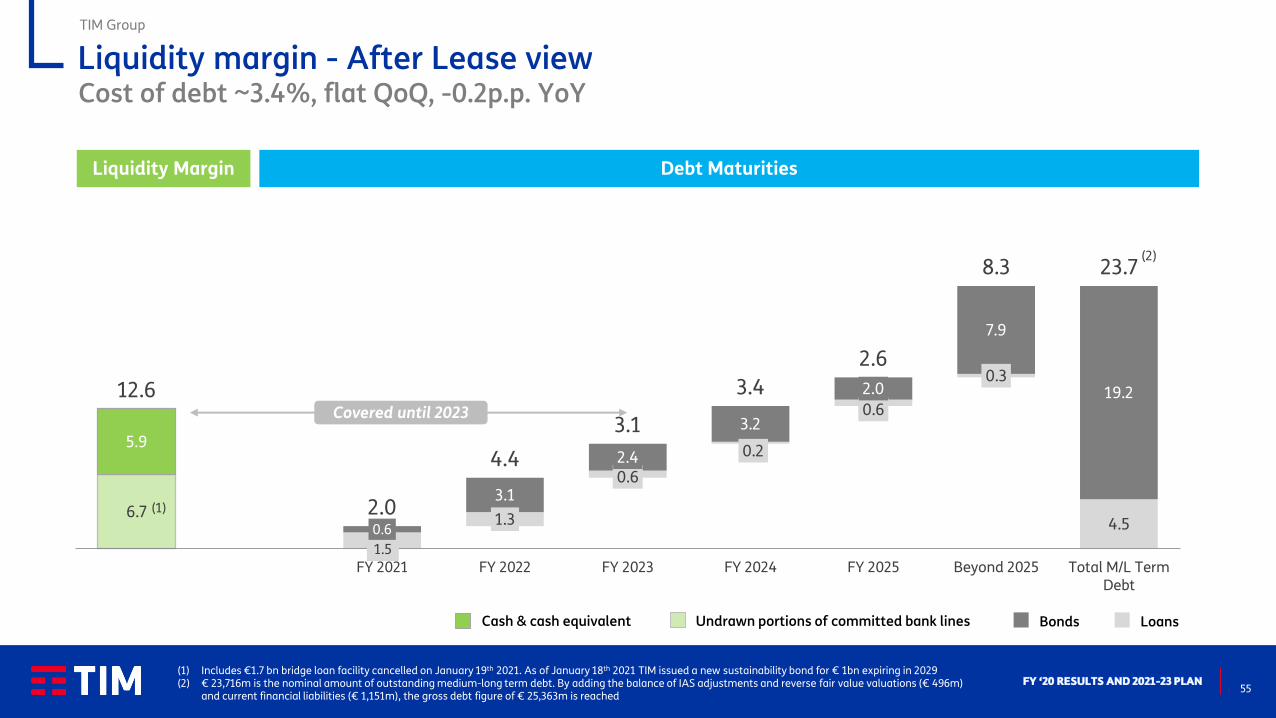
55FY ‘20 RESULTS AND 2021-23 PLAN
Liquidity margin - After Lease viewCost of debt ~3.4%, flat QoQ, -0.2p.p. YoY
TIM Group
1.5
1.3
0.6
0.2
0.6
0.3
4.56.7
0.6
3.1
2.4
3.2
2.0
7.9
19.2
5.9
12.6
2.0
4.4
3.1
3.4
2.6
8.3 23.7
Liquidity margin FY 2021 FY 2022 FY 2023 FY 2024 FY 2025 Beyond 2025 Total M/L TermDebt
(2)
Liquidity Margin Debt Maturities
Bonds LoansUndrawn portions of committed bank linesCash & cash equivalent
Covered until 2023
(1) Includes €1.7 bn bridge loan facility cancelled on January 19th 2021. As of January 18th 2021 TIM issued a new sustainability bond for € 1bn expiring in 2029(2) € 23,716m is the nominal amount of outstanding medium-long term debt. By adding the balance of IAS adjustments and reverse fair value valuations (€ 496m)
and current financial liabilities (€ 1,151m), the gross debt figure of € 25,363m is reached
(1)

56FY ‘20 RESULTS AND 2021-23 PLAN
* Including cost of all leases
Cost of debt ~3.7%*, flat QoQ, -0.4p.p. YoY
TIM Group
Bonds LoansUndrawn portions of committed bank linesCash & cash equivalent Finance Leases
0.6 0.6
0.5
0.5
0.4
2.2
4.8 1.5
1.3
0.6
0.2
0.6
4.5
6.7 0.6
3.1
2.4
…
2.0
7.9
19.2
5.9
12.6
2.6
4.9
3.6
3.9
3.0
10.4 28.5
Liquidity margin FY 2021 FY 2022 FY 2023 FY 2024 FY 2025 Beyond 2025 Total M/L TermDebt
(2)
Liquidity Margin Debt Maturities
(1) Includes €1.7 bn bridge loan facility cancelled on January 19th 2021. As of January 18th 2021 TIM issued a new sustainability bond for € 1bn expiring in 2029(2) € 28,487m is the nominal amount of outstanding medium-long term debt. By adding the balance of IAS adjustments and reverse fair value valuations (€ 555m)
and current financial liabilities (€ 1,151m), the gross debt figure of € 30,193m is reached
(1)
Covered until 2023
Liquidity margin - IFRS 16 view

57FY ‘20 RESULTS AND 2021-23 PLAN
Well diversified and hedged debtTIM Group
Average m/l term maturity: 9.7 years (bond 6.8 years only)
Fixed rate portion on medium-long term debt ~71%
Around 25% of outstanding bonds (nominal amount) denominated in USD and GBP and fully hedged
Banks & EIB17.5% Bonds
64.7%
Other1.8%
Op. leases and long rent
16.0%
Gross Debt
(1) Refers to positive MTM derivatives (accrued interests and exchange rate) for € 580m, financial receivables for lease for € 98m and other credits for € 268m
NFP
adjusted
Fair
value
NFP
accounting
GROSS DEBT
Bonds 19,541 303 19,844
Banks & EIB 5,279 5,279
Derivatives 240 1,666 1,906
Op. leases and long rent 4,830 - 4,830
Other 303 - 303
TOTAL 30,193 1,969 32,162
FINANCIAL ASSETS
Liquidity position 5,921 - 5,921
Other (1)
946 1,581 2,527
TOTAL 6,867 1,581 8,448
NET FINANCIAL DEBT 23,326 388 23,714

58FY ‘20 RESULTS AND 2021-23 PLAN
TIM Brasil: Q4 results in a nutshellTIM Brasil
FTTH coverage +43% YoY3.2m HHs covered
Best 4G coverage experience and availability95% urban pop. coverage in 3.9k cities
Massive MIMO rollout200 cities implemented
Conduct Adjustment Term 2021 commitment delivered
Mobile TIM Live
(1) Normalized(2) Excluding M2M(3) Pro-forma excludes the effects of the adoption of IFRS 9, 15 and 16
Reported data, R$m
4,101 4,164
256 277
4,357 4,441+1.9%
+8.0%
+1.5%
ARPU +4.9% YoYto 24.9 R$/month
Prepaid ARPU +3.4% YoYPostpaid ARPU +4.9% YoY(2)
Revenues +27.9% YoY
CB +14.0% YoY to 645k
ARPU +7.8% YoY to 87.2 R$
39.8% 40.9%38.5%
‘18 ‘19 ‘20
36.6%
‘17
33.5%
2016
EBITDA margin (Pro-forma) (3)
Service Revenues improved further (+1.9% YoY), with positive contributions from both mobile postpaid and fixed
Q4 ’19 Q4 ’20
MSR +1.5% YoY (vs. +0.4% in Q3), with Prepaid –4.9% (vs. -2.0% in Q3) and Postpaid +3.6% (vs. +1.2% in Q3)
FSR +8.0% YoY driven by TIM Live
EBITDA(1) expansion supported by revenue trend and strict cost control, leading to the highest margin in TIM’s history and best in the market
2,3112,380
+3.0%
Q4 ’19 Q4 ’20
Beyond the core
>1.1m open accounts
Q4’20 EBITDA margin: 50.9%
ESGOne of the best ranked stocks in the B3 and S&P ESG index
Board members new ESG Committee
ARPU growth in all segments
Lower churn through better value proposition
Infrastructure Development
>120k payments in the 1st month
>0,5m by February
>=70% reduction in collection costs
Partnership signed: Telcos + Central bank to integrate PIX and prepaid
recharge wallet and invoice payments

59FY ’20 RESULTS AND 2021-23 PLAN
For further questions please contact the IR team
(+39) 06 3688 1 // (+39) 02 8595 1
www.gruppotim.it
www.twitter.com/TIMNewsroom
www.slideshare.net/telecomitaliacorporate