Embed Size (px)
Citation preview

FY 19 Year End, FY 20 Amendment,
FY 21 Budget Discussion with Board of Supervisors
October 1, 2019

Agenda• Review FY 19, FY 20, FY 21
1. Strategic Plan Highlights2. Revenue / Expenditure FY 19 Summary and
Analysis3. Fund Balance Discussion 4. FY 20 and 21 notable items

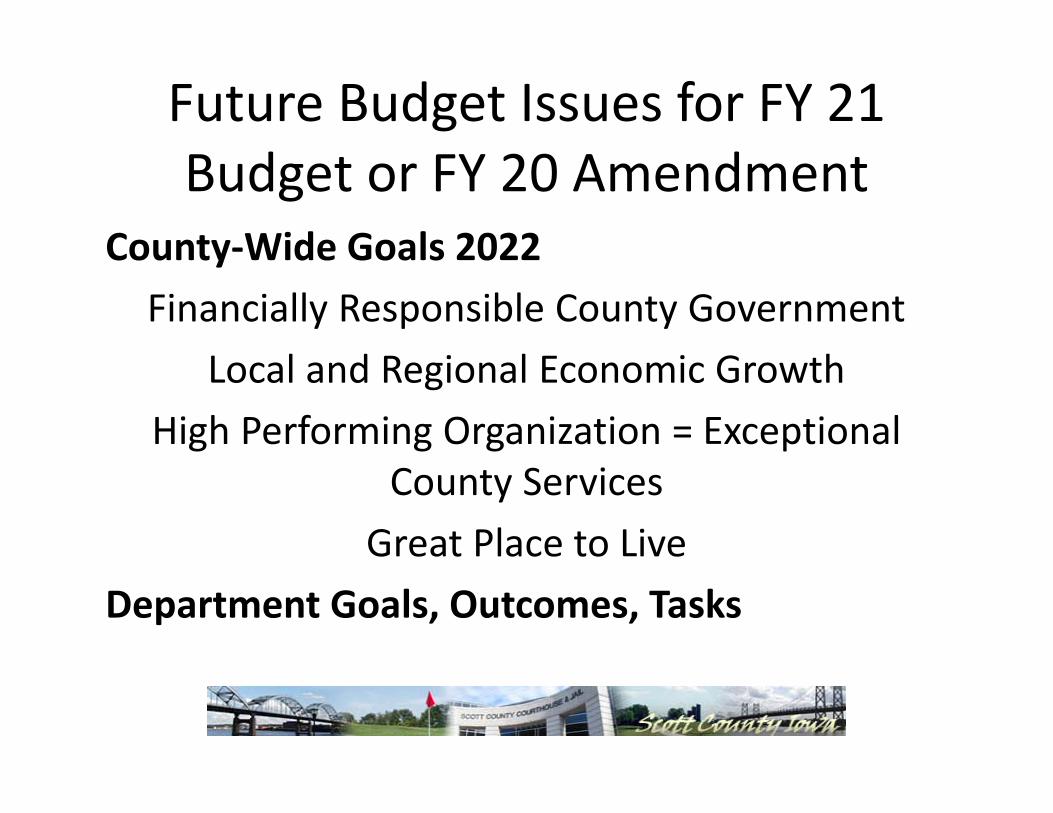
Future Budget Issues for FY 21 Budget or FY 20 Amendment
Mission:Scott County Government
Is dedicated to Protecting, Strengthening and Enriching
Our Community by delivering Quality Services and
Providing Leadership with P.R.I.D.E

Future Budget Issues for FY 21 Budget or FY 20 Amendment
Vision 2032Scott County is a GREAT PLACE TO LIVE and a
GREAT Place for BUSINESSScott County 2032 is a SAFE COMMUNITY, a HEALTHY COMMUNITY, and a LIVEABLE
COMMUNITY FOR ALL
Future Budget Issues for FY 21 Budget or FY 20 Amendment
County‐Wide Goals 2022Financially Responsible County Government
Local and Regional Economic GrowthHigh Performing Organization = Exceptional
County ServicesGreat Place to Live
Department Goals, Outcomes, Tasks
Future Budget Issues for FY 20 Amendment
FY 20 Amendment:
Mental Health services Capital requests
Organization changes Local Option Sales Tax
Inflation Jail / Juvenile population / service adjustments
Strategic Plan Efforts Unfunded mandates
Backfill dollars from state Conservation services / revenues

FY 19 Revenue Analysis –All Governmental Funds
Change from Prior Year
Change from Original Budget
Property Tax and Penalties $ 2,862,829 $ (45,028)
Other Taxes / TIF 88,761 (295,631)
Intergovernmental (507,037) (105,655)
Licenses and Permits 36,501 22,777
Charges for Services (212,344) (92,163)
Use of Property and Money 651,445 582,143
Fines, Forfeitures and Misc. 91,696 428,973
Subtotal 3,011,851 495,416
Other Financing Sources 1,911,019 1,428,665
Total Revenue Increase $ 4,922,870 $ 1,924,081

General Fund SummaryOriginal Budget Amended Budget Actual
Revenues $61,941,572 $62,473,324 $62,407,135
Expenditures (57,977,442) (59,624,126) (56,771,147)
Net Transfers and other sources / uses
(4,333,830) (6,283,384) (6,089,724)
Change (369,700) (3,434,186) (453,737)
Beginning Fund Balance
12,856,392 14,034,487 14,064,211
Ending Fund Balance
$12,486,692 $ 10,600,301 $13,580,751
Revenues were $66,189 under budget, or 99.9% of Amended Budget. Expenditures were $2,852,979 under budget, or 95.2% of Amended Budget.

FY 19 Revenue Analysis –General Fund
Change from PriorChange from Original
Budget
Property Tax $ 1,954,697 $ (25,061)
Other Taxes / TIF 68,771 (305,030)
Intergovernmental (209,974) 490,267
Licenses and Permits 38,754 (12,808)
Charges for Services (361,537) (108,116)
Use of Property and Money 436,415 164,592
Fines, Forfeitures and Misc. 92,878 261,718
Total Revenue Increase $ 2,020,004 $ 465,562

FY 19 – Salary and Benefit Detail Analysis – General Fund
Object Dollar Variance from Original Budget
Dollar Variance from Amended
Budget
Salaries $ 368,750 $ 705,343
Taxes / Retirement / Bonus / Other 194,970 291,787
Health Benefits 201,680 252,296
Personnel Services $ 765,400 $ 1,249,426
3.36% savings of amended budget classifications
Recommended to move $100,000 to Health Fund to fund future claims or design changes.

FY 19 – Significant General Fund Budget Variances
ObjectDollar Variance from Original
Dollar Variance from Amended
% Budget Savings
Classification
Line Items Under $100,000Savings (68 / 66 Accounts‐ $9,267 / $12,998 average per account) $ 630,160 $ 857,906 3.82%Contingency 205,000 ‐
Maintenance ‐ 121,847
Kitchen Supplies ‐ 129,163
Professional Services 336,307 324,087
Extradition of Prisoners (268,772) ‐
Service Contracts (347,838) 104,777
Utilities ‐ 100,362
Liability Claims (104,198) 109,986
Contribution to Agencies 135,312 ‐
Commissary Inmate Surcharge (128,777) (128,777)
Subtotal $ 457,194 $1,619,351 7.25%
All Departments20 G/L Accounts over
budget12 G/L Accounts over
budget

Unrestricted / Unassigned General Fund Balance
Unrestricted / Unassigned Fund
Balance GF Expenditures % of ExpendituresFY09 $5,956,480 $44,638,584 13.3%FY10 $7,618,061 $42,743,169 17.8%FY11 $9,247,282 $50,231,644 18.4%FY12 $9,477,799 $50,424,989 18.8%FY13 $10,041,990 $50,556,803 19.9%FY14 $9,832,639 $49,324,036 19.9%FY15 $10,098,835 $50,502,192 20.0%FY16 $10,212,287 $51,202,838 19.9%FY17 $10,474,822 $52,370,585 20.0%FY18 $10,821,990 $54,144,143 20.0%FY19 w/o Assign. $12,815,986 $56,771,147 22.6%FY19 w/ Assignments $11,354,229 $56,771,147 20.0%FY20 Budget $10,014,586 $61,029,067 16.4%FY20 Estimate $11,354,301 $61,029,067 18.6%FY21 Projection ?

General Fund Balance Components
Account 2019 Amount 2019 % 2018 Amount 2018 %
Restricted 637,475 4.69% 771,661 5.50%
Nonspendable 127,289 0.94% 187,308 1.33%
Assigned 1,461,757 10.76% 2,253,528 16.06%
Unassigned 11,354,229 83.61% 10,821,677 77.11%
Total $ 13,580,750 100.00% $ 14,034,487 100.00%
Any change in restricted equity is recommended to be offset by assigned fund balance.

Assignment of Fund Balance
• Strategic Planning Elements: Lead Abatement Project; Emergency Operations / Continuity of Operations Study, Park View study
Account 2019 AmountLiability Claims $ 281,685 Strategic Plan Elements 220,000Health Insurance 100,000Capital Projects 860,072
Total $ 1,461,757

Mental Health Funding
• SF 504 and HF2456 placed numerous restrictions and goals on the County and the Region. – 40% Fund Balance for Region and individual counties by 2022
– Numerous new Core Services / Child Services– If over funded the cash flow reduction will be deducted from maximum levy in 2024
– Now required to budget transfers to fiscal agent.

Mental Health FundingFY 2019 FY 2020 FY 2021
Tax Levy Revenue Capacity
$4,112,052 $5,308,750 $5,308,750*
Scott County Expenditures (no transfer)
$4,751,974 $4,144,015 $4,456,470*
Allocated Expenditures
$7,223,954 $6,425,615 $6,167,670*
FY 19 Actual FY 20 Revised Estimate
FY 19 YTD (8/31)
County Fund Balance
$531,297 $1,335,679 $731,270
Allocated Fund Balance 32.4% ownership
$464,655 $142,435* $459,606
Fund Balance % 14% 20%* 19%* Estimated

Capital Fund• Capital Funds Equity
• Variance due to project savings (actual); set asides for progress as of Budget Amendment February 2019, WLP Grant / Under expenditure; interest income / sale of assets
FY 19 Projected FY 19 Actual
General CIP $5,337,852 $6,237,862
Vehicle 419,774 552,609
Conservation CIP 1,463,101 1,753,550
Conservation Equipment 553,997 701,545
Total $7,774,704 $9,245,566

FY20 URBAN AREAS TAX LEVY RATEFOR THE EIGHT LARGEST METROPOLITAN IOWA COUNTIES
While ranking 3rd in size Scott County ranks 4th LOWEST among the eight largest metropolitan Iowa Counties in the urban areas tax levy rate amount for FiscalYear FY20.
STORY (7th)
LINN (2nd)
DUBUQUE (8th)
*** SCOTT (3rd) ***
BLACKHAWK (5th)
JOHNSON (4th)
WOODBURY (6th)
POLK (1st)
5.13
5.84
5.94
5.99
6.30
6.49
7.23
7.31
COUNTY (population size ranking in brackets)
URBAN AREAS LEVY RATE

FY20 RURAL AREAS TAX LEVY RATEFOR THE EIGHT LARGEST METROPOLITAN IOWA COUNTIES
While ranking 3rd in size Scott County ranks the 3rd lowest levy among the eight largest metropolitan Iowa Counties in the rural areas tax levy rate amount for Fiscal Year FY20.
STORY (7th)
LINN (2nd)
*** SCOTT (3rd) ***
DUBUQUE (8th)
WOODBURY (6th)
BLACKHAWK (5th)
JOHNSON (4th)
POLK (1st)
8.37
8.55
8.91
9.60
9.73
9.88
10.18
11.86
COUNTY (population size ranking in brackets)
RURAL AREAS LEVY RATE

FY19 COUNTY PROPERTY TAX AMOUNT PER CAPITAFOR THE EIGHT LARGEST METROPOLITAN IOWA COUNTIES
While ranking 3rd in size Scott County ranks 5th LOWEST among the eight largest metropolitan Iowa Counties in the County property tax per capita amount for FiscalYear FY19. These figures are based on 2017 est. census data.
BLACK HAWK (5th)
STORY (7th)
LINN (2nd)
WOODBURY (6th)
****SCOTT (3rd)****
DUBUQUE (8th)
POLK (1st)
JOHNSON (4th)
$286
$288
$305
$311
$324
$352
$382
$412
COUNTY (population size ranking in brackets)
COUNTY PROPERTY TAX AMOUNT PER CAPITA

FY20 COUNTY PROPERTY TAX AMOUNT PER CAPITAWHERE SCOTT COUNTY RANKS AMONG ALL 99 COUNTIES
Scott County has the 10TH LOWEST county property tax amount per capita of allninety-nine Iowa counties for Fiscal Year FY20.
WAPELLO (99th)
BLACK HAWK (98th)
STORY (97th)
LINN (96th)
BOONE (95th)
WOODBURY (94th)
DALLAS (93rd)
SIOUX (92nd)
MARSHALL (91st)
*** SCOTT *** (90th)
STATEWIDE…
PALO ALTO (5th)
AUDUBON (4th)
FREEMONT (3rd)
POCAHONTAS (2nd)
ADAMS (1st)
$272
$286
$287
$305
$306
$311
$313
$316
$317
$324
$522
$796
$799
$838
$1,017
$1,093
COUNTY (per capita ranking in brackets)
COUNTY PROPERTY TAX AMOUNT PER CAPITA

INTEREST INCOMETEN YEAR COMPARISON and FY18 BUDGET AMOUNT
This graph shows the wild ride of interest rates' impact on investment earnings by the County during the last ten years. Currently rates were at almost zero, but climbing. The FY29 weighted rate was 2.1480%
$0
$100,000
$200,000
$300,000
$400,000
$500,000
$600,000
$700,000
$800,000
$900,000
FY10
FY11
FY12
FY13
FY14
FY15
FY16
FY17
FY18
FY19
FY20
…
$160,348
$198,421 $145,478
$99,981 $94,698
$69,430 $77,432
$95,093
$394,337
$893,994
$610,000

SALES TAXTEN YEAR COMPARISON and FY19 BUDGET AMOUNT
Sales Tax is used for property tax relief. This revenue source is different from others, as we experienced the highest level for this revenue in 10 years in FY 17, however, The internet sales tax has added new growth to the tax relief.
$3,600,000
$3,800,000
$4,000,000
$4,200,000
$4,400,000
$4,600,000
$4,800,000
FY12
FY13
FY14
FY15
FY16
FY17
FY18
FY19
FY20
Bud
get
FY20
Sta
teEs
tam
ate
$4,052,754
$4,098,552
$4,268,291
$4,403,167
$4,390,604
$4,786,393
$4,404,685 $4,455,941
$4,600,000
$4,751,817

Upcoming
• Next meeting – 10/15/18 – 8:00 Committee of the Whole– Identification of Other Board Goals– Identification of Departmental Budget Guidelines– Budget Schedule