Embed Size (px)
DESCRIPTION
Fx weekly updates
Citation preview

© 2013 Citibank Citibank and Arc Design is a registered service mark of Citibank, N.A. or Citigroup Inc. Citibank (Hong Kong) Limited
Weekly FX Insight
Weekly FX InsightCitibank Wealth Management
Market Review & FocusP. 1 - 4
FX AnalysisP. 5 - 11
FX & Eco. Figures ForecastP. 12 - 16
March 21, 2016with data as of Mar 18, 2016
Please note and carefully read theImportant Disclosure on the last part
*INVESTMENT PRODUCTS: NOT A BANK DEPOSIT. NOT GOVERNMENT INSURED. NO BANK GUARANTEE. MAY LOSE VALUE

1
Weekly FX RecapPlease note and carefully read the Important Disclosure on the last part
Major Currencies Weekly Performance Weekly changes versus US dollar
Source: Bloomberg L.P., as of Mar 18, 2016 Source: Bloomberg L.P., as of Mar 18, 2016USD plunged as the Fed did not raise rate and cut the median forecast of the federal funds rate with a dovish policy statement. The dollar index dropped 1.1% to close at 95.09 last week. USD outlook: The dollar index may test lower to 94.33.
USD
JPY
NZD rose as NZ 4Q15 GDP grew 0.9% QoQ, better than expected. NZD/USD rose 0.8% to close at 0.6804 last week. NZD outlook: NZD/USD may range trade between 0.6576-0.6897, with upside bias.NZD
Gold price advanced as USD weakened and ECB's negative interest rate policy prompted corporations to change cash into gold. Spot gold/USD rose 0.4% to close at $1,255.32 / ounce last week. Gold outlook: Spot gold/USD may test higher to $1,285-$1,308 gradually.
Gold
USD/JPY breached a support of 112.16 as USD plunged and market expected the BOJ may not further ease policy in the short term. USD/JPY dropped 2.1% to close at 111.55. JPY outlook: USD/JPY may range trade between 110.39-114.87.
RMB rebounded as the PBOC cut USD/CNY mid-price significantly last week. USD/CNY dropped 0.4% to close at 6.4716 while USD/CNH dropped 0.4% to close at 6.4645. CNH outlook: USD/CNH may range trade between 6.4227-6.5139.RMB
CCY
LAST WEEK PERFORMANCE 52 week high
52 week low
1 year % change
Year-To-Date
ChangeClose Price Day High Day Low
USD 95.09 97.06 94.58 100.51 92.62 -3.5% -3.6%
EUR/USD 1.1270 1.1342 1.1058 1.1714 1.0521 3.7% 3.8%
USD/JPY 111.55 114.14 110.67 125.86 110.67 -7.1% -7.2%
GBP/USD 1.4476 1.4514 1.4053 1.5930 1.3836 -3.4% -1.8%
USD/CAD 1.3004 1.3405 1.2924 1.4690 1.1920 3.5% -6.0%
AUD/USD 0.7608 0.7680 0.7415 0.8164 0.6827 -2.1% 4.4%
NZD/USD 0.6804 0.6874 0.6576 0.7744 0.6130 -9.1% -0.4%
USD/CHF 0.9695 0.9914 0.9651 1.0328 0.9072 -0.9% -3.3%
USD/CNY 6.4716 6.5261 6.4598 6.5962 6.1887 3.9% -0.3%
USD/CNH 6.4645 6.5255 6.4443 6.7618 6.1863 3.8% -1.7%
GOLD 1255.32 1271.02 1225.65 1285.18 1046.43 7.5% 18.3%
-1.13%1.02%
2.05%0.65%
1.61%0.57%
0.81%1.31%
0.36%0.39%0.37%
-2.50% -1.50% -0.50% 0.50% 1.50% 2.50%
USD INDEXEURJPYGBPCADAUDNZDCHFCNYCNH
GOLD

Latest FX Forecasts:USD downside risk may increase
2
Please note and carefully read the Important Disclosure on the last part
USD may have downside pressure in the short term as theFOMC's monetary policy stance remained dovish. However,in the medium term, funds may flow back into USD on risk-aversion if global economy slows significantly.• We revised down the dollar index 0-3 month and 6-12 month
forecasts to 94.33 and 96.50 respectively (Chart 1), mainlydue to two reasons:
• 1) Countries agreed not to use currency depreciation as amonetary policy tool in G20 meeting. The probability of majorcurrencies' significant depreciation decreases, which mayundermine USD.
• 2) Current US economy is not strong enough to allow the Fedto be very hawkish while it is also not weak enough to promptfunds to flow into USD on risk aversion. Both factors reducesUSD upside risk.
• In the medium term, historically, USD outperformed amid verystrong economy or significant economic slowdown. Fundsmay flow back to USD if global economy further weakens.Thus, USD may rise mildly against major currencies for thecoming 6-12 months.
• For EUR (Chart 2), Since the ECB seemed unwilling tofurther cut rates in the last meeting and several negativefactors may have been priced in, we revised up EUR 0-3month forecast to 1.14.
• For JPY, market sentiment on short selling JPY may reduceas countries agreed not to use currency depreciation as amonetary policy tool in G20 meeting. Thus, we revised downUSD/JPY 0-3 month forecast to 109.
• For AUD, we revised up 0-3 month and 6-12 month forecaststo 0.78 and 0.73 respectively as iron ore and copper pricesrose and AUD breached a range between 0.68-0.75.
Chart 1: Dollar Index – Daily Chart
Source: Bloomberg L.P., as of Mar 18, 2016
Source: Citi, forecasts as of Mar 18, 2016
0-3M 6-12MDollar Index 94.33 96.50EUR/USD 1.14 1.10GBP/USD 1.42 1.45USD/JPY 109 111USD/CHF 0.96 1.00AUD/USD 0.78 0.73NZD/USD 0.68 0.65USD/CAD 1.30 1.30USD/CNY 6.58 6.80
Chart 2: Citi Latest FX Forecasts
0-3 month forecast: 94.33
6-12 month forecast: 96.50

Neutral - EUR• EUR may range trade in the short term on a fall in USD as the Fed's policy stance
turned dovish
• EUR/USD may range trade between 1.0849-1.1376 (8.41-8.82)
3
Weekly FX Strategies
1.
2.
3.
Neutral - JPY• USD/JPY may range trade as the BOJ may not cut rates in the short term
• USD/JPY may range trade between 110.39-114.87 (70.25-67.51) in the short term
Bullish - AUD• AUD trend may become bullish amid rising prices of Australian major exports
• AUD/USD may range trade between 0.7496-0.7849 (5.81-6.09), with upside bias
Please note and carefully read the Important Disclosure on the last part

EUR/USD
4
EUR upside risk may increaseSince the ECB seemed unwilling to further cut rates inthe last meeting and several negative factors may havebeen priced in, we revised up EUR 0-3 month forecastto 1.14 (Chart).
(+) USD factor: Since the FOMC's monetary policy stanceremained dovish, we deferred the timing of the Fed's ratehike to June and we expect the Fed may not rate hikesmore than twice. USD may find downside pressure in theshort term, which may underpin EUR.
(+) Policy tool: The ECB did not talk down EUR in the lastmeeting as countries agreed not to use currencydepreciation as a monetary policy tool in G20 meeting.EUR may range trade between 1.05-1.15, with upside bias.
(-) EUR risk factor: The ECB expanded the monthly bondpurchase program by 20bn EUR and will purchasecorporate bonds, which may undermine EUR in the mediumterm.
Chart: EUR/USD – Daily Chart
Source: Bloomberg L.P., as of Mar 18, 2016
6-12 month forecast: 1.10
0-3 month forecast: 1.14

5
EUR/USDEUR/USD may range trade between 1.0849-1.1376 (8.41-8.82)
Market Recap: EUR rose amid USD weakness, as the
significant downgrade on 2016 Fed FundRate projection by the Fed cooled down theexpectation of US rate hikes.
EUR Outlook: EUR may be supported in the short term on a
fall in USD as external instability may slowdown US rate hikes.
However, ECB chief economist Praet said theECB may cut rates if needed, showing lowinflation and economic growth may promptthe ECB to further ease policy.
The ECB's TLTRO may inject 1.05 trillionEUR into markets. The ECB may cut itsbenchmark rate and marginal lending rate in3Q16 and may cut the deposit rate by 10bpsin March 2017, which may undermine EUR.
Technical Analysis: The pair may find resistance at 1.1376 (8.82)
and may range trade between 1.0849-1.1376(8.41-8.82).
The brackets are the exchange rates in terms of Hong Kong dollar, with HKD $7.7550 exchange rate for reference
Last Price Last wk High
Last wkLow
2nd Support
1st Support
1st Resistance
2nd Resistance
0-3m Forecast
6-12m Forecast
1.1270 (8.74)
1.1342 (8.80)
1.1058 (8.58)
1.0725 (8.32)
1.0849 (8.41)
1.1376 (8.82)
1.1495 (8.91)
1.14 (8.84)
1.10 (8.53)
Upcoming Economic Data
Mar 24: Manufacturing PMI
Please note and carefully read theImportant Disclosure on the last part
Source: Bloomberg L.P., as of Mar 18, 2016
1.0725-1.0849 (fibo 0.764 & 0.618)
1.1376 (Feb top)
1.1495 (Last Oct top)

USD/JPY
6
JPY may be underpinned amid reducing willingness onshort JPYMarket intention to short JPY may be reduced ascountries agreed not to use currency depreciation as amonetary policy tool in G20 meeting. Thus, we reviseddown USD/JPY 0-3 month forecast to 109 (Chart).
(-) Falling market intention to short sell JPY: Countriesagreed not to use currency depreciation as a monetarypolicy tool in G20 meeting. In addition, Japan's officialswere concerned about JPY depreciation in mid-2015, whichmay reduce market intention to short sell JPY.
(-) USD factor: Since the FOMC's monetary policy stanceremained dovish, we deferred the timing of the Fed's ratehike to June and we expect the Fed may not rate hikesmore than twice. USD may find downside pressure in theshort term, which may underpin JPY.
(+) US-Japan monetary policy divergence: In our view,the BOJ may cut rates in July while the Fed may hike rates.US-Japan monetary policy divergence may restrain JPY.
Chart: USD/JPY – Daily Chart
Source: Bloomberg L.P., as of Mar 18, 2016
6-12 month forecast : 111
0-3 month forecast: 109

7
USD/JPYUSD/JPY may range trade between 110.39-114.87(70.25-67.51)
Market Recap: JPY was supported on fund inflows due to a
drop in Japanese equity and a fall in USD asthe Fed cut 2016 median forecast ofbenchmark interest rate.JPY Outlook:
JPY may be supported in the short term amidimproved global investment sentiment andexpectation that the BOJ may not expand QEin the short term.
Although negative interest rate policy mayaffect Japanese consumption confidence,corporations may gradually announce salaryadjustment result. Average gain may rangefrom 0.4% to 0.5% only, lower than last year's0.7%, which may not be able to push upservices inflation. Thus, the BOJ may need tocut rates again.
The BOJ may cut the interest rate by 20bpsto -0.3% in July, which may undermine JPY.Technical Analysis:
The pair rebounded after a brief breach of110.99 and may range trade between 110.39-114.87 (70.25-67.51).
The brackets are the exchange rates in terms of Hong Kong dollar, with HKD $7.7550 exchange rate for reference
Last Price Last wk High
Last wkLow
2nd Support
1st Support
1st Resistance
2nd Resistance
0-3m Forecast
6-12m Forecast
111.55 (69.52)
114.14 (67.94)
110.67 (70.07)
106.73 (72.66)
110.39 (70.25)
114.87(67.51)
115.98(66.86)
109 (71.15)
111 (69.86)
Upcoming Economic Data
Mar 25: Core CPI (YoY)
Please note and carefully read theImportant Disclosure on the last part
Source: Bloomberg L.P., as of Mar 18, 2016
110.39 (fibo 0.618) 110.99 (Feb low)
106.73 (fibo 0.764)
114.87 (Feb 16 top)
AUD/USD
8
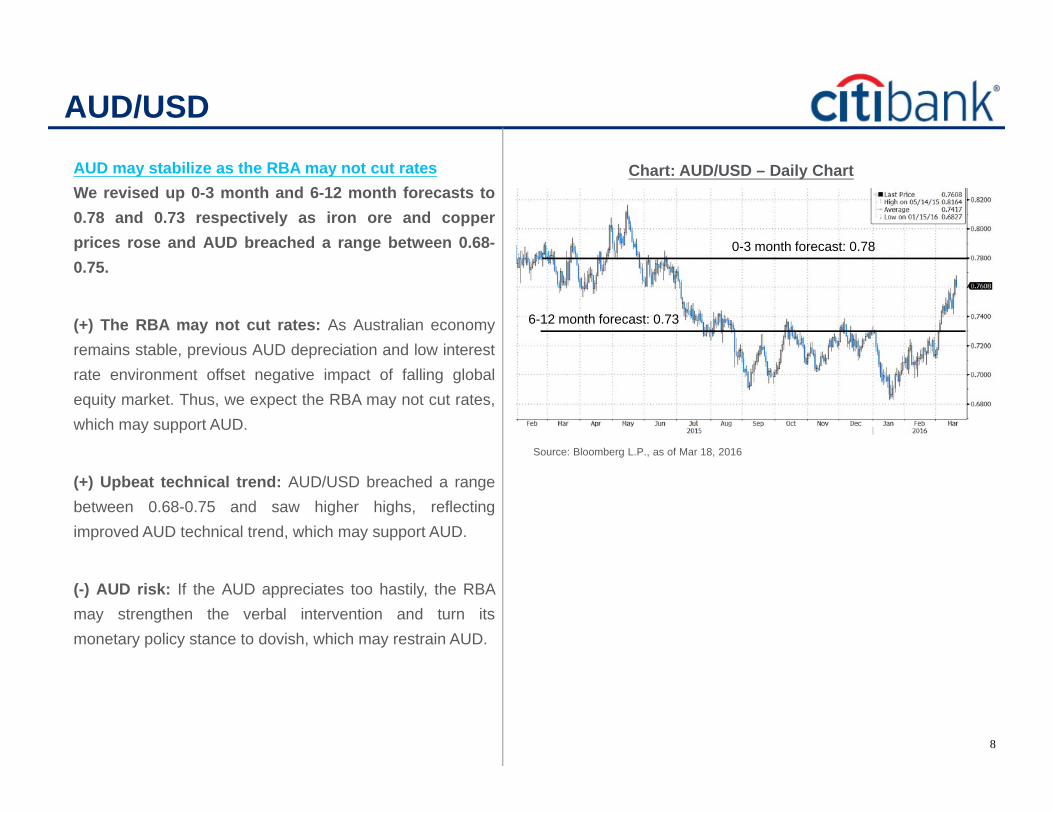
AUD may stabilize as the RBA may not cut ratesWe revised up 0-3 month and 6-12 month forecasts to0.78 and 0.73 respectively as iron ore and copperprices rose and AUD breached a range between 0.68-0.75.
(+) The RBA may not cut rates: As Australian economyremains stable, previous AUD depreciation and low interestrate environment offset negative impact of falling globalequity market. Thus, we expect the RBA may not cut rates,which may support AUD.
(+) Upbeat technical trend: AUD/USD breached a rangebetween 0.68-0.75 and saw higher highs, reflectingimproved AUD technical trend, which may support AUD.
(-) AUD risk: If the AUD appreciates too hastily, the RBAmay strengthen the verbal intervention and turn itsmonetary policy stance to dovish, which may restrain AUD.
Chart: AUD/USD – Daily Chart
Source: Bloomberg L.P., as of Mar 18, 2016
6-12 month forecast: 0.73
0-3 month forecast: 0.78

9
AUD/USDAUD/USD may range trade between 0.7496-0.7849 (5.81-6.09)
Market Recap: AUD rose last week amid improved sentiment
,a fall in USD, and Australian unemploymentrate dropped from 6.0% to 5.8% in February,cooling expectation of rate cuts by the RBA.
AUD Outlook: In our view, Australian economy may not be
impacted by external weakness. Australianemployment rate stayed at 5.9% over the last6 months, reflecting an improved job market.
Recent rebound in iron ore and copper pricesmay improve Australian export income. Thus,we expect the RBA is unlikely to cut rates,which may underpin AUD.
Once AUD accumulates a certain amount ofgains, the RBA may intervene into theexchange rate, which may restrain AUD.
Technical Analysis: AUD/USD may range trade between 0.7496-
0.7849 (5.81-6.09), with upside bias.
The brackets are the exchange rates in terms of Hong Kong dollar, with HKD $7.7550 exchange rate for reference
Last Price Last wk High
Last wkLow
2nd Support
1st Support
1st Resistance
2nd Resistance
0-3m Forecast
6-12m Forecast
0.7608 (5.90)
0.7680 (5.96)
0.7415 (5.75)
0.7385(5.73)
0.7496 (5.81)
0.7849 (6.09)
0.7938 (6.16)
0.78 (6.05)
0.73 (5.66)
Upcoming Economic Data
No Important Economic data
Please note and carefully read theImportant Disclosure on the last part
Source: Bloomberg L.P., as of Mar 18, 2016
0.7385 (Last Dec top)
0.7849 (fibo 0.764)
0.7496 (fibo 0.50)
NZD/USD
10
Source: Bloomberg L.P., as of Mar 18, 2016
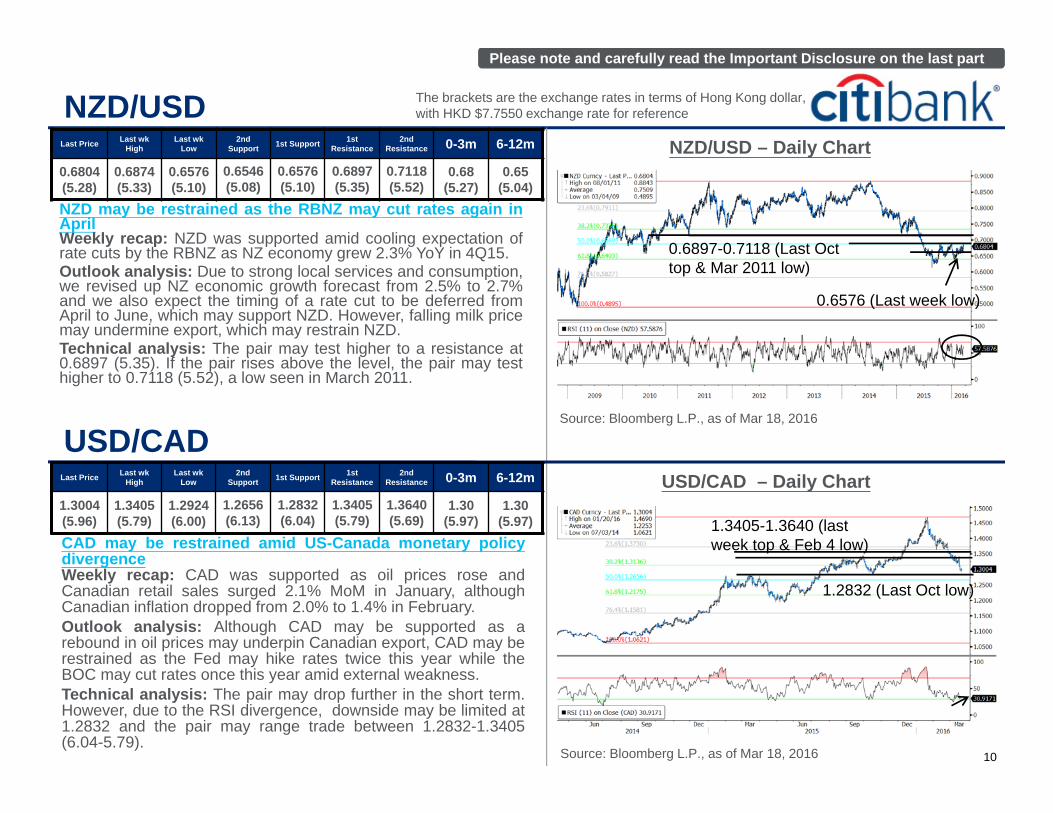
CAD may be restrained amid US-Canada monetary policydivergenceWeekly recap: CAD was supported as oil prices rose andCanadian retail sales surged 2.1% MoM in January, althoughCanadian inflation dropped from 2.0% to 1.4% in February.Outlook analysis: Although CAD may be supported as arebound in oil prices may underpin Canadian export, CAD may berestrained as the Fed may hike rates twice this year while theBOC may cut rates once this year amid external weakness.Technical analysis: The pair may drop further in the short term.However, due to the RSI divergence, downside may be limited at1.2832 and the pair may range trade between 1.2832-1.3405(6.04-5.79).
USD/CADUSD/CAD – Daily Chart
Source: Bloomberg L.P., as of Mar 18, 2016
NZD may be restrained as the RBNZ may cut rates again inAprilWeekly recap: NZD was supported amid cooling expectation ofrate cuts by the RBNZ as NZ economy grew 2.3% YoY in 4Q15.Outlook analysis: Due to strong local services and consumption,we revised up NZ economic growth forecast from 2.5% to 2.7%and we also expect the timing of a rate cut to be deferred fromApril to June, which may support NZD. However, falling milk pricemay undermine export, which may restrain NZD.Technical analysis: The pair may test higher to a resistance at0.6897 (5.35). If the pair rises above the level, the pair may testhigher to 0.7118 (5.52), a low seen in March 2011.
Last Price Last wk High
Last wkLow
2nd Support 1st Support 1st
Resistance2nd
Resistance 0-3m 6-12m
0.6804 (5.28)
0.6874 (5.33)
0.6576 (5.10)
0.6546(5.08)
0.6576(5.10)
0.6897(5.35)
0.7118(5.52)
0.68(5.27)
0.65(5.04)
The brackets are the exchange rates in terms of Hong Kong dollar, with HKD $7.7550 exchange rate for reference
NZD/USD – Daily Chart
Please note and carefully read the Important Disclosure on the last part
Last Price Last wk High
Last wkLow
2nd Support 1st Support 1st
Resistance2nd
Resistance 0-3m 6-12m
1.3004 (5.96)
1.3405 (5.79)
1.2924 (6.00)
1.2656(6.13)
1.2832(6.04)
1.3405(5.79)
1.3640 (5.69)
1.30(5.97)
1.30(5.97)
0.6897-0.7118 (Last Oct top & Mar 2011 low)
0.6576 (Last week low)
1.2832 (Last Oct low)
1.3405-1.3640 (last week top & Feb 4 low)

GBP/USD
11
Source: Bloomberg L.P., as of Mar 18, 2016
CNH may be undermined in the medium and long term as thePBOC may further ease policyWeekly recap: CNH rose amid cooling expectation of expansionof policy easing by the PBOC as China's inflation rose from 1.8%YoY to 2.3% YoY in February.Outlook analysis: In the short term, the PBOC may continue tointervene into FX market and slow down fund outflows in order toregain market confidence, which may make CNH consolidate first.However, in the medium and long term, the PBOC may allowCNH to depreciate by a certain degree as China's fundamentalsremain weak and fund outflows continue.Technical analysis: As the RSI is near oversold levels, the pairmay be restrained at resistance levels of 1.4578-1.4668 and mayrange trade between 1.4053-1.4668 (10.90-11.38).
USD/CNHUSD/CNH – Daily Chart
Source: Bloomberg L.P., as of Mar 18, 2016
GBP may be restrained due to potential risk of BrexitreferendumWeekly recap: GBP rebounded from lows as the BOE's policystatement remained neutral, although GBP once dropped amidconcern about Brexit.Outlook analysis: The probability of Brexit is around 30-40%.Short-term Brexit risk may restrain GBP. However, in the mediumand long term, consumption and construction continue to supporteconomic growth while a rebound in oil prices also supportstabilization of inflation. The BOE may hike rates in 2017, whichmay support GBP.Technical analysis: As the RSI is near overbought levels, thepair may restrained at resistance levels of 1.4578-1.4668 andmay range trade between 1.4053-1.4668 (10.90-11.38).
Last Price Last wk High
Last wkLow
2nd Support 1st Support 1st
Resistance2nd
Resistance 0-3m 6-12m
1.4476 (11.23)
1.4514 (11.26)
1.4053 (10.90)
1.4053(10.90)
1.4166(10.99)
1.4578(11.31)
1.4668(11.38)
1.42(11.01)
1.45(11.24)
The brackets are the exchange rates in terms of Hong Kong dollar, with HKD $7.7550 exchange rate for reference
GBP/USD – Daily Chart
Please note and carefully read the Important Disclosure on the last part
Last Price Last wk High Last wk Low 2nd Support 1st Support 1st Resistance 2nd Resistance
6.4645(1.1996)
6.5255(1.1884)
6.4443(1.2034)
6.4161(1.2087)
6.4227(1.2074)
6.5139(1.1905)
6.5604(1.1821)
1.4053-1.4166 (Last week low & 20MA)
1.4578-1.4668(Feb 10 & 4 tops)
6.4161-6.4227 (Nov 30, 2015 low & 200MA)
6.5139-6.5604 (20MA & Jan low)

12
Upcoming Economic Figures and EventsUS economic data may become a market focus
4Q15 GDP (Final)We will receive the third revision to Q4 GDP (3/25), expected to remain unchanged
at 1.0%. USD may remain weak.
Mar 25 (Fri):GDP
Citi forecast Previous1.00% 1.00%
U.S.
Euro Area
Mar 24 (Thu):Manufacturing PMI
Citi forecast Previous51.3 51.2
March Manufacturing PMIWe expect manufacturing PMI to edge up 0.1%, the first rise over the past three
months. However, average of Q1 may drop 0.9% to 53.2, a five-quarter low.
JapanMar 25 (Fri):
Core CPI (YoY%) Citi forecast Previous
0.10% 0.00%
February Core CPI (YoY)We estimate that the nationwide core CPI (the CPI excluding fresh food) climbed
0.1% YoY in February after no change (0.0% YoY) in January. We estimate a 10% rise in the yen versus the dollar would push down the core CPI by around 0.6%. In this situation, we expect the Core CPI to start slowing noticeably going forward.
Please note and carefully read the Important Disclosure on the last part
U.K.Mar 22 (Tue):CPI (YoY%)
Citi forecast Previous0.40% 0.30%
February CPIAlthough oil prices dropped earlier, inflation yearly growth may rebound due to
the base effect. Inflation yearly growth may reach the highest level since end-2014. Inflation may further rise for the coming months.

0-3 month 6-12 month 3/18/16 1Q ’16 2Q ’16 3Q ’16Dollar Index 94.33 96.50 0.50 0.50 0.75 0.75
EUR/USD 1.14 1.10 -0.40 -0.40 -0.40 -0.50GBP/USD 1.42 1.45 0.50 0.50 0.50 0.50USD/JPY 109 111 -0.10 -0.10 -0.10 -0.30USD/CHF 0.96 1.00 -0.75 -0.75 -0.75 -0.75AUD/USD 0.78 0.73 2.00 2.00 2.00 2.00NZD/USD 0.68 0.65 2.25 2.25 2.00 2.00USD/CAD 1.30 1.30 0.50 0.50 0.50 0.50USD/CNY 6.58 6.80 1.50 1.50 1.25 1.00
Market sentiment on short selling JPY may reduce as countries agreed not to use currency depreciation as amonetary policy tool in G20 meeting. Thus, we revised down USD/JPY 0-3 month forecast to 109.
AUD
JPY
We revised up 0-3 month and 6-12 month forecasts to 0.78 and 0.73 respectively as iron ore price and copperprice rose and AUD breached a range between 0.68-0.75.
Since the ECB seemed unwilling to further cut rates in the last meeting and several negative factors may havebeen priced in, we revised up EUR 0-3 month forecast to 1.14EUR
13
Appendix 1: Citi Interest Rate and FX Forecast for 2016
Citi FX Outlook Forecast Citi FX Interest Rate Forecast
Source: Citi, forecast as of Mar 18, 2016 Forecast downgraded
Forecast upgraded
GBP may remain weak before Brexit referendum held on Jun 23. However, in our view, Brexit is unlikely and GBPmay gradually recover. Thus, we revised up GBP/USD 0-3 month and 6-12 month forecasts to 1.42 and 1.45.GBP
CNH may be underpinned amid higher demand for the safe-haven currency due to market volatility. However, CHFupside may be limited as the SNB may further cut rates in 1Q 2016 and further intervene into the currency. Thus,we slightly revised down USD/CNH 0-3 month forecast to 0.96.
CHF
Rate cut expectations
Rate hike expectations
Please note and carefully read the Important Disclosure on the last part
14
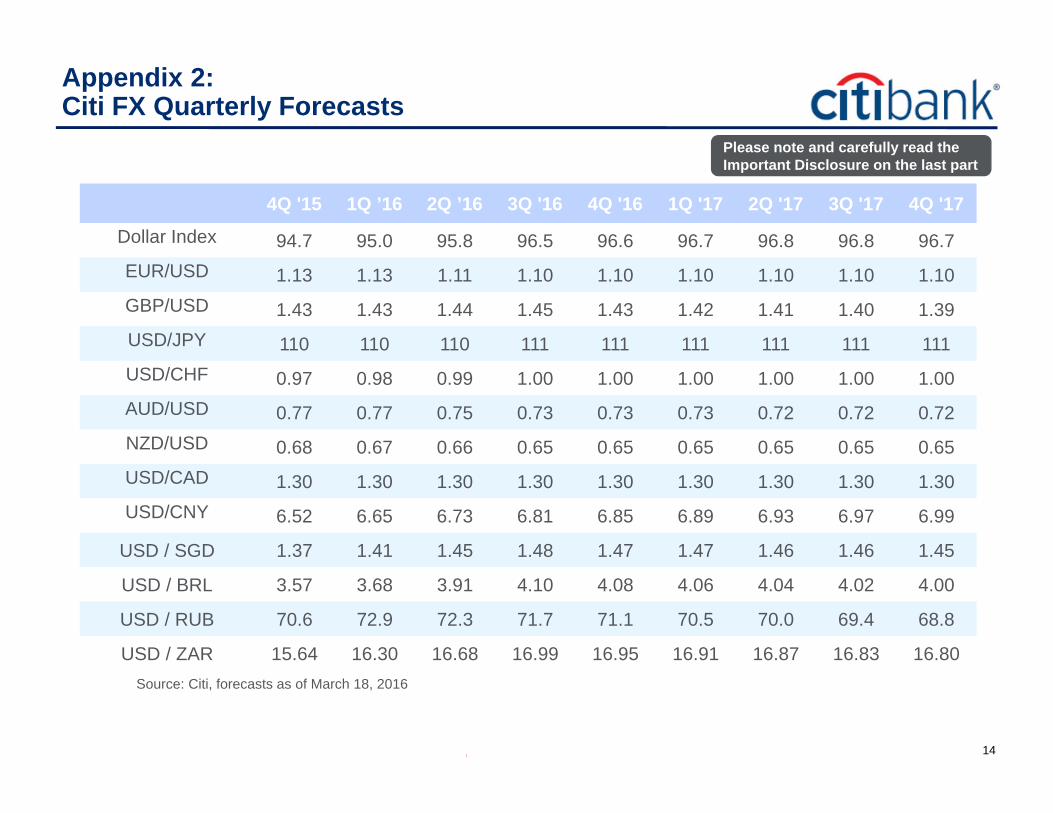
Appendix 2:Citi FX Quarterly Forecasts
Please note and carefully read theImportant Disclosure on the last part
4Q '15 1Q ’16 2Q ’16 3Q '16 4Q '16 1Q '17 2Q '17 3Q '17 4Q '17
Dollar Index 94.7 95.0 95.8 96.5 96.6 96.7 96.8 96.8 96.7EUR/USD 1.13 1.13 1.11 1.10 1.10 1.10 1.10 1.10 1.10GBP/USD 1.43 1.43 1.44 1.45 1.43 1.42 1.41 1.40 1.39USD/JPY 110 110 110 111 111 111 111 111 111USD/CHF 0.97 0.98 0.99 1.00 1.00 1.00 1.00 1.00 1.00AUD/USD 0.77 0.77 0.75 0.73 0.73 0.73 0.72 0.72 0.72NZD/USD 0.68 0.67 0.66 0.65 0.65 0.65 0.65 0.65 0.65USD/CAD 1.30 1.30 1.30 1.30 1.30 1.30 1.30 1.30 1.30USD/CNY 6.52 6.65 6.73 6.81 6.85 6.89 6.93 6.97 6.99
USD / SGD 1.37 1.41 1.45 1.48 1.47 1.47 1.46 1.46 1.45
USD / BRL 3.57 3.68 3.91 4.10 4.08 4.06 4.04 4.02 4.00
USD / RUB 70.6 72.9 72.3 71.7 71.1 70.5 70.0 69.4 68.8
USD / ZAR 15.64 16.30 16.68 16.99 16.95 16.91 16.87 16.83 16.80Source: Citi, forecasts as of March 18, 2016

15
Appendix 3:Last week’s Economic Figures
Source: Bloomberg L.P.
Please note and carefully read theImportant Disclosure on the last part
Time Importance Event Period Actual Survey Prior
Tuesday03/15/2016 JN !!! BOJ Policy Rate Mar -0.10% -0.10% -0.10%
03/15/2016 08:30 AU !! RBA March Meeting Minutes03/15/2016 20:30 US !! Retail Sales Advance MoM Feb -0.10% -0.20% -0.40%03/15/2016 20:30 US !! Retail Sales Ex Auto MoM Feb -0.10% -0.20% -0.40%03/15/2016 21:00 CA ! Existing Home Sales MoM Feb 0.80% -- 0.50%
Wednesday03/16/2016 04:00 US ! Total Net TIC Flows Jan $118.4b -- -$106.8b03/16/2016 17:30 UK !! Weekly Earnings ex Bonus 3M/YoY Jan 2.2% 2.10% 2.00%03/16/2016 17:30 UK !! ILO Unemployment Rate 3Mths Jan 5.10% 5.10% 5.10%03/16/2016 20:30 US !! Housing Starts MoM Feb 5.20% 4.60% -3.40%03/16/2016 20:30 US !! Building Permits MoM Feb -3.10% -0.20% 0.00%03/16/2016 20:30 US !! CPI YoY Feb 1.00% 0.90% 1.40%03/16/2016 20:30 US !! CPI Ex Food and Energy YoY Feb 2.30% 2.20% 2.20%03/16/2016 21:15 US !! Industrial Production MoM Feb -0.50% -0.20% 0.80%
Thursday03/17/2016 02:00 US !!! FOMC Rate Decision (Upper Bound) Mar 0.50% 0.50% 0.50%03/17/2016 05:45 NZ !! GDP SA QoQ 4Q 0.90% 0.70% 0.90%03/17/2016 08:30 AU !! Employment Change Feb 0.3k 13.5k -7.4k03/17/2016 08:30 AU !! Unemployment Rate Feb 5.80% 6.00% 6.00%03/17/2016 18:00 EC !! CPI YoY Feb -0.20% -0.20% -0.20%03/17/2016 20:00 UK !! Bank of England Bank Rate Mar 0.50% 0.50% 0.50%03/17/2016 20:30 US !! Initial Jobless Claims Mar 265k 268k 258k
Friday03/18/2016 20:30 CA ! CPI YoY Feb 1.4% 1.40% 2.00%03/18/2016 20:30 CA ! CPI Core YoY Feb 1.90% 2.00% 2.00%03/18/2016 22:00 US !! U. of Mich. Sentiment Mar 90.0 92.2 91.7

16
Appendix 4:Upcoming Economic Figures (Mar 21, 2016 – Mar 25, 2016)
Source: Bloomberg L.P.
Please note and carefully read the Important Disclosure on the last part
Time Importance Event Period Actual Survey Prior
Euro Area03/24/2016 17:00 Thu !! Markit Eurozone Manufacturing PMI Mar -- 51.4 51.2
03/22/2016 17:00 Tue !! IFO Business Climate Mar -- 105.7 105.7
03/22/2016 18:00 Tue ! ZEW Survey Expectations Mar -- 5 1
Japan03/25/2016 07:30 Fri !! Natl CPI Ex Fresh Food YoY Feb -- 0.10% 0.00%
New Zealand03/21/2016 05:00 Mon ! Westpac Consumer Confidence 1Q -- -- 110.7
03/24/2016 05:45 Thu !! Trade Balance Feb -- 100m 8m
03/24/2016 05:45 Thu !! Exports Feb -- 4.03b 3.90b
03/24/2016 05:45 Thu !! Imports Feb -- 3.89b 3.89b
U.K.03/22/2016 17:30 Tue !! CPI YoY Feb -- 0.40% 0.30%
03/24/2016 17:30 Thu !! Retail Sales Ex Auto Fuel YoY Feb -- 3.40% 5.00%
03/24/2016 17:30 Thu !! Retail Sales Inc Auto Fuel YoY Feb -- 3.50% 5.20%
U.S.03/21/2016 22:00 Mon !! Existing Home Sales MoM Feb -- -2.90% 0.40%
03/23/2016 22:00 Wed !! New Home Sales MoM Feb -- 3.20% -9.20%
03/24/2016 20:30 Thu !! Initial Jobless Claims Mar -- -- 265k
03/24/2016 20:30 Thu !! Durable Goods Orders Feb -- -2.50% 4.70%
03/24/2016 20:30 Thu !! Durables Ex Transportation Feb -- -0.30% 1.70%
03/25/2016 20:30 Fri !!! GDP Annualized QoQ 4Q -- 1.00% 1.00%

17
Important Disclosure
“Citi analysts” refers to investment professionals within Citi Research (CR) and Citi Global Markets (CGM) and votingmembers of the Global Investment Committee of Global Wealth Management.Citibank N.A. and its affiliates / subsidiaries provide no independent research or analysis in the substance or preparation ofthis document. Investment products are not available to US persons and not all products and services are provided by allaffiliates or are available at all locations.This document is for general informational purposes only and is not intended as a recommendation or an offer orsolicitation for the purchase or sale of any security, currency, investment, service or to attract any funds or deposits.Information in this document has been prepared without taking account of the objectives, financial situation or needs of anyparticular investor. Therefore, investment products mentioned in this document may not be suitable for all investors. Anyperson considering an investment should seek independent advice on the suitability or otherwise of a particular investment.Before making any investment, each investor must obtain the investment offering materials, which include a description ofthe risks, fees and expenses and the performance history, if any, which may be considered in connection with making aninvestment decision. Each investor should carefully consider the risks associated with the investment and make adetermination based upon the investor’s own particular circumstances, that the investment is consistent with the investor’sinvestment objectivesIn any event, past performance is no guarantee of future results, and future results may not meet our expectations due to avariety of economic, market and other factors. Further, any projections of potential risk or return are illustrative and shouldnot be taken as limitations of the maximum possible loss or gain. Investments are not deposits or other obligations of,guaranteed or insured by Citibank N.A., Citigroup Inc., or any of their affiliates or subsidiaries, or by any local governmentor insurance agency, and are subject to investment risk, including the possible loss of the principal amount invested.Investors investing in funds denominated in non-local currency should be aware of the risk of exchange rate fluctuationsthat may cause a loss of principal.Neither Citigroup nor its affiliates can accept responsibility for the tax treatment of any investment product, whether or notthe investment is purchased by a trust or company administered by an affiliate of Citigroup. Citigroup assumes that, beforemaking any commitment to invest, the investor and (where applicable, its beneficial owners) have taken whatever tax, legalor other advice the investor/beneficial owners consider necessary and have arranged to account for any tax lawfully due onthe income or gains arising from any investment product provided by Citigroup. If an investor changes country ofresidence, citizenship, nationality, or place of work, it is his/her responsibility to understand how his/her investmenttransactions are affected by such change and comply with all applicable laws and regulations as and when such becomesapplicable.
18
Important Disclosure
Although information in this document has been obtained from sources believed to be reliable, Citigroup and its affiliates donot guarantee its accuracy or completeness and accept no liability for any direct or consequential losses arising from itsuse. Opinions expressed herein may differ from the opinions expressed by other businesses or affiliates of Citigroup, andare not intended to be a forecast of future events, a guarantee of future results or investment advice, and are subject tochange based on market and other conditions. The information contained herein is also not intended to be an exhaustivediscussion of the strategies or concepts.At any time, Citigroup companies may compensate affiliates and their representatives for providing products and servicesto clients.This is not an official statement of Citigroup Inc. and may not reflect all of your investments with or made through Citibank.For an accurate record of your accounts and transactions, please consult your official statement.If this document shows information coming from Citi Research, please refer to the attached link:https://www.citivelocity.com/cvr/eppublic/citi_research_disclosures , which contains the important disclosures regardingcompanies covered by Citi's Equity Research analysts, and please refer to the attached link:https://ir.citi.com/PuXs6xELNHAu7UqkjgvWxnihtUeLtAtDxeEh%2B2qaPpPb7uukpx8Qw1vzcuidtMtqgn1BWqJqak8%3Dfor details on the Citi Research ratings system.This document may not be reproduced or circulated without Citigroup written authority. The manner of circulation anddistribution may be restricted by law or regulation in certain countries. Persons who come into possession of this documentare required to inform themselves of, and to observe such restrictions. Any unauthorised use, duplication, or disclosure ofthis document is prohibited by law and may result in prosecution.This document is distributed in Hong Kong by Citibank (Hong Kong) Limited (“CHKL”). Prices and availability of financialinstruments can be subject to change without notice. Certain high-volatility investments can be subject to sudden and largefalls in value that could equal the amount invested.

19
Important Disclosure
Unrated or non investment grade Debt Securities typically offer a higher yield than investment grade Debt Securities, but also present greater risks with respect to liquidity, volatility, and non-payment of principal and interest. As a result of being classified as non investment grade Debt Securities, these Debt Securities present a greater degree of credit risk relative tomany other fixed income Debt Securities. Higher Credit Risk – Unrated or non investment grade Debt Securities generally have predominantly speculative characteristics with respect to the issuer’s capacity to pay interest and repay principal. There is greater risk of non-payment of interest and loss of principal. Many issuers of these Debt Securities have experienced substantial difficulties in servicing their debt obligations, which has led to default and restructurings. The issuers of these Debt Securities generally have to pay a higher rate of interest than investment grade Debt Securities. Higher Liquidity and Secondary Market Risk – The markets in which unrated or non investment grade Debt Securities are traded are generally more limited than those in which investment grade Debt Securities are traded. This lack of liquidity may make it more difficult to resell these Debt Securities and obtain market quotations.Downgrade Risk – Downgrades in the credit rating of unrated or non investment grade Debt Securities by rating agencies are generally accompanied by declines in the market value of these Debt Securities. In some circumstances, investors in the unrated or non investment grade Debt Securities market may anticipate such downgrades as a result of these credits being placed on “credit watch” by rating agencies, causing volatility and speculation of further credit deterioration. Higher Vulnerability to economic cycles - During economic downturns, unrated or non investment grade Debt Securities are typically more susceptible to price volatility and fall more in value than investment grade Debt Securities as i) investors may reevaluate holdings in lower-quality bonds in favor of investment-grade corporate Debt Securities; ii) investors become more risk averse; and iii) default risk rises. This is often referred to a “flight to quality”.Event Risk – This includes any of a variety of events that can adversely affect the issuer of unrated or non investment grade Debt Securities, and therefore the issuer’s ability to meet debt service obligations to repay principal and interest toDebt Securities holders. Event risk may pertain to the issuer specifically, the industry or business sector of the issuer, orgenerally upon the overall economy. It could have a direct or indirect impact on the issuer and their outstanding debts.

20
Important Disclosure
Risk relating to RMB – If you choose RMB as the base currency or the alternate currency, you should also note the following:
RMB is currently not freely convertible through banks in Hong Kong. Due to exchange controls and/or restrictions imposed on the convertibility, utilisation or transferability of RMB (if any) which in turn is affected by, amongst other things, the PRC government's control, there is no guarantee that disruption in the transferability, convertibility or liquidity of RMB will not occur. There is thus a likelihood that you may not be able to convert RMB received into other freely convertible currencies.
CNH exchange rates and CNY exchange rates are currently quoted in different markets with different exchange rates, whereby their exchange rate movements may not be in the same direction or magnitude. Therefore, the CNH exchange rate may be different from the CNY exchange rate.