Embed Size (px)
Citation preview

Technical Analysis Research
FX Emerging Markets Weekly TechnicalsTechnical Outlook
Monday, 02 December 2013
02 December 2013 1
Technical Outlook
Market Short term view (1-3 weeks)
EUR/PLN: Held in check by the 200 day ma
EUR/HUF: Severs the 2012-2013 downtrend
EUR/CZK: Allow for some consolidation at the 2006 low at 27.41 and the 61.8% Fibonacci level at 27.48
EUR/BRL: Bounces off last week’s 3.0405 low and targets the 78.6% Fibonacci retracement at 3.2003
USD/BRL: Remains bullish while trading above the 55 day ma
EUR/TRY: Under pinned the 2.6934/15 lows
USD/TRY: 6 month uptrend held on a closing basis, allow for upside probes towards the November high at 2.0609.
USD/MXN: Bounces off the seven month support line at 12.9180
USD/ZAR: Stablising above the 55 day ma at 10.0240
Rouble Basket: 4 year highs, targeting 39.00
Emerging Market currencies weaker versus the Euro and US Dollar
02 December 2013 2
EUR/PLN - Daily Chart
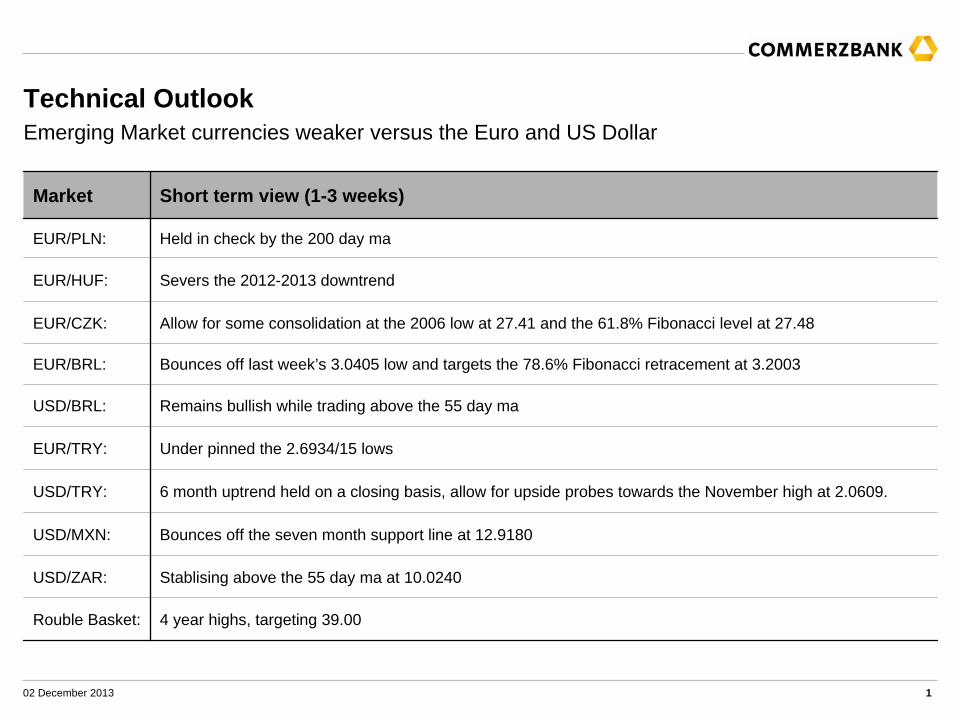
EUR/PLN Daily ChartHeld in check by the 200 day ma
EUR/PLN has reached and is stalling at the 200 day ma at 4.2070. It is essentially sidelined above the 78.6% Fibonacci retracement of the April-to-June rise at 4.1523.
As long as the current November low at 4.1517 and the 4.1443 September low underpin, further upside prices should be seen these are currently being capped by the 200 day ma at 4.2070.
If bettered, the 50% retracement and the late September high at 4.2318/4.2403 will be back in the picture as well.
Further range trading should be seen into year end with the currency pair expected to stay below the 4.3098 September high.
As long as this is the case the odds favour a retest of the September low at 4.1443 at some stage. Failure there on a weekly basis will mean that a top has been formed with the 200 week moving average at 4.1219 then being in focus. It should be reached by the end of the first quarter of 2014.
Support Resistance 1-Week View 1-Month View
4.1913 4.2070
4.1688&4.1587 4.2204&4.2318
78.6% Fibonacci retracement is at 4.1523
02 December 2013 3
EUR/PLN - Weekly Chart
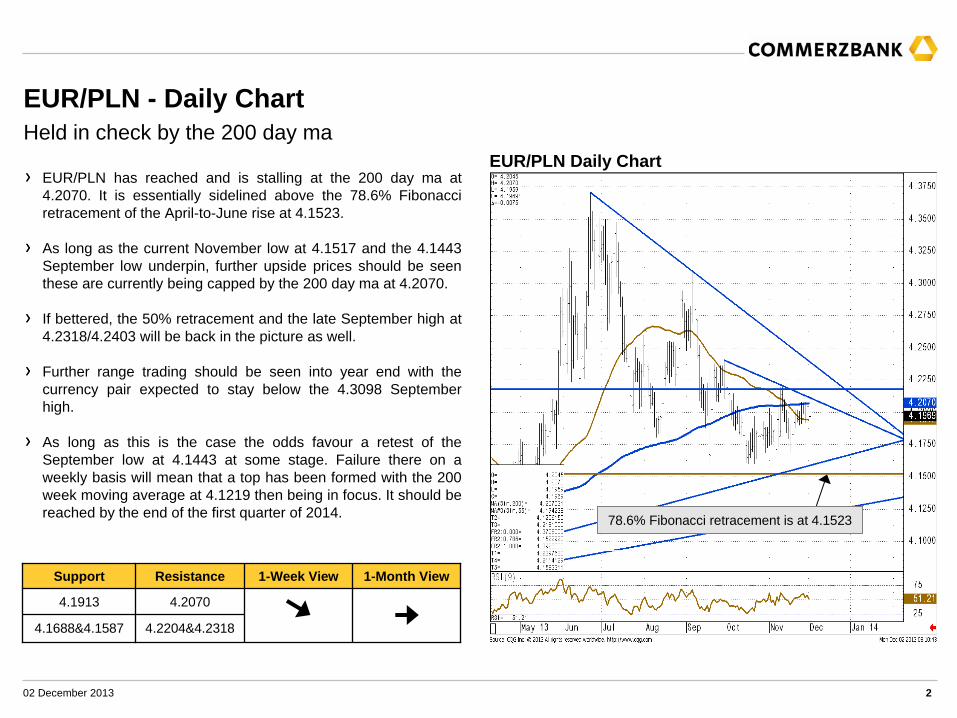
EUR/PLN Weekly ChartThe 2011-13 support line at 4.1605 underpins
2011-2013 support line comes in at 4.1605
02 December 2013 4
EUR/HUF - Daily Chart
EUR/HUF Daily ChartSevers the 2012-2013 downtrend
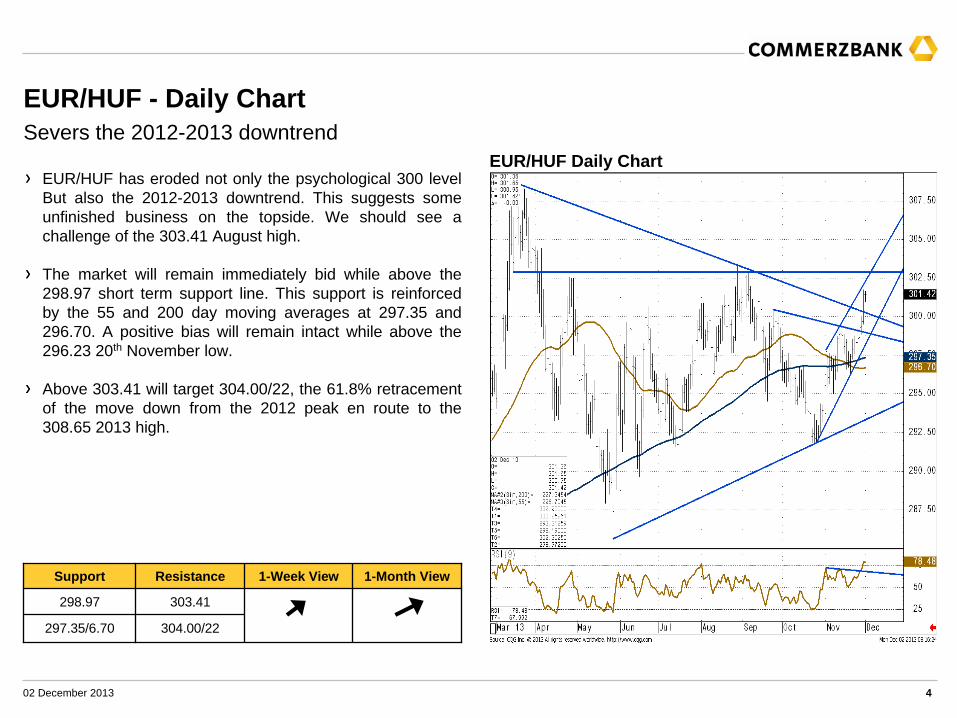
EUR/HUF has eroded not only the psychological 300 level But also the 2012-2013 downtrend. This suggests some unfinished business on the topside. We should see a challenge of the 303.41 August high.
The market will remain immediately bid while above the 298.97 short term support line. This support is reinforced by the 55 and 200 day moving averages at 297.35 and 296.70. A positive bias will remain intact while above the 296.23 20th November low.
Above 303.41 will target 304.00/22, the 61.8% retracement of the move down from the 2012 peak en route to the 308.65 2013 high.
Support Resistance 1-Week View 1-Month View
298.97 303.41
297.35/6.70 304.00/22
02 December 2013 5
EUR/CZK - Monthly Chart
EUR/CZK Monthly ChartAllow for some consolidation at the 2006 low at 27.41 and the 61.8% Fibonacci level at 27.48
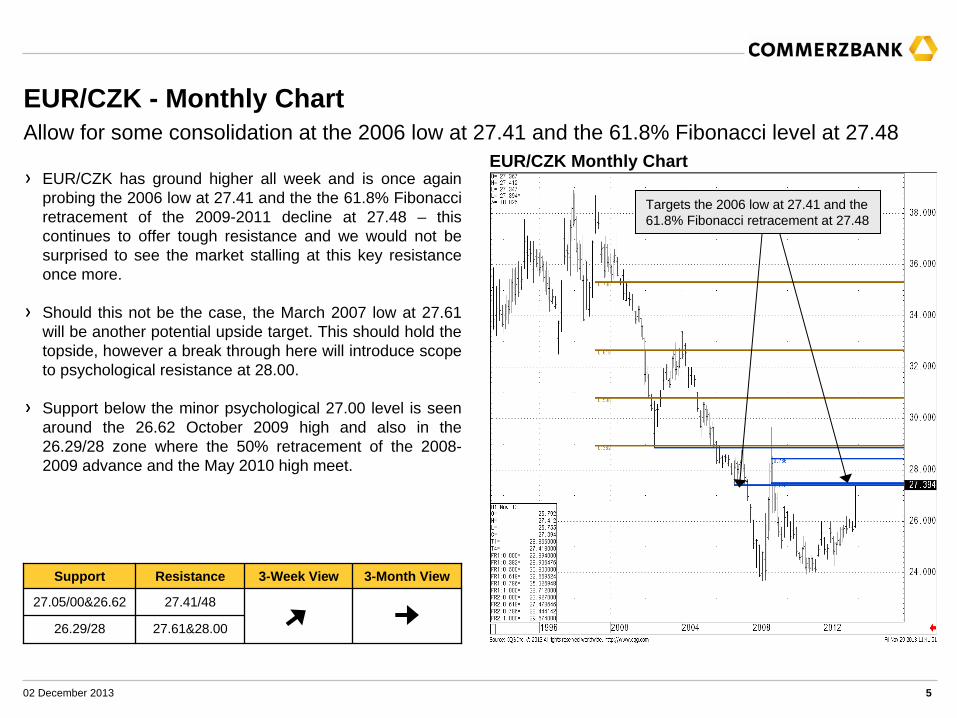
EUR/CZK has ground higher all week and is once again probing the 2006 low at 27.41 and the the 61.8% Fibonacci retracement of the 2009-2011 decline at 27.48 – this continues to offer tough resistance and we would not be surprised to see the market stalling at this key resistance once more.
Should this not be the case, the March 2007 low at 27.61 will be another potential upside target. This should hold the topside, however a break through here will introduce scope to psychological resistance at 28.00.
Support below the minor psychological 27.00 level is seen around the 26.62 October 2009 high and also in the 26.29/28 zone where the 50% retracement of the 2008- 2009 advance and the May 2010 high meet.
Support Resistance 3-Week View 3-Month View
27.05/00&26.62 27.41/48
26.29/28 27.61&28.00
Targets the 2006 low at 27.41 and the 61.8% Fibonacci retracement at 27.48
02 December 2013 6
EUR/CZK - Daily Chart
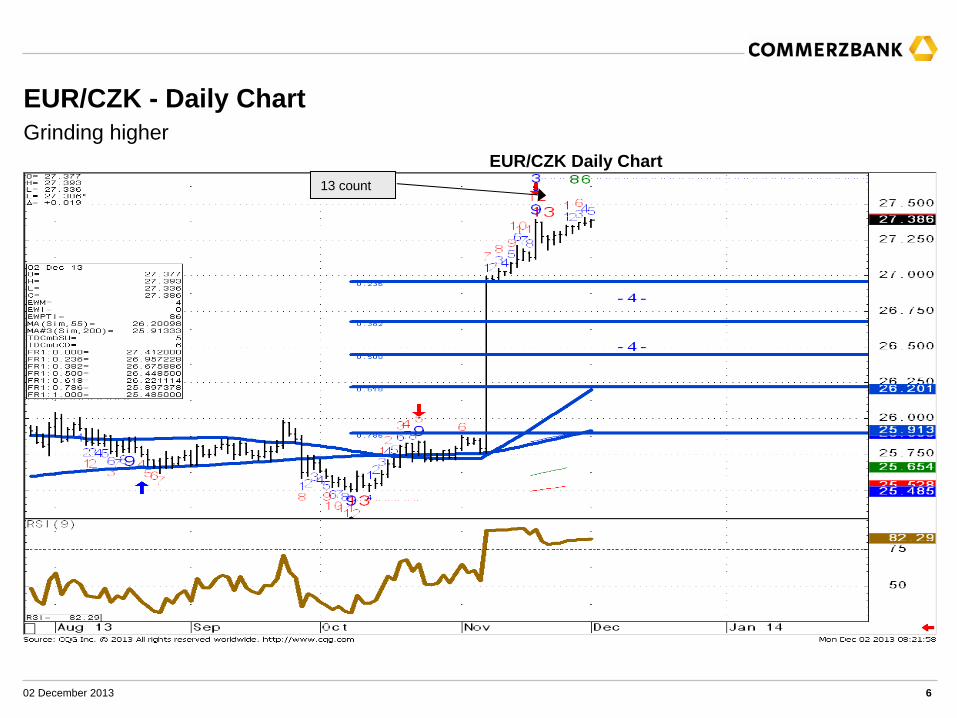
EUR/CZK Daily ChartGrinding higher
13 count
02 December 2013 7
EUR/BRL - Daily Chart
EUR/BRL Daily ChartBounces off last week’s 3.0405 low and targets the 78.6% Fibonacci retracement at 3.2003
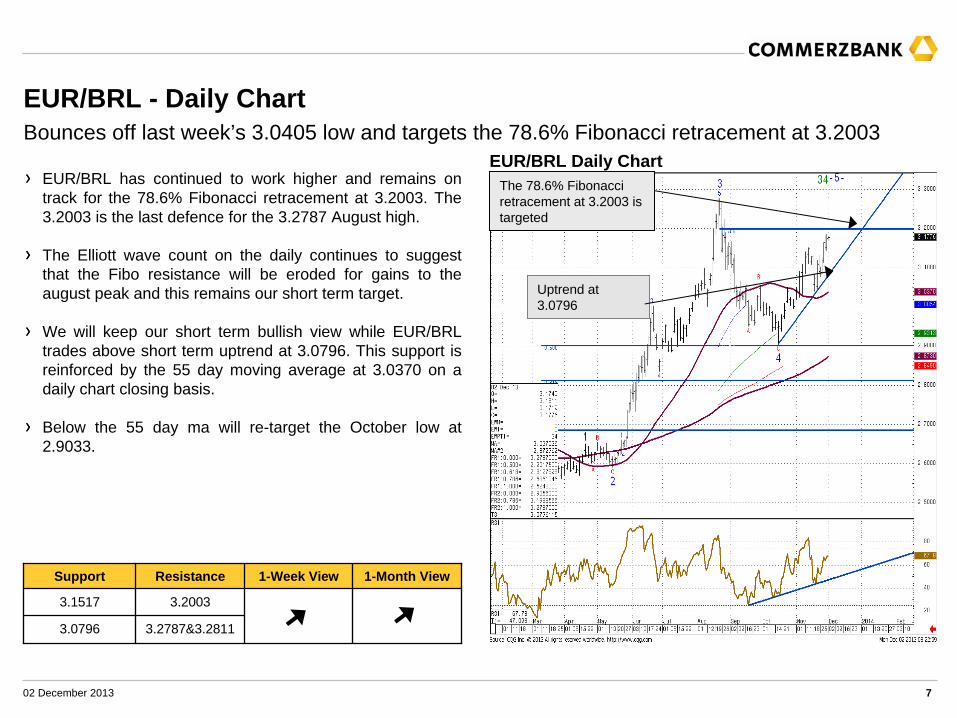
EUR/BRL has continued to work higher and remains on track for the 78.6% Fibonacci retracement at 3.2003. The 3.2003 is the last defence for the 3.2787 August high.
The Elliott wave count on the daily continues to suggest that the Fibo resistance will be eroded for gains to the august peak and this remains our short term target.
We will keep our short term bullish view while EUR/BRL trades above short term uptrend at 3.0796. This support is reinforced by the 55 day moving average at 3.0370 on a daily chart closing basis.
Below the 55 day ma will re-target the October low at 2.9033.
Support Resistance 1-Week View 1-Month View
3.1517 3.2003
3.0796 3.2787&3.2811
The 78.6% Fibonacci retracement at 3.2003 is targeted
Uptrend at 3.0796
02 December 2013 8
EUR/BRL - Weekly Chart
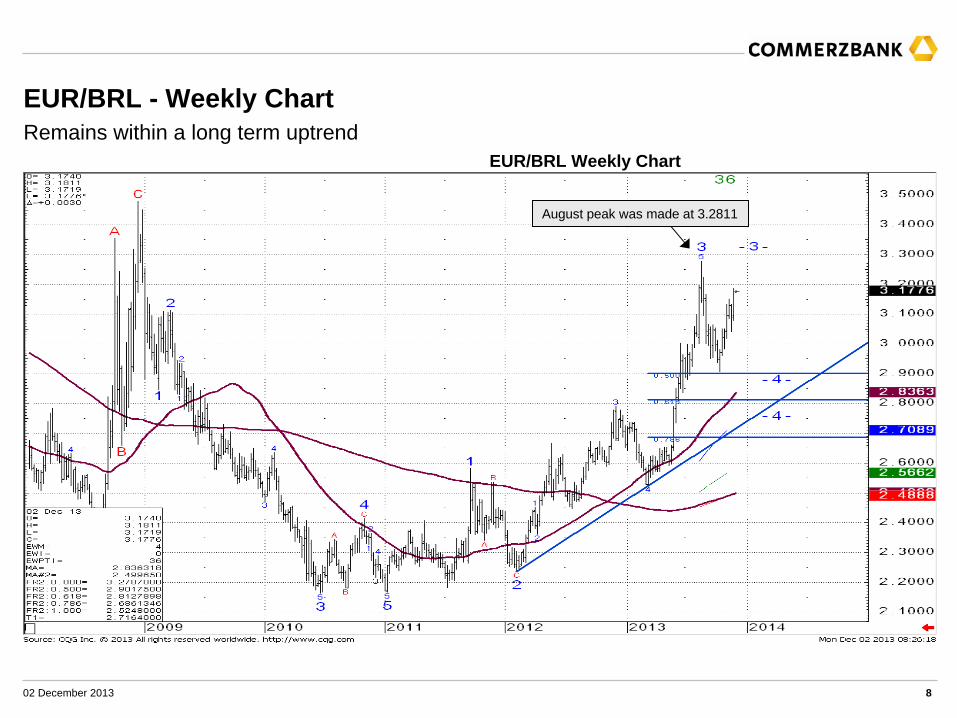
EUR/BRL Weekly ChartRemains within a long term uptrend
August peak was made at 3.2811
02 December 2013 9
USD/BRL - Daily Chart
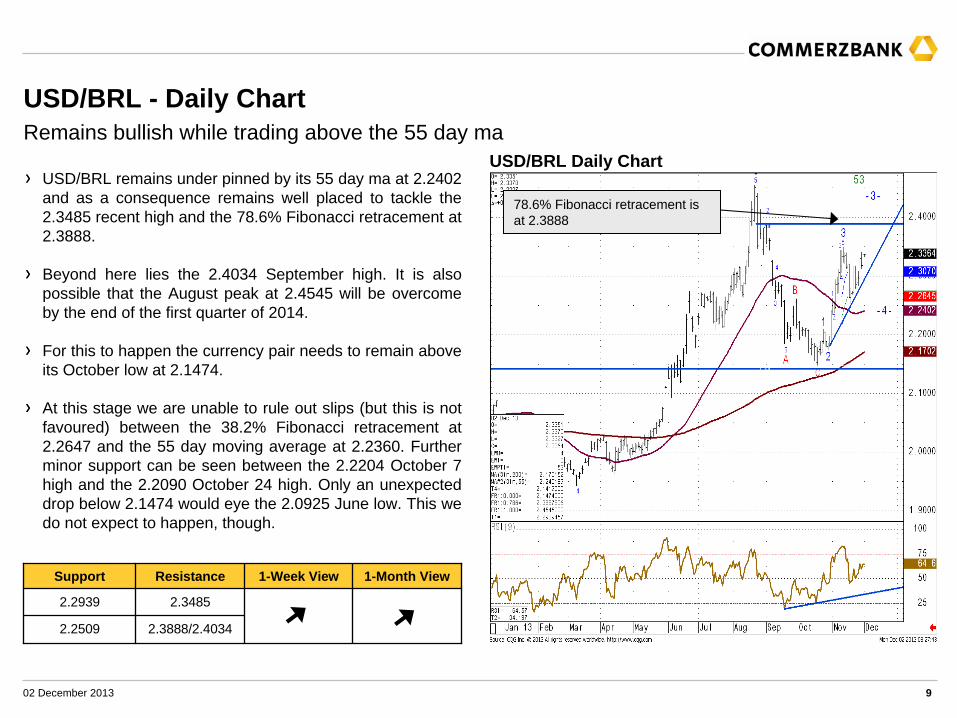
USD/BRL Daily ChartRemains bullish while trading above the 55 day ma
USD/BRL remains under pinned by its 55 day ma at 2.2402 and as a consequence remains well placed to tackle the 2.3485 recent high and the 78.6% Fibonacci retracement at 2.3888.
Beyond here lies the 2.4034 September high. It is also possible that the August peak at 2.4545 will be overcome by the end of the first quarter of 2014.
For this to happen the currency pair needs to remain above its October low at 2.1474.
At this stage we are unable to rule out slips (but this is not favoured) between the 38.2% Fibonacci retracement at 2.2647 and the 55 day moving average at 2.2360. Further minor support can be seen between the 2.2204 October 7 high and the 2.2090 October 24 high. Only an unexpected drop below 2.1474 would eye the 2.0925 June low. This we do not expect to happen, though.
Support Resistance 1-Week View 1-Month View
2.2939 2.3485
2.2509 2.3888/2.4034
78.6% Fibonacci retracement is at 2.3888
02 December 2013 10
USD/BRL - Weekly Chart
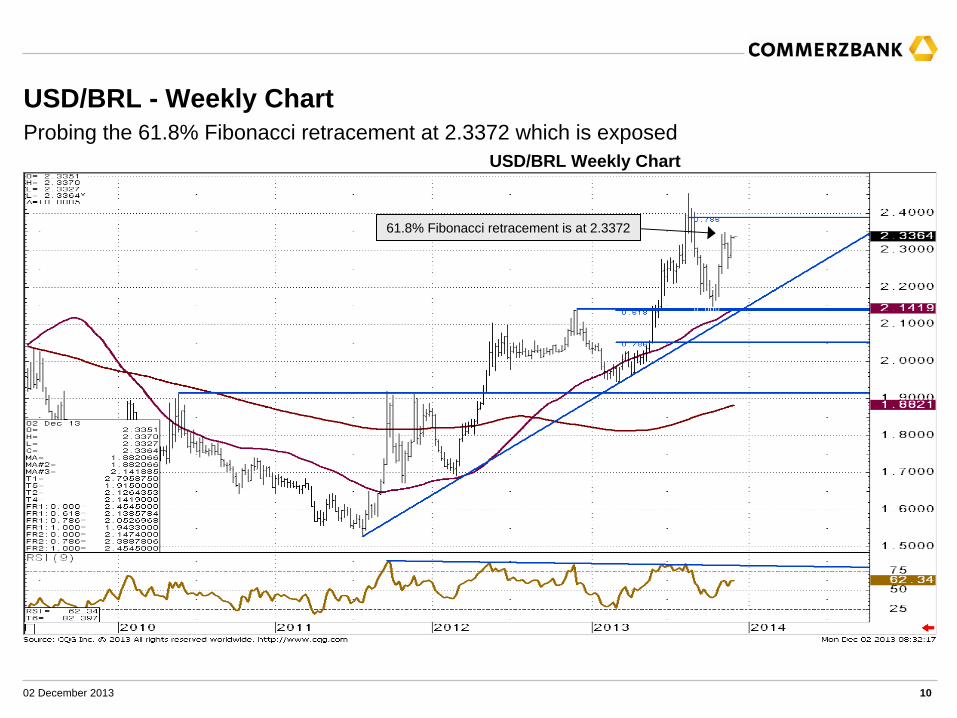
USD/BRL Weekly ChartProbing the 61.8% Fibonacci retracement at 2.3372 which is exposed
61.8% Fibonacci retracement is at 2.3372
02 December 2013 11
EUR/TRY - Daily Chart
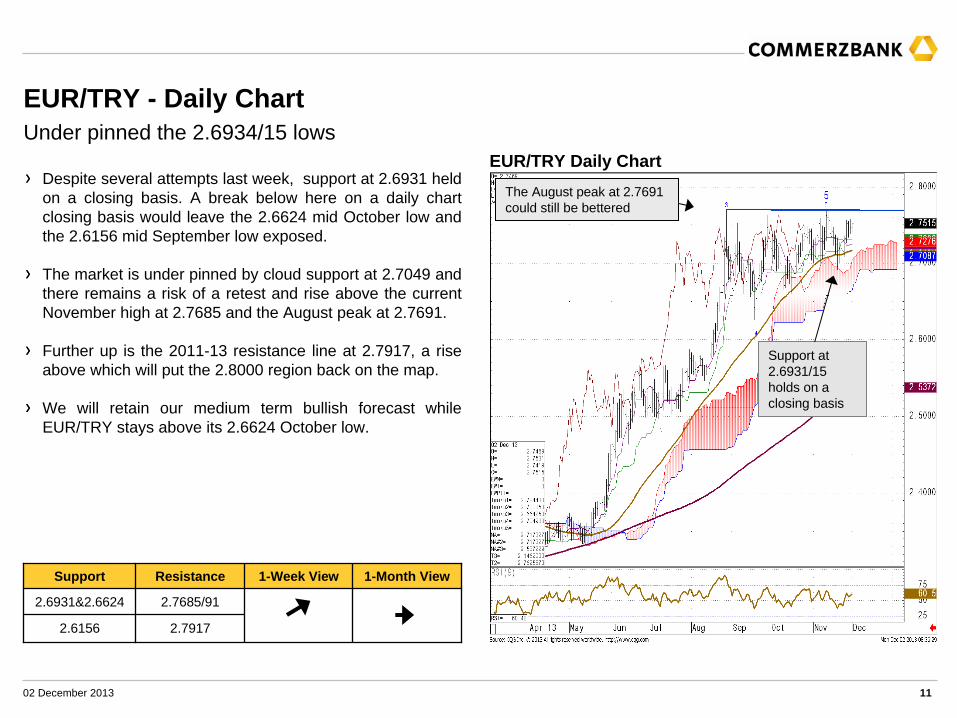
EUR/TRY Daily ChartUnder pinned the 2.6934/15 lows
Support Resistance 1-Week View 1-Month View
2.6931&2.6624 2.7685/91
2.6156 2.7917
Despite several attempts last week, support at 2.6931 held on a closing basis. A break below here on a daily chart closing basis would leave the 2.6624 mid October low and the 2.6156 mid September low exposed.
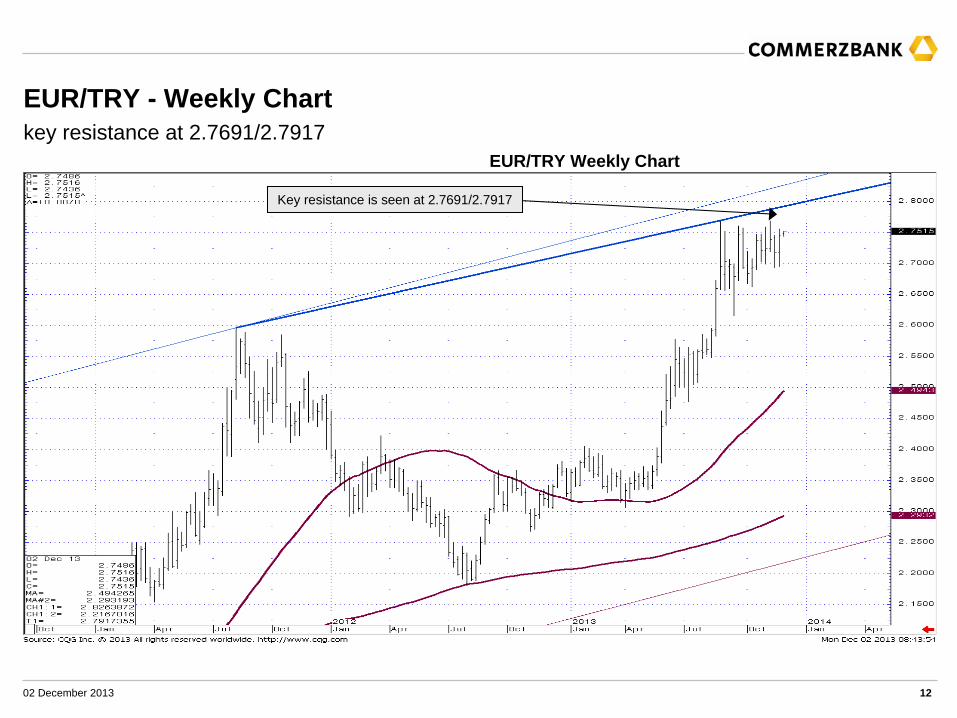
The market is under pinned by cloud support at 2.7049 and there remains a risk of a retest and rise above the current November high at 2.7685 and the August peak at 2.7691.
Further up is the 2011-13 resistance line at 2.7917, a rise above which will put the 2.8000 region back on the map.
We will retain our medium term bullish forecast while EUR/TRY stays above its 2.6624 October low.
The August peak at 2.7691 could still be bettered
Support at 2.6931/15 holds on a closing basis
02 December 2013 12
EUR/TRY - Weekly Chart
EUR/TRY Weekly Chartkey resistance at 2.7691/2.7917
Key resistance is seen at 2.7691/2.7917
02 December 2013 13
USD/TRY - Daily Chart
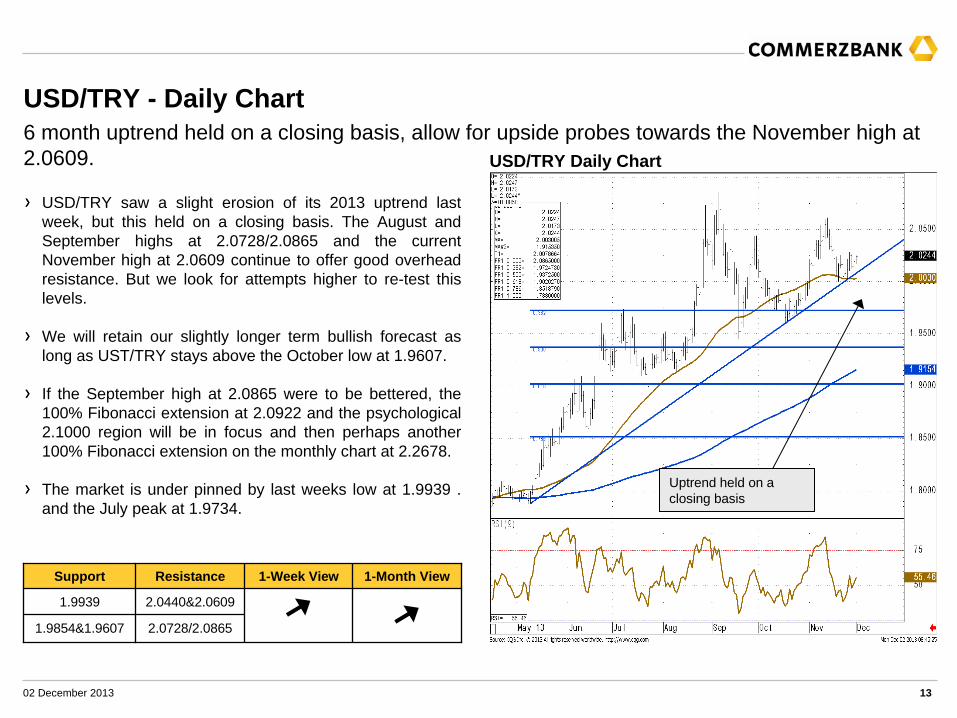
USD/TRY Daily Chart6 month uptrend held on a closing basis, allow for upside probes towards the November high at 2.0609.
Support Resistance 1-Week View 1-Month View
1.9939 2.0440&2.0609
1.9854&1.9607 2.0728/2.0865
USD/TRY saw a slight erosion of its 2013 uptrend last week, but this held on a closing basis. The August and September highs at 2.0728/2.0865 and the current November high at 2.0609 continue to offer good overhead resistance. But we look for attempts higher to re-test this levels.
We will retain our slightly longer term bullish forecast as long as UST/TRY stays above the October low at 1.9607.
If the September high at 2.0865 were to be bettered, the 100% Fibonacci extension at 2.0922 and the psychological 2.1000 region will be in focus and then perhaps another 100% Fibonacci extension on the monthly chart at 2.2678.
The market is under pinned by last weeks low at 1.9939 . and the July peak at 1.9734.
Uptrend held on a closing basis
02 December 2013 14
USD/TRY - Weekly Chart
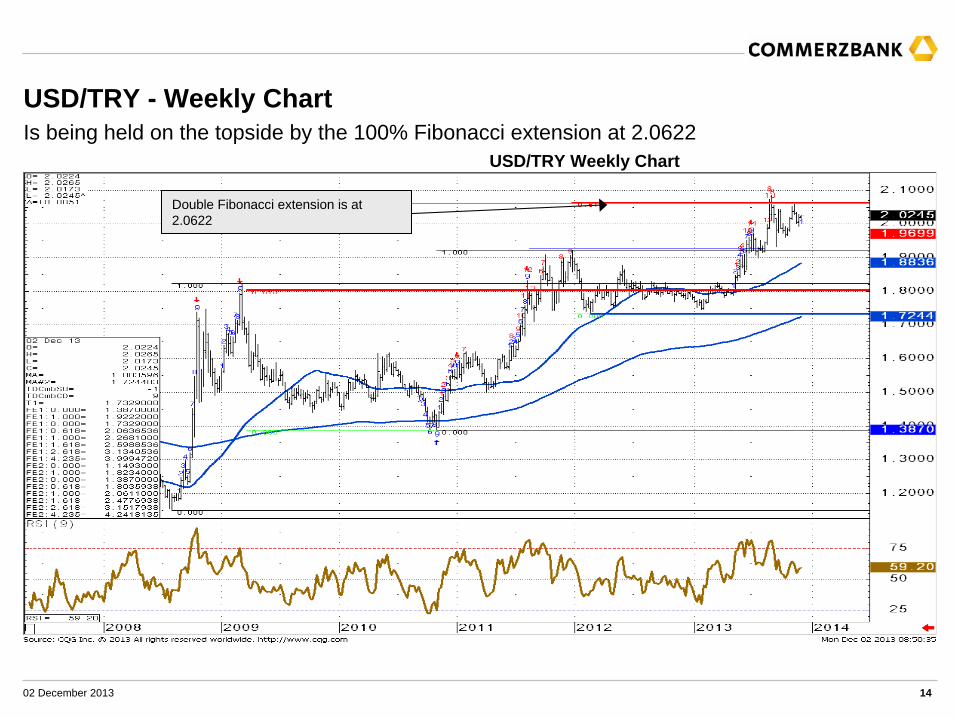
USD/TRY Weekly ChartIs being held on the topside by the 100% Fibonacci extension at 2.0622
Double Fibonacci extension is at 2.0622
02 December 2013 15
USD/MXN - Daily Chart
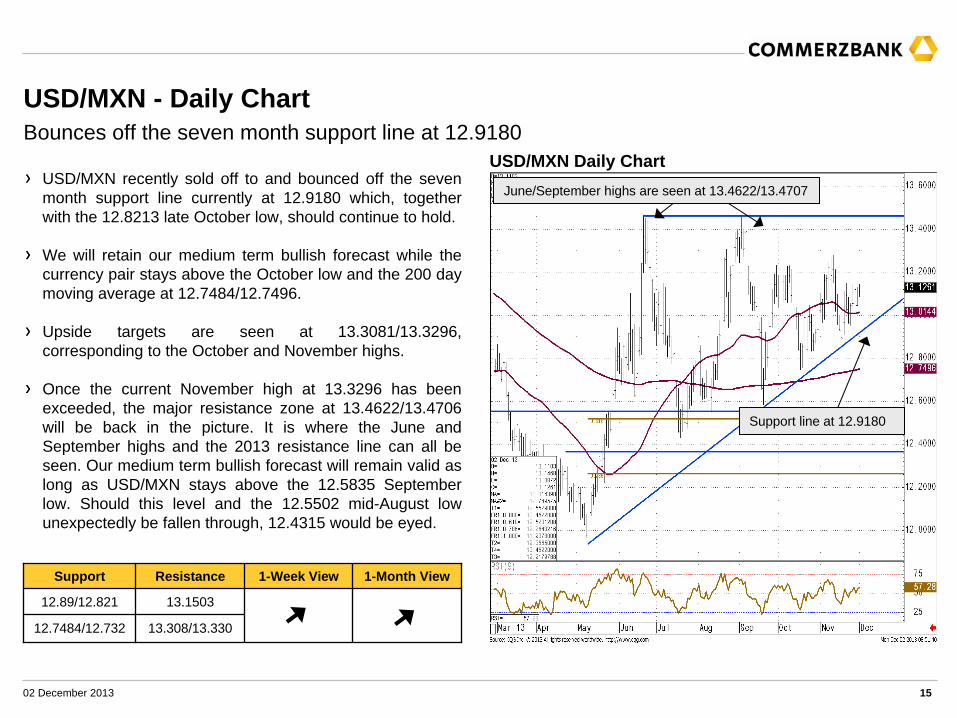
USD/MXN Daily ChartBounces off the seven month support line at 12.9180
USD/MXN recently sold off to and bounced off the seven month support line currently at 12.9180 which, together with the 12.8213 late October low, should continue to hold.
We will retain our medium term bullish forecast while the currency pair stays above the October low and the 200 day moving average at 12.7484/12.7496.
Upside targets are seen at 13.3081/13.3296, corresponding to the October and November highs.
Once the current November high at 13.3296 has been exceeded, the major resistance zone at 13.4622/13.4706 will be back in the picture. It is where the June and September highs and the 2013 resistance line can all be seen. Our medium term bullish forecast will remain valid as long as USD/MXN stays above the 12.5835 September low. Should this level and the 12.5502 mid-August low unexpectedly be fallen through, 12.4315 would be eyed.
Support Resistance 1-Week View 1-Month View
12.89/12.821 13.1503
12.7484/12.732 13.308/13.330
June/September highs are seen at 13.4622/13.4707
Support line at 12.9180
02 December 2013 16
USD/MXN - Weekly Chart
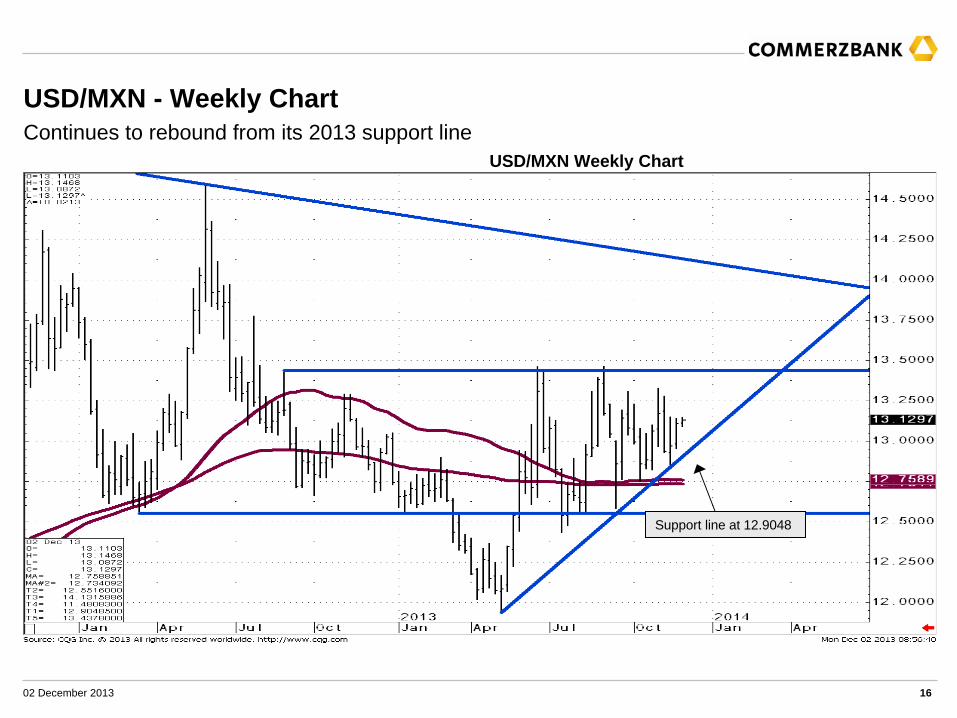
USD/MXN Weekly ChartContinues to rebound from its 2013 support line
Support line at 12.9048
02 December 2013 17
USD/ZAR - Daily Chart
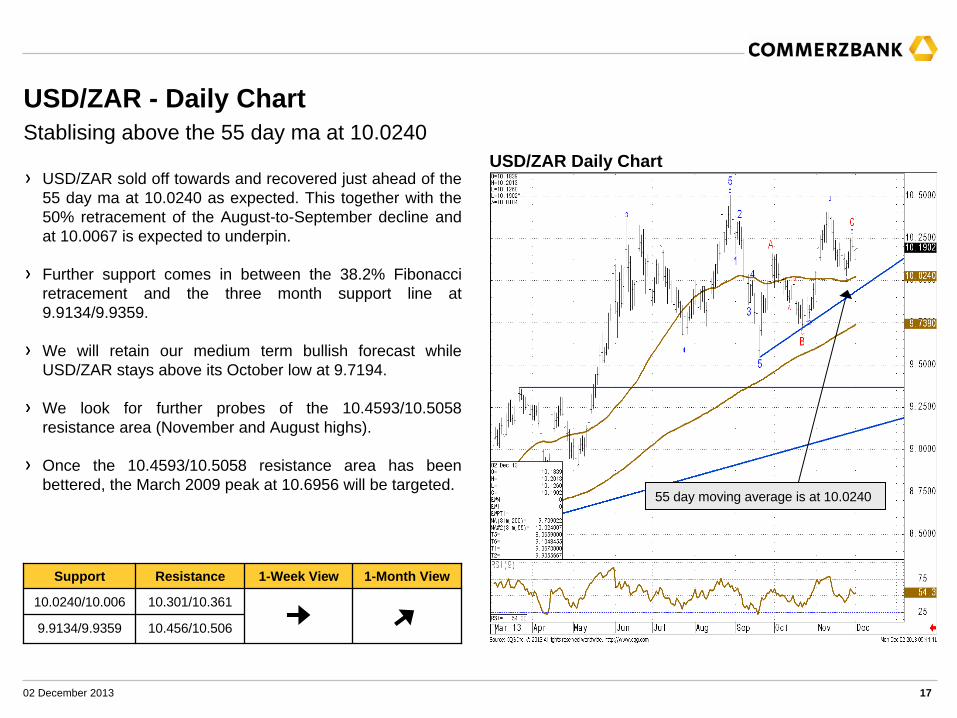
USD/ZAR Daily ChartStablising above the 55 day ma at 10.0240
Support Resistance 1-Week View 1-Month View
10.0240/10.006 10.301/10.361
9.9134/9.9359 10.456/10.506
USD/ZAR sold off towards and recovered just ahead of the 55 day ma at 10.0240 as expected. This together with the 50% retracement of the August-to-September decline and at 10.0067 is expected to underpin.
Further support comes in between the 38.2% Fibonacci retracement and the three month support line at 9.9134/9.9359.
We will retain our medium term bullish forecast while USD/ZAR stays above its October low at 9.7194.
We look for further probes of the 10.4593/10.5058 resistance area (November and August highs).
Once the 10.4593/10.5058 resistance area has been bettered, the March 2009 peak at 10.6956 will be targeted.
55 day moving average is at 10.0240
02 December 2013 18
USD/ZAR - Weekly Chart
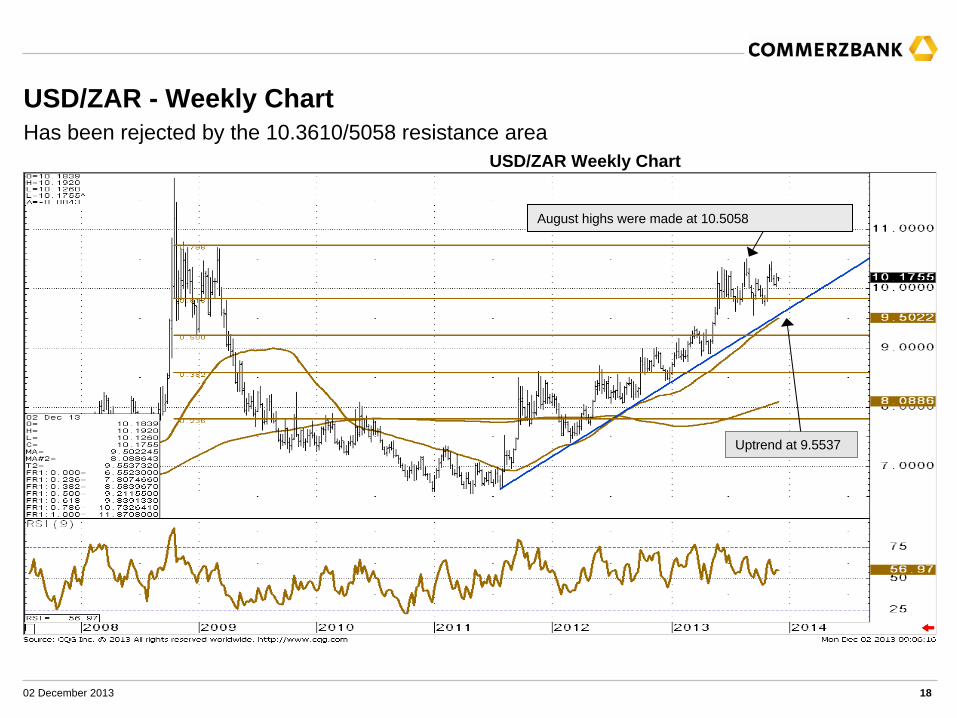
USD/ZAR Weekly ChartHas been rejected by the 10.3610/5058 resistance area
August highs were made at 10.5058
Uptrend at 9.5537
02 December 2013 19
USD/ZAR - Monthly Chart
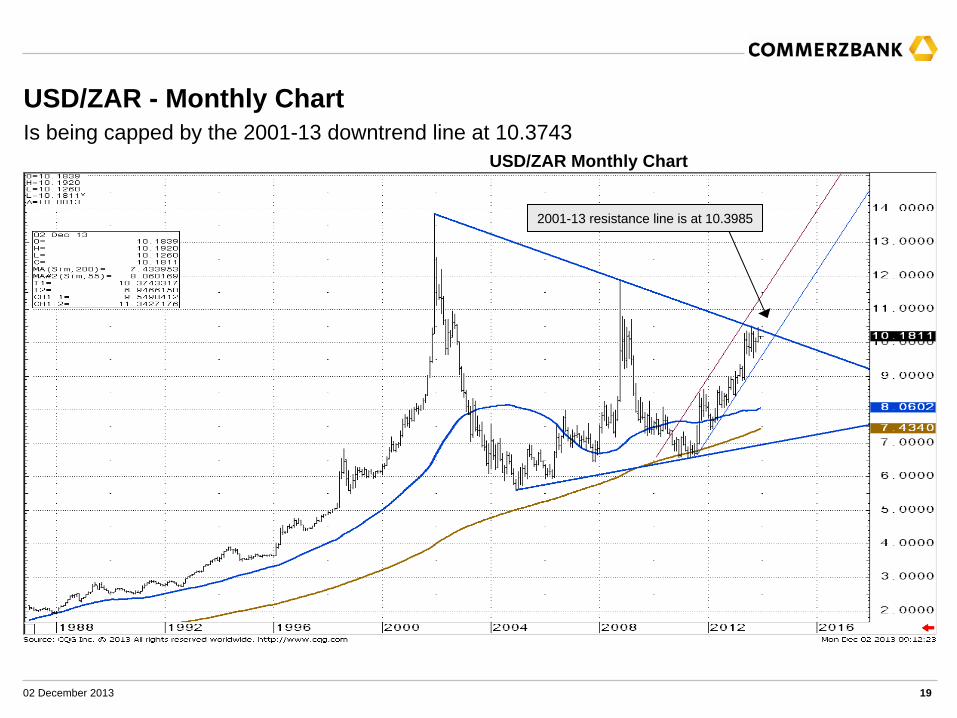
USD/ZAR Monthly ChartIs being capped by the 2001-13 downtrend line at 10.3743
2001-13 resistance line is at 10.3985
02 December 2013 20
Rouble Basket - Daily Chart
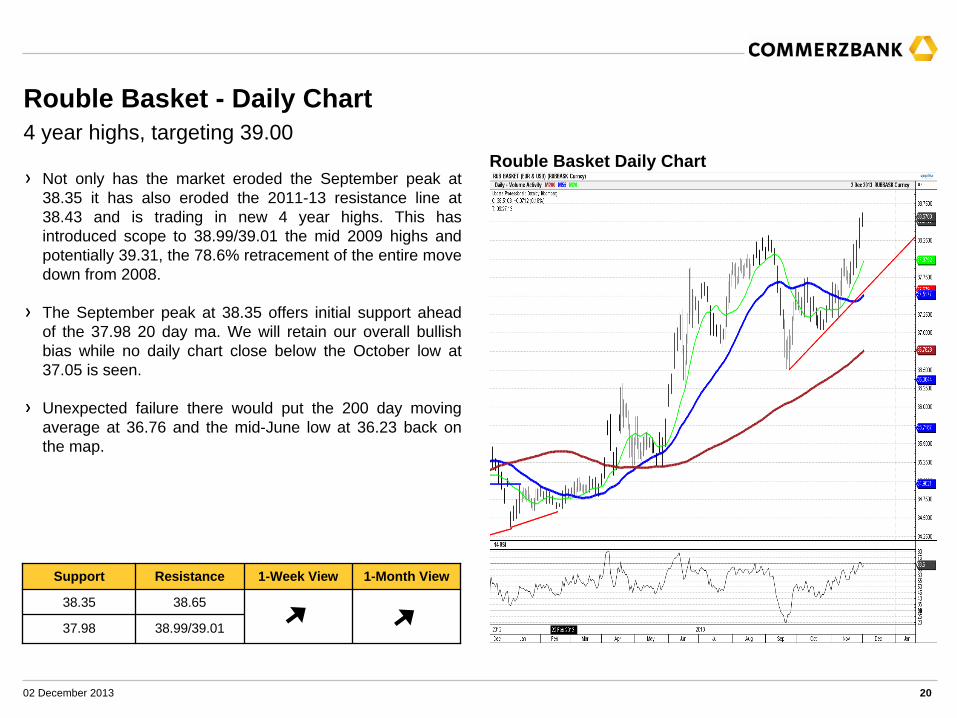
Rouble Basket Daily Chart4 year highs, targeting 39.00
Support Resistance 1-Week View 1-Month View
38.35 38.65
37.98 38.99/39.01
Not only has the market eroded the September peak at 38.35 it has also eroded the 2011-13 resistance line at 38.43 and is trading in new 4 year highs. This has introduced scope to 38.99/39.01 the mid 2009 highs and potentially 39.31, the 78.6% retracement of the entire move down from 2008.
The September peak at 38.35 offers initial support ahead of the 37.98 20 day ma. We will retain our overall bullish bias while no daily chart close below the October low at 37.05 is seen.
Unexpected failure there would put the 200 day moving average at 36.76 and the mid-June low at 36.23 back on the map.
02 December 2013 21
Rouble Basket - Weekly Chart
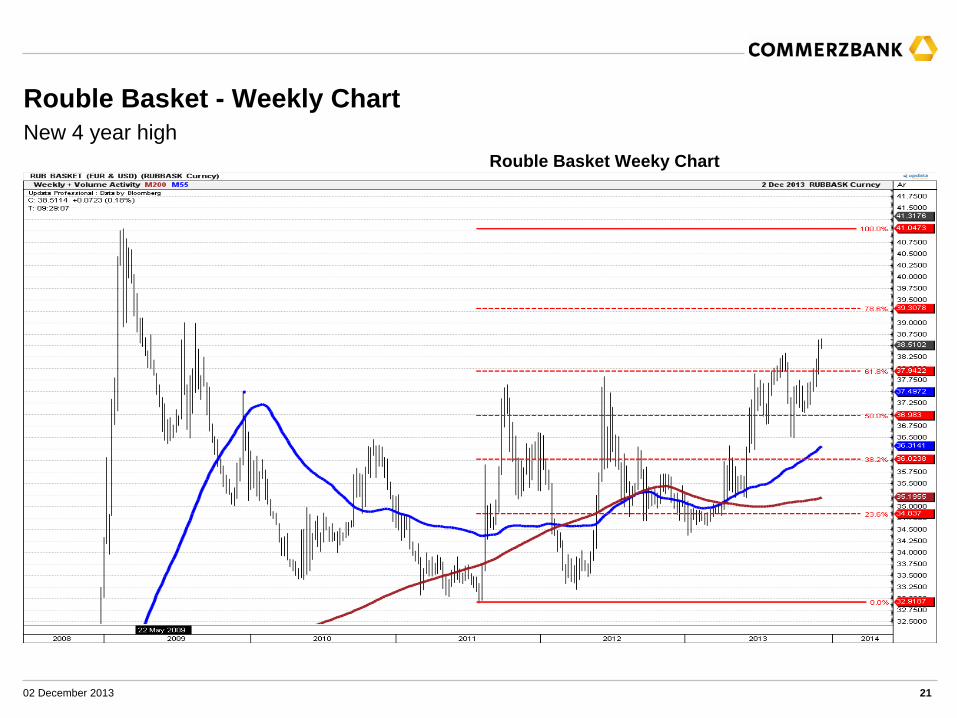
Rouble Basket Weeky ChartNew 4 year high