Embed Size (px)
Citation preview

Óbuda University e-Bulletin Vol. 8, No. 3, 2018
– 13 –
Fuzzy Measurement for Durable Goods Market
Segmentation1
Józef Dziechciarz*, Marta Dziechciarz Duda** *Wroclaw University of Economics, Department of Econometrics, Wroclaw, Poland
**Wroclaw University of Economics, Department of Econometrics and Computer Science, Wroclaw, Poland
[email protected], [email protected]
Abstract: The aim of the research is to apply the results of
fuzzy measurement of consumer preferences on the durable
goods market for customer segmentation. New phenomena
on the durable goods market are manifested in consumer be-
havior. As a result, the brand acts as the most important fea-
ture while purchasing decisions are taken. Brand assessment
by the consumer is associated with a complex evaluation pro-
cess with several criteria, such as reliability, credibility, mo-
dernity, and prestige. The important problem here is that as-
sessment criteria for features which by their nature are im-
measurable on metric scales are perceived differently by each
respondent. Typical quantitative tools used to measure atti-
tudes partly ignore this problem. An alternative approach
that attempts to account for differences in the individual as-
sessments by respondents is a measurement technique that
relies on the use of fuzzy numbers. Conversion of linguistic
expressions to form triangular fuzzy numbers allows for the
differences in the assessments of individual respondents, and
thus allows for better identification and representation of ac-
tual consumer preferences. Classical, multivariate statistical
analysis methods modified for fuzzy measurement results
may be used for customer segmentation which takes into con-
sideration the nature of the market for high-tech durables.
Customer preferences towards the attributes associated with
selected brands of durable goods are used for this task. In the
study, a market data set on smartphone devices was used.
Keywords: linguistic variable, fuzzy measurement, fuzzy mul-
tivariate statistical analysis, preferences study, smartphones
brand attractiveness assessment.
I. INTRODUCTION
One of the crucial marketing tasks is market segmenta-tion. The richness of characteristics that may be used for customers’ classification results in high complexity of the task. Another issue is the product type market. The topic of analysis here is the durable goods market and its segmenta-tion. Durable goods market (also referred to as durable goods consumption market) deals with material products purchased for consumption, the use of which does not cause immediate destruction so that they can participate in a num-ber of subsequent acts of consumption. For examples of products classification see, among others reference [21]. Other classification systems include: ISIC and NAICS (USA), SIC, FF (France), ICB–ONS and NACE (Euro-Stat). The market for durables has a feature which makes it extremely hard to classify customers into groups (seg-ments). The unique characteristics of consumer durable goods market, require the use of specific methods of con-sumer preferences analysis, taking into account the nature
1 The study was partly conducted in the framework of the research project entitled Households' equipment with durable goods in statistical analysis
and econometric modelling of material wellbeing. The project no. 2018/29/B/HS4/01420 has been financed by the National Science Centre.
of the market and its limitations. On the other hand, the fea-tures of consumer durables should be considered and in-cluded in the analysis. The specific character and the way in which the consumer durable goods market functions are directly determined by the unique features of these goods. The most important differentiating features of consumer durable goods include their durability, high unit price, and indivisibility. Demand for durable products strongly de-pends on demographic characteristics, the phase of the household’s life cycle, as well as the place of residence and financial situation. This indicates that it is possible to iso-late the specific features that distinguish a buyer of durable goods. The purchase of consumer durable goods occurs rel-atively seldom, and after the purchase the buyers remain outside the market for a relatively long time. The buying acts tend to be thought through and planned. Before the pur-chase consumers thoroughly examine the market offer.
Demographic factors are considered the most important, as the income of consumers and the prices of goods deter-mine consumer demand. The design of an effective market-ing strategy for the company that operates on the durable goods market requires a multifaceted market research, both in terms of existing offers on the competitive market and consumer preferences for these goods. Additionally, this problem becomes more complicated because markets for innovative and traditional consumer durables function by different mechanisms resulting from the specific needs, re-quirements, expectations and behaviours of buyers. For testing the proposed multivariate statistical techniques with the fuzzy measurement concept, the smartphone market in Poland has been chosen (see for example reference [9]).
Mobile devices play an increasingly important role in our lives. Smartphones, tablets and even smartwatches have be-come an indispensable part of everyday life for a significant part of the population. Despite the smartphone market de-velopment and the growth in the number of new smartphone users, it is a difficult market mainly because of problems of short product lifecycles and rapid technologi-cal advancements.
The crucial problem for companies operating on dura-bles market is the existence of imitations and substitutions. Strong brand loyalty and stiff competition, as well as barri-ers of entry are also typical for this market. Hence, produc-ers should be always aware of consumer preferences and specific needs to be able to stay ahead of competitors. Now-adays, Samsung and Apple occupy the world's top posi-tions. On the Polish smartphone market, Samsung is the un-
J. Dziechciarz et al. Fuzzy Measurement for Durable Goods Market Segmentation Title
– 14 –
disputed leader. Despite the prestige and recognition of Ap-ple, this brand has a much lower market share in Poland than in the world market.
At the same time, Poland experienced a new trend in which the market share of larger manufacturers is reduced in favour of new brands of smaller producers.
II. MARKED SEGMENTATION ISSUE
Market segmentation is used in order to solve the princi-pal marketing issues. Both the consumer market (products and services), and the industrial market segmentation are focused on identification of relatively homogeneous con-sumer groups. Here, the terms client, customer, and con-sumer are used as synonyms. In the marketing management literature they receive a slightly different meaning (see ref-erence [31]). The ultimate goal is to fulfill the specific needs of each identified group. To understand those spe-cific needs one has to thoroughly describe customer char-acteristics and their behaviour patterns. Customer charac-teristics are also referred to as variables, descriptive varia-bles, segmentation variables (characteristics), etc. It is cru-cial in this respect to define the segmentation base, which defines the list of customer characteristics from several pos-sible classes; descriptive – demographic, psychographic, geographic, etc., as well as behavioural – attitudes, tastes, decision style, etc. Segmentation, regardless of the method used, is designed to identify groups of entities (people, mar-kets, organizations) that share certain common features (at-titudes, purchase propensities, media habits, etc.).
Market segmentation in the consumer goods market is a typical marketing management task. In contrast, segmenta-tion in the durables market is not as commonly created as in the consumer market, the service market or even the in-dustrial market. There are distinguishable differences in the durable goods market that make it completely unlike other market types. In this respect, it is crucial to recognize these particular issues in which consumers of durables differ from FMCG customers. FMCG (fast moving consumer goods) are goods frequently bought. The main goal of mar-ket segmentation is to meet consumer needs, so segmenta-tion process is oriented towards selecting the ideal product that could be fully satisfying for the clients. Segmentation research process is designed to recognize groups of entities that have common characteristics, attitudes, and expecta-tions. There is a variety of segmentation procedures that differ in terms of the goal and the range of marketing re-search. According to Philip Kotler, there is a three-step pro-cedure for identifying market segments: the first one is called survey stage, the second – the analysis stage and the last one is the profiling stage (see reference [31] p. 181). At each of those three stages, the procedure is divided into sep-arate substeps. W. Muszyńska, by using the example of an existing company which offers household durables, shows that it is crucial for the researcher (or in real life the mar-keting manager) to define their objectives ahead of the seg-mentation procedure (see reference [41]). Afterwards, the aggregation of potential customers, understood as the iden-tification of the company’s reservoir of potential customers should be described. This description may be based on the variables (customer characteristics) from the list of descrip-tive and behavioural variables. The definition of the prod-uct and the market is done in the second step (of the first part of the research). Hence, the consumer durables market characteristics are as follows:
This market has typical features like every consumer market, where the main needs of individuals (and their
households) are met.
An important feature of the durables market is the strong income elasticity of demand.
Also, theprice elasticity of demand is on a highlevel, therefore, the price is one of the most important mar-keting instruments.
Enterprises offering durables operate on large territo-rial space (usually on international markets), and their number is increasing.
The number of buyers is unlimited – as a rule, one item is purchased, normally in the retailers’ stores.
The market is complicated by the strong substitution and complementarity. Additionally, the secondhand market attracts numerous purchasers.
Moreover, seasonality influences the durables market; the level of demand usually being higher in the fourth quarter of the year.
The next step of the segmentation procedure consists in the identification of the potential products purchasers’ needs and expectations. Durable goods are involved in the process of satisfying diverse needs of members of the household and the household as a whole. It means that the role of durable goods and their importance in the household is multifaceted and diverse. Some of the durable goods con-tribute to improving the ease of housework, by reducing the effort and time needed to perform household tasks. Deter-mining the way of spending free time is equally important. In Figure1, the list of types of needs where durable goods are involved in the process of satisfying diverse needs of members of the household and the household as a whole is
Figure 1. Maslow’s hierarchy of needs
Source: Own elaboration based on Maslow [1943].
Self-Actualization needs
Possession of goods that meet the higher needs, they bring satisfaction, realizing personal
potential, self-fulfillment. Expensive, branded, luxury products, e.g. e-book reader, computer, laptop, smartphone, iPad, Smartwatch, home
cinema, cottage, motor boat, an expensive car, a luxury house
Belongingness and Love needs
Esteem needs
Possession of goods that meet the needs of the average row; enable contacts with the environment, e.g. Telephone,
computer (communication, communication via the Internet). Ownership of more expensive, perceived as distinguishing the material status, e.g. Tablet, TV, home cinema, an expensive
car, cottage, motor boat, fancy house
Biological and Physiological needs
Safety needs
Possessions that enable satisfaction of basic human needs, e.g. Washing machine (washing clothes), a car (movement), kitchen (cooking - satisfying hunger), house, dwelling (shelter, security)

Óbuda University e-Bulletin Vol. 8, No. 3, 2018
– 15 –
shown. It is important to see that the same product class (e.g. cars) may satisfy needs on different levels. The car may be a status symbol for some households, and in other families it may play the basic role of a transportation tool necessary for the job and everyday family activities. How-ever, in general, consumer durables are relatively high in the needs hierarchy. The surveys in the households finance show that the position of these products in the financing hi-erarchy is usually located behind food items, clothing, and mandatory payments (see reference [3]). On the other hand, although consumers usually declare their readiness to buy durable products, they actually make those acquisitions af-ter they have met their basic, lower-level needs. In the discussion of characteristics, in respect of which consumer durables differ from most other items of consumer expend-itures, a number of distinguishing features are identified and listed. Among the most common of these differences are determinants of demand for consumer durables. Im-portant determinants of demand for consumer durables in-clude the socio-economic status of the household (occupa-tional group, the age of household with the household life cycle stage; existing durable ownership; depreciation level of existing equipment, general economic confidence and availability of bank loans, real estate market prosperity and specific triggers and hindrances to purchases).
Additionally, it has to be stated that consumer durables differ from most other items of consumer expenditure in the characteristics of purchasing process:
buyer acquires a product and then stays away from the market for a long period, only to return to the market for a short time either to purchase an additional item or to replace an existing durable,
consumers are in the market for a short period and spend a substantial amount of money in that period,
the purchase of a durable product, which costs a substantial amount of money, is usually well thought-through, planned long ahead and the market carefully searched for a suitable offer.
The crucial issue of segmentation is to find an appropri-ate combination of variables that will measure the changes in purchase intentions as an aid for forecasts of demand changes. Segmentation bases which are used to segment the durables market are often similar to those employed on the consumer market.
The difference lies in the way they are adjusted to these market unique characteristics. The segmentation base i.e. the set of segmentation variables (customer characteristics) used to assign potential buyers to homogeneous groups can be classified into main groups of descriptive variables:
demographics and geographic characteristics: age, gender, marital status, size of household, family life cycle, income, occupation, education, social class, re-gion, density,
psychographics: lifestyle, personality,
behavioural: occasions, benefits, user status, and loy-alty status.
There are three major approaches to segmentation of consumer durables market. It may be based on:
socio-economic status of the household,
general consumer confidence,
consumer behaviour – perception of product character-istics.
Commonly used measures are easily measurable socio-economic features, such as: age, income, employment sta-tus, home ownership, family size and ownership of dura-bles. It does not mean that easily observable variables are of less importance.
For instance, age is an important determinant of behav-iour, and therefore age is a critical variable for understand-ing variations in individual behaviour. In a study by Strober and Weinberg it was proven that younger households pur-chase earlier than older ones (see reference [54].
Likewise, Morgan found that income has a significant non-negative effect on the probability of purchase, as it could be intuitively expected (see reference [39]). Empiri-cal evidence indicated that working status is significant in determining family’s likelihood of owning major durable goods.
Different segmentation bases are considered, and characteristics to measure the consumers’ general eco-nomic confidence are often used. As an example, the cur-rent state of the economy, as well as personal financial sit-uation contributes to consumer confidence may be indi-cated. Alternative versions of measures are based on house-hold intentions or expectations to buy a specific durable product within a stated period.
In the W. Muszyńska’s example, a specific durable mar-ket characteristics (sex, the age of head of household, the size of the family, family status, economic status, occupa-tional group and place of living) were used as segmentation variables. The analysis of a sample consisting of 1200 re-spondents (company clients) was done in the next stage of segmentation procedure.
To cluster customers into homogeneous groups, six seg-mentation variables were used. Customers were described according to their occupational group, correlated to their sex, age and economic status. In the described experiment, three customer profiles were identified and characterized: the first one, called young purchasers, second profile, pro-fessionally active, and third profile, retired purchasers. In the last stage of the segmentation process, segment profil-ing was carried out. The professionally active segment was considered to be the basic profile that company decided to target on. Its main characteristics were:
easily identifiable, homogenous, numerous and meas-urable,
stable and accessible for marketing efforts.
TABLE I CLASSIFICATION OF METHODS USED FOR SEGMENTATION
A priori Post hoc
Descrip-
tive
Contingency tables Log-linear models
Clustering methods: Non-overlapping
Overlapping
Fuzzy techniques
Mixture models
Predictive
Cross-tabula-tion Regression Logit analysis Discriminant analysis
Aid, Chaid, Maid CART Conjoint analysis ANN Clusterwise regression Mixture models
Source: Wedel M., Kamakura W. (1998) Market Segmentation. Concep-
tual and Methodological Foundations, Kluwer, p. 18.
J. Dziechciarz et al. Fuzzy Measurement for Durable Goods Market Segmentation Title
– 16 –
III. MULTIVARIATE STATISTICAL METHODS USED FOR
MARKET SEGMENTATION
One may indicate two main ways of classifying the seg-mentation techniques.
Depending on the choice of a statistical method, one can distinguish between descriptive and predictive approach. Descriptive methods analyze the associations across a sin-gle set of segmentation bases, with no distinction between dependent and independent variables. Predictive methods analyze the association between two sets of variables (one set consists of dependent variables to be predicted by the set of independent variables).
Secondly, segmentation approaches can be classified into apriori and post hoc approaches.
An application and theoretical discussion of apriori descriptive methods such as contingency tables are pro-vided by A. Stanimir (see reference [51] and [52]). Descrip-tion of apriori predictive approaches such as:
based on discriminant analysis is given in works by Gatnar, Walesiak (see reference [20]), and Lawson (see reference [33]);
based on regression is given in works by A. Wildt J. McCann (see reference [59]);
based on cluster analysis application to market seg-mentation is described, among others in works (see ref-erence [2]; [18]; [46] and [55]).
Post-hoc predictive methods are often employed to seg-ment customers, their description may be found among other in following studies:
Automatic Interaction Detection (AID), and other AID-like algorithms like Multivariate AID (MAID) (see reference [36]) and Chi-squared AID (CHAID) could be found in references [16]; [48] and [49];
Classification and Regression Trees (CART) method-ology can be found in reference [32];
Artificial Neural Network (ANN) in reference [4] and [26];
Conjoint analysis (see reference [17] and [56]) and cluster-wise regression (see reference [58]).
In the literature there is a comprehensive discussion completed on various segmentation methods groups and their applications in each of the four classes
Cluster analysis is a statistical method for classification. Unlike other statistical methods for classification, such as discriminant analysis and automatic interaction detection, it makes no prior assumptions about important differences within a population. Cluster analysis is a purely empirical method of classification and as such is primarily an induc-tive technique.
The primary use of cluster analysis in marketing has been for market segmentation and it has become a popular tool for the marketing researcher. Hence, illustrative appli-cations of cluster analysis for market segmentation (also to consumer durables market segmentation) have been pro-vided by many authors.
There are interesting studies using agglomerative hierar-chical clustering methods. To show some interesting, rep-resentative studies, one should mention studies by Claxton, Fry, and Portis. In one of their studies they attempted to classify furniture and appliance buyers in terms of their in-formation search behaviour. Authors employed a complete
linkage cluster analysis. Nature of data used: attribute scores on several pre-purchase activity measures (see refer-ence [11]). An average linkage cluster analysis method de-scribed by Kiel and Layton was used to develop consumer taxonomies of search behaviour on the Australian new car buyers’ market. The nature of data: factor scores derived from several search variables (see reference [29]).
An interesting example of hierarchical clustering was shown in a study by Furse, Punj and Steward [19]. A cluster analysis of questionnaire data was used to identify six dis-tinctive external information search patterns among pur-chasers of new automobiles. Researchers employed Ward’s and k–means Howard–Harris methods (detailed description in [50]). Data were obtained from over one thousand re-spondents. They were customers who had purchased a new automobile in 1978. In the next stage, forty-eight sales rep-resentatives from various dealers participated in the study.
A common tool for marketing researchers became the k-means Howard–Harris method, one of degglomerative hi-erarchical clustering methods. P. Green and F. Carmone [22] employed this clustering method to identify similar computers (strata in the computer market) using perfor-mance measures for different computer models.
One of the first examples of forming hierarchical clusters by means of the Howard–Harris algorithm is described in a study by Rao and Winter [47]. In their research respondents selected for the study were MBA students who owned cam-eras. In order to find homogenous groups, the authors used characteristics describing general photography and camera preferences.
Another early illustration of the Howard–Harris algo-rithm was employed by Green, Tull and Albaum [25]. They used the Howard–Harris techniques to identify similar computers. Forty-seven different computers were charac-terized by 22 variables describing computer features.
Green, Carmone and Smith [24] also used k–means Howard–Harris method for identifying homogenous groups of cars with similar characteristics. Using ten varia-bles, the authors described 90 types of cars which were on the market in 1987 with prices ranging from 5 to 168 thou-sand dollars.
An illustrative application of non-hierarchical cluster analysis to market segmentation has been provided by A. Mazur and I. Staniec [38]. They segmented the Polish au-tomobile market with the application of k–means method.
The same, k–means method was applied to PC and cars buyers segment by Morwitz and Schmittlein [40]. The au-thors investigated the issue whether the use of segmentation could improve the accuracy of sales forecasts based on stated purchase intents. In the study, four different methods for segmenting households were applied. One of them was cluster analysis based on demographic and product usage variables. The three waves of surveys (from 1986 to 1989) were conducted with a consumer panel of as many as one hundred thousand US households. Eventually, they used 24.000 responses for PC and over 28.000 for automobiles users. As a result, consumers were segmented into five homogenous groups.
The same clustering method was applied by S. Lonial, D. Menezes and S. Zaim in their study [35]. The paper focused on the use of cluster analysis for identifying the target seg-ments of the university students as PC buyers. For the study k-means was used to cluster respondents on the basis of

Óbuda University e-Bulletin Vol. 8, No. 3, 2018
– 17 –
similarity of their utility functions for five PC related attrib-utes and the corresponding attributes levels.
The issue of market segmentation often is related to other methods of data analysis, which are not included in above presented classification. The techniques of this type include multidimensional scaling (MDS) and a group of methods known collectively as the factor analysis, as well as linear ordering techniques. Some of the described methods are ap-plied only in market segmentation, others are suitable both for segmentation and profiling. There are also methods used exclusively either to segments description, or only profiling. Among the most common methods used for pro-filing of market segments, in addition to simple techniques based on descriptive statistics, one should number, among others, the Multidimensional Scaling and fuzzy linear or-dering. Multidimensional Scaling is an important research technique that is normally used in order to solve specific marketing management tasks, e.g. the positioning of prod-ucts. One has to mention this particular possibility of appli-cation of this method for the problem of market segmenta-tion. Multidimensional Scaling is a technique for simplify-ing the description of multidimensional reality by reducing the dimensions of space. The method can be used to de-scribe the structure of an examined object. It is done by de-termining the dimensions of the content, based on the sim-ilarity and preference of the respondents. The ultimate task is to detect relations between the objects studied using a multidimensional space with radically reduced number of dimensions (see reference [62], p. 101).
The work on the theory of fuzzy sets was initiated by L. Zadeh [63], who negated the unambiguous assignment of objects to individual classes. L. Zadeh suggested that fuzzy measurement and thus fuzzy classification is at least a par-tial remedy to the disputable assignment of objects to dif-ferent classes. Based on this idea and its assumptions, the algorithm of fuzzy k-means method and its generalization called FCV (fuzzy c-variety clustering technique) have been developed. The proposed techniques also identify clusters with the chain configuration. H. Hruschka demon-strated the applicability of fuzzy classification techniques for solving some specific marketing management tasks, particularly in segmentation (see reference [28], pp. 117-134). In fuzzy measurement and fuzzy classification, the assumption of a stochastic nature of the phenomena studied is abandoned. The deterministic assumption holds. Espe-
cially interesting possibilities are offered by techniques
based on the theory of fuzzy sets, among them earlier men-tioned fuzzy linear ordering.
IV. FUZZY NUMBERS AND FUZZY MEASUREMENT
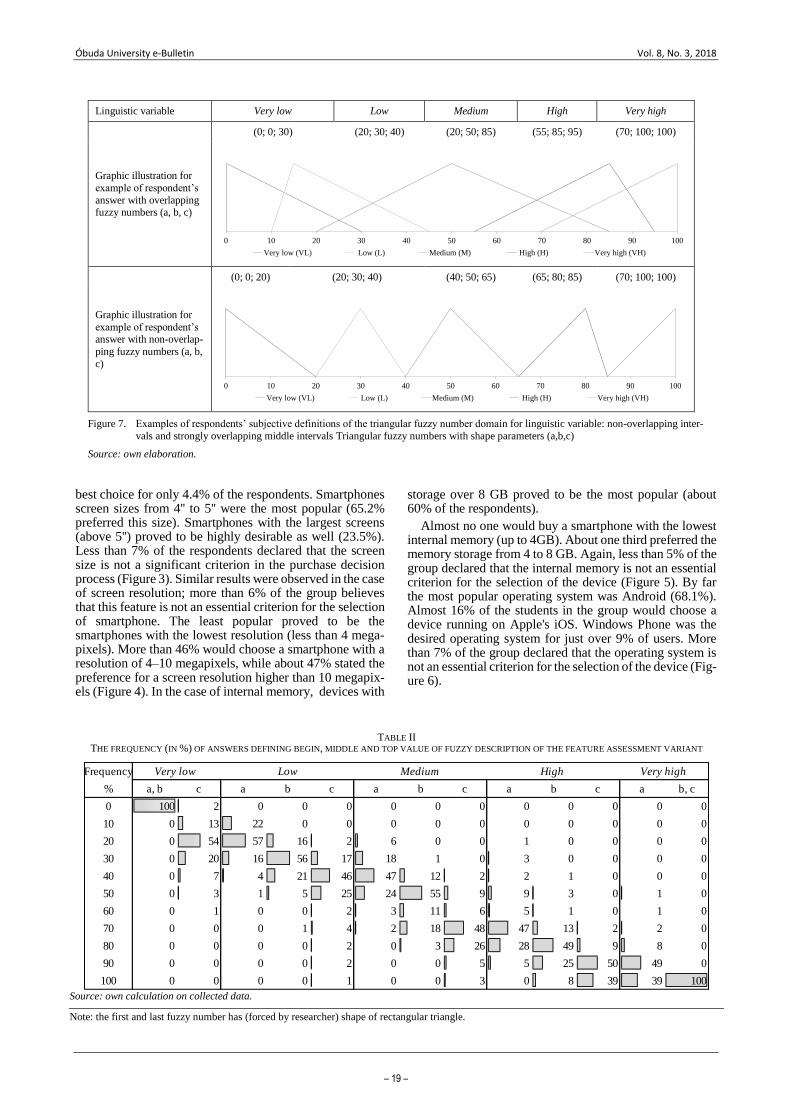
Linguistic variables were used to describe potential us-ers’ preference towards analysed products. In this ap-proach, in order to quantify the formulated linguistic state-ments, the theory of fuzzy measurement and fuzzy numbers were utilized. The fundamental work on sociological and utility measurement is presented in S. Stevens [53]. The specifics of linguistic variables are thoroughly discussed in L. Zadeh [64] and T. Liou M. Wang [34]. A linguistic var-iable can be defined as a variable where values are deter-mined by verbal categories (see reference [44]). From the point of view of the respondents, the linguistic variable is a convenient and intuitive way to assess their preferences (see reference [6]). However, the choice of parameters of fuzzy numbers which illustrate the perception of linguistic values constituting points of measurement scales is crucial. So, the researcher encounters a difficulty in how to properly code the verbal statements. The use of fuzzy numbers, in which the words of the natural language are identified with specific fuzzy subsets, is one of the possible methods of coding verbal statements (Zadeh [64]). The procedure of coding linguistic statements uses the concept of triangular fuzzy sets defined as a set of three parameters: a, b, c, where a<b<c. The values of the membership function of the triangular fuzzy set can be expressed by the appropriate for-mula (see reference [1]).
In Figure 1, a graphic interpretation of a fuzzy set in tri-angular form is shown. The use of linguistic variables to study consumers’ preferences is based on the respondents’ assessment of certain criteria of evaluation by indicating one of the levels of the variable expressed in natural lan-guage. In the next step, the levels of the linguistic variable are assigned an equivalent (code) number, which in this case forms the fuzzy number. Variants of the linguistic var-iable are usually defined and understood by the individual respondents in a non-uniform manner. For this reason, the linguistic expressions in general vary in terms of a numeri-cal interpretation of verbal expressions. The application of triangular fuzzy numbers to quantify the linguistic variable requires a definition of its domain. The examples of the linguistic variable expressed as the triangular fuzzy num-bers with their graphic interpretation are presented in Table 1 and Figure 2.
Figure 2. Triangular fuzzy numbers with shape parameters
(a,b,c)
Source: Bartkiewicz (2000) p. 83.
TABLE I. AN EXAMPLE OF DEFINITION OF THE TRIANGULAR FUZZY NUMBER DOMAIN
(SCALE 0–100, IDENTICAL WIDTH INTERVALS, NON -OVERLAPPING
INTERVALS)
Equivalent number (a, b, c)
Linguistic variable
Very low (0, 0, 20)
Low (20, 30, 40)
Medium (40, 50, 60)
High (60, 70, 80)
Very high (80, 100, 100)
Source: Chang, Yeh, (2004).
a for technical reasons, the first and last fuzzy number has (forced by re-
searcher) shape of rectangular triangle.
J. Dziechciarz et al. Fuzzy Measurement for Durable Goods Market Segmentation Title
– 18 –
In subject literature, numerous proposals for defining nu-merical equivalents for the linguistic variables are given, including singleton, triangular, trapezoidal, and bell-shaped fuzzy numbers (see, e.g. [8]). The definitions of domains of triangular fuzzy numbers might vary in the width of the in-dividual levels (e.g. identical widths, non-identical widths), their infiltration level (e.g. levels do not overlap, or with overlapping levels) and the scale of fuzzy number, e.g. [0, 1], [0, 10] [0, 100] (see: [34] and [61].
The figure 2 contains an illustration of possible answers coming from respondents. Some of them will choose non-overlapping fuzzy numbers (a, b, c); some of them will give overlapping statements.
Additionally, for some respondents the definitions of do-mains of triangular fuzzy numbers might vary in the width of the individual levels (e.g. identical widths, nonidentical widths). Also, some respondents will define symmetrical and others nonsymmetrical triangular fuzzy numbers. For the researcher, there is one more difficult decision to make. One has to choose a representation of the fuzzy number for the analysis. The list of possible solutions includes the range, arithmetic mean, median or some other characteris-tics.
V. THE SURVEY RESEARCH
The survey research was conducted in the first quarter of the year 2015. It included 451 full-time and part-time stu-dents of the University of Economics in Wroclaw (the set of respondents was selected using the convenience ap-proach (see reference [10], pp. 497–500.) Therefore, the de-scribed study should be considered a pilot study and was conducted in order to test the possibility of an application of the proposed approach. The questionnaire covered the issues regarding the ownership of smartphones, as well as
the preferences of the respondents for the selected smartphone brands.
Additionally, the possible smartphones’ applications and the most important characteristics of the devices were of interest. The respondents were young people, 68% were not yet 21 years old, and only 7% were older than 24 years. The majority in the analysed student group were women (63.2%). About 40% of the respondents at the time of the study were employed (full-time or part-time). A similar group (45%) stated that they did not work, and 15% indi-cated casual employment. The respondents evaluated their financial situation relatively well: over 70% considered their situation as good or very good. Only about 5% of the respondents rated their living conditions as unsatisfactory (poor and very poor financial situation). In the selected group of students over 89% owned at least one smartphone, 6% intend to purchase the device in the near future, while another 2% admitted to the lack of possibility of purchasing the smartphone due to financial constraints. Barely about 3% of the respondents declared a total lack of interest in this device. In the analysed group of respondents, the own-ership of the durable product in question was similar to that in the analogical age group (20–29 years) for the entire Polish population, where 88% declared to be users of smartphones (see reference [45]). Students are not only fre-quent owners of smartphones, but they can also be regarded as the current and future consumers. For this reason, their preferences for brands of smartphones are very interesting research issue from a practical point of view.
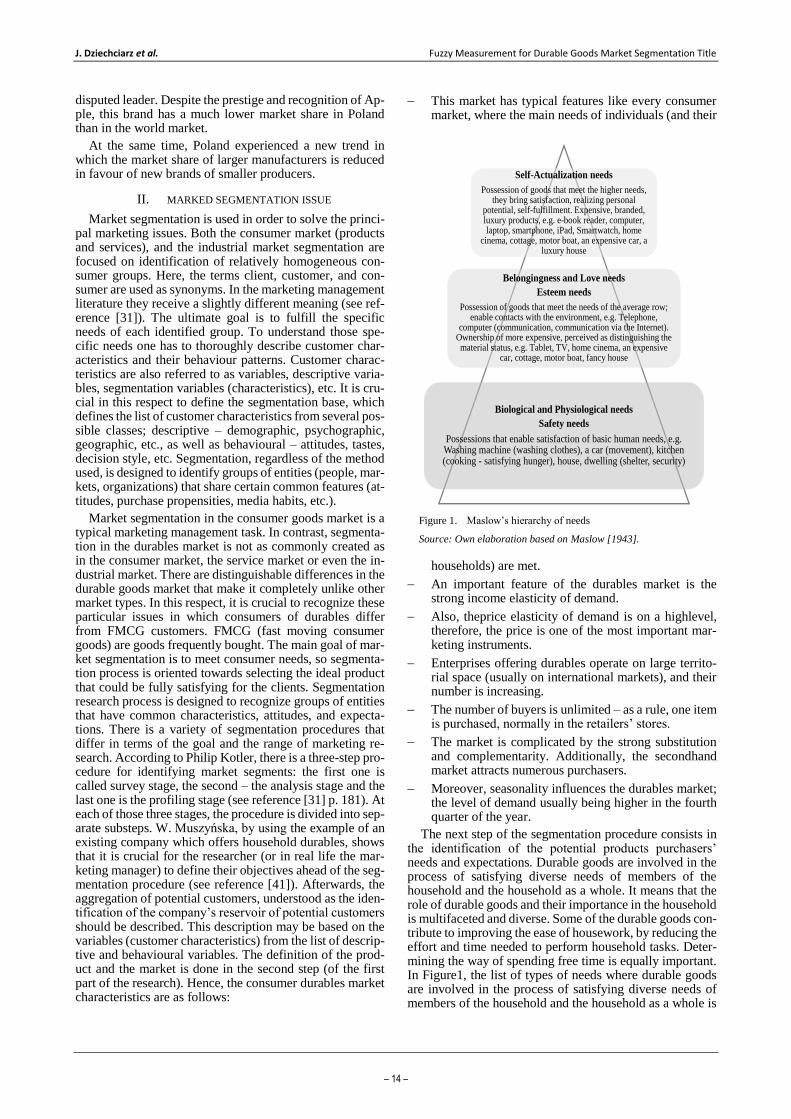
The presented research attempted to investigate consum-ers’ preferences for smartphones, in particular in regard to various technical characteristics, such as screen size and resolution, internal memory and operating system. Among the surveyed students small devices were the least popular,
smartphones with screen size smaller than 4'' would be the
Figure 3. Preferences for screen size (in %)
Source: own elaboration.
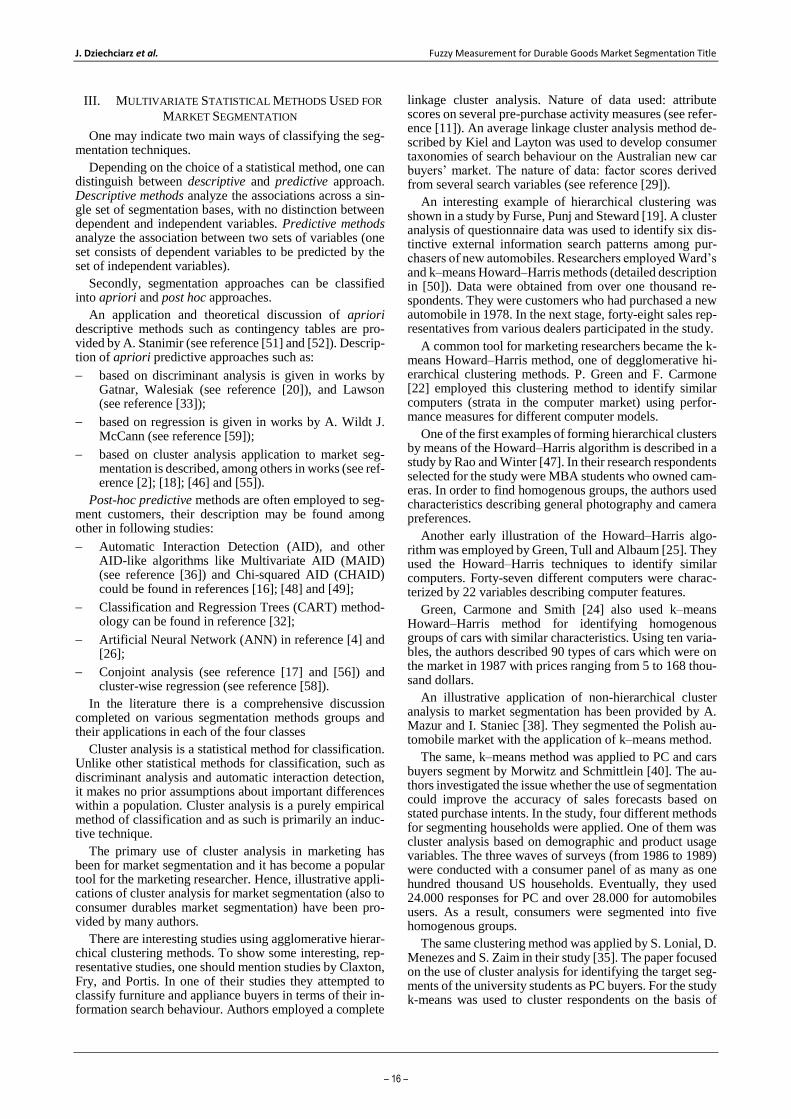
Figure 4. Preference for screen resolution (in %)
Source: own elaboration.
Figure 1. Figure 2.
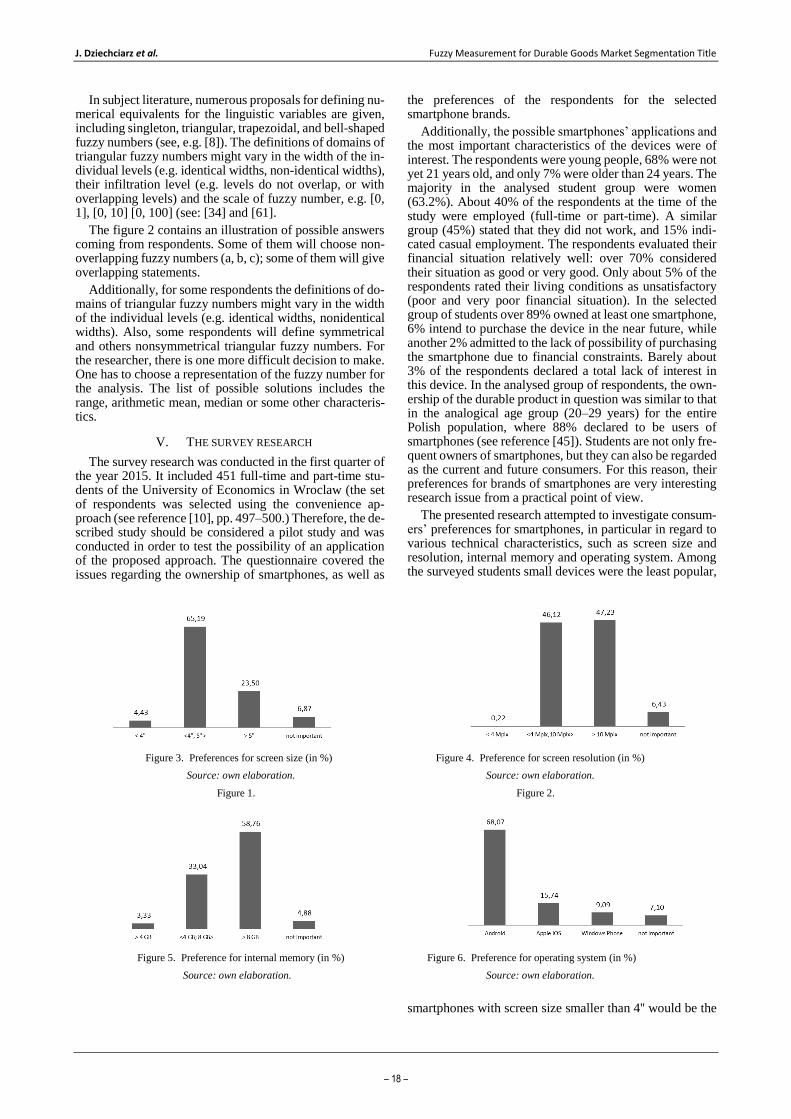
Figure 5. Preference for internal memory (in %)
Source: own elaboration.
Figure 6. Preference for operating system (in %)
Source: own elaboration.
Óbuda University e-Bulletin Vol. 8, No. 3, 2018
– 19 –
best choice for only 4.4% of the respondents. Smartphones screen sizes from 4'' to 5'' were the most popular (65.2% preferred this size). Smartphones with the largest screens (above 5'') proved to be highly desirable as well (23.5%). Less than 7% of the respondents declared that the screen size is not a significant criterion in the purchase decision process (Figure 3). Similar results were observed in the case of screen resolution; more than 6% of the group believes that this feature is not an essential criterion for the selection of smartphone. The least popular proved to be the smartphones with the lowest resolution (less than 4 mega-pixels). More than 46% would choose a smartphone with a resolution of 4–10 megapixels, while about 47% stated the preference for a screen resolution higher than 10 megapix-els (Figure 4). In the case of internal memory, devices with
storage over 8 GB proved to be the most popular (about 60% of the respondents).
Almost no one would buy a smartphone with the lowest internal memory (up to 4GB). About one third preferred the memory storage from 4 to 8 GB. Again, less than 5% of the group declared that the internal memory is not an essential criterion for the selection of the device (Figure 5). By far the most popular operating system was Android (68.1%). Almost 16% of the students in the group would choose a device running on Apple's iOS. Windows Phone was the desired operating system for just over 9% of users. More than 7% of the group declared that the operating system is not an essential criterion for the selection of the device (Fig-ure 6).
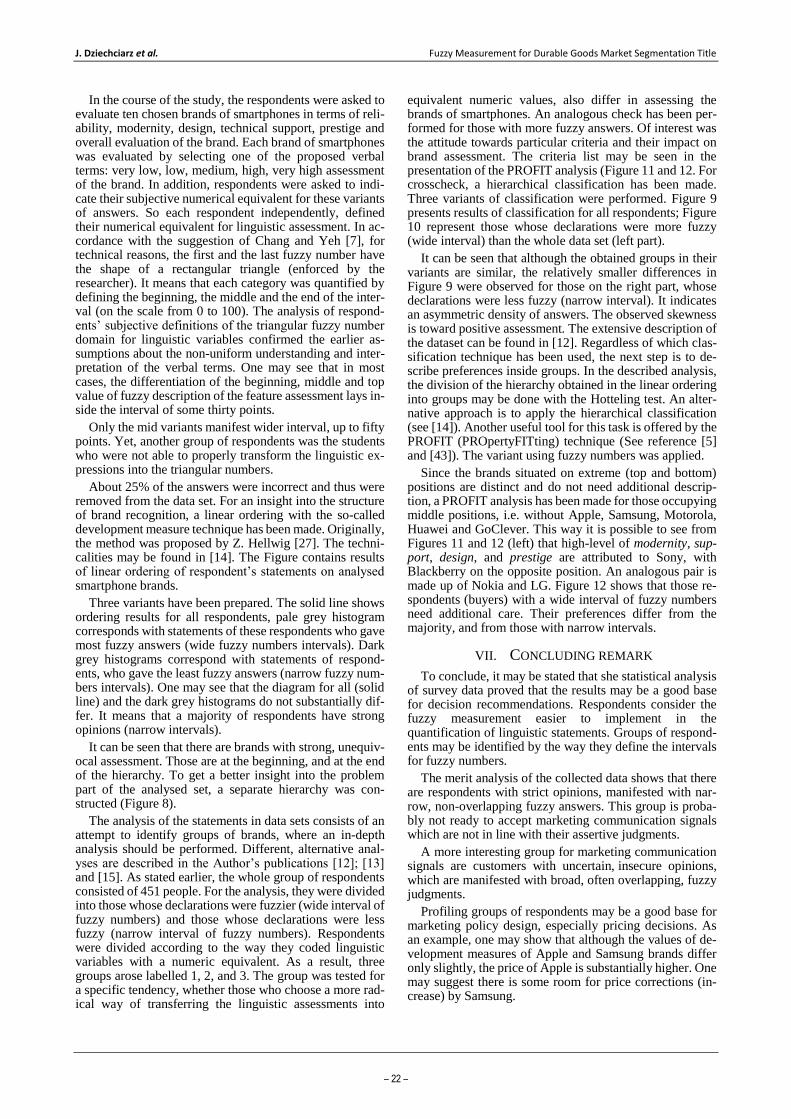
TABLE II THE FREQUENCY (IN %) OF ANSWERS DEFINING BEGIN, MIDDLE AND TOP VALUE OF FUZZY DESCRIPTION OF THE FEATURE ASSESSMENT VARIANT
Source: own calculation on collected data.
Note: the first and last fuzzy number has (forced by researcher) shape of rectangular triangle.
Frequency
% a, b c a b c a b c a b c a b, c
0 100 2 0 0 0 0 0 0 0 0 0 0 0
10 0 13 22 0 0 0 0 0 0 0 0 0 0
20 0 54 57 16 2 6 0 0 1 0 0 0 0
30 0 20 16 56 17 18 1 0 3 0 0 0 0
40 0 7 4 21 46 47 12 2 2 1 0 0 0
50 0 3 1 5 25 24 55 9 9 3 0 1 0
60 0 1 0 0 2 3 11 6 5 1 0 1 0
70 0 0 0 1 4 2 18 48 47 13 2 2 0
80 0 0 0 0 2 0 3 26 28 49 9 8 0
90 0 0 0 0 2 0 0 5 5 25 50 49 0
100 0 0 0 0 1 0 0 3 0 8 39 39 100
Very low Low Medium High Very high
Linguistic variable Very low Low Medium High Very high
Graphic illustration for
example of respondent’s
answer with overlapping fuzzy numbers (a, b, c)
(0; 0; 30) (20; 30; 40) (20; 50; 85) (55; 85; 95) (70; 100; 100)
Graphic illustration for
example of respondent’s answer with non-overlap-
ping fuzzy numbers (a, b,
c)
(0; 0; 20) (20; 30; 40) (40; 50; 65) (65; 80; 85) (70; 100; 100)
Figure 7. Examples of respondents’ subjective definitions of the triangular fuzzy number domain for linguistic variable: non-overlapping inter-
vals and strongly overlapping middle intervals Triangular fuzzy numbers with shape parameters (a,b,c)
Source: own elaboration.
0 10 20 30 40 50 60 70 80 90 100
Very low (VL) Low (L) Medium (M) High (H) Very high (VH)
0 10 20 30 40 50 60 70 80 90 100
Very low (VL) Low (L) Medium (M) High (H) Very high (VH)
J. Dziechciarz et al. Fuzzy Measurement for Durable Goods Market Segmentation Title
– 20 –
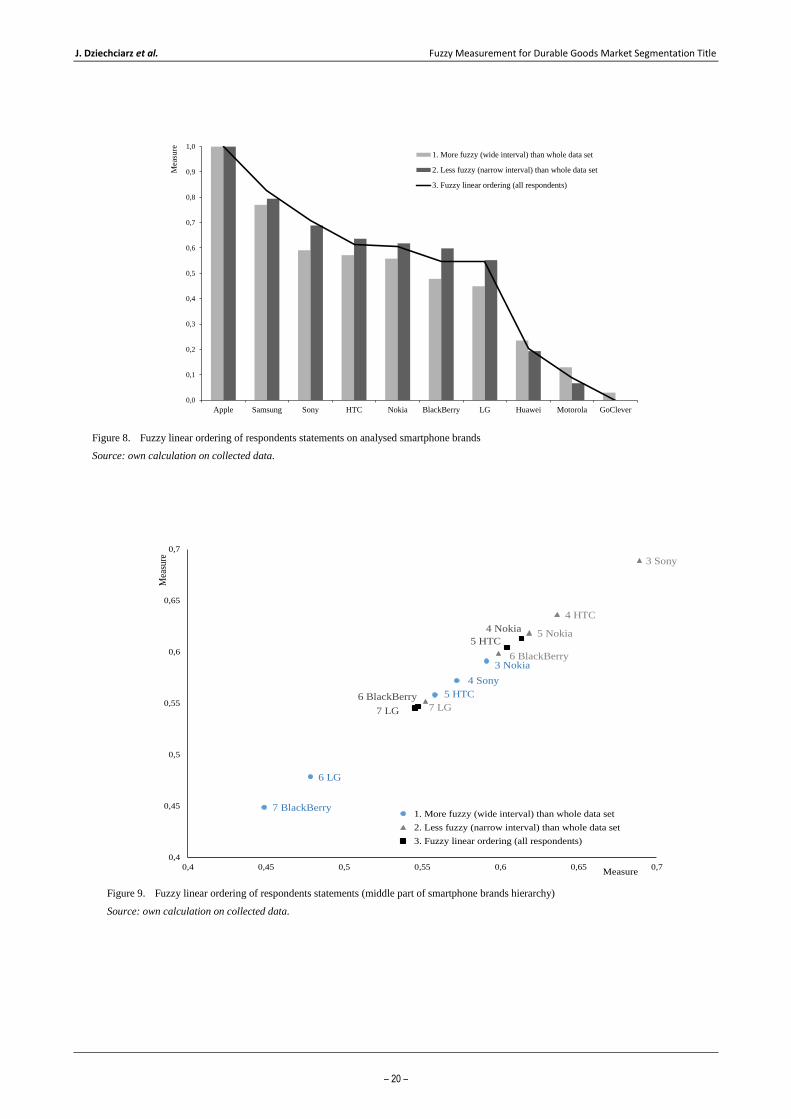
Figure 8. Fuzzy linear ordering of respondents statements on analysed smartphone brands
Source: own calculation on collected data.
0,0
0,1
0,2
0,3
0,4
0,5
0,6
0,7
0,8
0,9
1,0
Apple Samsung Sony HTC Nokia BlackBerry LG Huawei Motorola GoClever
Mea
sure
1. More fuzzy (wide interval) than whole data set
2. Less fuzzy (narrow interval) than whole data set
3. Fuzzy linear ordering (all respondents)
Figure 9. Fuzzy linear ordering of respondents statements (middle part of smartphone brands hierarchy)
Source: own calculation on collected data.
3 Nokia
4 Sony
5 HTC
6 LG
7 BlackBerry
3 Sony
4 HTC
5 Nokia
6 BlackBerry
7 LG
4 Nokia
5 HTC
6 BlackBerry
7 LG
0,4
0,45
0,5
0,55
0,6
0,65
0,7
0,4 0,45 0,5 0,55 0,6 0,65 0,7
Mea
sure
Measure
1. More fuzzy (wide interval) than whole data set
2. Less fuzzy (narrow interval) than whole data set
3. Fuzzy linear ordering (all respondents)
Óbuda University e-Bulletin Vol. 8, No. 3, 2018
– 21 –
VI. THE ANALYSIS
Sony
Nokia
HTC
LG
BlackBerry
-1,2 -1,0 -0,8 -0,6 -0,4 -0,2 0,0 0,2 0,4 0,6 0,8 1,0 1,2 1,4 1,6
Dimension 1
-1,0
-0,8
-0,6
-0,4
-0,2
0,0
0,2
0,4
0,6
0,8
1,0
Dim
en
sio
n 2
Reliability
Modernity
Design
Support
Prestige
General
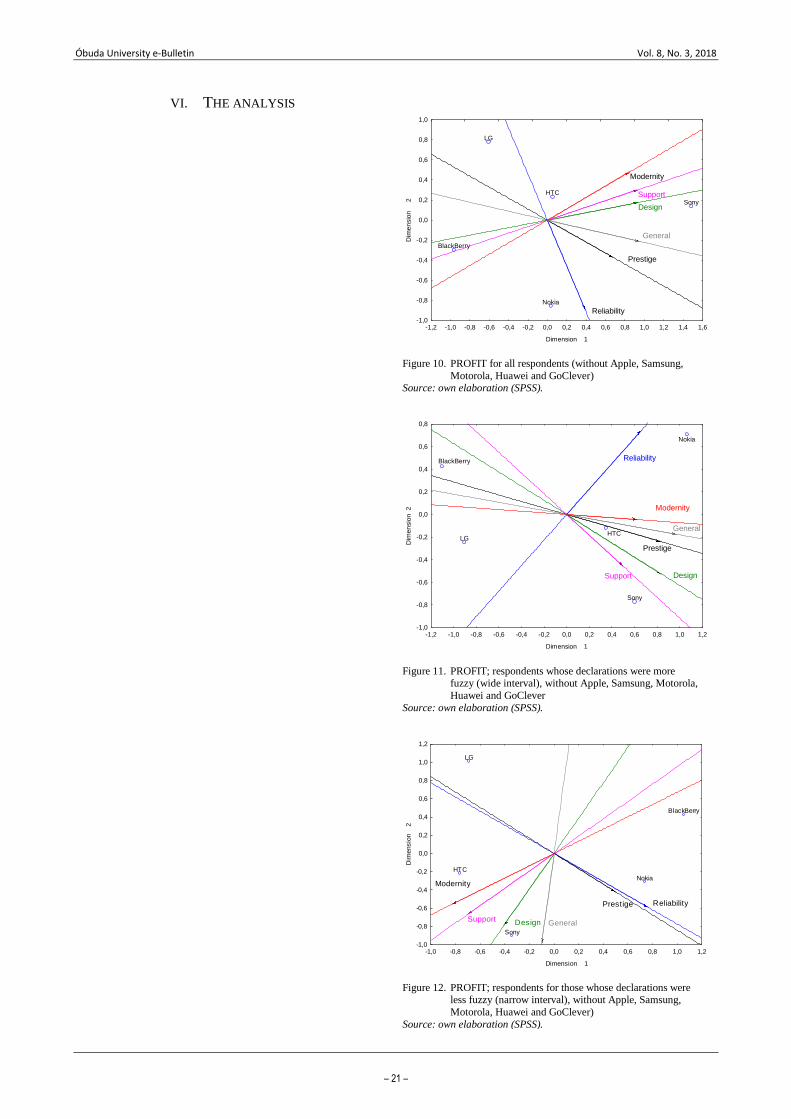
Figure 10. PROFIT for all respondents (without Apple, Samsung,
Motorola, Huawei and GoClever) Source: own elaboration (SPSS).
Sony
LG
-1,2 -1,0 -0,8 -0,6 -0,4 -0,2 0,0 0,2 0,4 0,6 0,8 1,0 1,2
Dimension 1
-1,0
-0,8
-0,6
-0,4
-0,2
0,0
0,2
0,4
0,6
0,8
Dim
en
sio
n 2
Nokia
HTC
BlackBerry Reliability
Modernity
DesignSupport
Prestige
General
Figure 11. PROFIT; respondents whose declarations were more fuzzy (wide interval), without Apple, Samsung, Motorola,
Huawei and GoClever
Source: own elaboration (SPSS).
Sony
Nokia
HTC
LG
BlackBerry
-1,0 -0,8 -0,6 -0,4 -0,2 0,0 0,2 0,4 0,6 0,8 1,0 1,2
Dimension 1
-1,0
-0,8
-0,6
-0,4
-0,2
0,0
0,2
0,4
0,6
0,8
1,0
1,2
Dim
ensio
n
2
Reliability
Modernity
DesignSupport
Prestige
General
Figure 12. PROFIT; respondents for those whose declarations were less fuzzy (narrow interval), without Apple, Samsung,
Motorola, Huawei and GoClever)
Source: own elaboration (SPSS).
J. Dziechciarz et al. Fuzzy Measurement for Durable Goods Market Segmentation Title
– 22 –
In the course of the study, the respondents were asked to evaluate ten chosen brands of smartphones in terms of reli-ability, modernity, design, technical support, prestige and overall evaluation of the brand. Each brand of smartphones was evaluated by selecting one of the proposed verbal terms: very low, low, medium, high, very high assessment of the brand. In addition, respondents were asked to indi-cate their subjective numerical equivalent for these variants of answers. So each respondent independently, defined their numerical equivalent for linguistic assessment. In ac-cordance with the suggestion of Chang and Yeh [7], for technical reasons, the first and the last fuzzy number have the shape of a rectangular triangle (enforced by the researcher). It means that each category was quantified by defining the beginning, the middle and the end of the inter-val (on the scale from 0 to 100). The analysis of respond-ents’ subjective definitions of the triangular fuzzy number domain for linguistic variables confirmed the earlier as-sumptions about the non-uniform understanding and inter-pretation of the verbal terms. One may see that in most cases, the differentiation of the beginning, middle and top value of fuzzy description of the feature assessment lays in-side the interval of some thirty points.
Only the mid variants manifest wider interval, up to fifty points. Yet, another group of respondents was the students who were not able to properly transform the linguistic ex-pressions into the triangular numbers.
About 25% of the answers were incorrect and thus were removed from the data set. For an insight into the structure of brand recognition, a linear ordering with the so-called development measure technique has been made. Originally, the method was proposed by Z. Hellwig [27]. The techni-calities may be found in [14]. The Figure contains results of linear ordering of respondent’s statements on analysed smartphone brands.
Three variants have been prepared. The solid line shows ordering results for all respondents, pale grey histogram corresponds with statements of these respondents who gave most fuzzy answers (wide fuzzy numbers intervals). Dark grey histograms correspond with statements of respond-ents, who gave the least fuzzy answers (narrow fuzzy num-bers intervals). One may see that the diagram for all (solid line) and the dark grey histograms do not substantially dif-fer. It means that a majority of respondents have strong opinions (narrow intervals).
It can be seen that there are brands with strong, unequiv-ocal assessment. Those are at the beginning, and at the end of the hierarchy. To get a better insight into the problem part of the analysed set, a separate hierarchy was con-structed (Figure 8).
The analysis of the statements in data sets consists of an attempt to identify groups of brands, where an in-depth analysis should be performed. Different, alternative anal-yses are described in the Author’s publications [12]; [13] and [15]. As stated earlier, the whole group of respondents consisted of 451 people. For the analysis, they were divided into those whose declarations were fuzzier (wide interval of fuzzy numbers) and those whose declarations were less fuzzy (narrow interval of fuzzy numbers). Respondents were divided according to the way they coded linguistic variables with a numeric equivalent. As a result, three groups arose labelled 1, 2, and 3. The group was tested for a specific tendency, whether those who choose a more rad-ical way of transferring the linguistic assessments into
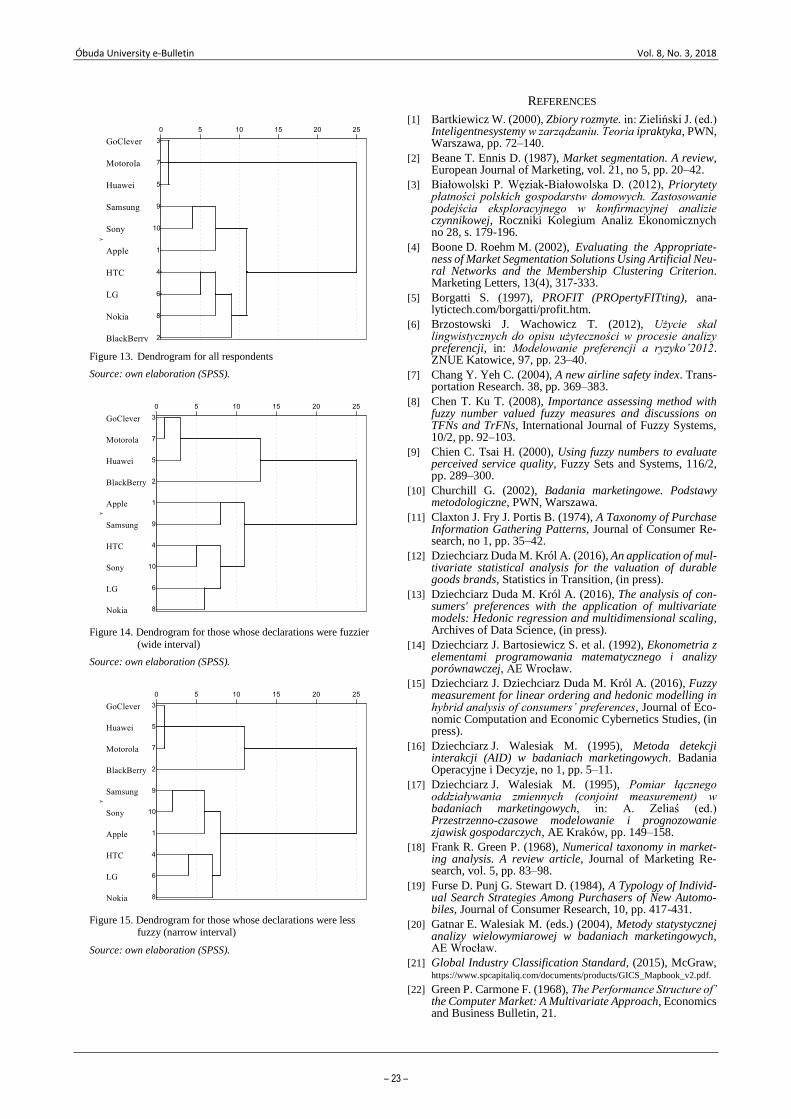
equivalent numeric values, also differ in assessing the brands of smartphones. An analogous check has been per-formed for those with more fuzzy answers. Of interest was the attitude towards particular criteria and their impact on brand assessment. The criteria list may be seen in the presentation of the PROFIT analysis (Figure 11 and 12. For crosscheck, a hierarchical classification has been made. Three variants of classification were performed. Figure 9 presents results of classification for all respondents; Figure 10 represent those whose declarations were more fuzzy (wide interval) than the whole data set (left part).
It can be seen that although the obtained groups in their variants are similar, the relatively smaller differences in Figure 9 were observed for those on the right part, whose declarations were less fuzzy (narrow interval). It indicates an asymmetric density of answers. The observed skewness is toward positive assessment. The extensive description of the dataset can be found in [12]. Regardless of which clas-sification technique has been used, the next step is to de-scribe preferences inside groups. In the described analysis, the division of the hierarchy obtained in the linear ordering into groups may be done with the Hotteling test. An alter-native approach is to apply the hierarchical classification (see [14]). Another useful tool for this task is offered by the PROFIT (PROpertyFITting) technique (See reference [5] and [43]). The variant using fuzzy numbers was applied.
Since the brands situated on extreme (top and bottom) positions are distinct and do not need additional descrip-tion, a PROFIT analysis has been made for those occupying middle positions, i.e. without Apple, Samsung, Motorola, Huawei and GoClever. This way it is possible to see from Figures 11 and 12 (left) that high-level of modernity, sup-port, design, and prestige are attributed to Sony, with Blackberry on the opposite position. An analogous pair is made up of Nokia and LG. Figure 12 shows that those re-spondents (buyers) with a wide interval of fuzzy numbers need additional care. Their preferences differ from the majority, and from those with narrow intervals.
VII. CONCLUDING REMARK
To conclude, it may be stated that she statistical analysis of survey data proved that the results may be a good base for decision recommendations. Respondents consider the fuzzy measurement easier to implement in the quantification of linguistic statements. Groups of respond-ents may be identified by the way they define the intervals for fuzzy numbers.
The merit analysis of the collected data shows that there are respondents with strict opinions, manifested with nar-row, non-overlapping fuzzy answers. This group is proba-bly not ready to accept marketing communication signals which are not in line with their assertive judgments.
A more interesting group for marketing communication signals are customers with uncertain, insecure opinions, which are manifested with broad, often overlapping, fuzzy judgments.
Profiling groups of respondents may be a good base for marketing policy design, especially pricing decisions. As an example, one may show that although the values of de-velopment measures of Apple and Samsung brands differ only slightly, the price of Apple is substantially higher. One may suggest there is some room for price corrections (in-crease) by Samsung.
Óbuda University e-Bulletin Vol. 8, No. 3, 2018
– 23 –
REFERENCES
[1] Bartkiewicz W. (2000), Zbiory rozmyte. in: Zieliński J. (ed.) Inteligentnesystemy w zarządzaniu. Teoria ipraktyka, PWN, Warszawa, pp. 72–140.
[2] Beane T. Ennis D. (1987), Market segmentation. A review, European Journal of Marketing, vol. 21, no 5, pp. 20–42.
[3] Białowolski P. Węziak-Białowolska D. (2012), Priorytety płatności polskich gospodarstw domowych. Zastosowanie podejścia eksploracyjnego w konfirmacyjnej analizie czynnikowej, Roczniki Kolegium Analiz Ekonomicznych no 28, s. 179-196.
[4] Boone D. Roehm M. (2002), Evaluating the Appropriate-ness of Market Segmentation Solutions Using Artificial Neu-ral Networks and the Membership Clustering Criterion. Marketing Letters, 13(4), 317-333.
[5] Borgatti S. (1997), PROFIT (PROpertyFITting), ana-lytictech.com/borgatti/profit.htm.
[6] Brzostowski J. Wachowicz T. (2012), Użycie skal lingwistycznych do opisu użyteczności w procesie analizy preferencji, in: Modelowanie preferencji a ryzyko’2012. ZNUE Katowice, 97, pp. 23–40.
[7] Chang Y. Yeh C. (2004), A new airline safety index. Trans-portation Research. 38, pp. 369–383.
[8] Chen T. Ku T. (2008), Importance assessing method with fuzzy number valued fuzzy measures and discussions on TFNs and TrFNs, International Journal of Fuzzy Systems, 10/2, pp. 92–103.
[9] Chien C. Tsai H. (2000), Using fuzzy numbers to evaluate perceived service quality, Fuzzy Sets and Systems, 116/2, pp. 289–300.
[10] Churchill G. (2002), Badania marketingowe. Podstawy metodologiczne, PWN, Warszawa.
[11] Claxton J. Fry J. Portis B. (1974), A Taxonomy of Purchase Information Gathering Patterns, Journal of Consumer Re-search, no 1, pp. 35–42.
[12] Dziechciarz Duda M. Król A. (2016), An application of mul-tivariate statistical analysis for the valuation of durable goods brands, Statistics in Transition, (in press).
[13] Dziechciarz Duda M. Król A. (2016), The analysis of con-sumers' preferences with the application of multivariate models: Hedonic regression and multidimensional scaling, Archives of Data Science, (in press).
[14] Dziechciarz J. Bartosiewicz S. et al. (1992), Ekonometria z elementami programowania matematycznego i analizy porównawczej, AE Wrocław.
[15] Dziechciarz J. Dziechciarz Duda M. Król A. (2016), Fuzzy measurement for linear ordering and hedonic modelling in hybrid analysis of consumers’ preferences, Journal of Eco-nomic Computation and Economic Cybernetics Studies, (in press).
[16] Dziechciarz J. Walesiak M. (1995), Metoda detekcji interakcji (AID) w badaniach marketingowych. Badania Operacyjne i Decyzje, no 1, pp. 5–11.
[17] Dziechciarz J. Walesiak M. (1995), Pomiar łącznego oddziaływania zmiennych (conjoint measurement) w badaniach marketingowych, in: A. Zeliaś (ed.) Przestrzenno-czasowe modelowanie i prognozowanie zjawisk gospodarczych, AE Kraków, pp. 149–158.
[18] Frank R. Green P. (1968), Numerical taxonomy in market-ing analysis. A review article, Journal of Marketing Re-search, vol. 5, pp. 83–98.
[19] Furse D. Punj G. Stewart D. (1984), A Typology of Individ-ual Search Strategies Among Purchasers of New Automo-biles, Journal of Consumer Research, 10, pp. 417-431.
[20] Gatnar E. Walesiak M. (eds.) (2004), Metody statystycznej analizy wielowymiarowej w badaniach marketingowych, AE Wrocław.
[21] Global Industry Classification Standard, (2015), McGraw, https://www.spcapitaliq.com/documents/products/GICS_Mapbook_v2.pdf.
[22] Green P. Carmone F. (1968), The Performance Structure of’ the Computer Market: A Multivariate Approach, Economics and Business Bulletin, 21.
Figure 13. Dendrogram for all respondents
Source: own elaboration (SPSS).
Figure 14. Dendrogram for those whose declarations were fuzzier
(wide interval)
Source: own elaboration (SPSS).
Figure 15. Dendrogram for those whose declarations were less fuzzy (narrow interval)
Source: own elaboration (SPSS).
J. Dziechciarz et al. Fuzzy Measurement for Durable Goods Market Segmentation Title
– 24 –
[23] Green P. Carmone F. (1977), Segment congruence analysis: a method for analysing association among alternative bases for market segmentation, Journal of Consumer Research, vol. 3, pp. 217–222.
[24] Green P. Carmone F. Smith S. (1989), Multidimensional scaling. Concepts and applications, Allyn and Bacon, Lon-don.
[25] Green P. Tull D. Albaum G. (1988), Research for marketing decisions, PrenticeHall, Englewood Cliffs.
[26] Gyan B. Voges K. Pope N. (2004) Artificial Neural Net-works in Marketing from 1999 to 2003: A Region of Origin and Topic Area Analysis, ANZMAC 2004 Proceedings, Victoria University, Wellington, New Zealand.
[27] Hellwig Z. (1972), Procedure of evaluating high level man-power. Data and typology of countries by means of the tax-onomic method, in: Gostkowski Z. ed. Towards a system of human resources indicators for less developed countries, Ossolineum; Wrocław.
[28] Hruschka H. (1986), Market definition and segmentation us-ing fuzzy clustering methods, International Journal of Re-search in Marketing, no 3, pp. 117–134.
[29] Kiel G. Layton R. (1981), Dimensions of consumer infor-mation seeking behavior. Journal of Marketing Research, 18, 233-239.
[30] Kim C. (1989), Working Wives’ Timesaving Techniques: Durable Ownership, Convenience Food Consumption, and Meal Purchases, Journal of Economic Psychology, 10, 3, pp. 391-409;
[31] Kotler P. (2000), Marketing Management Milenium Edition, Tenth Edition, PrenticeHall, Boston.
[32] Kurzydłowski A. (2002), Klasyfikacja nabywców czekolady z wykorzystaniem algorytmów CHAID i C&RT, Taksonomia 9, Wrocław, pp. 258–271.
[33] Lawson R. (1980), Discriminant analysis – an aid to market segment description, European Journal of Marketing, vol. 14, no 7, pp. 387–396.
[34] Liou T. Wang M. Subjective assessment of mental work-load. A fuzzy linguistic multi-criteria approach, Fuzzy Sets and Systems, 62/2/1994, pp. 155–165.
[35] Lonial S. Menezes D. Zaim S. (2000), Identifying Purchase Driving Attributes and Market Segments for PCs Using Conjoint and Cluster Analysis Journal of Economic and Social Research 2(2), pp. 19-37.
[36] MacLachlan D. Johansson J. (1981), Market segmentation with multivariate aid, Journal of Marketing, vol. 45, pp. 74–84.
[37] Maslow A. (1943), A theory of human motivation Psycho-logical Review 50 (4) 370–396; psychclassics.yorku.ca.
[38] Mazur A. Staniec I. (2000) Inne metody klasyfikacji. Materiały konferencyjne. VII Krajowa Konferencja Komputerowe Wspomaganie Badań Naukowych, Polanica Zdrój, pp. 171-176.
[39] Morgan J. Housing and Ability to Pay (1965), Economet-rica, 33, pp. 289-306;
[40] Morwitz V. Schmittlein D. (1992), Using segmentation to improve sales forecasts based on purchase intent. Which “intenders” actually buy?, Journal of Marketing Research, vol. 29, no 4, pp. 391–405.
[41] Muszyńska W. (1999), Procedura segmentacji rynku dóbr trwałego użytkowania, in: Mazurek–Łopacińska K. (ed.) Badania marketingowe. Podstawowe metody i obszary zastosowań, AE Wroclaw, Wroclaw, pp. 237 – 242.
[42] Nickols S. Fox K. (1983), Buying time and saving time: Strategies for Managing Household Production, Journal of Consumer Research, 10, 197-208;
[43] Opitz O. Hilbert A. Visualization of Multivariate Data by Scaling and Property Fitting, in: Gaul W. eds. Data Analysis, Springer, Berlin, 2000, pp. 505–514.
[44] Piegat A. (1999) Modelowanie i sterowanie rozmyte. EXIT, Warszawa.
[45] Polska jest MOBI, 2015, www.tnsglobal.pl/coslychac/files/2015/05/polska_jest_mobi_2015.pdf.
[46] Punj G. Stewart D. (1983), Cluster analysis in marketing re-search. Review and suggestions for application, Journal of Marketing Research, vol. 20, pp. 134–148.
[47] Rao V. Winter F. (1978), An application of the multivariate probit model for market segmentation and product design, Journal of Marketing Research, vol. 15, pp. 361–368.
[48] Rószkiewicz M. (2002), Metody ilościowe w badaniach marketingowych, PWN, Warszawa.
[49] Rószkiewicz M. (2002), Narzędzia statystyczne w analizach marketingowych, Beck, Warszawa.
[50] Skiadas C. (2010) Advances in Data Analysis. Theory and Applications to Reliability and Inference. Data Mining. Bi-oinformatics, Lifetime Data and Neural Networks, Birkhau-ser, Berlin.
[51] Stanimir A. (2001), Analiza korespondencji, jako metoda wyodrębniania segmentów rynku, in: Taksonomia 8, Wrocław, pp. 118–128.
[52] Stanimir A. (ed.) (2006), Analiza danych marketingowych. Problemy, metody, przykłady, AE Wrocław.
[53] Stevens S. (1959), Measurement, psychophysics and utility, in: Churchman C. Ratoosh P. (eds.) Measurement; defini-tions and theories, Wiley, New York, pp. 18–61.
[54] Strober M. Weinberg C. Strategies Used by Working and Non-Working Wives to Reduce Time Pressures, Journal of Consumer Research, 6, 1980, pp. 338-348.
[55] Walesiak M. (1996), Metody analizy danych marketingowych, PWN, Warszawa.
[56] Walesiak M. Bąk A.(2000), Conjoint analysis w badaniach marketingowych, AE Wrocław.
[57] Wedel M. Kamakura W. (1998), Market Segmentation. Conceptual and Methodological Foundations, Kluwer, Bos-ton, pp. 7-16.
[58] Wedel M. Kistemaker C. (1989), Consumer benefit segmen-tation using clusterwise linear regression, International Journal of Research in Marketing, tom 6, s. 45–59.
[59] Wildt A. McCann J. (1980), A regression model for market segmentation studies, Journal of Marketing Research, vol. 17 pp. 335–340.
[60] Winner R. A (1985) Revised Behavioural Model of Con-sumer Durable Demand, Journal of Economic Psychology, 6 (2) pp. 175–184.
[61] Yang T. Hung C. (2007), Multiple-attributedecision making methods for plant layout design problem, Robotics and Computer Integrated Manufacturing, 23/1, pp. 126–137.
[62] Zaborski A. (2000), Przykłady zastosowań skalowania wielowymiarowego w badaniach marketingowych, in: M. Walesiak (ed.), Pomiar w badaniach rynkowych i marketingowych, AE Wrocław, pp. 101–111.
[63] Zadeh L. (1965), Fuzzy sets, Information and Control, no 8.
[64] Zadeh L. (1975), The concept of a linguistic variable and its application to approximate reasoning. Information Sci-ences, Part I: 8, pp. 199–249; Part II, 1975, pp. 301–357.