Embed Size (px)
Citation preview
11
Fuzzy Inference Systems Applied to Image Classification in the Industrial Field
Silvia Cateni, Valentina Colla, Marco Vannucci and Alice Borselli Scuola Superiore S. Anna, TeCIP Institute, Pisa
Italy
1. Introduction
In the last years many industries have increased the exploitation of vision systems applied to several fields. This fact is basically due to the technological progress that has been reached by these systems: the reliability of vision systems allows the industries to achieve considerable cost savings in terms of both material and human resources.
Among the most important applications of vision systems in the industrial field there are robot positioning and driving, code reading, non contact measuring as well as quality control and monitoring.
In particular quality controls are nowadays performed through vision systems in many
industries; these systems guarantee reliability comparable and sometimes greater with
respect to human operators, especially for a large quantity of products. In fact, vision-based
automatic inspection systems allow to process a huge amount of data in a very small time
with respect to human performance.
The vision systems are usually composed by several components: a set of cameras to capture
the images, an illumination system and a system for the image processing and classification.
These systems are able to capture images of a wide range of products in order to find defects
which do not fit the quality standards of the considered industrial production process.
The present chapter deals with the application of Fuzzy Inference Systems (FIS) for the classification of images, once they have been pre-processed through suitable algorithms. One of the main reasons for exploiting a FIS to this aim lies in the possibility of approaching the problem in a way similar to human reasoning. In fact a FIS allows:
To describe the problem in linguistic terms;
To translate the human experience (which is very often the reference starting point in industrial applications) through inference rules. The possibility of providing a methodological description in linguistic terms is a great advantage in problems that cannot be solved in terms of precise numerical relations, especially when only empirical a priori knowledge is available.
To perform an eventual further adaptation of the rules of the inference machine by exploiting the available data, as a neural training algorithm can be applied to tune some parameters of the fuzzy classifier.
www.intechopen.com
Fuzzy Inference System – Theory and Applications 244
Moreover, FIS-based classifiers provide the further advantage of a great flexibility, thanks to the possibility to add rules without affecting the remaining parts of the inference machine.
Clearly the preliminary image processing phase should be developed with the aim to extract the most suitable features from the images to be fed as input to the fuzzy system.
The chapter will be organised as follows: a preliminary generic description of the main features of FIS-based image classifiers will be provided, with a particular focus on those general applications where a preliminary ad-hoc image features extraction phase is included. The advantages and limitations of FIS-based classifiers toward other algorithms will be presented and discussed. Afterwards, some case studies will be proposed, where FIS-based image classifiers are applied in an industrial context.
2. Vision systems
In the last years the use of computer vision systems has enormously increased, especially in the industrial field, for several tasks (Malamas et al., 2003; Chin & Harlow, 1982; Nelson et al., 1996).
Traditionally human experts performed visual inspection and quality control and, in some cases, the human performance are better than the one provided by a machine. On the other hand, human operators are slower than machines, their performance is not constant through time and finding many expert operators is not easy for any industry. Moreover there are several applications where the job may be repetitive and boring (such as target training or robots guidance) or also difficult and dangerous (such as underwater inspection, nuclear industry, chemical industry ...).
Vision system are widely adopted in the control of robots for pick and place operations showing their power in very complex tasks (Sgarbi et al., 2010).
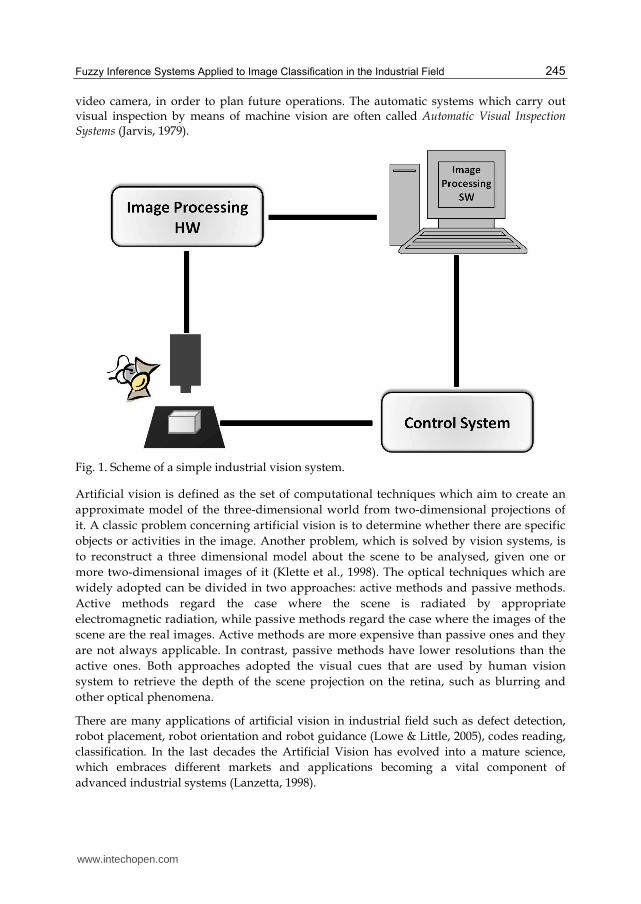
A vision system consists of electronic, optical and mechanical components and it is able to capture, record and process images. Typically it consists of one or more cameras, an optical system, a lighting system, an acquisition system and, finally, an image processing system. The object to be tested is placed in front of cameras and it is properly illuminated. The optical system forms an image on camera sensor which produces in output an electrical signal. Then this signal will be digitized and stored. Finally the image can be analysed with an appropriate software. A general scheme of a typical industrial vision system is shown in Fig.1.
The computational resources are exploited for processing the captured images through suitable analysis and classification software. One or more cameras acquire images under inspection and a lighting system is adopted to illuminate the scene in order to facilitate the acquisition of the image features (Malamas et al., 2003).
The prerequisites for the design and development of a good machine vision system depend on the application field and the task to be reached. An “universal” vision system, i.e. which is capable to fulfil any task in any application, does not exist; only after having established the requirements of the specific application the vision system can be designed.
In the last years computer and machine vision are been connected together for non invasive quality inspection. Machine vision allows to analyse video data, such as data coming from a
www.intechopen.com
Fuzzy Inference Systems Applied to Image Classification in the Industrial Field 245
video camera, in order to plan future operations. The automatic systems which carry out visual inspection by means of machine vision are often called Automatic Visual Inspection Systems (Jarvis, 1979).
Fig. 1. Scheme of a simple industrial vision system.
Artificial vision is defined as the set of computational techniques which aim to create an
approximate model of the three-dimensional world from two-dimensional projections of
it. A classic problem concerning artificial vision is to determine whether there are specific
objects or activities in the image. Another problem, which is solved by vision systems, is
to reconstruct a three dimensional model about the scene to be analysed, given one or
more two-dimensional images of it (Klette et al., 1998). The optical techniques which are
widely adopted can be divided in two approaches: active methods and passive methods.
Active methods regard the case where the scene is radiated by appropriate
electromagnetic radiation, while passive methods regard the case where the images of the
scene are the real images. Active methods are more expensive than passive ones and they
are not always applicable. In contrast, passive methods have lower resolutions than the
active ones. Both approaches adopted the visual cues that are used by human vision
system to retrieve the depth of the scene projection on the retina, such as blurring and
other optical phenomena.
There are many applications of artificial vision in industrial field such as defect detection,
robot placement, robot orientation and robot guidance (Lowe & Little, 2005), codes reading,
classification. In the last decades the Artificial Vision has evolved into a mature science,
which embraces different markets and applications becoming a vital component of
advanced industrial systems (Lanzetta, 1998).
www.intechopen.com

Fuzzy Inference System – Theory and Applications 246
3. Feature extraction procedure from the image
Image processing belongs to the field of signal processing in which input and output signals are both images.
Feature extraction tends to simplify the amount of property required to represent a large set of data correctly. A feature can be defined as a function concerning measurements which represent a property of a considered object (Choras, 2007). Features can be classified as low-level features and high level feature.
The low-level features are the features which can be extracted automatically from image
without any information about the shape. A widely used approach is the so called edge
detection, which is adopted in order to identify points in a digital image at which the image
brightness changes brusquely, also edge detection highlights image contrast. The boundary
of features within an image can be discover detecting contrast as the difference in intensity.
Trucco & Verri (Trucco & Verri, 1998) identified three main steps to perform edge detection:
noise smoothing, edge enhancement and edge localization. Noise smoothing, also called
noise reduction, eliminates noise as much as possible without destroying the edges of the
image. Edge enhancement produces images with large intensity values at edge pixels and
low intensity levels elsewhere. Finally edge localization is used to decide which local
maxima among the filter outputs are effectively edges and are not produced by noise
(Roque et al., 2010).
The Sobel edge detection operator (Sobel, 1970) has been the most popular operator until the improvement of the edge detection techniques having a theoretical basis. It consists of two masks in order to identify the edges under a vector form. The inputs of the Sobel approach include an image I and a threshold t. Once the noise smoothing filters have been applied, the corresponding linear filter is carried out to the new smoothed image by using a pair of 3x3 convolution masks, one estimating the gradient in the x-direction (columns) and other estimating the gradient in the y-direction (rows).
煩−な − に − などどどなにな晩 煩−などな−にどに−などな晩 (1)
The output of the two above defined masks is represented by two images I1 and I2. Through equation (2) the degree of the intensity gradient is estimated for each pixel I(i,j).
喧岫件, 倹岻 = 紐荊怠岫件, 倹岻態 + 荊態岫件, 倹岻態 (2)
Finally the pixels p(i,j) which are greater than the threshold t are identified as edges.
Canny edge detection operator (Canny, 1986) is probably the most popular edge detection
technique at the moment. It is created by taking into account three main purposes:
best possible detection with no spurious responses;
good localisation with minimal distance between detected and effective edge position;
single response to delete multiple responses to a single edge.
The first requirement reduces the response to noise through an optimal smoothing. Canny demonstrated that Gaussian filtering is optimal concerning edge detection. The second
www.intechopen.com

Fuzzy Inference Systems Applied to Image Classification in the Industrial Field 247
requirement is introduced to improve the accuracy, in fact it is used to detect edges in the right position. This result is obtained by a process of non-maximum suppression (similar to peak detection) which maintains only the points that are located at the top of a crest of edge data. Finally the third requirement regards the position of a single edge point when a change in brightness occurs.
High-level features extraction is used to find shapes in computer images. To better understand this approach let us suppose that the image to be analyzed is represented by a human face. If we want to automatically recognise the face, we can extract the component features, for example the eyes, mouth and the nose. To detect them we can exploit their shape information: for instance, we know that the white part of the eye is ellipsoidal and so on. Shape extraction includes finding the position, the orientation and the size. In many applications the analysis can be helped by the way the shape are placed. In face analysis we imagine to find eyes above and the mouth below the nose and so on.
Thresholding is a simple shape extraction technique. It is used when the brightness of the shape is known, in fact pixels forming the shape can be detected categorizing pixels according to a fixed intensity threshold. The main advantage lies in its simplicity and in the fact that it requires a low computational effort but this approach is sensitive to illumination change and this is a considerable limit. When the illumination level changes linearly, the adoption of a histogram equalization would provide an image which does not vary; unfortunately this approach is widely sensitive to noise rendering and again the threshold comparison-based approach is impracticable. An alternative technique consists in the subtraction of the image from the background before applying a threshold comparison; this approach requires the a priori knowledge of the background. Threshold comparison and subtraction have the main advantage to be simple and fast but the performances of both technique are sensitive to partial shape data, noise and variation in illumination.
Another popular shape extraction technique is the so called Template matching, which
consists in matching a template to an image. The template is a sub-image that represents the
shape to be found in the image. The template is centred on an image point and the number
of points that match the points in the image are calculated; the procedure is repeated for the
whole image and points which led to the best match are the candidates to be the point
where the shape is inner the image. Template matching can be seen as a method of
parameter estimation, where parameters define the position of the template but the main
disadvantage of the proposed approach is the high computational cost.
Another popular technique which locates shapes in images is the Hough Transform (Hough,
1962). This method was introduced by Hough to find bubble tracks and subsequently
Rosenfeld (Rosenfeld, 1969) understood its possible advantages as an image processing
method. It is widely used to extract lines, circles and ellipses and its main advantage is that
it is able to reach the same results than template matching approach but is it faster (Princen
et al., 1992). The Hough Transform delineates a mapping from the image points into an
accumulator space called Hough space; the mapping is obtained in a computationally
efficient manner based on the function that represents the target shape. This approach
requires considerable storage and high computational resources but much less than
template matching approach. When the shape to be extracted is more complex than lines
and circles or the image cannot be partitioned into geometric primitive a Generalised Hough
www.intechopen.com
Fuzzy Inference System – Theory and Applications 248
Transform (GHT) approach can be used (Ballard, 1981). GHT can be implemented basing on
the discrete representation given by tabular functions.
4. Industrial quality control
In the field of quality control there are two main elements which play an important role: the
presence of sensors used to capture data, such as signals or images, and the adopted
computational intelligence techniques (Piuri & Scotti, 2005). The quality monitoring includes
the use of signal measurements or machine visual systems in order to allow a standardized
and non-invasive control of industrial production processes. The computational intelligence
techniques comprise the formalisation of the mechanism which allows the extraction of
useful information from the images and its interpretation for the purposes the systems it is
designed for; therefore it may also include components such as neural networks, fuzzy
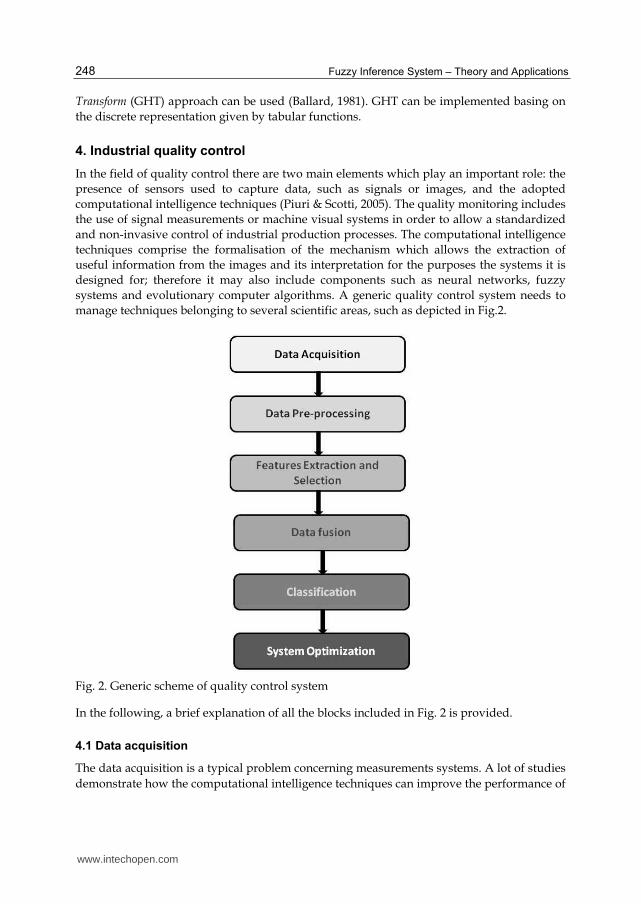
systems and evolutionary computer algorithms. A generic quality control system needs to
manage techniques belonging to several scientific areas, such as depicted in Fig.2.
Fig. 2. Generic scheme of quality control system
In the following, a brief explanation of all the blocks included in Fig. 2 is provided.
4.1 Data acquisition
The data acquisition is a typical problem concerning measurements systems. A lot of studies
demonstrate how the computational intelligence techniques can improve the performance of
www.intechopen.com

Fuzzy Inference Systems Applied to Image Classification in the Industrial Field 249
sensors from both the static and the dynamic point of view (Ferrari & Piuri, 2003). The
sensor modules can be able to self-calibrate and also reduce the unexpected non-linearities.
Also eventual errors can be detected and, if necessary, corrected (Wandell et al., 2002).
Images are usually acquired by cameras in digital format.
4.2 Data pre-processing
The main aim of signal pre-processing is to reduce the noise and to make use of inherent information provided by signals. In literature many conventional pre-processing techniques have been proposed (Proakis & Manolakis, 1996; Rabiner & Gold, 1975) including computational intelligence techniques; in this context a good survey of neural and fuzzy approaches for signal pre-processing is due to Widrow and Sterns (Widrow & Stern, 1985).
If the captured data consist of an image, pre-processing phase is used to correct image acquisition and not perfect source image conditions. In each system, which implements machine vision functionalities, a pre-processing phase is recommended in order to correct image acquisition errors or to improve characteristics for visual inspection.
Image pre-processing is a phase which, through several operations, improves the image by suppressing undesirable distortions or enhancing relevant features for the further analysis tasks. Note that image pre-processing does not add information content to the image (Haralik & Shapiro, 1992; Hlavak et al., 1998) but uses the redundancy basing on the concept that a real object has similar neighbouring pixels which correspond to a similar brightness value. A distorted pixel can be removed from the image and it can also be reinserted in the image having a value equal to the average of the neighbouring pixels.
The main operations included in the pre-processing image phase are resumed as follow:
Cropping
Filtering
Smoothing
Brightness
Detecting Edges
Cropping is introduced to remove some parts of the image in order to point out the regions of interest.
Image filtering exploits a small neighbourhood of a pixel belonging to the input image in order to provide a new brightness value in the output image.
Smoothing techniques are used to reduce noise or eventual fluctuations occurring in the image. To reach this task it is necessary to suppress high frequencies in the Fourier transform domain.
Brightness threshold is a fundamental operation to extract pertinent information. It consists in a gray scale transformation whose result is a binary image. This approach is based on the segmentation and separates objects from their background.
Edge Detection is a very important step in image pre-processing. Edges are pixels lying where the intensity of image charges roughly. In previous paragraph the edge detection method is treated in more details.
www.intechopen.com
Fuzzy Inference System – Theory and Applications 250
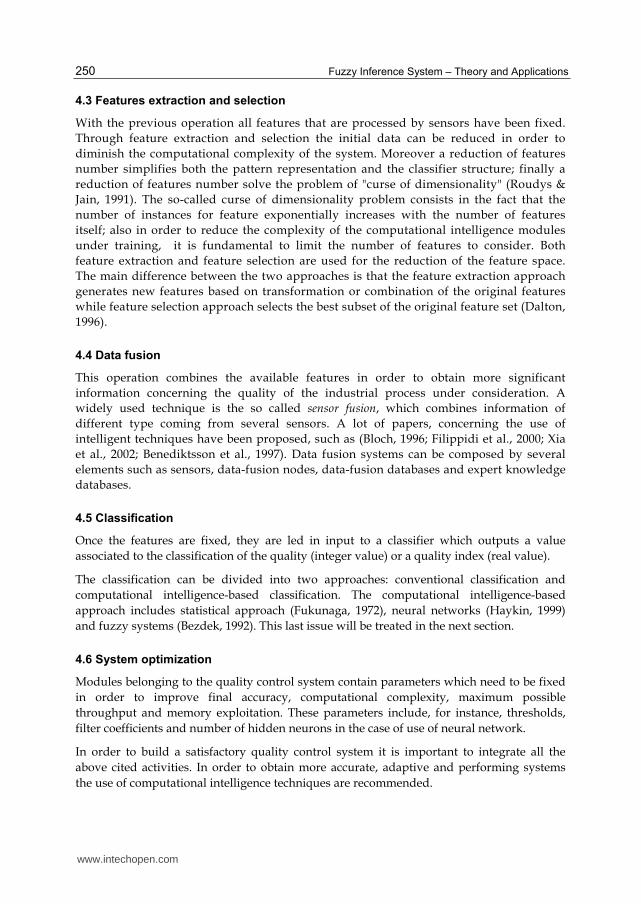
4.3 Features extraction and selection
With the previous operation all features that are processed by sensors have been fixed.
Through feature extraction and selection the initial data can be reduced in order to
diminish the computational complexity of the system. Moreover a reduction of features
number simplifies both the pattern representation and the classifier structure; finally a
reduction of features number solve the problem of "curse of dimensionality" (Roudys &
Jain, 1991). The so-called curse of dimensionality problem consists in the fact that the
number of instances for feature exponentially increases with the number of features
itself; also in order to reduce the complexity of the computational intelligence modules
under training, it is fundamental to limit the number of features to consider. Both
feature extraction and feature selection are used for the reduction of the feature space.
The main difference between the two approaches is that the feature extraction approach
generates new features based on transformation or combination of the original features
while feature selection approach selects the best subset of the original feature set (Dalton,
1996).
4.4 Data fusion
This operation combines the available features in order to obtain more significant
information concerning the quality of the industrial process under consideration. A
widely used technique is the so called sensor fusion, which combines information of
different type coming from several sensors. A lot of papers, concerning the use of
intelligent techniques have been proposed, such as (Bloch, 1996; Filippidi et al., 2000; Xia
et al., 2002; Benediktsson et al., 1997). Data fusion systems can be composed by several
elements such as sensors, data-fusion nodes, data-fusion databases and expert knowledge
databases.
4.5 Classification
Once the features are fixed, they are led in input to a classifier which outputs a value
associated to the classification of the quality (integer value) or a quality index (real value).
The classification can be divided into two approaches: conventional classification and
computational intelligence-based classification. The computational intelligence-based
approach includes statistical approach (Fukunaga, 1972), neural networks (Haykin, 1999)
and fuzzy systems (Bezdek, 1992). This last issue will be treated in the next section.
4.6 System optimization
Modules belonging to the quality control system contain parameters which need to be fixed
in order to improve final accuracy, computational complexity, maximum possible
throughput and memory exploitation. These parameters include, for instance, thresholds,
filter coefficients and number of hidden neurons in the case of use of neural network.
In order to build a satisfactory quality control system it is important to integrate all the
above cited activities. In order to obtain more accurate, adaptive and performing systems
the use of computational intelligence techniques are recommended.
www.intechopen.com

Fuzzy Inference Systems Applied to Image Classification in the Industrial Field 251
5. Fuzzy classifier
Fuzzy Logic has been introduced by Zadeh (Zadeh, 1965) and it is based on the concept of "partial truth", i.e. truth values between "absolutely true" and "absolutely false". Fuzzy Logic provides a structure to model uncertainty, the human way of reasoning and the perception process. Fuzzy Logic is based on natural language and through a set of rules an inference system is built which is the basis of the fuzzy computation. Fuzzy logic has many advantages, firstly it is essential and applicable to many systems, moreover it is easy to understand and mostly flexible; finally it is able to model non linear functions of arbitrary complexity. The Fuzzy Inference System (FIS) is one of the main concepts of fuzzy logic and the general scheme is shown in Fig.3.
Fig. 3. FIS scheme
A FIS is a way of mapping input data to output data by exploiting the fuzzy logic concepts.
Fuzzification is used to convert the system inputs, which is represented by crisp numbers into fuzzy set through a fuzzification function. The fuzzy rule base is characterized in the form of if-then rules and the set of these fuzzy rules provide the rule base for the fuzzy logic system. Moreover the inference engine simulates the human reasoning process: through a suitable composition procedure, all the fuzzy subsets corresponding to each output variable, are combined together in order to obtain a single fuzzy for each output variable. Finally the defuzzification operation is used to convert the fuzzy set coming from the inference engine into a crisp value (Abraham, 2005).
Fuzzy classification is an application of fuzzy theory. In fuzzy classification an instance can belong to different classes with different membership degrees; conventionally the sum of the membership values of each single instance must be unitary. The main advantage of fuzzy classification based method includes its applicability for very complex processes.
6. Exemplar industrial applications
The quality control in industrial applications is used to monitor and to guarantee the quality of the processes.
www.intechopen.com
Fuzzy Inference System – Theory and Applications 252
Actually many industries have adopted vision systems for improve the quality control of products (Amiri & Shanbehzadeh, 2009; Ferreira et al., 2009). The quality control includes the ability tackling problems of several scientific areas, such as signal acquisition, signal processing, features extraction, classification and so on. Many approaches have been proposed in order to design intelligent signal and visual inspection systems for the quality control using fuzzy theory, that has been recognized in the literature as a good tool to achieve these goals. In the following a description of some exemplar fuzzy-based methods is proposed.
6.1 Vehicle classification exploiting traffic sensors
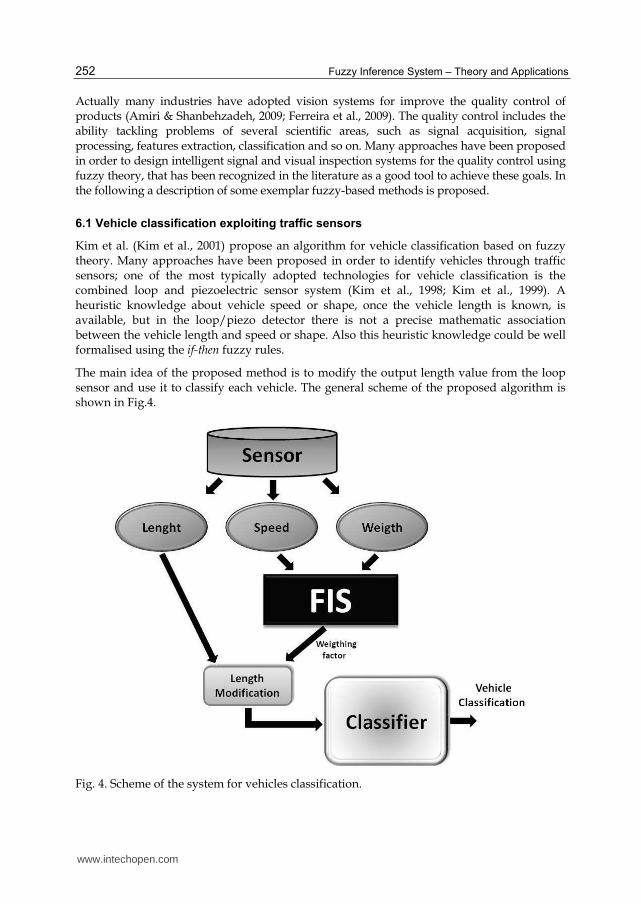
Kim et al. (Kim et al., 2001) propose an algorithm for vehicle classification based on fuzzy theory. Many approaches have been proposed in order to identify vehicles through traffic sensors; one of the most typically adopted technologies for vehicle classification is the combined loop and piezoelectric sensor system (Kim et al., 1998; Kim et al., 1999). A heuristic knowledge about vehicle speed or shape, once the vehicle length is known, is available, but in the loop/piezo detector there is not a precise mathematic association between the vehicle length and speed or shape. Also this heuristic knowledge could be well formalised using the if-then fuzzy rules.
The main idea of the proposed method is to modify the output length value from the loop sensor and use it to classify each vehicle. The general scheme of the proposed algorithm is shown in Fig.4.
Fig. 4. Scheme of the system for vehicles classification.
www.intechopen.com

Fuzzy Inference Systems Applied to Image Classification in the Industrial Field 253
Two features are selected to be fed as inputs to the fuzzy system namely the vehicle weight and speed. The output of the fuzzy system is a weighting factor which is used to modify the length value. Inputs and output are interpreted as linguistic values in this manner:
- Speed : slow, medium, fast - Weight: very light, light, medium, heavy - Length mod: negative big, negative small, zero, positive small, positive big.
Triangular membership functions have been defined to represent each linguistic value. Finally the fuzzy rule basis have been created with the help of expert's heuristic knowledge, which is described in Tab.1.
Speed Weight Length Modification
Slow Very light Zero
Medium Very light Negative small
Fast Very light Negative big
Slow Light Positive small
Medium Light Zero
Slow Medium Positive big
Medium Medium Positive small
Fast Medium Zero
Slow Heavy Positive big
Medium Heavy Positive big
Fast Heavy Positive small
Table 1. Rule basis
On the basis of the rules the output of the fuzzy system is evaluated through an inference system of Mandani type (Mandani, 1974) and a defuzzification operation. Finally the modified vehicle length is calculated as follows:
LM = L * [1 + (WF /100)] (3)
where LM is the modified length, L represents the measured length and WF is the weighting factor in output from the fuzzy system. The modified length is used as input to a classifier in order to obtain the vehicle classification. Experimental results demonstrate that the proposed algorithm using fuzzy approach significantly outperforms the conventional vehicle classification algorithm (Kim et al., 1998; Kim et al., 1999). The classification error using a conventional algorithm is 12.78% (74 errors on 579 vehicles analysed), while adopting the proposed fuzzy approach the classification error decreases to 6.56% (38 errors on 579 vehicles).
6.2 Classification of surface defects on flat steel products
Borselli et al. (Borselli et al., 2011) propose a fuzzy-based classification in order to classify a particular class of defects that can be present on the surface of some flat steel products. In the steelmaking industry a lot of steel rolling mills are equipped with an Automatic
www.intechopen.com
Fuzzy Inference System – Theory and Applications 254
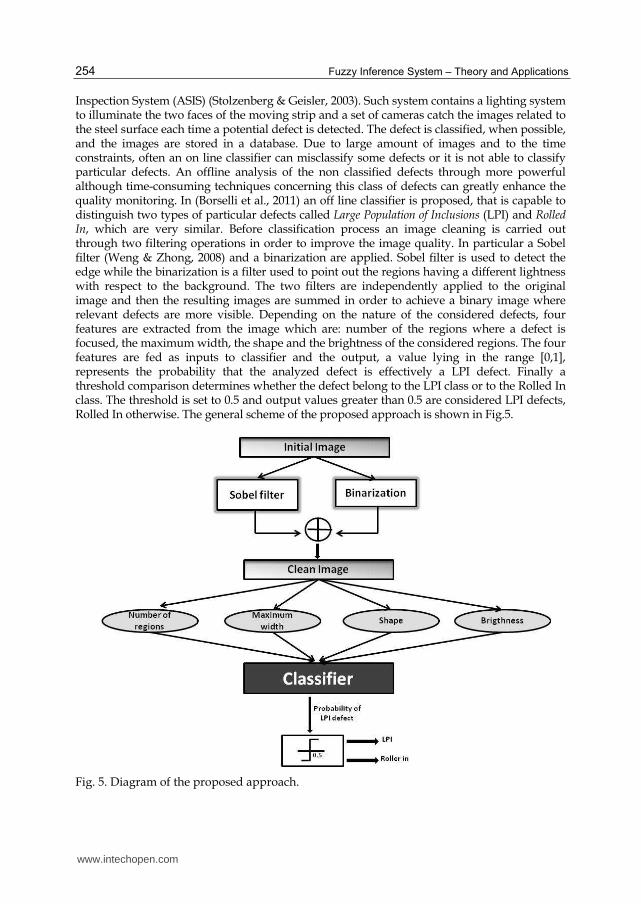
Inspection System (ASIS) (Stolzenberg & Geisler, 2003). Such system contains a lighting system to illuminate the two faces of the moving strip and a set of cameras catch the images related to the steel surface each time a potential defect is detected. The defect is classified, when possible, and the images are stored in a database. Due to large amount of images and to the time constraints, often an on line classifier can misclassify some defects or it is not able to classify particular defects. An offline analysis of the non classified defects through more powerful although time-consuming techniques concerning this class of defects can greatly enhance the quality monitoring. In (Borselli et al., 2011) an off line classifier is proposed, that is capable to distinguish two types of particular defects called Large Population of Inclusions (LPI) and Rolled In, which are very similar. Before classification process an image cleaning is carried out through two filtering operations in order to improve the image quality. In particular a Sobel filter (Weng & Zhong, 2008) and a binarization are applied. Sobel filter is used to detect the edge while the binarization is a filter used to point out the regions having a different lightness with respect to the background. The two filters are independently applied to the original image and then the resulting images are summed in order to achieve a binary image where relevant defects are more visible. Depending on the nature of the considered defects, four features are extracted from the image which are: number of the regions where a defect is focused, the maximum width, the shape and the brightness of the considered regions. The four features are fed as inputs to classifier and the output, a value lying in the range [0,1], represents the probability that the analyzed defect is effectively a LPI defect. Finally a threshold comparison determines whether the defect belong to the LPI class or to the Rolled In class. The threshold is set to 0.5 and output values greater than 0.5 are considered LPI defects, Rolled In otherwise. The general scheme of the proposed approach is shown in Fig.5.
Fig. 5. Diagram of the proposed approach.
www.intechopen.com
Fuzzy Inference Systems Applied to Image Classification in the Industrial Field 255
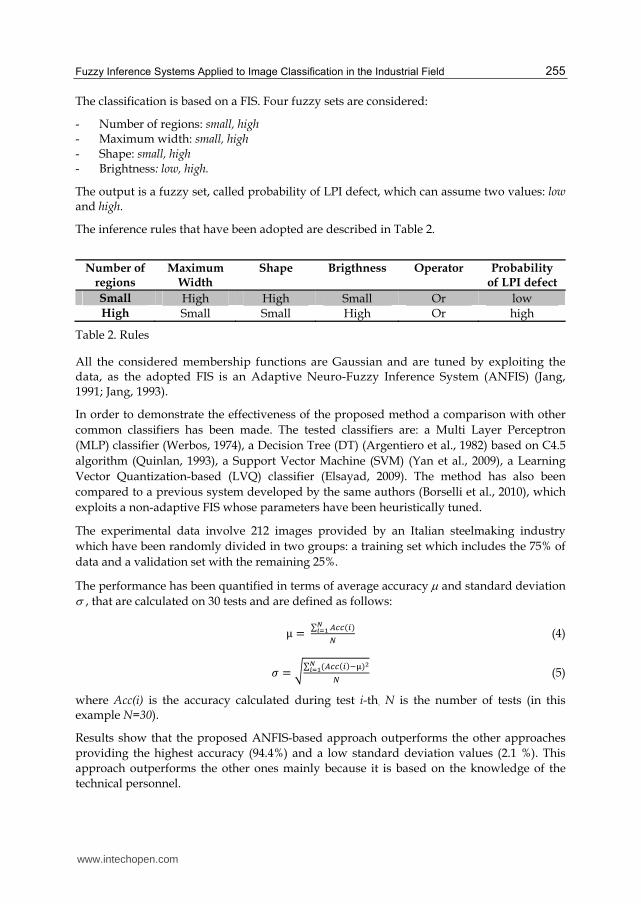
The classification is based on a FIS. Four fuzzy sets are considered:
- Number of regions: small, high - Maximum width: small, high - Shape: small, high - Brightness: low, high.
The output is a fuzzy set, called probability of LPI defect, which can assume two values: low and high.
The inference rules that have been adopted are described in Table 2.
Number of regions
Maximum Width
Shape Brigthness Operator Probability of LPI defect
Small High High Small Or low High Small Small High Or high
Table 2. Rules
All the considered membership functions are Gaussian and are tuned by exploiting the data, as the adopted FIS is an Adaptive Neuro-Fuzzy Inference System (ANFIS) (Jang, 1991; Jang, 1993).
In order to demonstrate the effectiveness of the proposed method a comparison with other
common classifiers has been made. The tested classifiers are: a Multi Layer Perceptron
(MLP) classifier (Werbos, 1974), a Decision Tree (DT) (Argentiero et al., 1982) based on C4.5
algorithm (Quinlan, 1993), a Support Vector Machine (SVM) (Yan et al., 2009), a Learning
Vector Quantization-based (LVQ) classifier (Elsayad, 2009). The method has also been
compared to a previous system developed by the same authors (Borselli et al., 2010), which
exploits a non-adaptive FIS whose parameters have been heuristically tuned.
The experimental data involve 212 images provided by an Italian steelmaking industry
which have been randomly divided in two groups: a training set which includes the 75% of
data and a validation set with the remaining 25%.
The performance has been quantified in terms of average accuracy and standard deviation , that are calculated on 30 tests and are defined as follows:
μ = ∑ 凋頂頂岫沈岻灘日転迭 朝 (4)
購 = 謬∑ 岫凋頂頂岫沈岻貸筑岻鉄灘日転迭 朝 (5)
where Acc(i) is the accuracy calculated during test i-th. N is the number of tests (in this example N=30).
Results show that the proposed ANFIS-based approach outperforms the other approaches
providing the highest accuracy (94.4%) and a low standard deviation values (2.1 %). This
approach outperforms the other ones mainly because it is based on the knowledge of the
technical personnel.
www.intechopen.com

Fuzzy Inference System – Theory and Applications 256
6.3 On line defects detection in Gas Metal Arc Welding
Another fuzzy application used in industrial field is proposed by Naso & Turchiano (Naso
& Turchiano, 2005), who propose the development of an intelligent optical sensor for on line
defects detection in Gas Metal Arc Welding (GMAW).
GMAW (Li & Zhang, 2001) is a welding process widely used in industrial field (Bingul et al.,
2000) which presents many advantages, such as low costs, high metal deposition rate and
suitability to automation. Also the process monitoring and defect-detections methods are
very important tasks in order to improve the weld quality reducing manufacturing costs.
The electro-optical sensor includes two main modules (sensor and telescope) which are
interconnected with optical fibers. This equipment aims at filtering and splitting the
measured radiation into four components: infrared (IR), ultraviolet (UV) and two radiations
at visible wavelengths (VIS1, VIS2). Photodiodes convert the resulting beams in electrical
signals. The wavelength of the two signals belonging to the visible spectrum is set to tolerate
the computation of the electronic temperature (Te) of the plasma. If VIS1, VIS2, Te are
interdependent, then only Te and VIS1 are taken into account to eliminate redundancies.
Before the on line classification operation, a signal pre-processing phase is necessary in
order to improve the signal quality. The pre-processing phase includes two stages: signal
filtering and extraction of the regularity indices. Signal filtering is a fundamental step in this
context because a large amount of noise affects the observed signals. The Kalman filter
(Brown & Hwang, 1992) has been adopted to this purpose, which provides efficient
algorithms for estimating useful parameters in the stochastic environments. Regularity
indices are extracted considering several factors: first of all, given a fixed configuration of
the welding equipment, the signals associated to successful welding processes have the
same behaviour; in contrast, signals observed during defective welds contain particularly
features which are easily associable to the occurred defect. Also, it is possible to discover
when the quality of the weld decreases, the cause of such downgrading and the type of
defect. For the classification task the information describing the behaviour of the observed
signal can be synthesized in three independent features:
1. Normalized Signal Offset (NSO), which is used to quantify the deviation of the signal
from the expected value belonging to an ideal weld.
2. Change of Normalized Signal Offset (CNSO), which measures the change in signal levels
between two consecutive time windows.
3. Residual Signal Noise (RSN), which represents the remain noise in the signal after the
Kalman filtering.
The extracted features are fed as inputs into a classifier. In order to develop a classifier
that directly exploits the experts knowledge a fuzzy system has been chosen. It must be
noticed that signals belonging to different welds are different due to the stochastic nature
of the phenomena under consideration; also the deviation of one or more indices from
their expected behaviour often is due to the occurrence of a defect during the welding
process. Fuzzy system, in this context, is the ideal classifier, as it is simple, it can directly
use the knowledge of the experts and it can be easily reconfigured when new knowledge
is available.
www.intechopen.com

Fuzzy Inference Systems Applied to Image Classification in the Industrial Field 257
In order to limit the number of membership functions and rules the classification task is
developed through two different fuzzy systems operating parallel. The first fuzzy
classification system is used to provide a percentile index of acceptability of the weld, while
the second fuzzy system detects the simultaneous signal patters directly connected with a
specific defect. The first FIS gives a real time estimate of the quality of each weld, also for
each time-window the system analyzes the indices through a rule-based method. Firstly a
partition of the range of each observed input three fuzzy set is been made basing on the set
of reference welds used as training set. The three introduced fuzzy sets are referred to
quality: Optimal (OPT), acceptable (ACC) and unacceptable (UNA) and the membership
functions have a trapezoidal shape. Finally the fuzzy system uses the welding time (Time) as
an input to let the classification ignore the first seconds of process when the welding
equipment is warming up. To describe the time interval a single linear piecewise increasing
membership function regime (REG) is introduced. The output is represented by three
membership functions as well. In this case the membership function are represented by
three singletons as follows:
- OPT = 100% - ACC=50% - UNA= 0%
Once the membership functions have been defined, a few generic rules are introduced. The
first rules refer to obvious conditions; then, each time, another rule is included and the
overall classification performance is evaluated in order to adjust membership function and
rule weights. The output is so defined as an index of weld quality, in particular 0% (UNA)
indicates the occurrence of defect while 100% (OPT) represents an optimal weld, values in
the range 0-100% represent intermediate acceptability. Subsequently a threshold of
acceptability is introduced in order to convert the fuzzy degree of quality in a binary
decision: good or defective weld.
The fuzzy rules used by the quality estimation system can be described as follow:
1. If Time is not REG then the output is OPT. (weigth=1). 2. If Time is REG, NSO (IR) is OPT and CNSO (IR) is OPT and RSN (IR) is OPT and NSO
(UV) is OPT and CNSO (UV) is OPT and RSN (UV) is OPT and NSO (VIS) is OPT and CNSO (VIS) is OPT and RSN (VIS) is OPT and NSO (Te) is OPT and CNSO (Te) is OPT and RSN (Te) is OPT then the OUTPUT is OPT. (weigth =1).
3. If NSO (IR) is UNA or CNSO (IR) is UNA or RSN (IR) is UNA or NSO (UV) is UNA or CNSO (UV) is UNA or RSN (UV) is UNA or NSO (VIS) is UNA or CNSO (VIS) is UNA or RSN (VIS) is UNA or NSO (Te) is UNA or CNSO (Te) is UNA or RSN (Te) is UNA then the OUTPUT is UNA. (weigth =0.1).
4. If NSO (IR) is ACC or CNSO (IR) is ACC or RSN (IR) is ACC or NSO (UV) is ACC or CNSO (UV) is ACC or RSN (UV) is ACC or NSO (VIS) is ACC or CNSO (VIS) is ACC or RSN (VIS) is ACC or NSO (Te) is ACC or CNSO (Te) is ACC or RSN (Te) is ACC then the OUTPUT is ACC. (weigth =0.2).
5. If Time is REG, NSO (IR) is ACC and CNSO (IR) is ACC and RSN (IR) is ACC and NSO (UV) is ACC and CNSO (UV) is ACC and RSN (UV) is ACC and NSO (VIS) is ACC and CNSO (VIS) is ACC and RSN (VIS) is ACC and NSO (Te) is ACC and CNSO (Te) is ACC and RSN (Te) is ACC then the OUTPUT is ACC. (weigth =0.8).
www.intechopen.com
Fuzzy Inference System – Theory and Applications 258
6. If Time is REG, NSO (IR) is UNA and CNSO (IR) is UNA and NSO (VIS) is not OPT then the OUTPUT is UNA. (weigth =0.18).
7. If Time is REG, NSO (UV) is UNA and NSO (VIS) is not UNA then the OUTPUT is UNA. (weigth =0.18).
8. If Time is REG, NSO (IR) is UNA and CNSO (IR) is UNA and RSN (IR) is UNA and NSO (UV) is UNA and NSO (VIS) is UNA and NSO (Te) is UNA then the OUTPUT is UNA. (weigth =0.18).
9. If Time is REG and RSN (IR) is UNA and NSO (Te) is UNA and CNSO (Te) is UNA and RSN (Te) is UNA then the OUTPUT is UNA. (weigth =0.18).
10. If Time is REG and CNSO (IR) is UNA and CNSO (UV) is UNA and RSN (UV) is UNA and CNSO (VIS) is UNA and RNS (VIS) is UNA and CNSO (Te) is UNA then the OUTPUT is UNA. (weigth =0.18).
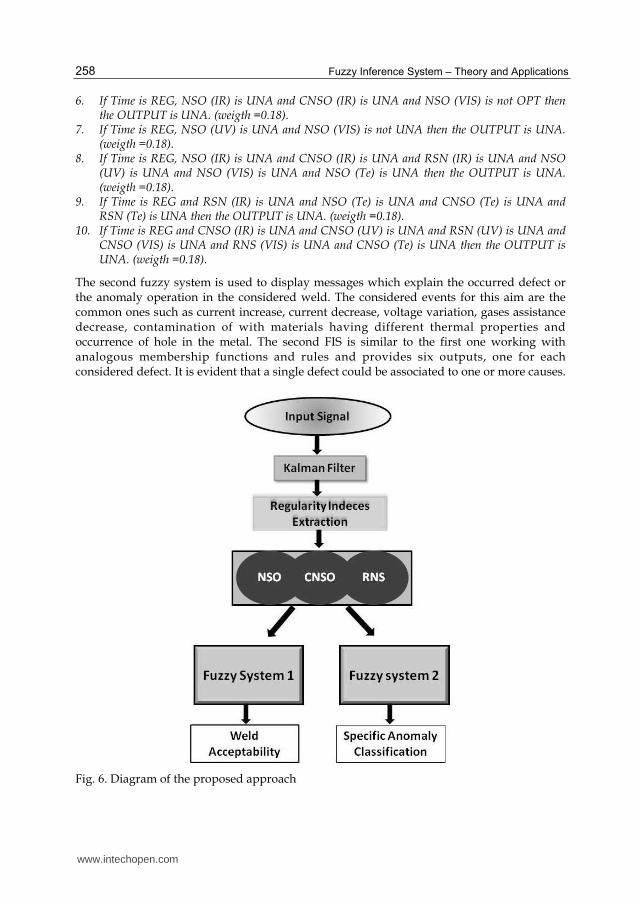
The second fuzzy system is used to display messages which explain the occurred defect or the anomaly operation in the considered weld. The considered events for this aim are the common ones such as current increase, current decrease, voltage variation, gases assistance decrease, contamination of with materials having different thermal properties and occurrence of hole in the metal. The second FIS is similar to the first one working with analogous membership functions and rules and provides six outputs, one for each considered defect. It is evident that a single defect could be associated to one or more causes.
Fig. 6. Diagram of the proposed approach
www.intechopen.com

Fuzzy Inference Systems Applied to Image Classification in the Industrial Field 259
Both Fuzzy Inference Systems are Mandani type and a general scheme of the proposed approach is shown in Fig.6.
The proposed approach has been evaluated with 40 different welding processes, where the 70% of processes are non defective while the remaining 30% present particular defects voluntarily induced or a posteriori detected with an appropriate tool. Furthermore, 60% of data are used as training set and 40% as validation set.
In order to demonstrate the effectiveness of the proposed method a comparison with a stochastic approach (Sforza & DeBlasiis, 2002) is provided. It is important consider that stochastic approach is not able to indicate the type of defect and, in order to make the comparison, the fuzzy index of quality must be convert in a binary value, also a threshold is necessary. The obtained results show that the fuzzy classification system correctly classifies all considered welds while the stochastic approach misclassifies 14% of the welds.
Finally a sensitivity analysis in order to evaluate the robustness of the proposed approach, when membership function, rules and operating condition vary, is carried out. The sensitivity investigation on the several variation of parameters leads to the following conclusion: if a proper pre-processing signal phase and a correct identification of the important features are been carried out, then the proposed fuzzy classification system can be effectively built and tuned.
6.4 Detection of wafer defects
An interesting industrial application which exploits the advantages of the fuzzy theory is due to (Tong et al., 2003). The authors propose a process control chart which integrate both fuzzy theory and engineering experience in order to monitor the defects on a wafer which have been clustered.
The wafer manufacturing process contains many step, such as alignment, etch and deposition. It is a very complex process; the occurrence of defects on the wafer surface is unavoidable and decreases the wafer yield.
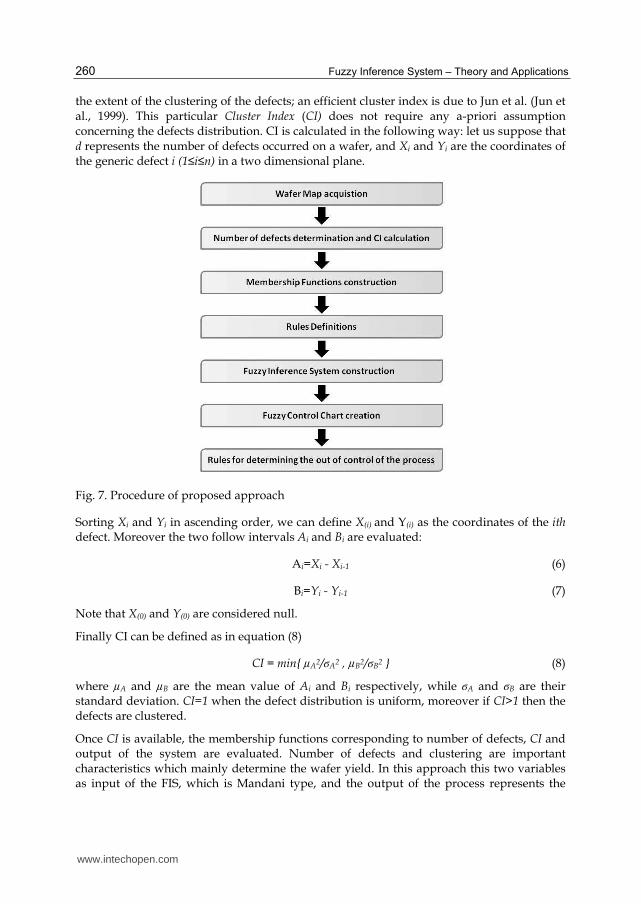
Typically Integrated Circuits (IC) manufacturers use c-charts to monitor wafer defects. This technique assumes that wafer defects are randomly and independently distributed so that the number of defects has a Poisson distribution. A limit of this approach is that the real defect clustering infringes this constraint creating a non acceptable occurrences of false alarms. A modified c-chart, introduced in order to solve this problem, is presented by Albin & Friedman (Albin & Friedman, 1991) and it is based on a Neyman Type-A distribution. Unfortunately also this approach presents a considerable limit, as it can monitor only the variation in the number of defects but it is not able to detect variation located within the wafer. The authors demonstrate that applying fuzzy theory in combination with engineering experience it is possible to build a process control chart which is able to monitor the clustered defect and defect clustering simultaneously. The proposed algorithm is illustrated in Fig.7.
The KLA 2110 wafer inspection system (Castucci et al., 1991) is adopted to obtain the wafer map. This system provides in-line wafer inspection information such as number of defects, size of defects, placement of defects and, finally, type of defects. The number of defects are determined and the cluster index is calculated. Some cluster indices are provide to calculate
www.intechopen.com
Fuzzy Inference System – Theory and Applications 260
the extent of the clustering of the defects; an efficient cluster index is due to Jun et al. (Jun et al., 1999). This particular Cluster Index (CI) does not require any a-priori assumption concerning the defects distribution. CI is calculated in the following way: let us suppose that d represents the number of defects occurred on a wafer, and Xi and Yi are the coordinates of the generic defect i (1≤i≤n) in a two dimensional plane.
Fig. 7. Procedure of proposed approach
Sorting Xi and Yi in ascending order, we can define X(i) and Y(i) as the coordinates of the ith defect. Moreover the two follow intervals Ai and Bi are evaluated:
Ai=Xi - Xi-1 (6)
Bi=Yi - Yi-1 (7)
Note that X(0) and Y(0) are considered null.
Finally CI can be defined as in equation (8)
CI = min{ µA2/ϭA2 , µB2/ϭB2 } (8)
where µA and µB are the mean value of Ai and Bi respectively, while ϭA and ϭB are their standard deviation. CI=1 when the defect distribution is uniform, moreover if CI>1 then the defects are clustered.
Once CI is available, the membership functions corresponding to number of defects, CI and output of the system are evaluated. Number of defects and clustering are important characteristics which mainly determine the wafer yield. In this approach this two variables as input of the FIS, which is Mandani type, and the output of the process represents the
www.intechopen.com

Fuzzy Inference Systems Applied to Image Classification in the Industrial Field 261
output of the fuzzy system. In the proposed examples the number of defected can be classified in seven classes defined as follows:
1. very low 2. low 3. medium low 4. medium 5. medium high 6. high 7. very high
Also, for each fuzzy set a triangular membership function is constructed accordingly.
Clustering phenomena is classified in ten classes and the output can be classified in ten levels as well. Finally, according to the process control a set of rules based on experts knowledge has been defined. It is important to consider that, when many defects are present, without clustering, the process is considered out of control, while when the number of defects is low clustering is significant and also under control.
The corresponding rules created to monitor the process can be written as follow:
R1: IF Defect is very high and C1 is term 1, then value is term 10 R2: IF Defect is very high and C1 is term 2, then value is term 10 . . . Ri: IF Defect is medium and C1 is term 10, then value is term 2 . . . R70: IF Defect is very low and C1 is term 10, then value is term 1
Subsequently a fuzzy system according to the rules and a fuzzy control chart can be designed also building eventual control limits. Once the defect data are stored, they are transformed into output of the fuzzy inference rules and a control chart which monitor both number of defects and clustering is constructed. The last important step is determine the rules which determine when the process is out of control.
The main advantages of the proposed approach include the possibility to incorporate within the fuzzy system the knowledge of experts and the experience of engineering. Moreover the proposed chart is easy and very helpful in judging real process conditions and, finally, it is simpler and more efficient respect to Poisson based c-chart and the Neyman-based c-chart.
6.5 Detection of defective products in the paper industry
A further application of a combination of vision systems and fuzzy inference is found in (Colla et al., 2009) and is related to a quality control task within the paper industry.
One of the main phases of the manufacturing of paper rolls for domestic consists in cutting a long semi-finished roll into rolls of standard length by means of an automatic machinery equipped with a fast-rotating circular blade.
www.intechopen.com
Fuzzy Inference System – Theory and Applications 262
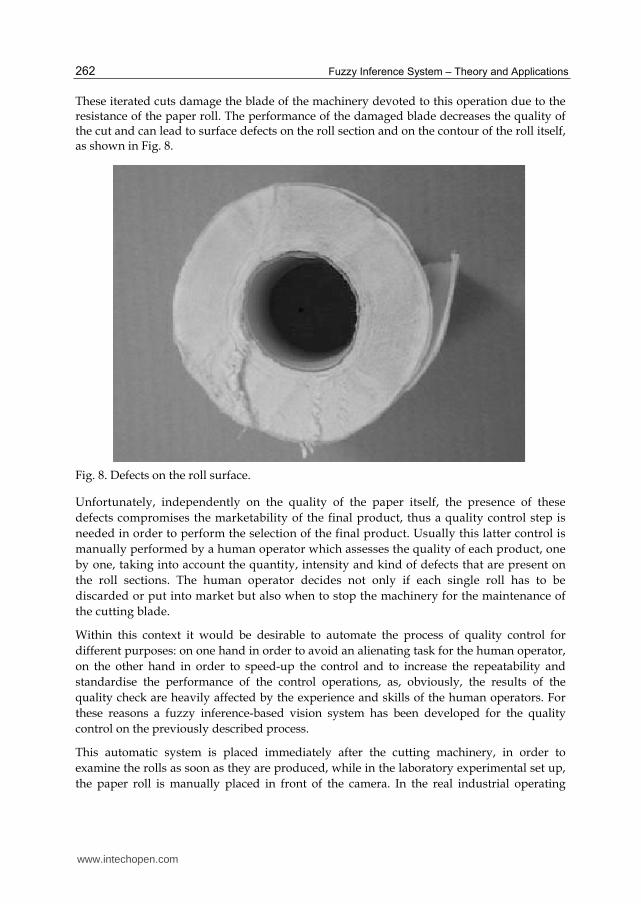
These iterated cuts damage the blade of the machinery devoted to this operation due to the resistance of the paper roll. The performance of the damaged blade decreases the quality of the cut and can lead to surface defects on the roll section and on the contour of the roll itself, as shown in Fig. 8.
Fig. 8. Defects on the roll surface.
Unfortunately, independently on the quality of the paper itself, the presence of these
defects compromises the marketability of the final product, thus a quality control step is
needed in order to perform the selection of the final product. Usually this latter control is
manually performed by a human operator which assesses the quality of each product, one
by one, taking into account the quantity, intensity and kind of defects that are present on
the roll sections. The human operator decides not only if each single roll has to be
discarded or put into market but also when to stop the machinery for the maintenance of
the cutting blade.
Within this context it would be desirable to automate the process of quality control for
different purposes: on one hand in order to avoid an alienating task for the human operator,
on the other hand in order to speed-up the control and to increase the repeatability and
standardise the performance of the control operations, as, obviously, the results of the
quality check are heavily affected by the experience and skills of the human operators. For
these reasons a fuzzy inference-based vision system has been developed for the quality
control on the previously described process.
This automatic system is placed immediately after the cutting machinery, in order to
examine the rolls as soon as they are produced, while in the laboratory experimental set up,
the paper roll is manually placed in front of the camera. In the real industrial operating
www.intechopen.com
Fuzzy Inference Systems Applied to Image Classification in the Industrial Field 263
scenario, each time a new roll is cut, a belt or a robot should place it with its circular section
in front of the camera that is part of the vision system.
The vision system exploits one single static analogical B/W camera which acquires the images and digitalizes them. The decision system directly operates on the digitalized grey scale image and, as a result, provides the decision concerning the destination (market or recycling) of the inspected product.
The main goal of the developed system is to evaluate the quality of single products on the basis of the defects that are eventually present on the internal part of the paper section, neglecting the irregularity of the contour, as this latter defect can be due also to other phases of the manufacture and does not compromise the marketability of the product.
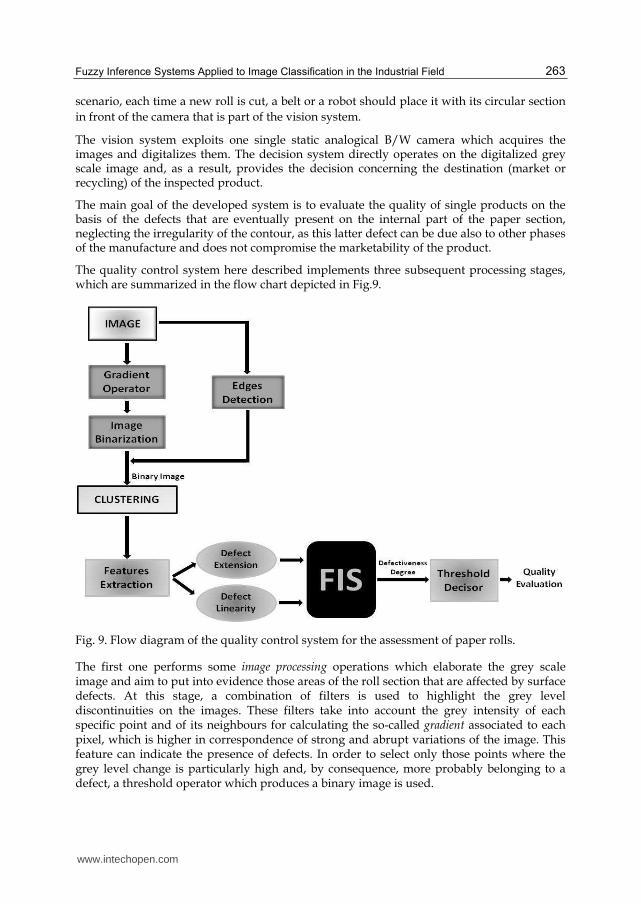
The quality control system here described implements three subsequent processing stages, which are summarized in the flow chart depicted in Fig.9.
Fig. 9. Flow diagram of the quality control system for the assessment of paper rolls.
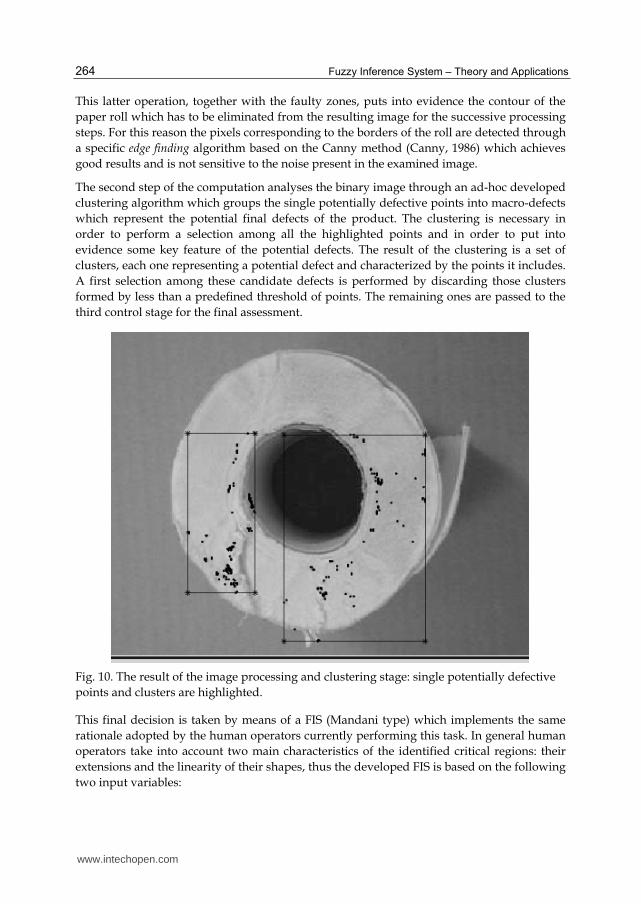
The first one performs some image processing operations which elaborate the grey scale image and aim to put into evidence those areas of the roll section that are affected by surface defects. At this stage, a combination of filters is used to highlight the grey level discontinuities on the images. These filters take into account the grey intensity of each specific point and of its neighbours for calculating the so-called gradient associated to each pixel, which is higher in correspondence of strong and abrupt variations of the image. This feature can indicate the presence of defects. In order to select only those points where the grey level change is particularly high and, by consequence, more probably belonging to a defect, a threshold operator which produces a binary image is used.
www.intechopen.com
Fuzzy Inference System – Theory and Applications 264
This latter operation, together with the faulty zones, puts into evidence the contour of the
paper roll which has to be eliminated from the resulting image for the successive processing
steps. For this reason the pixels corresponding to the borders of the roll are detected through
a specific edge finding algorithm based on the Canny method (Canny, 1986) which achieves
good results and is not sensitive to the noise present in the examined image.
The second step of the computation analyses the binary image through an ad-hoc developed
clustering algorithm which groups the single potentially defective points into macro-defects
which represent the potential final defects of the product. The clustering is necessary in
order to perform a selection among all the highlighted points and in order to put into
evidence some key feature of the potential defects. The result of the clustering is a set of
clusters, each one representing a potential defect and characterized by the points it includes.
A first selection among these candidate defects is performed by discarding those clusters
formed by less than a predefined threshold of points. The remaining ones are passed to the
third control stage for the final assessment.
Fig. 10. The result of the image processing and clustering stage: single potentially defective
points and clusters are highlighted.
This final decision is taken by means of a FIS (Mandani type) which implements the same
rationale adopted by the human operators currently performing this task. In general human
operators take into account two main characteristics of the identified critical regions: their
extensions and the linearity of their shapes, thus the developed FIS is based on the following
two input variables:
www.intechopen.com

Fuzzy Inference Systems Applied to Image Classification in the Industrial Field 265
1. defect extension which is measured in terms of the number of pixels belonging to a cluster. Three fuzzy sets correspond to this fuzzy variable and refer to the number of pixels in the cluster: low, medium and high.
2. linearity is calculated as the mean square distance of pixels of the clusters from the best-fitting straight-line. Also for this variable three fuzzy sets are created: low, medium and high.
The output of the designed FIS is represented by a single variable, the so-called defectiveness,
which reflects the decision about the final roll destination. This variable corresponds to three
fuzzy sets: not defective, uncertain and defective.
The adopted membership functions are Gaussian and their domain depends on the universe
where the corresponding fuzzy variable is defined (for instance, 0-200 points for the variable
extension.
Seven fuzzy rules derived from the knowledge of expert human operators constitute the
adopted inference system. The defectiveness index is evaluated for all the clusters
eventually present on a single roll: if a paper roll contains at least one cluster whose
defectiveness index is higher than a fixed threshold, it is discarded.
The adopted rules are expressed in Table 3.
Defect Extension Linearity Operator Defectiveness
Low Low and Uncertain
Low Medium and Defective
Low High and Defective
Medium Low and Defective
Medium Medium and Uncertain
Medium High and Defective
High - and Defective
Table 3. Adopted Rules
Several tests have been performed for evaluating the proposed quality control system. The
value of the defectiveness discrimination threshold must meet two opposite requirements:
on one hand the choice of high values of such threshold leads to a high number of missed
detections (MD) of faulty rolls, on the other hand low values of the threshold rise several so-
called false alarms (FA) which correspond to pauses on the process for the maintenance of the
machinery. Both these situations must be avoided although, according to technical
personnel, to avoid missed defect detections is more important, as the presence of faulty
rolls can affect the commercial competitiveness of the product.
The results obtained by the proposed vision system are extremely good as, with the selected
threshold, an extremely low number of defective products are missed and a satisfactory
www.intechopen.com
Fuzzy Inference System – Theory and Applications 266
number of false alarms are risen. The best compromise is reached fixing the threshold to
0.70; with this threshold the error is percentage is 4.6, the percentage of false alarms is 3.7
and finally the missed detections percentage is 0.9.
7. Conclusions
In the last years Vision Systems in the industrial field have been widely adopted providing
innovative solutions in the direction of industrial application. Vision systems improve the
productivity and the quality monitoring becoming a competitive tool to industries which
employ this technology.
In this chapter a brief description of vision system is provided and then the principles of
industrial quality control have been treated. Several examples of use of fuzzy system in
different industrial applications have been described. The results demonstrate how
applicable the FISs are in industrial field: their flexibility and the simplicity make this
approach an optimal solution to describe complex processes.
8. References
Abraham, A. (2005). Rule-based expert system. Handbook of measuring system design, John
Wiley & Sons, ISBN: 0-470-02143-8, USA, 2005.
Albin, S.L. & Friedman, D.J. (1991). Clustered defect in IC fabrication: Inpact on Process
Control Charts, IEEE Trans. on Semiconductor Manifacturing, 4 (1), 1991.
Amini, M. & Shahnbehzadeh, S. (2009). An Experimental Machine Vision System for quality
Control of Industrial Colour Printer, 2nd international Conference on Machine Vision,
Dubai, UAE, pp. 225-228.
Argentiero, P., Chin, R., Beaudet, P. (1982). An automated approach to design the decision
tree classifiers, Pattern analysis and Machine Intelligence, 4(1), pp.51-57.
Benediktsson, J.A.; Sveinsson, J.A.; Ersoy, J.R. & Swain, O.K. (1997). Parallel Consensual
neural networks. Neural Networks, IEEE Trans., Vol. 8 Issue 1, pp.54-64.
Bezdek, J.C. (1992). Computing with uncertainty. Comunication Magazine, IEEE vol.30,
Issue 9, pp.24-36.
Bingul, Z.; Cook, G.E. & Strauss, A.M. (2000) Application of fuzzy logic to spatial thermal
control in fusion welding. IEEE Trans. Ind. Applicat. Vol. 36, 6, pp. 1523-1530.
Bloch, I. (1996). Information combination operators for data fusion: a comparative review
with classification. IEEE Trans.Systems Man and cybernetics, Part A Volume 6 Issue 1,
pp.52-67.
Borselli, A., Colla, V., Vannucci, M. & Veroli, M. (2010). A Fuzzy Inference System applied to
defect detection in flat steel production. In IEEE World Congress on Computational
intelligence, 18-23 July, CCIB Barcelona, Spain.
Borselli, A., Colla, V. & Vannucci, M. (2011). Applying Surface defects classification in steel
products: a comparison between different artificial intelligence-based approaches.
In Proceeding of the 11th lasted International Conference on Artificial Intelligence and
Applications, pp.129-134. Innsbruck, Austria.
www.intechopen.com
Fuzzy Inference Systems Applied to Image Classification in the Industrial Field 267
Brown Grover, R., Hwang, P. (1992). Introduction to Random Signals and applied Kalman
Filtering, Wiley New York.
Canny J. (1986). A Computational Approach to Edge Detection. IEEE Transactions on Pattern
Analysis and Machine Intelligence 6 (November 86): 8
Castucci, P. Dickerson, G. & Backer, D. (1991) Utilizing an integrated yield management
system to improve the return on investment in IC manufacturing, Semiconductor
Manufacturing Science Symposium, 1991. ISMSS 1991., IEEE/SEMI International, 20-22
May.
Chin, R. T., & Harlow, C. A. (1982). Automated visual inspection: A survey. IEEE
Transactions on Pattern Analysis and Machine Intelligence, 4(6), 557–573.
doi:10.1109/TPAMI.1982.4767309
Choras, R.S. (2007). Image Feature Extraction Techniques and their applications for CBIR
and Biometrics Systems. International Journal of Biology and Biomedical Engineering,
Vol. 1, Issue 1.
Colla, V.; Giori, L.; Vannucci, M.; Bioli, G. (2009). A Fuzzy Inference System Applied to
Quality Control in Paper Industry Chap. 13 in Modeling, Control, Simulation and
Diagnosis of Complex Industrial and Energy Systems ISA/O3NEDIA (ISBN 978-1-
934394-90-8), pp. 253-272.
Dalton, J. (1996). Digital cameras and electronic color image acquisition, Campcon'96
Technologies for the information Superhighway, Digest of papers, 25-28 february 1996,
pp. 431-434.
Elsayad, A.M. (2009). Classification of ECG arrhythmia using learning vector quantization
neural network, International Conference on Computer Engineering & Systems,pp.139-
144.
Ferrari, S. & Piuri, V. (2003). Neural Networks in Intelligent Sensors and Measurement
Systems for Industrial applications.
Ferreira, M.J., Santos, C. & Monteiro, J. (2009). Cork parquet Quality Control Vision System
based on texture Segmentation and Fuzzy Grammar, IEEE Transactions on industrial
Electronics, 56 (3), pp. 756-765.
Filippidis, A.; Jain, L. & Martin, N. (2000). Multisensor data fusion for surface land-mine
detection. IEEE Trans. on Systems, Man and Cybernetics, Part C, vol.30, pp.145-150.
Fukunaga, K. (1972). Introduction to statistical pattern recognition. Academic Press Inc ,
London.
Haralik, R.M. & Shapiro, L.G. (1992). Computer and Robot Vision, Vol. 1, Addison Wensley,
1992.
Haykin, S. (1999). Neural Networks. Prentice Hall,1999.
Hlavak, S.M. & Boyle, V. R. (1998) Image processing Analysis and Machine Vision. PSW
Publishing, 1998.
Hongcan, Y.; Lin, C. & Bicheng, L. (2009). A SVM-Based Text Classification Method with
SKK-Means Clustering Algorithm. International Conference on Artificial Intelligence,
pp.379-383.
Hornik, K.; Stinchcombe, M & White, H. (1989). Multilayer feedforward networks are
universal approximators, Neural Networks, 2 pp. 359-366.
www.intechopen.com
Fuzzy Inference System – Theory and Applications 268
Hough, P.V.C (1969). Method and Means for Recognising Complex Patterns, US Patent
3969654.
Jain, A.K.; Duin, R.P.W.& Mo, J. (2000). Statistical pattern recognition: a review. IEEE
Transaction on Pattern Analysis and Machine Intelligence, Vol. 22, n°1, pp.4-37.
Jang, J.S.R. (1991) Fuzzy Modeling using Generalized Neural Networks and Kalman Filter
Algorithm. Proc. of ninth national conference on artificial Intelligence, pp.762-767.
Jang, J.S.R. (1993) ANFIS: Adaptive- Network-based Fuzzy Inference Systems. IEEE
Transactions on Systems, Man and Cybernetics, 23(3) pp.665-685.
Jarvis, J.F. (1979). Visual inspection Automation. Proceeding of Computer Software and
Application Conference, 1979.
Jun, C., Hong, H., Kim, Y., Park, S.Y., Park, K.S. and park, H. (1999). A Simulation-based
Semiconductor Chip Yield Model Incorporating a new defect cluster index.
Microelectronics Reliability, 1999, 39, pp.451-456.
Kim, S.W.; Eun, Y.; Kim, H., Ko, W.J., Jung,Y.G., Choi, Y.G & Cho, D. (1998). Performance
comparison of Loop/piezo and ultrasonic Sensor-based detection system for
collecting individual vehicle information, Proc. 5th world congr. Intell. Trans. System,
Seoul, Korea.
Kim, S.W.; Eun, Y.; Ko, W.J., Kim, H., Cho, I & Cho, D. (1999). A new loop detector circuit
for improving low-speed performance, Proc. 6th world congr. Intell. Trans. System,
Toronto, Canada.
Kim, S.W., Kim, K. & Lee, J. (2001). Application of fuzzy logic to vehicle classification
algorithm in loop/piezo- sensor fusion systems. Asian Journal of Control, Vol. 3, Nà
1, pp. 64-68, March 2001.
Klette, R.; Schuluns, K. & Koschan, A. (1998). Computer Vision: three Dimensional Data
from images, Springer, Singapore, 1998.
Lanzetta, M. (1998). 3d vision in production processes, part i - state of the art. Automazione e
Strumentazione elettronica Industriale, ANIPLA, XLVI(2), pp. 155-164.
Li, P. & Zhang, Y.M. (2001). Robust sensing of arc length. IEEE Trans. Instrum. Meas, vol.50,
n°3, pp.697-704.
Lowe, D.G & Little, J.J. (2005). Vision-based global localization and mapping for mobile
robots. IEEE Transactions on Robotics, 21 (3), pp.364-375, 2005.
Malamas, E. N., Petrakis, E. G. M., Zervakis, M. E., Petit, L., & Legat, J. D. (2003). A survey
on industrial vision systems, applications and tools. Image and Vision Computing,
21(2), 171–188. ù
Mandani, E.H. (1974). Application of fuzzy algorithms for control of simple dynamic plant.
Proceedings of the IEEE Control and Science, 121, pp. 298-313, 1974.
Miljkovic, O. (2009). Image pre-processing tool, Kragujevac J. Math, 32, pp.97-107, 2009.
Naso, D. & Turchiano, B. (2005). A fuzzy logic based Optical sensor for online Weld
defect detection. IEEE Transactions on industrial informatics, Vol. 1 , n°4,
November 2005.
Nelson, B. J., Papanikolopoulos, N. P., & Khosla, P. K. (1996). Robotic visual servoing and
robotic assembly tasks. IEEE Robotics & Automation Magazine, 3(2), 23–31.
www.intechopen.com
Fuzzy Inference Systems Applied to Image Classification in the Industrial Field 269
Piuri, V. & scotti, F. (2005). Computational Intelligence in Industrial Quality Control. IEEE
Proceed. International Workshop on Intelligence signal, pp. 4-9, 1-3 September, 2005,
Faro, Portugal.
Princen, J., Yuen, H., Illingworth, J. & Kittler, J. (1992). Properties of the adaptive hough
transform. Proc. 6th scandinavian conference on Image Analysis, Oulu Finland, June,
1992.
Proakis, J.G. & Manolakis, D.G. (1996). Digital Signal Processing : Principles, Algorithms
and Applications. Upper Saddle River, NJ: Prentice Hall.
Quinlan, J.R. (1993). c4.5: Programs for Machine Learning, Morgan Kaufmann Publisher. New
York.
Rabiner, L.R. & Gold, B. (1975). Theory and Application of Digital Signal Processing.
Englewood Cliffs, NJ: Prentice Hall.
Roque, G., Musmanno, R.M., Montenegro, A. & Clua, E.W.G (2010). Adapting Sobel edge
detector and canny edge extractor for iphone 3GS architecture, Proceedings of the
17th International Conference on Systems, Signals and Image Processing, IWSSIP, PP.
486-489, 2010.
Rosenfeld, A. (1969). Picture Processing by Computer, Academic Press, London UK, 1969.
Roudys, S.J. & Jain, A.K. (1991). Small sample size effect in statistical pattern
recognition. IEEE Trans. on Pattern Analysis and Machine Intelligence, Vol.13, n°3,
pp.252-264.
Rutishauser, U.; Joller, J. & Douglas, R. (2005). Control and learning of ambience by an
intelligence building, IEEE trans. on systems Man and Cybernetics, Vol.35 n°1.
Sforza, P. & de Blasiis (2002). On line optical monitoring system for arc welding, NDT & E
Int, vol. 35, n°1, pp.37-43.
Sgarbi, M.; Colla, V. & Bioli, G. (2010). A 3D vision-based solution for product picking
in industrial applications. Cap. 10 Intelligent Systems in Operations Methods
Models and Applications in the Supply Chain, pp. 190-208, IGI Global, USA ISBN:
9781615206056
Sobel, I.E. (1970). Camera Models and Machine Perception. PhD Thesis, Stanford University,
1970.
Stolzenberg, M. & Geisler, S. (2003). Status of surface inspection at steel production.proc. of
the 3rd European Rolling conference. pp.311-316.
Tong, L.; Yang, C.; Chen, M.; Yu,H. & Wang, M. (2003). Process chart for controlling wafer
defects using fuzzy theory. Proceedings of the Third International Conference on
electronic business (ICEB 2003), 9-13 December 2003, Singapore (China).
Trucco, E. & Verri, A. (1998). Introductory Techniques for 3D computer vision. Prentice Hall,
1998.
Wandell, B.A. ; El Gamal, A.; Girod, B. (2002). Common principles of image acquisition
systems and biological vision. Proceedings of the IEEE, Vol. 90, Issue 1, pp.5-17,
January 2002.
Wen, M. & Zhong, C. (2008). Application of Sobel Algorithm in Edge Detection of Images.
China High-Tech Enterprise, pp.57-62, July, 2008.
Werbos, P.J. (1974). The roots of Backpropagation, John Wiley & Sons Inc. New York.
Widrow, B. & Sterns, D. (1985). Adaptive Signal Processing. New york Prentice Hall, 1985.
www.intechopen.com

Fuzzy Inference System – Theory and Applications 270
Xia, Y.; Leung, H. & Bossè, E.(2002). Neural data fusion algorithms based on a linearly
constrained least square method. IEEE Trans on Neural Networks, Vol. 13, pp.320-
329, Mar 2002.
Zadeh, L.A. (1965) Fuzzy sets. Information and Control, Vol. 8, pp.338-353, 1965.
www.intechopen.com

Fuzzy Inference System - Theory and ApplicationsEdited by Dr. Mohammad Fazle Azeem
ISBN 978-953-51-0525-1Hard cover, 504 pagesPublisher InTechPublished online 09, May, 2012Published in print edition May, 2012
InTech EuropeUniversity Campus STeP Ri Slavka Krautzeka 83/A 51000 Rijeka, Croatia Phone: +385 (51) 770 447 Fax: +385 (51) 686 166www.intechopen.com
InTech ChinaUnit 405, Office Block, Hotel Equatorial Shanghai No.65, Yan An Road (West), Shanghai, 200040, China
Phone: +86-21-62489820 Fax: +86-21-62489821
This book is an attempt to accumulate the researches on diverse inter disciplinary field of engineering andmanagement using Fuzzy Inference System (FIS). The book is organized in seven sections with twenty twochapters, covering a wide range of applications. Section I, caters theoretical aspects of FIS in chapter one.Section II, dealing with FIS applications to management related problems and consisting three chapters.Section III, accumulates six chapters to commemorate FIS application to mechanical and industrialengineering problems. Section IV, elaborates FIS application to image processing and cognition problemsencompassing four chapters. Section V, describes FIS application to various power system engineeringproblem in three chapters. Section VI highlights the FIS application to system modeling and control problemsand constitutes three chapters. Section VII accommodates two chapters and presents FIS application to civilengineering problem.
How to referenceIn order to correctly reference this scholarly work, feel free to copy and paste the following:
Silvia Cateni, Valentina Colla, Marco Vannucci and Alice Borselli (2012). Fuzzy Inference Systems Applied toImage Classification in the Industrial Field, Fuzzy Inference System - Theory and Applications, Dr. MohammadFazle Azeem (Ed.), ISBN: 978-953-51-0525-1, InTech, Available from:http://www.intechopen.com/books/fuzzy-inference-system-theory-and-applications/fuzzy-inference-systems-applied-to-image-classification-in-the-industrial-field

© 2012 The Author(s). Licensee IntechOpen. This is an open access articledistributed under the terms of the Creative Commons Attribution 3.0License, which permits unrestricted use, distribution, and reproduction inany medium, provided the original work is properly cited.