Embed Size (px)
Citation preview
8/7/2019 Fuzzy data mining
http://slidepdf.com/reader/full/fuzzy-data-mining 1/21
Fuzzy Association rule on very large database
Problem statement
presently there is one issue related to large database i.e now a days database isavailable in large size ,for association it require whole data at one time which cannotfit in to main memory ,so presently algorithm like Apriori, is a very slow andinefficient algorithm for very large datasets (in the order of millions of transactions).Some algorithm have been to solve this memory problem by presenting varioussolution like Partitioning, sampling approach is used [2 ],or two phase miningapproch[3 ],or A novel combination of features like two -phased multiplepartitiontidlist-style processing, byte-vector representationof tidlists,[1]
1.Introduction:
Mining association rules is one of the most important tasks in data mining. Severalapproaches generalizing association rules to fuzzy association rules have beenproposed. In this paper .we present a general framework for mining fuzzyassociation rule.
Fuzzy logic
Fuzzy Logic [8] was initiated in 1965 byLotfi A. Zadeh , professor for computerscienceat the University of California in Berkeley. Basically, Fuzzy Logic(FL) is a multivalued logic, thatallows intermediate values to be defined betweenconventional evaluations like true/false, yes/no,high/low, etc. Notions like rather tallor very fast can be formulated mathematically and processed bycomputers, in order
to apply a more human-like way of thinking in the programming of computers[4].Fuzzy Logic has emerged as a a profitabletool for the controlling and steering of of systems and complex industrial processes, as well as forhousehold andentertainment electronics, as well as for other expert systems and applications liketheclassification of SAR data.
1.1.2. FUZZY SETS AND CRISP SETS The very basic notion of fuzzy systems is a fuzzy (sub)set. In classical mathematicswe are familiarwith what we call crisp sets. For example, the possible interferometrycoherence g values are the setX of all real numbers between 0 and 1 . From this setX a subset A can be defined, (e.g. all values 0 _g _ 0.2). The characteristic functionof A, (i.e. this function assigns a number 1 or 0 to each elementin X, depending on
whether the element is in the subset A or not) is shown in Fig.1.The elements which have been assigned the number 1 can be interpreted as theelements that are inthe set A and the elements which have assigned the number 0as the elements that are not in the set
8/7/2019 Fuzzy data mining
http://slidepdf.com/reader/full/fuzzy-data-mining 2/21
Figure 1: Characteristic Function of a Crisp Set
This concept is sufficient for many areas of applications, but it can easily be seen,that it lacksin flexibility for some applications like classification of remotely senseddata analysis. For exampleit is well known that water shows low interferometry
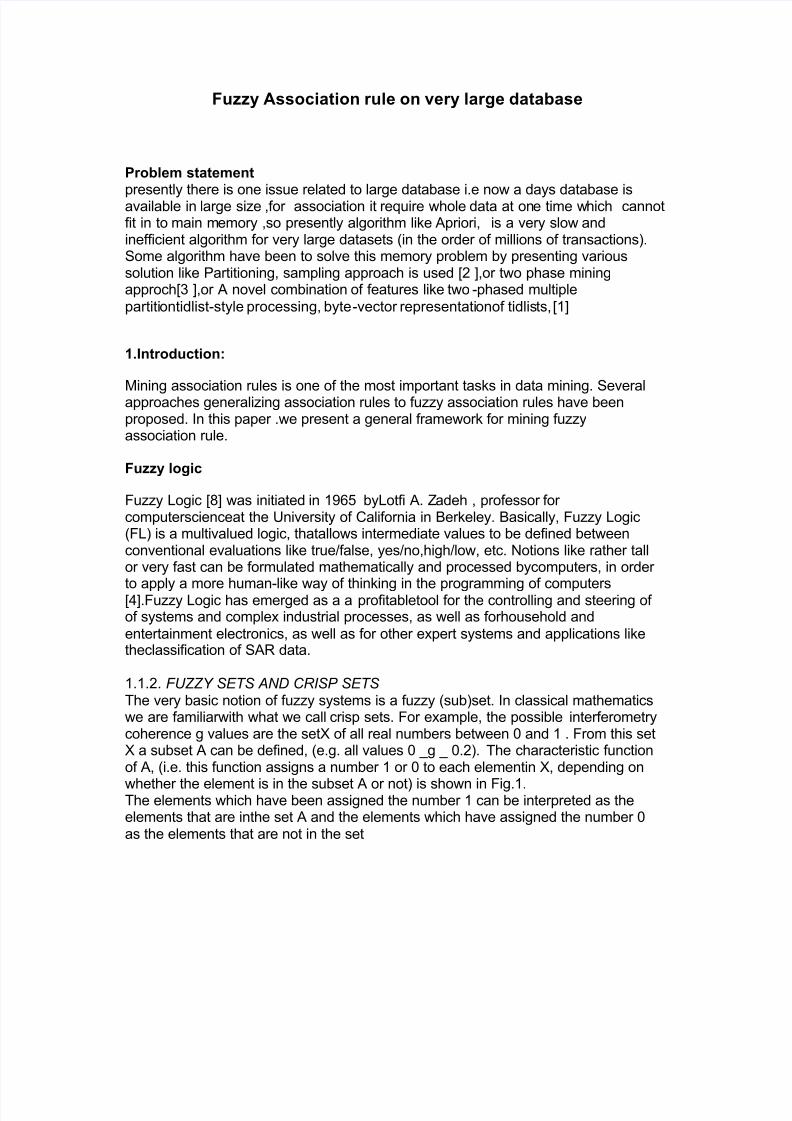
coherence g in SAR images. Since g starts at0, the lower range of this set ought to beclear. The upper range, on the other hand, is rather hardto define. As a first attempt,we set the upper range to 0.2. Therefore we get B as a crisp intervalB=[0,0.2]. Butthis means that a g value of 0.20 is low but a g value of 0.21 not. Obviously, this isastructural problem, for if we moved the upper boundary of the range from g =0.20 toan arbitrarypoint we can pose the same question.A more natural way to construct the set B would be to relaxthe strict separationbetween low and not low. This can be done by allowing not only the (crisp)decisionYes/No, but more flexible rules like ´ fairly low´. A fuzzy set allows us to define suchanotion.The aim is to use fuzzy sets in order to make computers more ¶intelligent¶, therefore,the ideaabove has to be coded more formally. In the example, all the elements were
coded with 0 or 1. Astraight way to generalize this concept is to allow more valuesbetween 0 and 1. In fact, infinitel ymany alternatives can be allowed between theboundaries 0 and 1, namely the unit interval I = [0, 1].The interpretation of thenumbers, now assigned to all elements is much more difficult. Of course,again thenumber 1 assigned to an element means that the element is in the set B and 0 meansthatthe element is definitely not in the set B. All other values mean a gradualmembership to the set B.This is shown in Fig. 2.
Figure 2: Characteristic Function of a Fuzzy Set
8/7/2019 Fuzzy data mining
http://slidepdf.com/reader/full/fuzzy-data-mining 3/21
The membership function is a graphical representation of the magnitude
ofparticipation of each input. It associates a weighting with each of the inputs that areprocessed, definefunctional overlap between inputs, and ultimately determines anoutput response. The rules use theinput mem bership values as weighting factors todetermine their influence on the fuzzy output sets ofthe final output conclusion.The
membership function, operating in this case on the fuzzy set of interferometriccoherence g,returns a value between 0.0 and 1.0. For example, an interferometriccoherence g of 0.3 has a membershipof 0.5 to the set low coherence (see Fig. 2). Itis important to point out the distinction betweenfuzzy logic and probability. Bothoperate over the same numeric range, and have similar values : 0.0representingFalse (or non-membership), and 1.0 representing True (or full -membership).However,there is a distinction to be made between the two statements: Theprobabilistic approach yields thenatural -language statement, ´There is an 50%chance that g is low,´ while the fuzzy terminology correspondsto ´g¶s degree of membership within the set of low interferometric coherence is 0.50.´Thesemantic difference is significant: the first view supposes that g is or is not low; itis just that we onlyhave an 50% chance of knowing which set it is in. By contrast,
fuzzy terminology supposes that g is´more or less´ low, or in some other termcorresponding to the value of 0.50.
OPERATI ONS ON FUZZY SETS We can introduce basic operations on fuzzy sets. Similar to the operations on crisp sets we also wantto intersect, unify
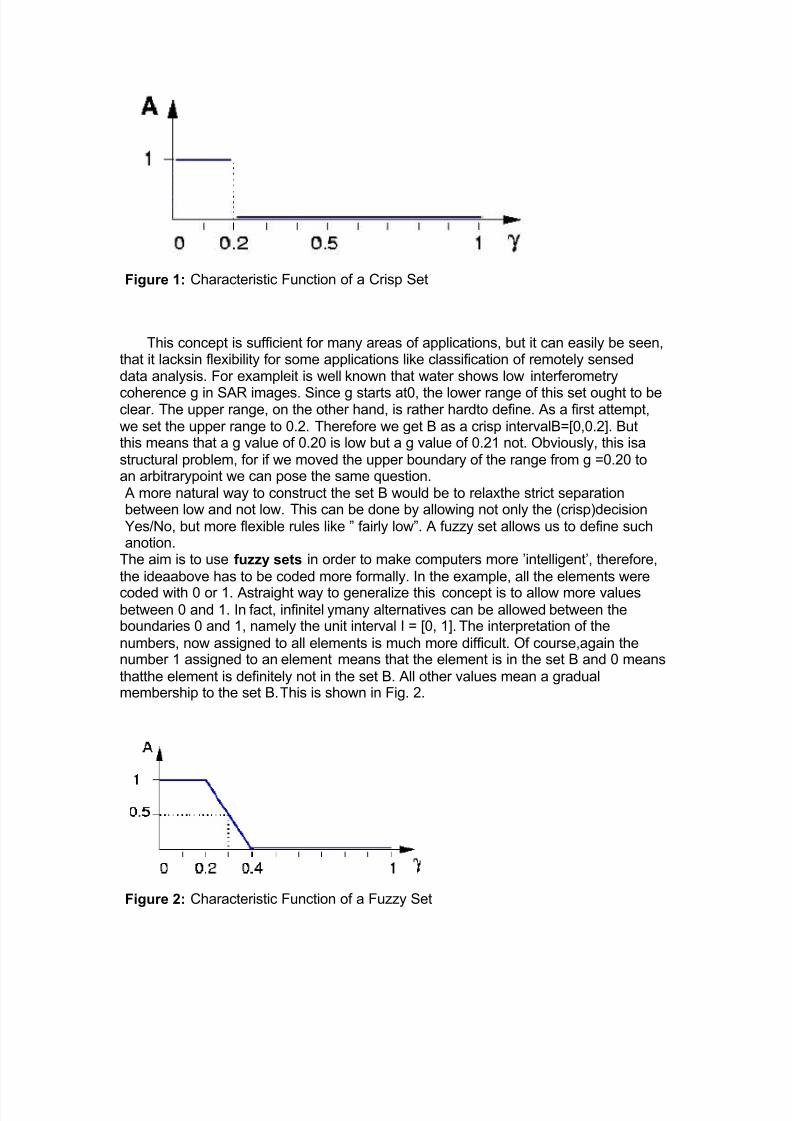
and negate fuzzy sets. In his very first paper about fuzzy sets [1], L. A. Zadehsuggested the minimum operator for theintersection and the maximum operator for the union of twofuzzy sets. It can be shown that these operators coincidewith the crisp unification, and intersectionif we only consider the membership degrees 0 and 1. For example, if A is afuzzy interval between 5and 8 and B be a fuzzy number about 4 as shown in the Figure below
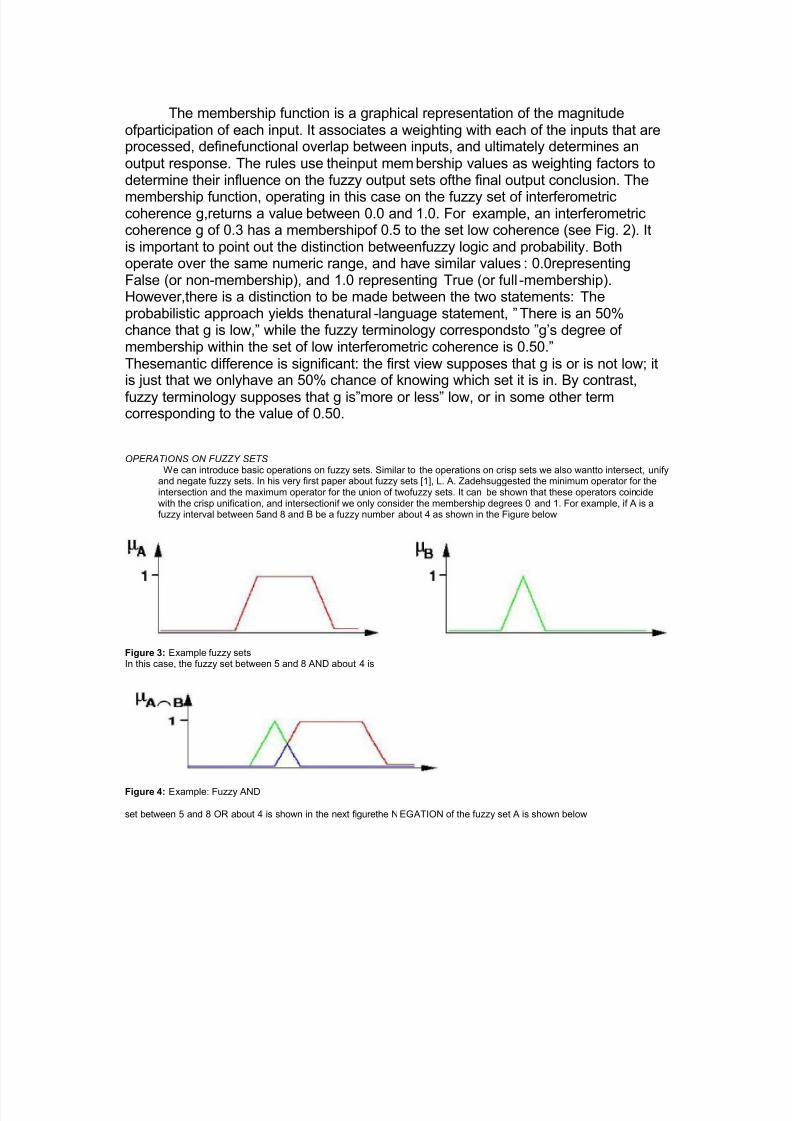
Figure 3: Example fuzzy setsIn this case, the fuzzy set between 5 and 8 AND about 4 is
Figure 4: Example: Fuzzy AND
set between 5 and 8 OR about 4 is shown in the next figurethe NEGATION of the fuzzy set A is shown below

8/7/2019 Fuzzy data mining
http://slidepdf.com/reader/full/fuzzy-data-mining 4/21
Figure 5: Example: Fuzzy OR
Figure 6: Example: Fuzzy NEGATIONFuzzy
Application of fuzzy logic in data mining.
Fuzzy logic provides framework for dealing with quantitatively , mathematically, &
logically with semantic , ambiguous, elastic & vague concept .it is well proven &well
established logic of degree .In data mining we are dealing with large amount of data
which uncertain or vague in nature .In particular medical , m icromonics ,sociological,
marketing, database the linguistic form of data representation is widely used
Fuzzy set theory provides excellent tools to model the ³fuzzy´ boundaries of linguisticterms by introducing gradual membership. In classical set theory, an object is either amember of a given set or not. Fuzzy set theory makes it possible that an object or acase belongs to a set only to a certain degree, thus modeling the uncertainty of thelinguistic term describing the property that defines the set.Member degrees of fuzzy sets include similarity, preference, and uncertainty.They can state how similar an object or case is to a ideal one, they canindicate preferences between suboptimal solutions to a problem, or they can modeluncertainty about the real life situation if the scen ario is described in an imprecisemanner. Due to their closeness to human reasoning, a solution obtained using fuzzyapproaches is easy to understand and to apply. Fuzzy systems are therefore goodcandidate to choose, if linguistic, vague, or imprecise inf ormation has to be
modeled and analyzed.Fuzzy set theory can use in data mining system for performing rule ±basedclassification ,clustering, association rule mining
Association rule
The discovery of association rules constitutes a very important task in the processof data mining. Association rules are an important class of regularities withindata which

8/7/2019 Fuzzy data mining
http://slidepdf.com/reader/full/fuzzy-data-mining 5/21
have been extensively studied by the data mining community. Thegeneral objectivehere is to find frequentco-occurrences of items within a set oftransactions. The foundco-occurrences are called associations. The idea of discoveringsuch rules is derived from market basket analysis where the goal is tomine patterns describing the customer's purchase behavior
BasicsWe state the problem of mining association rules as follows:I ={i 1 , i 2 , ... , im} isa set of items, T ={t 1 , t 2 , ... , tn} is a set of transactions, each of which containsitems of the itemset I . Thus, each transaction ti is a set of items suchthatti I . An association rule is an implication of the form: X Y, where X I ,Y I andX Y = . X (or Y ) is a set of items, called itemset .An example for a simple association rule would be { bread }{butter } . Thisrule saysthat if bread was in a transaction, butter was in most cases in thattransaction too. Inother words, people who buy bread often buy butter as well.Such a rule is based onobservations of the customer behavior and is a resultfrom the data stored intransaction databases. Looking at an association rule of the form X Y ,X would becalled the antecedent,Y the consequent. It is obvious that the value of the
antecedent impliesthe value of the consequent. The antecedent, also called the ³ left handside´ of a rule, can consist either of a single item or of a whole set of items.Thisapplies for the consequent, also called the ³ right hand side´, as well. The mostcomplex task of the whole association rule mining process is thegeneration of frequent item sets. Many different combinations of items have tobe explored whichcan be a very computation-intensive task, especially in largedatabases. As most of the business databases are very large, the need for efficientalgorithms that can extract itemsets in a reasonable amount of time is high.Oft en, acompromise has to be made between discovering all itemsets and computationtime.Generally, only those itemsets that fulfill a certain support requirementare taken intoconsideration. Support and confidence are the two most importantquality measuresfor evaluating the interestingness of a rule.Support: The support of the rule X Y is the percentage of transactions in T thatcontain X Y . It determines how frequent the rule is applicable to thetransaction setT . The support of a rule is represented by the formulaSup (X Y)=X Y / n
whereX Y is the number of transactions that contain all the items of therule and nis the total number of transactions.The support is a useful measure to determinewhether a set of items occursfrequently in a database or not. Rules covering only afew transactions might notbe valuable to the business. The above presented formula computes therelativesupport value, but there also exists an absolute support. It works similarly
butsimply counts the the number of transactions where the tested itemsetoccurswithout dividing it through the number of tuples.Confidence: The confidence of a rule describes the percentage of transactionscontaining X which also contain Y .Conf( X Y)=X Y X This is a very important measure to determine whether a rule is interesting or not. It looks at all transactions which contain a certain item or itemset defined by

8/7/2019 Fuzzy data mining
http://slidepdf.com/reader/full/fuzzy-data-mining 6/21
the antecedent of the rule. Then, it computes the percentage of the transactionsalso including all the items contained in the consequent.3.1.1 The ProcessThe process of mining association rules consists of two main parts. First, wehave to identify all the itemsets contained in the data that are adequate for miningassociation rules. These combinations have to show at least a certain frequency
to be worth mining and are thus called frequent itemsets. The secondstep will generate rules out of the discovered frequent itemsets.1. Mining Frequent Patterns
Mining frequent patterns from a given dataset is not a trivial task. All setsof items that occur at least as frequently as a user-specified minimumsupport have to be identified at this step. An important issue is the computationtime because when it comes to large databases there might b e alot of possible itemsets all of which need to be evaluated. Different algorithmsattempt to allow efficient discovery of frequent patterns.2. Discovering Association Rules
After having generated all patterns that meet the minimum support requirements,rules can be generated out of them. For doing so, a minimum
confidence has to be defined. The task is to generate all possible rules inthe frequent itemsets and then compare their confidence value with theminimum confidence (which is again defined by the user). All rules thatmeet this requirement are regarded as interesting. Frequent sets that donot include any interesting rules do not have to be considered anymore.All the discovered rules can in the end be presented to the user with their support and confidence values.
General model of Fuzzy Association rule mining
Regular Data set (quantitative categorical, relational)
Discovering fuzzy set and fuzzy member function
Frequent item set generation
Finding rule using fuzzy operation or Quality Measures
Fuzzy Association Rule Algorithm
8/7/2019 Fuzzy data mining
http://slidepdf.com/reader/full/fuzzy-data-mining 7/21
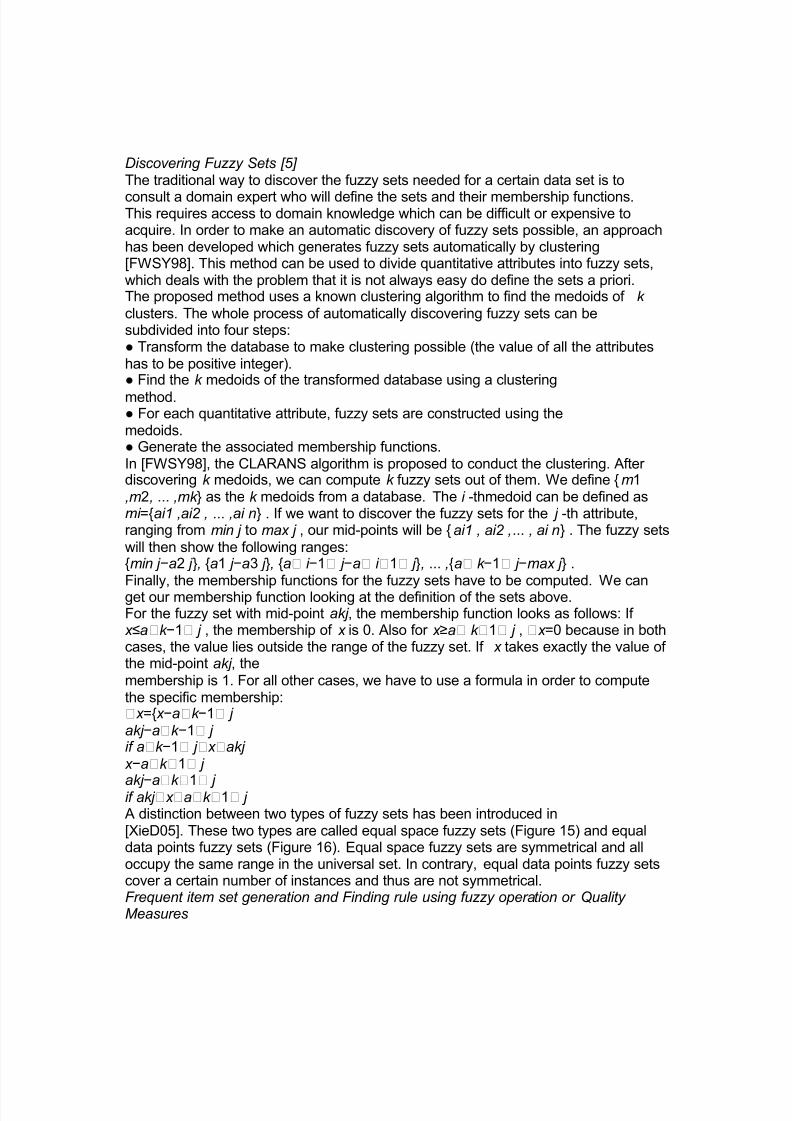
Discovering Fuzzy Sets [5] The traditional way to discover the fuzzy sets needed for a certain data set is to
consult a domain expert who will define the sets and their membership functions.This requires access to domain knowledge which can be difficult or expensive toacquire. In order to make an automatic discovery of fuzzy sets possible, an approachhas been developed which generates fuzzy sets automatically by clustering[FWSY98]. This method can be used to divide quantitative attributes into fuzzy sets,which deals with the problem that it is not always easy do define the sets a priori.The proposed method uses a known clustering algorithm to find the medoids of k clusters. The whole process of automatically discovering fuzzy sets can besubdivided into four steps: Transform the database to make clustering possible (the value of all the attributeshas to be positive integer). Find the k medoids of the transformed database using a clustering
method. For each quantitative attribute, fuzzy sets are constructed using themedoids. Generate the associated membership functions.In [FWSY98], the CLARANS algorithm is proposed to conduct the clustering. After discovering k medoids, we can compute k fuzzy sets out of them. We define {m1,m2, ... ,mk } as the k medoids from a database. The i -thmedoid can be defined asmi ={ai1 ,ai2 , ... ,ai n} . If we want to discover the fuzzy sets for the j -th attribute,ranging from min j to max j , our mid-points will be {ai1 , ai2 ,... , ai n} . The fuzzy setswill then show the following ranges:{min j ía2 j }, {a1 j ía3 j }, {a i í1 j ía i 1 j }, ... ,{a k í1 j ímax j } .Finally, the membership functions for the fuzzy sets have to be computed. We canget our membership function looking at the definition of the sets above.For the fuzzy set with mid-point akj , the membership function looks as follows: If x �ak í1 j , the membership of x is 0. Also for x �a k 1 j , x =0 because in bothcases, the value lies outside the range of the fuzzy set. If x takes exactly the value of the mid-point akj , themembership is 1. For all other cases, we have to use a formula in order to computethe specific membership:x ={x íak í1 j akj íak í1 j if ak í1 j x akj x íak 1 j
akj íak 1 j if akj x ak 1 j A distinction between two types of fuzzy sets has been introduced in[XieD05]. These two types are called equal space fuzzy sets (Figure 15) and equaldata points fuzzy sets (Figure 16). Equal space fuzzy sets are symmetrical and alloccupy the same range in the universal set. In contrary, equal data points fuzzy setscover a certain number of instances and thus are not symmetrical.Frequent item set generation and Finding rule using fuzzy operation or Quality Measures

8/7/2019 Fuzzy data mining
http://slidepdf.com/reader/full/fuzzy-data-mining 8/21
´The occurrence frequency of an item set is number of transaction that c ontain theitem set this also known of as simply frequency ,support . ´
The following concepts are important when dealing with fuzzy sets [KlFo88]:
Support: The support of a fuzzy set A is given by a crisp set that contains all of theelements whose membership degree in A is not 0:sup(A)={ x X / MA(x) >0} .The empty fuzzy set has an empty supportset. Where MA(x) is member ship function Height: The height of a fuzzy set is defined by the largest membershipvalue attainable by an element of the set . The fuzzy set is called normalized if atleast one of its elements attains the highest membership grade. -cut: The -cut of a fuzzy set is defined by a crisp set A containing all elementsthat have a membership grade to the fuzzy set that is greater than 0. Scalar cardinality: The summation of the membership grades of all elements in afuzzy set is called its scalar cardinality.
[7] Let D = {t 1,t 2 ,«,t n} characterized by a seti= {i1 ,i2 , im, }of attributes. For eachattribute ij( I � j � m ) there is a correspondingfuzzy set{ i1j ,i2j , , iqj }, each elementin interval[0,1] . A fuzzy association rule is of theform AB,where A if , B i f , and A B = .Within the rule AB,A is called the antecedent while B is called the consequent of the rule.Definition 1 A t-norm is a commutative, associative andnon-decreasing function, T :[0,1]2 [0,1] with the followingpropertyT (x ,1) = x for all x in[0,1] .Definition 2 Let fuzzy itemset 1 X = {x 1,x2, ,xm } x I f ,the support of X on ith record is
supTi (x) = T(x1i,«. xpi) when T(x1i,«. xpi) >=a*ms= 0 when T(x1i,«. xpi) < a*ms
wherexji is the membership value of item setxj on ith record,
[0,1] Xji i =1,2,..,nj = 1,2,«p.T is one t-normoperators, ais one constant called adjusting factor,msrepresents minimum threshold. Formula 1 is the form of support degree when Ds equal to a Xmsin paper [3] .
Definition 3 Let fuzzy itemset 1 2 { , , , } m X = x x x f I ,
the support degree of X in Df is
The fuzzy itemsetX is called frequent fuzzy itemset, whensupport of X is grater than or equal to given ms.Definition 4 the support degree of fuzzy association rules isdefined asSup(X Y ) = Sup( X Y ) .whereX I f , f Y I , X Y = , X Y .Definition 5 the confidence of fuzzy association rules is

8/7/2019 Fuzzy data mining
http://slidepdf.com/reader/full/fuzzy-data-mining 9/21
defined as( ) ( )( )Conf X Y Sup X Y Sup X
= . (4)wheref X I , f Y I , X Y = .
Proposition 1 Let { } 1 2 , , , p f X = x x x I is frequent fuzzyitemset, for any subset of X is frequent fuzzy itemset.Proposition 2 Let { } 1 2 , , , p f X = x x x I is fuzzy itemset,given ' , f X X I X � , minimum support ms, if X is notfrequent, then X ¶ is not frequent fuzzy itemset.Proposition 3 Let , f f X I Y I X � ,Y � , X Y
= , given minimum support ms, minimum confidence mc , if X Y is strong fuzzy association rules, for any Y ¶ Y ,X Y ' also is strong fuzzy association rules.Proposition 4 Let , f f X I Y I X � ,Y � , X Y = , given minimum support ms, minimum confidence mc , if X Y is strong fuzzy association rules, for anyX X ' ,I = X 'Y ' , X 'Y ' also is strong fuzzyassociation rules.
FUZZY ASS OCIATI ON RULE MINING ALGORITHM [7]
Many papers have been devoted to develop algorithms tomine fuzzy associationrules. Most of them are an extension ofapriori algorithm. The process of fuzzyassociation rule miningis divided into two phases. In the first step, frequent fuzzy 1 -item sets L1 are generated by scanning the database. By joining L1 to itself, we canget candidate fuzzy itemsetsC 2. Accordingto apriori principle C 2 was pruned to formL2, accordingly,generateL3, ..., Lk. The algorithm for generating fuzzy
association rules from frequent fuzzy itemsets is similar to thatfor mining Boolean association rules.Algorithm: GFFP(Generate Frequent Fuzzy Pattern)Input: D, membership function, msOutput: frequent fuzzy itemsetsMethod:
1 1 L = { frequent 1 fuzzy term sets }
2for (k = 2k 1 L í�k ++) do {
3k C = apriori_gen( k 1 L íms)
4for each i d D do {
5for each candidate k c C do
6 sup = di Sup c 7c.sup = c.sup + sup
8 }
9k L = | .sup k c C c �ms
10 }
11L = k k LIn the course of generating L1, there are two methods toselect the fuzzy itemsets:

8/7/2019 Fuzzy data mining
http://slidepdf.com/reader/full/fuzzy-data-mining 10/21
(1). According to the principle of maximum membership value, only take themaximum degree of membership of fuzzyitem [4] into L1. This method reduces thecomputational work,but it will lose some useful information.(2). The fuzzy item areincorporated into L1 when thesupport of fuzzy item larger than or equal given ms. Inthis case,the follow-up calculation is more than the first methods, butcan effectivelyreduce the amount of lost information .
As same above algorithm by taking Approach of Apriori algorithm we can takeapproach of FP-tree algorithm to generate fuzzy association ruleFuzzy Association rule is used in various application such as Face Recognition [ 9],intrusion detection system us ing FAR[10],mining generalized FAR from weblogs [11 ],Mining FAR from questinaory data [12 ]there are many methods are present
Conclusion
Fuzzy association rules use fuzzy logic toconvert numerical attributes to fuzzyattributes, like³Income = High´, thus maintaining the integrity ofinformation conveyedby such numerical attributes. On theother hand, crisp association rules use sharppartitioning totransform numerical attributes to binary ones like ³Income= [100K andabove]´, and can potentially introduce loss ofinformation due to these sharp ranges.Fuzzy Apriori and itsdifferent variations are the only popular fuzzy associationrulemining (ARM) algorithms available today. Like thecrisp version of Apriori, is a veryslow andinefficient algorithm for very large datasets (in the order ofmillions of transactions).So I proposed one solution on above problem that ³Fuzzy association rule miningon very large database´ Because fuzzy association rule mining gives better performance than classicAssociation rule mining
Referenc es:
[1]. ³ Fuzzy Association Rule Mining Algorithm forFast and Efficientperformance on Very Large Datasets ³AshishMangalampalli*, VikramPudi

8/7/2019 Fuzzy data mining
http://slidepdf.com/reader/full/fuzzy-data-mining 11/21
Centre for Data Engineering (CDE), International Institute of InformationTechnology (IIIT), Hyderabad - 500032, India. FUZZY-IEEE 2009[2] ³A SURVEY OF ASSOCIATION RULES´Margaret H. Dunham, Yongqiao Xiao Le Gruenwald, ZahidHossainDepartmentof Computer Science and Engineering Department of Computer ScienceSouthern Methodist University University of Oklahom IEEE
[3] ³A Two-Phase Fuzzy Mining Approach ³Chun-Wei Lin, Tzung-Pei Hong andWen-Hsiang Lu IEEE-2010[4] ³Fuzzy Association Rules: General Modeland Applications ³Miguel Delgado, NicolásMar n, Daniel Sánchez, and Mar a -Amparo Vila IEEE TRANSACTIONS ON FUZZY SYSTEMS, VOL. 11, NO. 2, APRIL 2003[5] ³Fuzzy Association Rules An Implementation in R ³Master Thesis ViennaAuthorBakk. Lukas HelmMatriculation Number: 0251677 Vienna, 2.8.2007Vienna University of Economics and Business Administration [6] ³A STUDY ON EFFECTIVE MINING OFASSOCIATION RULES FROM HUGE DATABASES´ V.Umaraniet. al. / IJCSR International Journal of Computer Science and Research, Vol. 1 Issue 1, 2010[7] ³A General Framework for Fuzzy Data Mining³ Jitao Zhao, Lin YaoDepartment
of Education Technology and InformationXuchang Uni versity, Xuchang, China2010 IEEE [8] ³Applications of Fuzzy Logic in Data Mining Process -³Hang Chen[9] ³Face Recognition using PCA with GNP-fuzzy data mining´SICE AnnuaConference 2010August 18-21, 2010, The Grand Hotel, Taipei, Taiwan[10]³Intrusion detection based on fuzzy association rules´ kaiXing Wu studentDepartment of Information&ElctronicEngineeringHandan ,Hebei Province,China 2010 International Symposium on Intelligence Information Processingand Trusted Computing[11] ³ Mining Generalized Fuzzy Association Rules fromWeb Logs ´ RuiWuSchool of Mathematics and Computer ScienceShanxi Normal University,Shanxi 041004, China 2010 Seventh International Conference on FuzzySystems and Knowledge Discovery (FSKD 2010)[12] ³Mining fuzzy association rules from questionnaire data ´ Yen-Liang Chen *,Cheng-HsiungWengKnowledge-Based Systems 22 (2009) 46±
³Text categorization based on fuzzy set and support vector machine algorithm´
8/7/2019 Fuzzy data mining
http://slidepdf.com/reader/full/fuzzy-data-mining 12/21
Introduction:
Text categorization
The goal of text categorization is the classification of documents into a fixed
number of predefined categories. Each document can be in multiple, exactly one,or no category at all. Using machine learning, the objec tive is to learn classifiersfrom examples which perform the category assignments automatically. This isa supervised learning problem. Since categories may overlap, each category istreated as a separate binary classification problem.
³TC may be defined as the task of assigning a Boolea n value to each pair (d j,, Cj ) D x C. where D is domain of documents and C={c 1,«.c ic } is set of pre-define catagories´
There are four main steps in Text Categorization:[ An Experiment System for TextClassification
Mathias Niepert B652: Computer Models of Symbolic Learning Final Write -Up,Spring 2005]
1) Loading,2) Indexing,3) Classification,
1.Loadingthe Corpus
The first step towards the final classification and evaluationresults, is to load thetraining corpus, that is, toread all the corpus documents, and count up the termanddocument frequencies for every term. The term anddocument frequencies are savedfor every document aswell as for every category and the entire corpus. Thisisnecessary since these values will be of need in lat ercalculations. The term frequencyof a term in a document/category/corpus is the number of times the termoccurs inthe document/category/corpus. The documentfrequency of a term in acategory/corpus is the number of documents which both, contain the term a t least onceand belong to thecategory/corpus, whereas the documentfrequency of a term in a document is abinary value whichindicates if the term occurs in the document or not. For theactualimplementation in Java, I used one class for terms,documents, cat egories, andcorpora, respectively.
1.1 Removal of stop words
In most of the applications, it is practical to remove wordswhich appear too often (inevery or almost every document)and thus support no information for the task.Goodexamples for this kind of words are prepositions, articlesand verbs like ´be´ and´go´. If the box ´Apply stop wordremoval´ is checked, all the words in the file ´swl.txt´areconsidered as stop words and will not be loaded. This filecontains currently the100 most used words in the Englishlanguage [National Literacy Trust, 2005] which

8/7/2019 Fuzzy data mining
http://slidepdf.com/reader/full/fuzzy-data-mining 13/21
on averageaccount for a half of all reading in English. If the box´Apply stop wordremoval´ is unchecked, the stop wordremoval algorithm will be disabled when thecorpus isloaded.The system only considers words which have lengthgreater than one as validtokens. This is due to the fact thatall words with length one seem to be unimportantand wouldhave been sorted out by the later dimensionality reductionstep anyway.
However, it is possible to change tha t easily inthe code.
Stemming
Stemming is the process of grouping words that share thesame morphological root.E.g. ´game´ and ´games´ arestemmed to the root ´game´. The suitability of stemmingto Text Classification is controversial. In some examinations,Stemming hasbeen reported to hurt accuracy.However, the recent tendency is to apply it, sinceitreduces both the dimensionality of the term space andthe stochastic dependencebetween terms.
Term Weighting & Dimensionality Reduction
For many machine learning algorithms it is necessaryto reduce the dimensionality of the feature space, if theoriginal dimensionality of the space is very high. In mostofthe cases this improves not only the performance but alsothe accuracy of theclassification itself. Term Weighting isthe process of assigning values to all the termsin the corpusaccording to their importance for the actual classificationpart. Here,importance is defined as the ability of the termto distinguish between differentcategories in the corpus. Usually, the more important a term is the higher is theassigned weight value. There are already nine differentweighting functionsimplemented
2 .Indexing The step of ³re-representation´ of document is nothing but indexingi.e process of represent a document into a set of keywords as structured data .in this stage we canused fuzzy set [ 5]
3.Classification
Classification is the process which assigns one or more labels ± or no label at all ± toa new (unseen) document. There are many machine learning algorithms which have
been applied to the problem of text categorization, ranging from statistical methods(e.g. Na¨ve Bayes) to black-box algorithmsSo in this we are going to apply support vector machine
.
8/7/2019 Fuzzy data mining
http://slidepdf.com/reader/full/fuzzy-data-mining 14/21
SVM - Support Vector Machines
A Support Vector Machine (SVM) performs classification by constructing an N -dimensional hyper plane that optimally separates the data into two categories
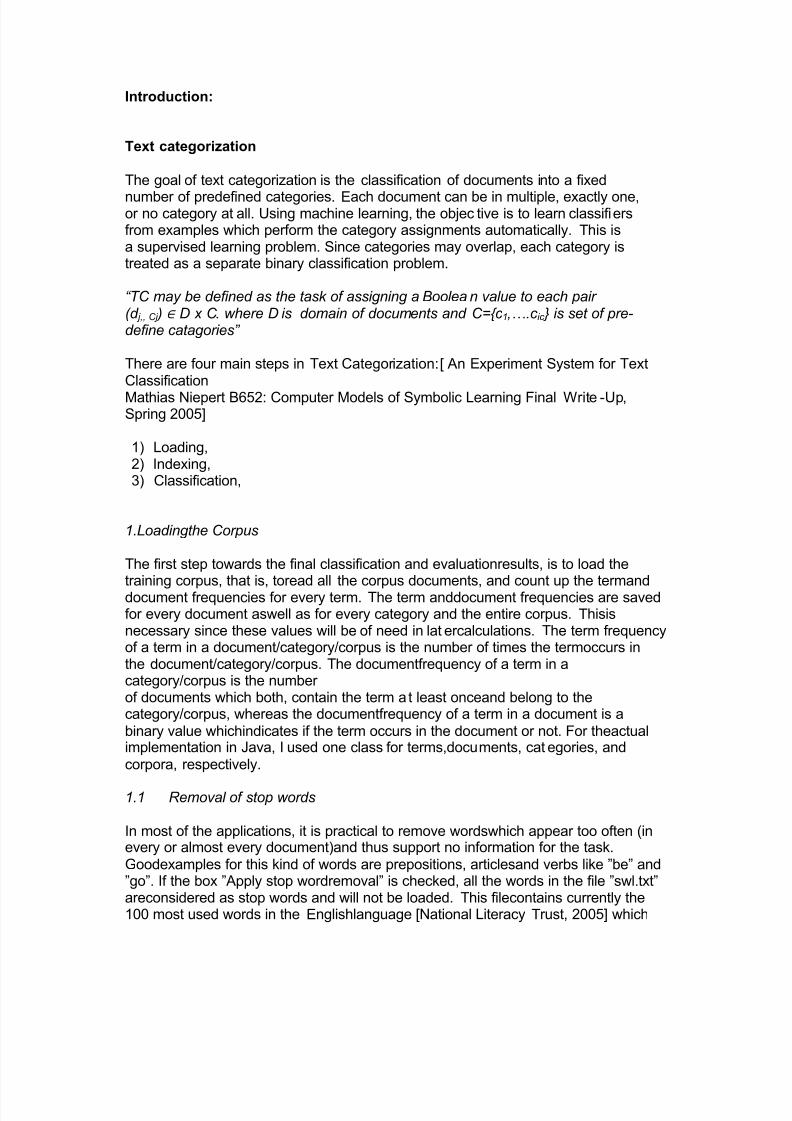
In the parlance of SVM literature, a predictor variable is called an attribute, and atransformed attribute that is used to define the hyperplane is called a feature. Thetask of choosing the most suitable representat ion is known as feature selection. Aset of features that describes one case (i.e., a row of predictor values) is called avector . So the goal of SVM modeling is to find the optimal hyperplane that separatesclusters of vector in such a way that cases with one category of the target variableare on one side of the plane and cases with the other category are on the other sizeof the plane. The vectors near the hyperplane are the support vectors. The figurebelow presents an overview of the SVM process.
A Two-Dimensional Example
A .linear separable
Before considering N -dimensional hyperplanes, let¶s look at a simple 2 -dimensionalexample. Assume we wish to perform a classification, and our data has a categoricaltarget variable with two categories. Also assume that there are two predictor variables with continuous values. If we plot the data points using the value of onepredictor on the X axis and the other on the Y axis we might end up with an imagesuch as shown below. One category of the target variable is represented byrectangles while the other category is represented by ovals.
8/7/2019 Fuzzy data mining
http://slidepdf.com/reader/full/fuzzy-data-mining 15/21
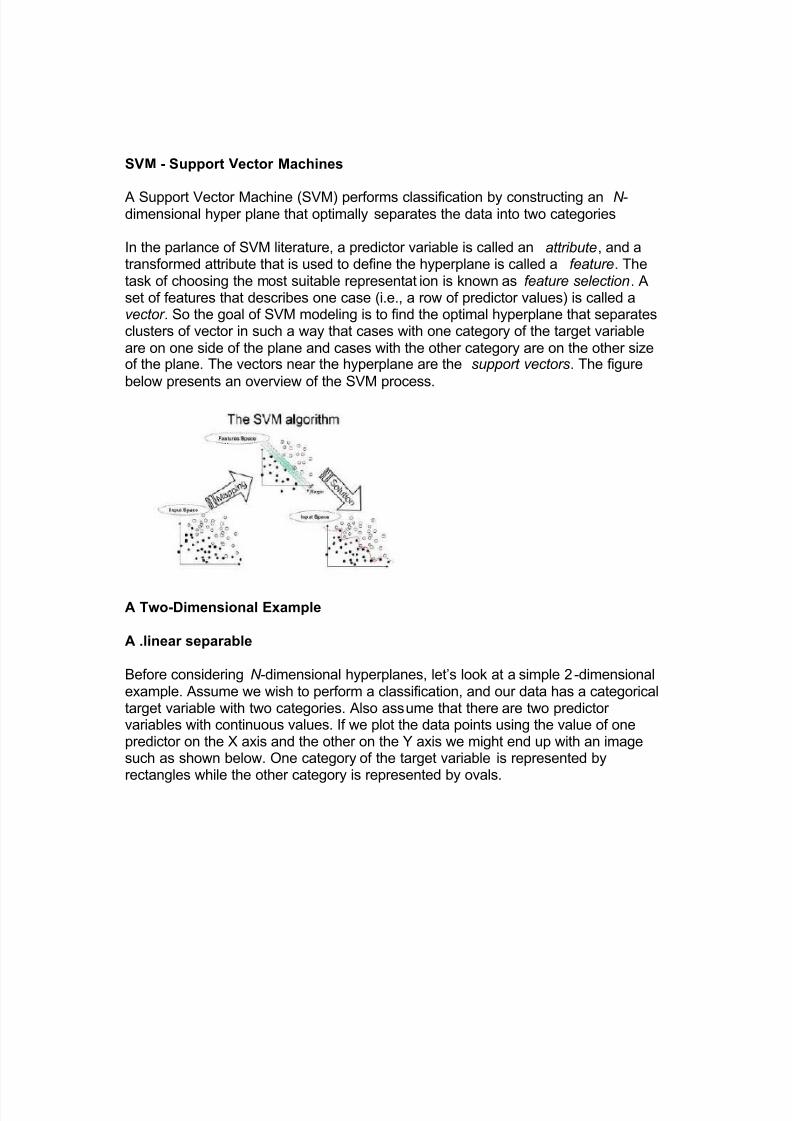
In this idealized example, the cases with one category are in the lower left corner and the cases with the other category are in the upper right corner; the cases arecompletely separated. The SVM analysis attempts to find a 1 -dimensional hyper plane (i.e. a line) that separates the cases based on their target categories. Thereare an infinite number of possible lines; two candidate lines are shown above. Thequestion is which line is better, and how do we define the optimal line.
The dashed lines drawn parallel to the separating line mark the distance between the
dividing line and the closest vectors to the line.T
he distance between the dashedlines is called the margin. The vectors (points) that constrain the width of the marginare the support vectors. The following figure illustrates this
An SVM analysis finds the line (or, in general, hyperplane) that is oriented so that themargin between the support vectors is maximized. In the figure above, the line in theright panel is superior to the line in the left panel.
If all analyses consisted of two-category target variables with two predictor variables,and the cluster of points could be divided by a straight line, life would be easy.Unfortunately, this is not generally the case, so SVM must deal w ith (a) more thantwo predictor variables, (b) separating the points with non -linear curves, (c) handlingthe cases where clusters cannot be completely separated, and (d) handling
classifications with more than two categories.
In the previous example, we had only two predictor variables, and we were able toplot the points on a 2 -dimensional plane. If we add a third predictor variable, then wecan use its value for a third dimension and plot the points in a 3 -dimensional cube.Points on a 2-dimensional plane can be separated by a 1-dimensional line. Similarly,points in a 3-dimensional cube can be separated by a 2-dimensional plane.

8/7/2019 Fuzzy data mining
http://slidepdf.com/reader/full/fuzzy-data-mining 16/21
As we add additional predictor variables (attributes), the data points can berepresented in N -dimensional space, and a (N-1)-dimensional hyperplane canseparate them.
B linear inseparable
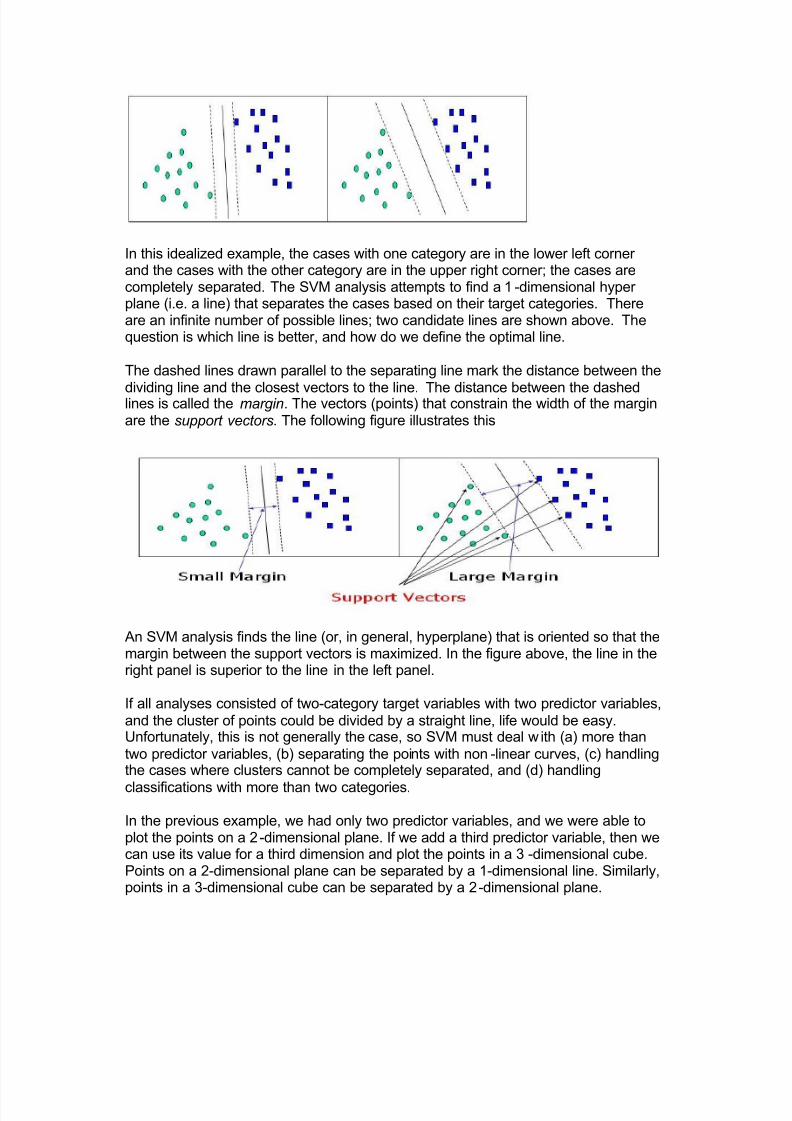
When Straight Lines Go Crooked .The simplest way to divide two groups is with astraight line, flat plane or an N-dimensional hyperplane. But what if the points areseparated by a nonlinear region such as shown below?
In this case we need a nonlinear dividing line.Rather than fitting nonlinear curves tothe data, SVM handles this by using a kernel function to map the data into a differentspace where a hyperplane can be used to do the separation.The kernel function maytransform the data into a higher dimensional space to make it possible to perform theseparation.

8/7/2019 Fuzzy data mining
http://slidepdf.com/reader/full/fuzzy-data-mining 17/21
The concept of a kernel mapping function is very powerful. It allows SVM models toperform separations even with very complex boundaries such as shown below.
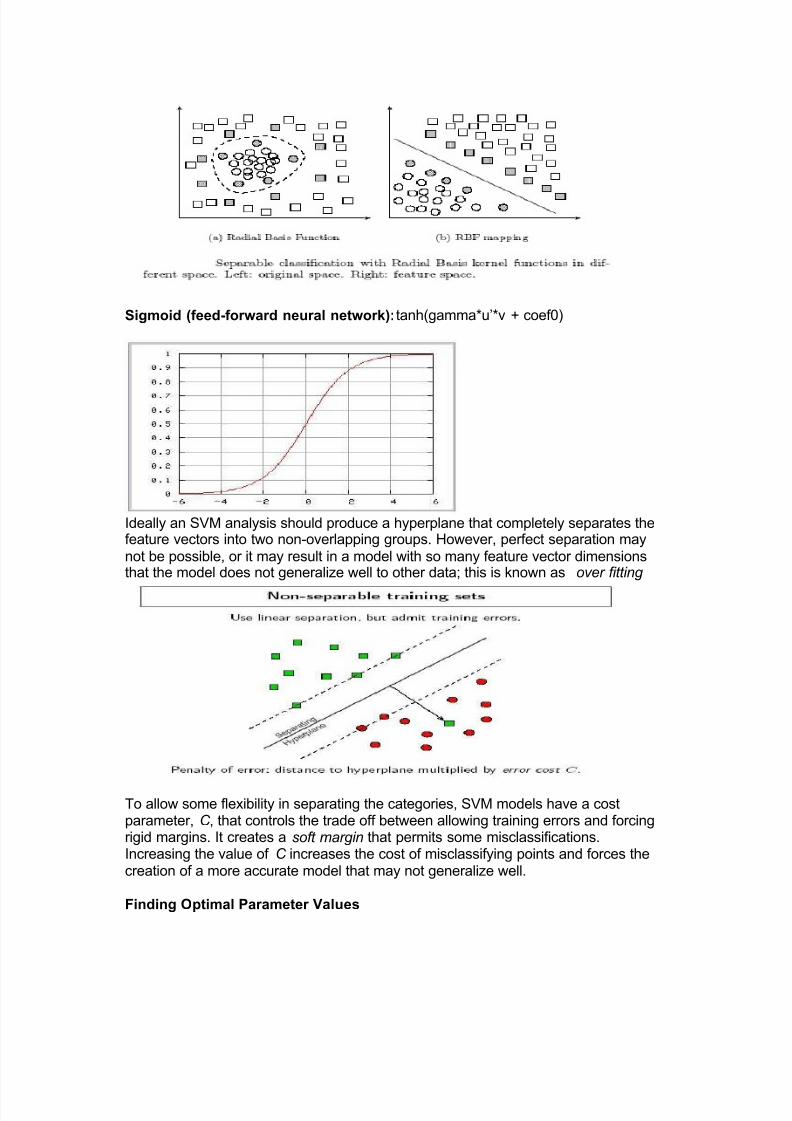
Many kernel mapping functions can be used ± probably an infinite number. But a fewkernel functions have been found to work well in for a wide variety of applications.The default and recommended kernel function is the Radial Basis Function (RBF).
Linear: u¶*v
Polynomial: (gamma*u¶*v + coef0)^degree
Radial basis function:exp(-gamma*|u-v|^2)
8/7/2019 Fuzzy data mining
http://slidepdf.com/reader/full/fuzzy-data-mining 18/21
Sigmoid (feed-forward neural network):tanh(gamma*u¶*v + coef0)
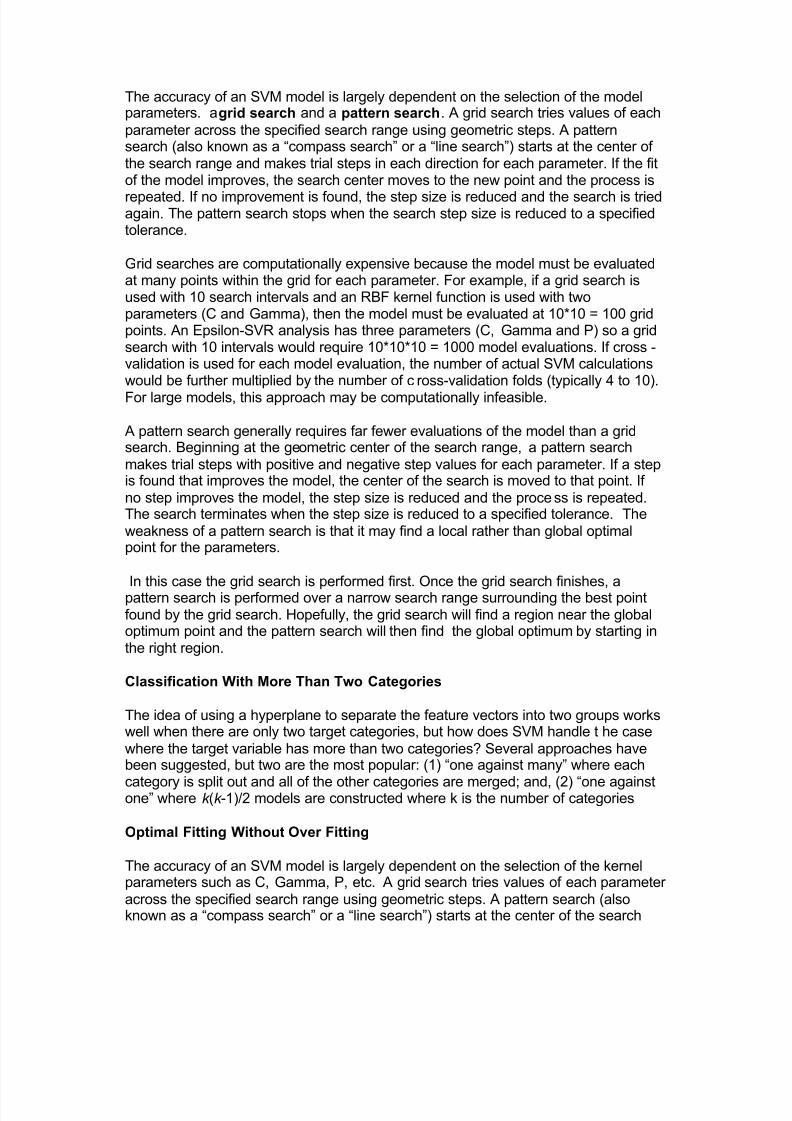
Ideally an SVM analysis should produce a hyperplane that completely separates thefeature vectors into two non-overlapping groups. However, perfect separation maynot be possible, or it may result in a model with so many feature vector dimensionsthat the model does not generalize well to other data; this is known as over fitting
To allow some flexibility in separating the categories, SVM models have a costparameter, C , that controls the trade off between allowing training errors and forcingrigid margins. It creates a soft margin that permits some misclassifications.Increasing the value of C increases the cost of misclassifying points and forces thecreation of a more accurate model that may not generalize well.
Finding Optimal Parameter Values
8/7/2019 Fuzzy data mining
http://slidepdf.com/reader/full/fuzzy-data-mining 19/21
The accuracy of an SVM model is largely dependent on the selection of the modelparameters. agrid search and a pattern search. A grid search tries values of eachparameter across the specified search range using geometric steps. A patternsearch (also known as a ³compass search´ or a ³line search´) starts at the center of the search range and makes trial steps in each direction for each parameter. If the fitof the model improves, the search center moves to the new point and the process is
repeated. If no improvement is found, the step size is reduced and the search is triedagain. The pattern search stops when the search step size is reduced to a specifiedtolerance.
Grid searches are computationally expensive because the model must be evaluatedat many points within the grid for each parameter. For example, if a grid search isused with 10 search intervals and an RBF kernel function is used with twoparameters (C and Gamma), then the model must be evaluated at 10*10 = 100 gridpoints. An Epsilon-SVR analysis has three parameters (C, Gamma and P) so a gridsearch with 10 intervals would require 10*10*10 = 1000 model evaluations. If cross -validation is used for each model evaluation, the number of actual SVM calculationswould be further multiplied by the number of c ross-validation folds (typically 4 to 10).
For large models, this approach may be computationally infeasible.
A pattern search generally requires far fewer evaluations of the model than a gridsearch. Beginning at the geometric center of the search range, a pattern searchmakes trial steps with positive and negative step values for each parameter. If a stepis found that improves the model, the center of the search is moved to that point. If no step improves the model, the step size is reduced and the proce ss is repeated.The search terminates when the step size is reduced to a specified tolerance. Theweakness of a pattern search is that it may find a local rather than global optimalpoint for the parameters.
In this case the grid search is performed first. Once the grid search finishes, apattern search is performed over a narrow search range surrounding the best pointfound by the grid search. Hopefully, the grid search will find a region near the globaloptimum point and the pattern search will then find the global optimum by starting inthe right region.
Classification With More Than Two Categories
The idea of using a hyperplane to separate the feature vectors into two groups workswell when there are only two target categories, but how does SVM handle t he casewhere the target variable has more than two categories? Several approaches havebeen suggested, but two are the most popular: (1) ³one against many´ where each
category is split out and all of the other categories are merged; and, (2) ³one againstone´ where k (k -1)/2 models are constructed where k is the number of categories
Optimal Fitting Without Over Fitting
The accuracy of an SVM model is largely dependent on the selection of the kernelparameters such as C, Gamma, P, etc. A grid search tries values of each parameter across the specified search range using geometric steps. A pattern search (alsoknown as a ³compass search´ or a ³line search´) starts at the center of the search

8/7/2019 Fuzzy data mining
http://slidepdf.com/reader/full/fuzzy-data-mining 20/21
range and akes tr ial steps in each directi n f r each parameter . If the fit f the model improves, the search center moves to the new point and the process is repeated. If no improvement is f ound, the step si e is reduced and the search is tr ied again. The pattern search stops when the search step si e is reduced to a spec ified tolerance.
To avoid over fitting, cross-validation is used to evaluate the fitting provided each parameter value set tr ied dur ing the gr id or pattern search process.
The f ollowing figure lor ian arkowet illustrates how diff erent parameter val ues may cause under or over fitting:
Why should SV work f ot text classification [ ]
igh dimentionalinpit space ew irrelevant f eatures ocument vector are sparse ost text classification problem are linear separeble
T E ET TEXT ASSI I ATI BASED Y SET A D S PP T VECT ACHI E is based on paper [ m i ] in witch rough set and svm is used so we can try f uzzy set instead of that so our procedure may be come in
f ollowing way
Text categor ization f eatures item selection weight discretizatio f uzzy set
SV algor ithm final result

8/7/2019 Fuzzy data mining
http://slidepdf.com/reader/full/fuzzy-data-mining 21/21
[1] ³T
he Algorithm of T
ext Classification Based on Rough Set and Support Vector Machine´ Wang Zhuocollege of business administration Liaoning TechnicalUniversity978-1-4244-5824-0/$26.00 _c 2010 IEEE [2] ³Text categorization with SVM: Learning with many relevant features´ ThorstenJoachin IEEE-1997[3] ³An Experiment System for Text ClassificationMathias NiepertB652: Computer Models of Symbolic LearningFinal Write-Up, Spring 2005[4] ³Application for Web Text Categorization Based on Support Vector MachinePan Hao, Duan Ying, Tan LongyuanSchool of Computer Science andTechnology, Wuhan University of Technology (WUHT),Wuhan430070, China2009 International Forum on Computer Science-Technology and Applications[5] ³textcategarization with concept of fuzzy set for informative keyword´
Taecho C. joS/w business team Samsung SDS IEEE -2010