Embed Size (px)
Citation preview

FutureGrid.BC’s Energy Options in a Changing Environment
Is BC a Net Importer or Exporter of Electricity?
Amy Sopinka and G. Cornelis van KootenUniversity of Victoria
June 2010
Discussion Paper

1
Summary
The question of whether BC is a net importer or exporter of electricity is timely and
controversial; timely, because the Clean Energy Act encourages electricity exports and
controversial because no consensus seems to exist surrounding the fundamentals driving BC’s
status as a net importer or exporter. In this paper, we attempt to address why such controversy
exists. We examine the differences between capacity and energy, as well as between volumes
and revenues. In terms of capacity and energy volumes, we find discrepancies between BC
Hydro’s stated resources base and what we believe to be available, an area that requires future
research. However, even under BC Hydro’s restrictive resource assumptions, peak load will not
exceed generating capacity until sometime after 2028. Yet, BC has been a net importer of
electricity in some years (e.g., 2008) and a net exporter in others (2007). The pattern of exports
and imports appears to be economically driven. BC can profitably export high‐priced energy to
Alberta during the day and purchase inexpensive energy from that province in the evenings.
Energy flows to the U.S. markets are more complicated. Historic tie line flows show that BC
tends to export energy to the U.S. during the summer months to meet cooling demands in the
Pacific Northwest. During the rest of the year when U.S prices are low, BC can import low‐cost
energy to meet provincial demand. Further research is required to determine under what
conditions BC’s electricity can replace coal generated power.
Introduction
On April 28, 2010, the province of British Columbia introduced the Clean Energy Act.
While the purpose of the Act has many repercussions for the provincial electricity sector, one of
its primary objectives is to create and promote opportunities for energy exports. The
government’s backgrounder states that “in addition to supplying domestic needs [the province
of BC will continue] to work in partnership with renewable power producers to actively seek
opportunities to sell clean, reliable electricity to neighbours in Canada and the U.S.” (BC Clean
Exports Backgrounder, p.1).
There appears to be substantial controversy surrounding the viability of British
2
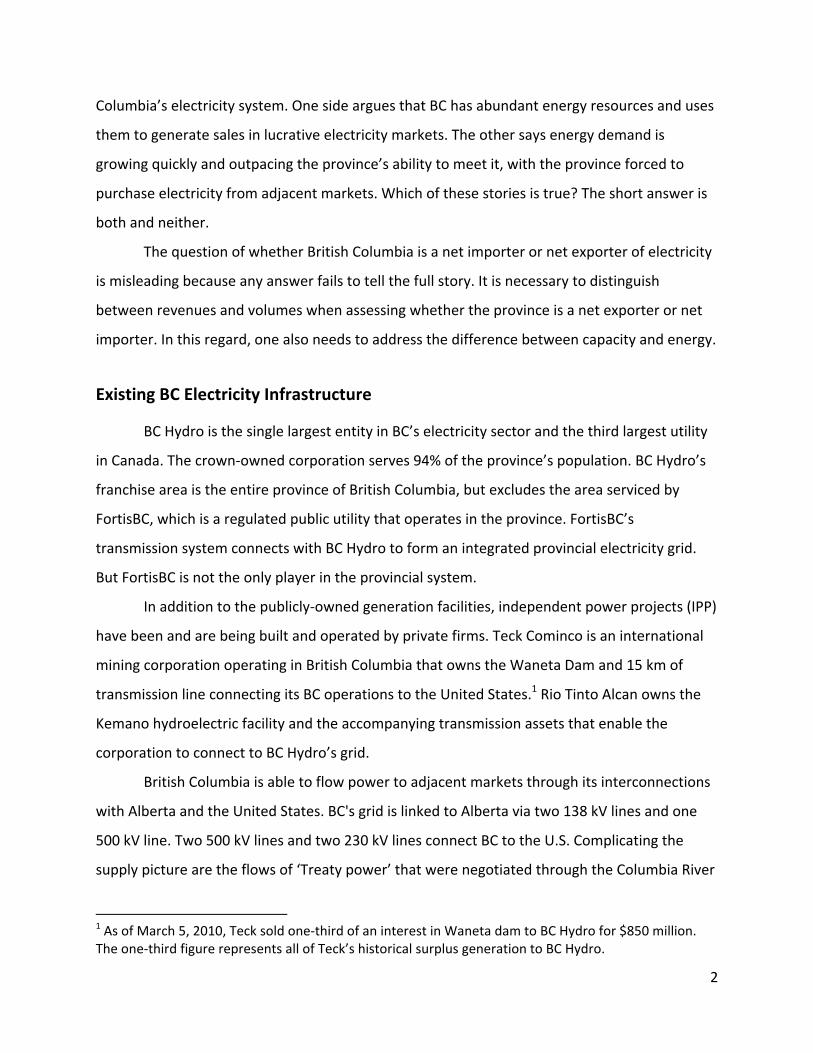
Columbia’s electricity system. One side argues that BC has abundant energy resources and uses
them to generate sales in lucrative electricity markets. The other says energy demand is
growing quickly and outpacing the province’s ability to meet it, with the province forced to
purchase electricity from adjacent markets. Which of these stories is true? The short answer is
both and neither.
The question of whether British Columbia is a net importer or net exporter of electricity
is misleading because any answer fails to tell the full story. It is necessary to distinguish
between revenues and volumes when assessing whether the province is a net exporter or net
importer. In this regard, one also needs to address the difference between capacity and energy.
Existing BC Electricity Infrastructure
BC Hydro is the single largest entity in BC’s electricity sector and the third largest utility
in Canada. The crown‐owned corporation serves 94% of the province’s population. BC Hydro’s
franchise area is the entire province of British Columbia, but excludes the area serviced by
FortisBC, which is a regulated public utility that operates in the province. FortisBC’s
transmission system connects with BC Hydro to form an integrated provincial electricity grid.
But FortisBC is not the only player in the provincial system.
In addition to the publicly‐owned generation facilities, independent power projects (IPP)
have been and are being built and operated by private firms. Teck Cominco is an international
mining corporation operating in British Columbia that owns the Waneta Dam and 15 km of
transmission line connecting its BC operations to the United States.1 Rio Tinto Alcan owns the
Kemano hydroelectric facility and the accompanying transmission assets that enable the
corporation to connect to BC Hydro’s grid.
British Columbia is able to flow power to adjacent markets through its interconnections
with Alberta and the United States. BC's grid is linked to Alberta via two 138 kV lines and one
500 kV line. Two 500 kV lines and two 230 kV lines connect BC to the U.S. Complicating the
supply picture are the flows of ‘Treaty power’ that were negotiated through the Columbia River
1 As of March 5, 2010, Teck sold one‐third of an interest in Waneta dam to BC Hydro for $850 million. The one‐third figure represents all of Teck’s historical surplus generation to BC Hydro.
3
and Skagit Valley Treaties, plus the Libby Coordination agreement.
The Columbia River Treaty is an international agreement negotiated between Canada
and the U.S. that oversees the development and operation of dams in the upper Columbia River
basin. Although the federal government negotiated the Treaty on behalf of Canada, the
Canadian benefits and costs are solely attributable to the province of British Columbia.2 Under
the Columbia River Treaty, BC was obliged to construct and operate three dams (Mica, Arrow
and Duncan) for the purpose of flood control (that benefited the U.S.); thus, BC could not
operate any storage in Canada that would adversely affect the stream flow of the Columbia
River. The province of BC made a lump sum payment to BC Hydro for the cost of constructing
and operating the Treaty dams as compensation for these obligations. Meanwhile, the province
receives one‐half of the resulting increase in power generated in the U.S., which it assigns to BC
Hydro’s marketing subsidiary, Powerex. The Skagit Valley Treaty provided the province with the
ability to alter the reservoir level at the Seven Mile dam, but it obligates BC Hydro to deliver the
equivalent of 35.4 MW of capacity to the Seattle load centre. BC Hydro is compensated by
Seattle for this energy through a series of negotiated payments.
The Libby Coordination Agreement was negotiated in 2000 resolving a dispute between
BC Hydro and the Bonneville Power Authority (BPA)/US Army Corps of Engineers.3 The
agreement allows the BPA and the Corps of Engineers to operate the Libby Dam in Montana for
fisheries purposes without reducing the power benefits that British Columbia is entitled to
under the Columbia River Treaty.
Generating Capacity vs. Power Production
To determine whether BC is a net importer or net exporter of electricity, it is important
to distinguish between generated power production (energy) and generating capacity. Power
2 The History of the Columbia River Treaty provides a synopsis of the factors leading up to the negotiations, the controversies surrounding the Treaty as well as the costs and benefits associated with it. http://www.empr.gov.bc.ca/EAED/EPB/Documents/History%20ofColumbiaRiverNov139web).pdf 3 The Bonneville Power Administration is a U.S federal energy marketing agency in the Pacific Northwest. BPA also operates and maintains about three quarters of the high‐voltage transmission in Idaho, Oregon, Washington, western Montana and small parts of eastern Montana, California, Nevada, Utah and Wyoming.

4
production is the actual amount of energy generated by a particular asset over a period of time
– usually one hour. Generating capacity refers to the full‐load continuous rating of a generator,
also known as the nameplate rating or maximum continuous rating (MCR).
To measure the size of a system, we aggregate nameplate capacity for all the individual
generating stations in the system. This provides us with a measure of the potential generating
capacity. However, the potential capacity of the system need not, and likely does not, equal the
actual capacity values. Weather and therefore water levels (both high and low) affect the ability
to generate electricity as do the planned and forced outages of individual generating stations.
The relationship between the potential generating capacity and average actual generating
capacity is known as the capacity factor. The capacity factor is defined as the ratio of average
generation to the MCR of a generating unit over a specified time period expressed in
percentage terms. We use the potential size of the system as an initial metric. Mitigating
factors such as water levels and operational issues alter the ability of the generating system to
deliver electricity and affect the capacity factor of the units. Fundamentally, however, the
system’s actual generating capacity is capped by the size of the potential generating capacity.
This ‘best case scenario’ is used as a measure for understanding the extent to which BC’s
current generating arrangement could service provincial electricity demand.
Generating Capacity
Assuming a capacity factor of 100%, as of 2010, and excluding the Burrard thermal
plant,4 we estimate that the province of British Columbia has approximately 14,293 MW of
nameplate or available generating capacity. This is comprised of 10,368 MW of BC Hydro
capacity (10,278 MW of hydroelectric generation), 840 MW of FortisBC managed hydro
capacity, and 1,753 MW of existing independent power. Rio Tinto Alcan also provides 162 MW
of net‐to‐grid power from its Kemano facility under the Alcan/BC Hydro 2007 Long‐Term
4 The Burrard natural gas plant is a peaking plant that was used at times when (peak) demand and export commitments happen to exceed immediate generation. On October 28, 2009, BC Ministry of Energy and Mines announced that the Burrard plant would be used to provide electricity to the grid only in cases of generation and transmission outages.

5
Electricity Purchase Agreement (LTEPA).5 In addition, British Columbia is allocated the Canadian
Entitlement (CE) power from the Columbia River Treaty (CRT) which provides capacity
equivalent to 1,170 MW of installed generation. The Canadian Entitlement (CE) portion of the
Columbia River Treaty Downstream Benefits is not considered dependable capacity for planning
purposes, but is considered dependable capacity available as an “operational contingency” (p.
8, Appendix F9 to BC Hydro’s 2008 LTAP); therefore, we include it in our measure of the
potential size of the electric system in British Columbia. The composition of currently available
capacity is shown in Figure 1.
Figure 1: Composition of currently capacity available to meet total provincial electricity demand. Total Generating Capacity: 14,293 MW
Provincial generation capacity is expected to increase over time. BC Hydro is planning an
upgrade to the Mica dam site with two turbines providing an additional 1,000 MW of capacity.
A 500 MW upgrade to the Revelstoke dam is currently under construction. Provincial capacity
will be further supplemented when projects from BC Hydro’s Clean Power Call become
operational. Approximately 1,116 MW of renewable energy projects were selected. Using BC
Hydro’s assumed 30% attrition rate, this provides the province with about 781 MW of new IPP
capacity. In addition, the province has moved to Stage 3 (of five) of the planning process for the
proposed Site C hydro facility on the Peace River with environmental and First Nations issues
still needing to be addressed. If the definitive decision is made to begin construction, the facility
will provide an additional 900 MW of capacity to the province and a reservoir with a surface 5 Capacity values were determined from BC Hydro and BCUC publicly available documents.
6
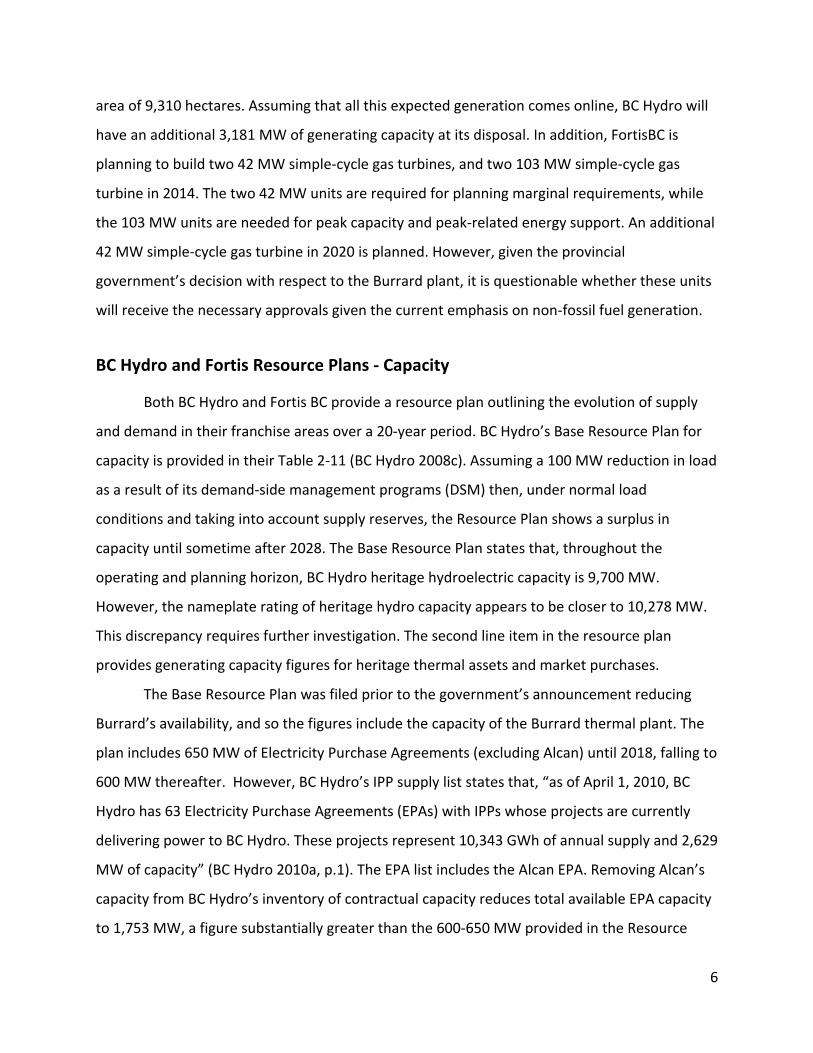
area of 9,310 hectares. Assuming that all this expected generation comes online, BC Hydro will
have an additional 3,181 MW of generating capacity at its disposal. In addition, FortisBC is
planning to build two 42 MW simple‐cycle gas turbines, and two 103 MW simple‐cycle gas
turbine in 2014. The two 42 MW units are required for planning marginal requirements, while
the 103 MW units are needed for peak capacity and peak‐related energy support. An additional
42 MW simple‐cycle gas turbine in 2020 is planned. However, given the provincial
government’s decision with respect to the Burrard plant, it is questionable whether these units
will receive the necessary approvals given the current emphasis on non‐fossil fuel generation.
BC Hydro and Fortis Resource Plans ‐ Capacity
Both BC Hydro and Fortis BC provide a resource plan outlining the evolution of supply
and demand in their franchise areas over a 20‐year period. BC Hydro’s Base Resource Plan for
capacity is provided in their Table 2‐11 (BC Hydro 2008c). Assuming a 100 MW reduction in load
as a result of its demand‐side management programs (DSM) then, under normal load
conditions and taking into account supply reserves, the Resource Plan shows a surplus in
capacity until sometime after 2028. The Base Resource Plan states that, throughout the
operating and planning horizon, BC Hydro heritage hydroelectric capacity is 9,700 MW.
However, the nameplate rating of heritage hydro capacity appears to be closer to 10,278 MW.
This discrepancy requires further investigation. The second line item in the resource plan
provides generating capacity figures for heritage thermal assets and market purchases.
The Base Resource Plan was filed prior to the government’s announcement reducing
Burrard’s availability, and so the figures include the capacity of the Burrard thermal plant. The
plan includes 650 MW of Electricity Purchase Agreements (excluding Alcan) until 2018, falling to
600 MW thereafter. However, BC Hydro’s IPP supply list states that, “as of April 1, 2010, BC
Hydro has 63 Electricity Purchase Agreements (EPAs) with IPPs whose projects are currently
delivering power to BC Hydro. These projects represent 10,343 GWh of annual supply and 2,629
MW of capacity” (BC Hydro 2010a, p.1). The EPA list includes the Alcan EPA. Removing Alcan’s
capacity from BC Hydro’s inventory of contractual capacity reduces total available EPA capacity
to 1,753 MW, a figure substantially greater than the 600‐650 MW provided in the Resource

7
Plan (BC Hydro 2008c, Table 2‐11).
There appears to be a discrepancy between the potential capacity in the system and the
amount enumerated by BC Hydro (2008c). Planned outages and upgrades would affect the
amount of available generating capacity. Forecasts about weather conditions affecting the EPAs
or the operational status of heritage hydroelectric assets may be influencing BC Hydro’s
estimation of available supply. The implied capacity factor in the BC Hydro documents is
unknown and the assumptions used to create the Resource Plan clearly are in need of further
investigation. In addition, BC Hydro’s Resource Plan for capacity will require updating to include
potential future electricity from Site C should it be developed.
In FortisBC’s 2009 Resource Plan, the utility expects a shortfall in its capacity levels until
2014, but will use market purchases to close the gap between dependable capacity and load.
After 2014, Fortis expects the proposed gas‐fired units to provide sufficient capacity to meet
franchise demand and eliminate the dependence on market purchases.
Available Power
Thermal generators are able to provide power consistently near to their MCR because of
the constant and unvarying fuel supply (i.e. a high capacity factor). The electricity that is
generated from renewable energy technologies depends on the availability of the fuel source,
whether it is water, wind or sun. Hydropower is generated when flowing/falling water flows
propel the turbine blades. The amount of power that can be generated from a hydroelectric
unit supported by storage depends on the quantity of water stored in the reservoir, water
inflows from rainfall or snowpack runoff, and head height. Head height is the vertical height of
the water in a reservoir above the turbine. Hydroelectric units are reliant upon sufficient water
inflows and, even where they are supported by reservoir infrastructure, reservoir levels (also
known as elevations). Treaty and in‐stream environmental considerations, such as flood control
and fish habitat, limit the ability to manage these elevations independently. In periods of
drought, or at times when storage conditions are unfavourable, water volume may be lower
than required to operate the turbines at their capacity. Power output will also be adjusted to
capture changes in market prices in the adjacent regions in an effort to maximize revenues.

8
Thus, the power output from storage hydroelectric assets may vary significantly from their
capacity values in any given hour, day, month, season and/or year.
Independent power projects (IPPs) with a variable fuel source are likely to have an even
greater discrepancy between capacity values and energy output. Run‐of‐river hydroelectric
generation uses only the actual flow of water to generate electricity; there is no associated
water storage capability. Thus, generation varies with stream flow. Wind turbine output will
also be less than its installed capacity rating, as power is produced only during periods of
sufficient wind. If the wind is too strong, wind turbines are required to shut down due to safety
concerns, while too little wind will not enable power production at anything near a turbine’s
generating capacity (or may even result in zero output).
BC Hydro and Fortis BC Resource Plans – Energy
Both BC Hydro and FortisBC provide a resource plan for their energy needs in addition
to the one for capacity. However, due to the number of factors that influence the actual output
from individual generating stations, forecasting required electricity output is very difficult. For
example, the 2006 IEP from BC Hydro estimated fiscal 2008 generation from heritage assets to
be approximately 48,287 GWh. Historic actual generation figures over that period amounted to
44,216 GWh (A. Chan, personal communication, May 10, 2010). The difference between actual
and expected generation could be the result of weather, operational or market conditions and
highlights the difficulties in estimating energy output from hydroelectric and IPP generation
assets.
Despite the difficulties, BC Hydro (2008c, Table 2‐10) details estimated energy output
over both an operational and planning horizon. Over its long‐term planning horizon (2012‐
2028), BC Hydro anticipates a shortage of energy in 2013‐2014, after which a surplus is
expected. The eventual energy surplus is the result of larger reductions in load from the DSM
programs, increased energy from the Mica and Revelstoke upgrades, and power from projects
selected under the Clean Power Call.
FortisBC expects to purchase energy in the market over the next four years to close its
resource gap. It expects to produce surplus power post‐2014 when the proposed gas turbine

9
installations are completed.
Provincial Exports and Imports
Information on power flows is collected by Statistics Canada (CANSIM), the National
Energy Board (NEB) and BC Stats. The CANSIM data are collected via a monthly survey of
provincial electricity generators. Survey respondents must provide information on electricity
generated, the primary fuel source used in its generation, gross receipts and deliveries of
electricity to other provinces. These are aggregated across respondents and are available in
CANSIM tables 1270001 and 1270003. The CANSIM, NEB and BC Stats data are identical, but
each breaks down the information somewhat differently. For example, CANSIM provides
monthly data and has information on the types of delivery (firm and non‐firm) as well as the
source or delivery point (U.S., other provinces). From the NEB data, it is possible to determine
the amount of power imported and exported for non‐revenue purposes (i.e., ‘Treaty power,’
ancillary services/losses, etc.). BC Stats data summarize the CANSIM figures.
Figure 2: Net exports, total exports and total imports, 1978‐2008
In Figure 2, we track BC electricity exports, imports and net exports (exports minus
imports) between 1978 and 2008 using monthly CANSIM data. The data are aggregated over
the province’s fiscal year, April 1 to March 31, to provide consistency with BC Hydro
documents. The green bars indicate net exports. Prior to 1993, BC was exclusively a net
exporter. Beginning in 1993, BC varied its position from that of a net exporter to net importer,

10
and back again on various occasions. In essence, British Columbia was exclusively a net exporter
of electricity prior to 1993 – the amount of energy leaving the province consistently exceeded
the amount entering. Between 1993 and 2008, BC was both a net importer and a net exporter
of electricity. Over the past eight years (2000 to 2008), BC was a net importer in four years
(2001, 2004, 2005 and 2008) and a net exporter in four years (2000, 2002, 2003 and 2007).
While the net export data from BC Stats, CANSIM and the National Energy Board are
equivalent, none of the data sources agrees with the dates and volumes of net exports from BC
Hydro’s 2006 Integrated Energy Plan (IEP) despite all annual values being calculated over the
province’s fiscal year. The IEP states that BC Hydro was a net importer in five of the eight years
– F2001, F2002, F2003, F2004 and F2005. The discrepancy around the net export question may
be because BC Hydro generates a large portion, but not all, of the province’s electricity. It could
also be related to the accounting mechanism used to record BC Hydro sales to Powerex. As the
electricity marketing subsidiary of BC Hydro, Powerex is responsible for marketing BC Hydro’s
surplus electricity, including the Canadian Entitlement energy derived from the Canada‐U.S.
Columbia River Treaty. Under the negotiated Heritage contract, all Powerex trade income
below $200 million goes to Heritage beneficiaries. Trade income above $200 million is given to
the BC government through BC Hydro. Because of the unique relationship between BC Hydro
and its energy marketer, it is important to distinguish between the net position and objectives
of BC Hydro, its subsidiaries and the province as a whole.
The CANSIM data are the aggregation of provincial survey results. Raw data on hourly
power flows, both inter‐provincial and international, are provided by British Columbia
Transmission Corporation (BCTC) and are shown in Figure 3. The maximum available transfer
capacity (ATC), or transmission capacity, for BC to the U.S is 3,150 MW from north to south and
2,000 MW from south to north. With respect to the transmission capacity between Alberta and
BC, the east to west capacity is 1,000 MW while the west to east ATC is 1,200 MW; however,
operating limitations within Alberta restrict the east‐to‐west capacity to 760 MW and the west‐
to‐east capacity to 600MW. The ATC limits represent the maximum power that can flow along
the transmission interties.

11
Figure 3: BC imports and exports of electricity along transmission interties with Alberta and the U.S. Pacific Northwest, January 1999 through July 2009
In Figure 3, the red line shows aggregated monthly flows between Alberta and BC, while
the blue line provides the aggregated monthly flows along the BC‐U.S. intertie. The aggregation
masks the true volatility of the power flows. Imports are indicated by negative values and
exports with positive ones. The raw data are from the BC Transmission Corporation (BCTC).
Trends in the intertie data appear to be consistent with information from Statistics Canada and
the NEB. BC was net exporter to Alberta and a net importer from the U.S. in 2008 and 2009, but
a net exporter to both jurisdictions in 2007. The explanation for this import‐export pattern is
likely the result of variation in electricity prices in the adjacent markets and revenue maximizing
behavior on the part of British Columbia, as discussed in the next section. However, it is
important to note that discrepancies of the sort discussed above may be a function of how BC
Hydro and Powerex account for internal transfers and forward trades.
Net Revenues Associated with Exports and Imports
Alberta is likely the electricity industry’s bellwether; the absence of regulation allows
the market to act unencumbered. While experiencing fully deregulated wholesale energy
markets, Alberta has already integrated over 600 MW of wind energy. The effect of this high
wind penetration has been an increase in the volatility of market prices. As the market price in

12
Alberta rises, there is greater value to generating electricity (i.e., installing added capacity),
including, importantly, renewable capacity.
Given the desire across North America to reduce CO2 emissions associated with fossil
fuel generation of power, particularly generation from coal, there may be increased
opportunities for lucrative exports of clean energy to the U.S. American renewable energy
policies have left many jurisdictions supply constrained, resulting in higher prices. The
restrictive conditions on the types of energy these states may import may benefit British
Columbia because of its predominantly hydroelectric generation portfolio. As a result of its
excess capacity, BC continues to be in a position to take advantage of higher prices in adjacent
markets. Fundamentally, BC must decide at which price point it is economically beneficial to
produce power for export sales as opposed to purchasing power to meet domestic demand, or
meeting domestic demand from domestic generation. As prices rise in adjacent markets, BC will
need to increase its capacity to leverage its naturally long position.
British Columbia exports and imports energy from the U.S. and Alberta and receives the
prevailing market price. In general, Alberta prices are determined by the Alberta Electric System
Operator (AESO) on an hourly basis. In the U.S., the price of exported electricity depends where
the energy is received. In general, however, BC energy moves towards the Pacific Northwest
trading hub at Mid‐Columbia (Mid‐C). All excess energy supply from BC Hydro is sold to
Powerex under the Transfer Price Agreement, which guarantees BC Hydro the Mid‐C index
price. Electricity markets in California as well as Palo Verde, Meade and the Four Corners will
affect the market price in Mid‐C as electricity flows to the highest priced region. In the absence
of transmission constraints, electricity prices would be equalized throughout the Western
Electricity Coordinating Council (WECC).Transmission constraints prevail throughout the
Western provinces and states, with differences in average electricity prices between Alberta
and Mid‐C providing evidence of this discontinuity in electricity flows (Figure 4).

13
Figure 4: Average electricity prices in BC’s adjacent markets: Alberta and Mid‐Columbia, 2000‐2009. Price differences are a key factor explaining BC’s import‐export pattern. For example, in 2008 when Alberta prices were high, BC was a net exporter, while it was a net importer of
electricity from the U.S. in that year.
There are times when it is prudent for BC to purchase electricity from its neighbours in
Alberta and the U.S. Pacific Northwest; the province may also choose to export energy to those
areas when it is lucrative to do so. The price point that triggers imports and exports depends on
the relative internal cost of producing electricity. According to the 2006 BC Hydro Integrated
Energy Plan (IEP), BC Hydro was a net importer of electricity from 2001 to 2005. This was
because “market purchases were economic to serve domestic requirements when compared to
greater use of Burrard or greater drawdown of major reservoir” (BC Hydro IEP 2006, 3‐7). The
increased use of imports was not necessarily due to an inability to meet load with domestic
assets, but may instead have been prudent from a financial perspective – import prices were
low relative to the cost of domestic generation.
Plotting Alberta power prices with flows on the AB/BC tie line shows a significant
correlation between the two series, providing increased evidence that BC acts as a revenue
maximizing entity (Figure 5). Interestingly, the same pattern does not emerge with the Mid‐C
prices and U.S. intertie line flows. This may be because BC energy exported to the U.S. is, in
fact, moving farther south to the California/Oregon Border (COB). In that case, the price
dynamics at Mid‐C may not capture the true value accruing to BC’s U.S exports.

14
Figure 5: The relationship between Alberta Pool Price and the flows on the AB/BC tie line are evident. As the price of electricity in Alberta rises, BC sends more energy along the intertie.
Using data from the NEB, the net volumes and net revenues to BC are plotted in Figure
6. As shown previously, BC has been both a net importer and exporter of energy in the past
nine years.
Figure 6: CANSIM provides monthly data on net volumes in blue (exports minus imports) and net revenues (export revenues minus import payments) in red. In periods where net imports are large, the net payments can be quite small, indicating the economic rationale for imports.
There is evidence that these energy flows are the result of economic decisions. Consider
that, in December 2000, BC was a net importer of a small amount of energy (< 1 GWh) but
received over $288 million dollars in net revenues that month. Export volumes in December
2000 were nearly identical to import volumes (577.09 GWh vs. 578.04 GWh) but export

15
revenues were four times larger than import revenues ($387 vs. $99 million). This
happenstance was not an isolated occurrence; there are 21 months over the past nine years of
NEB data where net revenues were positive while net export volumes were negative. The
differences between energy volumes and energy revenues may be explained by the province’s
net export profile.
Net Export Profile
Under the presumption that BC is using its storage capacity to maximize revenues, it is
expected that BC imports would occur during low price periods (i.e., low demand hours) and
exports would take place when prices are high (i.e., peak daytime hours). Figure 7 below shows
the sum of hourly flows on the two interties in 2000, 2001, 2008 and 2009. Negative values are
net imports while positive values represent net exports. Due to the aggregation of both positive
and negative values, some of the information may have been lost. However, the general trends
are indicative of provincial import/export behaviour.

16
Figure 7: Annual average hourly flows along the BC‐Alberta and BC‐U.S. Interties, selected years
The graphs in Figure 7 show the expected import‐export pattern. Net exports to Alberta
increased from HE 7 to HE 22, which corresponds exactly to Alberta’s peak demand hours.
During Alberta’s off‐peak hours, BC is importing. To some extent, BC is practicing the same
revenue maximizing strategy with the U.S. markets as imports are relatively larger during off‐
peak hours and fall during peak times.
British Columbia’s export pattern varies with its intended market. The east‐west
relationship is diurnal. BC can take advantage of low Alberta prices in the evening and import
energy, saving water for future electricity generation. In the daytime, when prices are higher in
Alberta, BC exports energy increasing its revenues. With respect to the U.S. markets, it is
important to recognize that BC exports and imports of electricity are small relative to the

17
overall size of the WECC market. The export‐import relation is less diurnal than it is seasonal.
During winter, BC requires more electricity for heating (because it is colder) and lighting
(because it is dark longer). Further south, principally in California, Arizona and Nevada, the
demand for electricity is lower in winter than during summer, because heating needs are less
onerous than cooling requirements and the summer‐winter contrast between daylight and
night time is less pronounced. Hence, there is less demand for electricity in winter than summer
while demand in BC (and much of the northern states in the WECC system) is higher. During
summer (June, July, August, September), BC requires less electricity, but demand is high in the
United States, mainly for air conditioning. California is particular concerned about its electricity
supply during the period June through September. Therefore, we would expect BC to export
power (or import less) during this period.
This pattern is confirmed in Figure 8, where we observe that BC is generally a net
exporter of electricity to the United States in the summer and a net importer during the rest of
the year. Notice that BC does import electricity from the U.S. some summers (2001, 2002, 2004,
2006, 2008 and 2009), but the amount is much less than what is imported at other times of the
year.
Figure 8: Historic Seasonal Volumes on the U.S. Tie Line
Not included in the discussion of the exchange between the U.S. and British Columbia is
the issue of Columbia Treaty power that is generated in the United States but attributed to BC.

18
Discussion
It would appear as though the province of British Columbia currently has sufficient
generating capacity to meet its demand for electricity, including peak load needs. This excess of
capacity over load is expected to continue for the next several years at least, even without the
addition of new generating capacity. The construction and operation of selected Clean Power
Call proposals, upgrades to existing facilities, and the Site C project will further increase the gap
between capacity and forecasted peak load. As that gap grows, BC will be in a position to export
increasingly larger volumes of energy to adjacent markets.
There is also no reason to believe that domestic load will and should be met entirely by
domestic generation. Indeed, it may be financially beneficial for British Columbia to import
electricity when prices in other markets are low relative to the internal opportunity cost of
generating electricity. Likewise, when market prices in adjacent markets are high, it makes
economic sense to export electricity. These exports and imports are over and above transfers
required to enable other system operators to stabilize the overall WECC grid.
Currently, it would appear that BC imports electricity from Alberta, implying CO2
emissions from coal and natural gas generated electricity. However, there may be little
environmental benefit should BC decide to stop power imports for that reason,6 while there
might well be a large loss in revenues. Suppose BC stopped purchasing nighttime power from
Alberta. This would require substituting Alberta electricity with that generated by existing
hydro assets, or some other source. This does not mean that Alberta reduces its emissions of
CO2 on a one‐for‐one basis. Alberta’s coal generators are likely to continue operating, burning
fossil fuel, but not dispatching electricity to the grid. In that case, BC’s action may have done
nothing to reduce the two province’s overall CO2 emissions and may even increase overall
emissions. Thus, this strategy needs to be carefully thought out if one objective is to address
climate change concerns. There is likely little to be gained and a lot to lose by putting a stop to
a profitable exchange of electricity.
With regard to the transfer of power between BC and the U.S. Pacific Northwest, clean
6 The Clean Energy Act implies that BC clean energy will displace “electricity generated by hydrocarbon‐based fuel sources such as coal” (p. 1).

19
energy from BC would likely displace natural gas generators not coal units. Although the
portfolio used to generate energy moving to the Mid‐C hub is larger and more complex, the fuel
at the margin is typically natural gas. It is the marginal unit that would be affected by BC clean
energy exports.
It is not clear, therefore, that so‐called clean energy exports from BC will displace ‘dirty’
energy in an adjacent market, as required under the Clean Energy Act. Indeed, it might even be
the case that exports of BC clean energy displace another form of renewable energy, or that
they simply result in wasted energy. Clearly, before BC embarks on a trajectory that makes it a
major exporter of clean power, some serious research needs to be undertaken to determine
the overall financial and environmental costs.
References
BCUC (2008) British Columbia Hydro and Power Authority: A Filing of Electricity Purchase Agreement with Alcan Inc. As An Energy Supply Contract Pursuant To Section 71 Decision, January 29, 2008 accessed from http://www.bchydro.com/etc/medialib/internet/documents/info/pdf/info_2007_electricity_purchase_agreement_dated_august_13.Par.0001.File.info_2007_electricity_purchase_agreement_dated_august_13.pdf
BC Hydro Clean Power Call Selected Projects (2010) accessed from http://www.bchydro.com/planning_regulatory/acquiring_power/clean_power_call/selected_p
roposals.html BC Hydro (2006) Integrated Energy Plan accessed from
http://www.bchydro.com/planning_regulatory/long_term_electricity_planning/past_plans/2006_iep.html
BC Hydro (2010). About Independent Power Projects accessed from http://www.bchydro.com/etc/medialib/internet/documents/planning_regulatory/acquiring_power/2010q2/20100401_ipp_supply0.Par.0001.File.20100401_IPP_Supply_List.pdf
BC Hydro (2008a) Long Term Acquisition Plan accessed from http://www.bchydro.com/planning_regulatory/long_term_electricity_planning/2008_ltap.html
BC Hydro (2008b) Load Forecast accessed from http://www.bchydro.com/etc/medialib/internet/documents/planning_regulatory/meeting_demand/Electric_Load_Forecast_2008.Par.0001.File.Electric_Load_Forecast_2008.pdf
BC Hydro (2008c) Evidentiary Update to the 2008 LTAP accessed from http://www.bcuc.com/Documents/Proceedings/2008/DOC_20639_B‐10_Evidentiary‐Update.pdf

20
BC Stats (2010) accessed from http://www.bcstats.gov.bc.ca/data/bus_stat/busind/trade/trade‐elec.asp
British Columbia (2010). Clean Energy Act Backgrounder‐ Pursuing Export Opportunities accessed from http://www.mediaroom.gov.bc.ca/DisplayEventDetails.aspx?eventId=490
British Columbia Transmission Corporation (2010). BCTC Tie Flows accessed from http://www.bctc.com/transmission_system/actual_flow_data/
British Columbia Transmission Corporation (2010). Control Area Load accessed from http://www.bctc.com/transmission_system/balancing_authority_load_data
CANSIM (Canadian Socio‐Economic Information Management System) Data Tables 1270001 and 1270003 accessed from web.uvic.ca/library
FortisBC (2009). Resource Plan accessed from http://fortisbc.com/downloads/about_fortisbc/rates/other_applications/2009resourceplan/FortisBC%202009%20Resource%20Plan.pdf
National Energy Board (2010) Electricity Export Authorizations accessed from http://www.neb.gc.ca/clf‐nsi/rnrgynfmtn/sttstc/lctrctyxprtmprt/lctrctyxprtmprt‐eng.html
National Energy Board (2010) Electricity Import Export Tables accessed from http://www.neb.gc.ca/clf‐nsi/rnrgynfmtn/sttstc/lctrctyxprtmprt/lctrctyxprtmprt‐eng.html