Embed Size (px)
Citation preview

1
Bradford
Waste Arisings and Capacity Evidence
Project
Waste Arisings and Capacity Requirements
PART B Report Update Revised December 2016

2
Date Details Prepared by Reviewed and approved by
25th
September
2015
Updated
report
Gill Tatum, Peter Greifenberg
and Philippa Lane
Carolyn Williams
16th June
2016
Updated
report
Gill Tatum, Peter Greifenberg
and Philippa Lane
Carolyn Williams

1
CONTENTS
1. INTRODUCTION ......................................................................................... 4
1.1 Future Waste Management Requirements .............................................. 4
1.2 Future Waste Capacity Requirements ..................................................... 5
1.3 Principal Waste Streams........................................................................... 7
Commercial & Industrial Waste ...................................................................... 8
Local Authority Collected Waste .................................................................... 9
Construction, Demolition and Excavation Waste (CD&E) .......................... 10
1.4 Predicting Future Requirements ............................................................ 10
2. FUTURE CAPACITY REQUIREMENTS ..................................................... 8
2.2 LOCAL AUTHORITY COLLECTED WASTE (LACW) ............................... 8
Current Arisings and Capacity of Existing Facilities .................................... 8
Future Arisings ................................................................................................ 9
LACW Required Facilities: Recycling Facilities ............................................ 9
LACW Required Facilities: Residual Mechanical Treatment Facilities ....... 9
LACW Required Facilities: Landfill .............................................................. 10
LACW Required Facilities: Energy Recovery .............................................. 10
2.3 COMMERCIAL AND INDUSTRIAL (C&I) WASTE ................................... 11
Current Arisings and Existing Facilities ...................................................... 11
Future Arisings Scenarios and Subsequent Capacity Gap ........................ 12
C&I Required Facilities: Transfer Stations .................................................. 12
C&I Required Facilities: Recycling Facilities ............................................... 13
C&I Required Facilities: Composting ........................................................... 13
C&I Required Facilities: Metal Recycling Sites (specialist recycling; End of Life Vehicles, Metals and Waste Electronic and Electrical Equipment [WEEE]) ........................................................................................................... 14
C&I Required Facilities: Treatment .............................................................. 14
C&I Required Facilities: Energy from Waste ............................................... 14
C&I Required Facilities: Non-Hazardous Landfill ........................................ 15
2.4 CONSTRUCTION, DEMOLITION AND EXCAVATION (CD&E) WASTE . 17
Current Arisings and Existing Facilities ...................................................... 17
Future Arisings and Subsequent Capacity Gap .......................................... 18
CD&E Required Facilities: Transfer Stations .............................................. 18
CD&E Required Facilities: Recycling ........................................................... 18
CD&E Required Facilities: Landfill ............................................................... 19
CD&E Required Facilities: Hazardous Landfill ............................................ 19
2
2.5 HAZARDOUS WASTE.............................................................................. 20
Current Arisings and Existing Facilities ...................................................... 20
2.6 SEWAGE SLUDGE .................................................................................. 20
Future Arisings and Subsequent Capacity Gap .......................................... 20
Required Facilities ......................................................................................... 21
2.7 AGRICULTURAL WASTE ........................................................................ 21
Current Arisings and Existing Facilities ...................................................... 22
Future Arisings and Subsequent Capacity Gap .......................................... 22
Required Facilities ......................................................................................... 23
2.8 LOW LEVEL RADIOACTIVE WASTE ...................................................... 23
Current Arisings and Existing Facilities ...................................................... 24
Future Arisings and Subsequent Capacity Gap .......................................... 24
Required Facilities ......................................................................................... 25
3. SUMMARY OF FUTURE WASTE MANAGEMENT REQUIREMENTS .... 26
Future Capacity Requirements for LACW.................................................... 26
Future Requirements for RDF and Recyclable Material for C&I and LACW 27
Future Waste Capacity Requirements for C&I Waste ................................. 28
Future Waste Capacity Requirements for CD&E Waste ............................. 29
Future Waste Capacity Requirements for Agricultural Waste ................... 30
Future Waste Capacity Requirements for Sewage Sludge......................... 30
APPENDIX 1 - PROJECTED CAPACITY GAP ACROSS THE SCENARIOS
APPENDIX 2 - CUMULATIVE CAPACITY REQUIREMENTS
APPENDIX 3 – EXISTING LICENCED CAPACITY IN BRADFORD
Due to their size the appendices are provided as separate documents
3
GLOSSARY OF TERMS
AD Anaerobic Digestion C&I Waste Commercial and Industrial Waste
CDEW/CD&E EA
Construction Demolition and Excavation Waste Environment Agency
EfW Energy from Waste
ELV End of Life Vehicle
GVA Gross Value Added
LACW Local Authority Collected Waste
MBT Mechanical Biological Treatment ROCs Renewable Obligations Certificates
RSS Regional Spatial Strategy
WDA Waste Disposal Authority
WEEE WDI WWTW
Waste Electrical and Electronic Equipment Waste Data Interrogator Waste Water Treatment Works

4
1. INTRODUCTION
This report presents an update to the 2013 detailed assessment of need for
future waste management facilities over the plan period up to 2030 for the City
of Bradford Metropolitan District Council. The report addresses the following
waste streams:
Commercial and Industrial (C&I);
Local Authority Collected Waste (LACW);
Hazardous Waste;
Construction, Demolition and Excavation Waste (CDEW);
Agricultural;
Low Level Non-Nuclear Radioactive Wastes (LLW); and
Water Waste/Sewage Sludge.
A detailed review of the robustness and limitations of currently available
information on current and expected arisings of waste in Bradford has been
carried out for a range of waste streams, the detailed findings of which are
presented in the PART A Report1.
This final report presents the modelling options used to identify the potential
future waste requirements for Bradford up to 2030. A number of scenarios
have been modelled and the findings of each are summarised. Each scenario
presents a different option for modelling waste based on a range of recycling
and recovery targets and growth levels being achieved. The final result of this
work is to identify the capacity gap for each waste stream.
This study has been undertaken by Urban Vision and 4Resources on behalf of
the City of Bradford. The previous study also included managing LACW
collected from Calderdale through the development of a joint facility funded
through PFI credits. Since the withdrawal of credits, both authorities have re-
evaluated their position and have made the decision to no longer formally
work together, as such this report does not include any assumptions for
managing LACW from Calderdale.
1.1 Future Waste Management Requirements
1.1.1 Waste is generated by a vast range of processes although people are most
familiar with waste collected from their households, such as packaging and
food. However, these wastes (officially named Local Authority Collected
Waste or LACW) only account for part of the overall waste arisings. Much
larger quantities of other waste from the construction industry, such as broken
1 Prepared by Urban Vision and 4Resources, August 2015
5
bricks and cables, and wastes from the commercial sector, such as food from
restaurants, make up the total amount of waste produced within the City of
Bradford. The majority of waste is produced as a result of producer demand
for products and an important aspect of reducing the overall production of
waste is through behavioural changes in how individuals consume goods and
services.
1.1.2 The need for waste management facilities to deal with the wastes in a more
sustainable way will form an integral part of any Waste Management
Development Plan Document. This section considers two key issues: How
much waste will need to be managed over the Plan period (to 2030) and what
facilities will be required to manage this waste.
1.1.3 This report sets out the expected waste management capacity that will be
provided by waste facilities over the Plan period, as well as expected waste
arisings over the same period. If the expected arisings are greater than the
known waste management capacity then the difference in values is called the
‘capacity gap. Where the expected arisings are smaller than the known waste
management capacity, this is called a ‘surplus in capacity’. The capacity gap
is what the City of Bradford will need to plan for though the Waste
Management Document. ‘Capacity requirements’ shows what is needed to be
provided to meet expected levels of waste arising over the plan period for
each management type e.g landfill, recycling etc. The capacity gap is what is
needed after capacity at existing facilities is used it.
1.2 Future Waste Capacity Requirements
1.2.1 To identify any requirements for new waste management facilities, it is
important to gain as accurate a picture as possible of current waste arisings
and the capacity of existing permitted waste management facilities. Economic
and waste trends can then be used to forecast future waste growth and
subsequently the need for new facilities can be projected based on the
capacity gap identified.
1.2.2 To enable future planning for waste, the City of Bradford commissioned Urban
Vision Partnership Ltd and 4Resources Ltd to produce an update to the 2013
study on the detailed projection of future waste capacity requirements. This
Report is the final of a two stage reporting process to plan for future waste
management requirements. The PART A Report2 set out information relating
to the arisings for the waste streams in the City of Bradford and this final
report should be considered in conjunction with the PART A Report. The
main changes in arisings noted in this update where an increase in arisings of
2 Prepared by Urban Vision and 4Resources, August 2015
6
CD&E waste which is attributed to boost on building activity following the
recession, and a slight increase in hazardous waste. Agricultural waste
increased slightly due to a change in the number of farm holdings, Levels of
C&I are extrapolated from the regional surveys and as such no change in
arisings of this waste stream have been seen.
1.2.3 This PART B Report provides information on waste arisings for the principal
waste streams namely, C&I, CDEW, LACW, agricultural, waste water and
sewage, hazardous and low level radioactive waste, and identifies where
there may be a capacity gap up until 2030. This report provides a level of
detail and consistency that has not previously been available. Not only does
the projection of future waste capacity requirements look at waste arisings
and their management but also the potential for recycling or energy recovery
with the aim of managing waste more sustainably and moving it up the waste
hierarchy.
1.2.4 This approach is consistent with the Government's sustainable development
agenda generally and their approach to delivering sustainable waste
management in particular. National Planning Policy for Waste 2014 (NPPW)
refers to a key planning objective of “delivery of sustainable development and
resource efficiency, including provision of modern infrastructure, local
employment opportunities and wider climate change benefits, by driving waste
management up the waste hierarchy” The Waste Hierarchy has been
transposed into UK law through the Waste (England and Wales) Regulations
2011.
1.2.5 The need to decouple waste growth from economic growth has its roots in the
need for sustainable development in the UK, particularly the idea of
sustainable production and consumption of resources. By implementing the
principles of the waste hierarchy, there will be a move towards reducing the
amount of waste produced in the first place, thus helping to break the link.

7
Figure 1 The Waste Hierarchy
Source: www.Defra.gov.uk
1.3 Principal Waste Streams
1.3.1 Figure 2 and Table 1 below show the relative sizes of the principal waste
streams arising in the City of Bradford (Data: 2013 Arisings from PART A
Report 2015). They do not include agricultural, waste water and sewage and
low level radioactive wastes, inclusion of which will distort the quantities for
which capacity needs to be provided as they do not constitute principal waste
arisings for the City of Bradford. Managing these streams requires specialist
facilities which are detailed later in this report. In addition, secondary waste
produced through management of LACW is not included here. It should also
be noted, that once the secondary LACW waste enters the system, some of
this waste then becomes C&I waste. For modelling purposes, it is estimated
that 35,000 tonnes of secondary waste will be produced which will need to be
managed as part of the C&I waste stream, however this tonnage is not
attributed to the overall arisings as this would result in double counting.

8
Figure 2 Proportion of principal waste streams in the City of Bradford
[Sources: Environment Agency Waste Data Interrogator 2013; C&I waste estimates
extrapolated from Environment Agency survey of C&I Arisings in North West England, 2009]
Table 1 City of Bradford Waste Arisings (tonnes rounded)
Principal Waste Arisings
Year 2013
Tonnes
(rounded)
Commercial Waste 254,314
Industrial Waste 219,773
CD&E 440,000
Hazardous 19,084
LACW 226,085
Total arisings 1,159,256
[Sources: Environment Agency Waste Data and Hazardous Waste Data Interrogators 2013,
and Defra WasteDataFlow]
Commercial & Industrial Waste
1.3.2 There is no data on C&I waste specific to the City of Bradford to use as a
base, therefore extrapolation from other sources is necessary. There are two
principal data sources which can be used to estimate commercial and
industrial (C&I) waste arisings within the sub-region. The National DEFRA C&I
survey (2009) only reports data at the level of the Yorkshire and Humberside
region. Using the National Defra C&I survey (2009) (Yorkshire and
22%
19%
38%
2%
19%
Commercial Waste
Industrial Waste
CD&E
Hazardous
LACW
9
Humberside region), a total for the City of Bradford of 404,324 tonnes of C&I
waste arisings was identified in 2009. Using extrapolated figures from the
second source, the 2009 North West C&I Survey, a total of 474,087 tonnes
was identified (not including arisings from the Power and Utilities sector).
1.3.3 However, the comparison of the two survey projections at a regional level with
field data from the Environment Agency on landfill records suggests that for
this category the NW survey is much closer to the observed quantities
deposited at permitted sites. Whilst it is not possible to provide comparable
data from the EA Interrogator other than for landfill, this suggests that the NW
survey may provide a better projection for WPAs within the Yorkshire and
Humberside region than the Defra National Survey. The extrapolated NW
survey data is used as the main baseline data for C&I waste. Further
information about the two data sources is included in the PART A Report.
Local Authority Collected Waste
1.3.4 Figure 2 shows the proportion of principal waste streams in the city of
Bradford in 2013, excluding secondary waste from LACW.
1.3.5 LACW collected in Bradford is currently managed in mechanical treatment
facilities to produce a “secondary waste” commonly referred to as Refuse
Derived Fuel (RDF), which is normally used as fuel for Energy from Waste
(EfW) facilities. It is estimated that 20% of the material passing though the
initial treatment process comprises recyclates (plastic, glass, etc.) that are
removed, with the remaining 80% being converted into the RDF. The
forecasting model has been modified so that it evaluates the capacity needed
to process waste into RDF and also the EfW capacity needed to use the
secondary waste product. This approach does not result in waste being
double-counted as the two processes involve different technologies and it
ensures that all of the capacity needed to manage LACW can be provided in
Bradford over the plan period. The outcome of this approach is that the model
identifies that there is a need for EfW capacity to take the RDF produced from
Bradford’s LACW.
1.3.6 The amount of secondary products arising from the mechanical treatment is
based on information provided by Bradford City Council. The PFI business
case projected that in 2012 a facility managing RDF would handle 192,000
tonnes of LACW arising in Bradford and Calderdale, and a further 35,000
tonnes of commercial waste arising in Bradford only. Although the PFI
process is not continuing and Calderdale no longer form part of this proposal,
soft market testing has shown that the likely outcome for the on-going
procurement exercise, which Bradford have now entered into, is that the
authority will continue to produce RDF from LACW and that a facility could be

10
developed locally to manage this. The current contract to produce an RDF is
due to come to an end in 2017, at which point it is assumed that the council
will have entered in to a new contract to manage the treatment of its LACW.
At this point in time it is not possible to say where treatment will take place.
There are sites with planning permission in Bradford that could provide this
requirement as well as facilities within the wider Yorkshire and Humber region.
Table 10 provides further detail on this.
1.3.7 Table 2 below summarises the resulting quantities of RDF and recyclates that
would be produced reflecting the proportions stated earlier. Note that the
business case anticipated that a 100% conversion of the residual waste into
secondary products would occur. Once the secondary products enter the
system, they cease to be LACW and are attributed to C&I waste for
management.
Table 2 Projected secondary products requiring treatment in Bradford, 2013 (tonnes (rounded)
Material Tonnes
Refuse Derived Fuel 135,000
Recyclate 60,000
Total 195,000 (just includes HHW and not total LACW)
[Source: Bradford City Council]
Construction, Demolition and Excavation Waste (CD&E)
1.3.8 An estimate of how much CD&E waste is produced in Bradford can be made
with respect to CD&E managed through permitted sites. Data has been
published by the Environment Agency for 2013 (EA Waste Data Interrogator
database). This gives quantities of CD&E waste deposited at sites which are
subject to Environment Agency permit. This data provides some information
on origin and waste movements but is incomplete as some CD&E wastes are
not fully recorded for all details.
1.3.9 Data on CD&E has been gathered from the EA Waste Data Interrogator (2013
deposit data) and an analysis of the waste categories has taken place to
enable the separation of construction and demolition waste from excavation
waste. Further information about this is included in the PART A Report.
1.4 Predicting Future Requirements
1.4.1 As part of the forecast of future waste capacity requirements, a number of
scenarios were considered that reflected a realistic range of possibilities that
11
could be implemented. In developing the scenarios certain assumptions were
made, in particular how, in general terms, the various categories of waste
arisings would be managed in the future.
1.4.2 The initial modelling considered three waste management scenarios:
Scenario 1 – baseline, which reflects the current status and forward
planning position.
Scenario 2 – maximised recycling and recovery of C&I and CD&E wastes.
Scenario 3 – a median level of increased recycling and recovery.
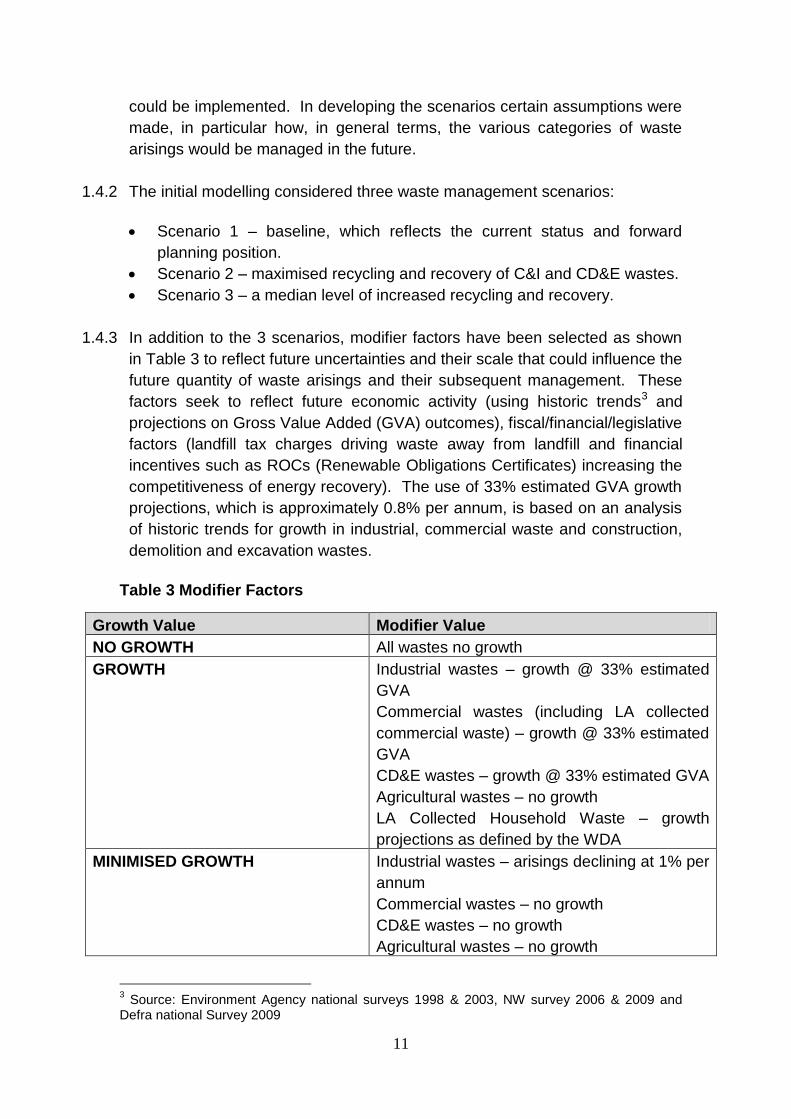
1.4.3 In addition to the 3 scenarios, modifier factors have been selected as shown
in Table 3 to reflect future uncertainties and their scale that could influence the
future quantity of waste arisings and their subsequent management. These
factors seek to reflect future economic activity (using historic trends3 and
projections on Gross Value Added (GVA) outcomes), fiscal/financial/legislative
factors (landfill tax charges driving waste away from landfill and financial
incentives such as ROCs (Renewable Obligations Certificates) increasing the
competitiveness of energy recovery). The use of 33% estimated GVA growth
projections, which is approximately 0.8% per annum, is based on an analysis
of historic trends for growth in industrial, commercial waste and construction,
demolition and excavation wastes.
Table 3 Modifier Factors
Growth Value Modifier Value
NO GROWTH All wastes no growth
GROWTH Industrial wastes – growth @ 33% estimated
GVA
Commercial wastes (including LA collected
commercial waste) – growth @ 33% estimated
GVA
CD&E wastes – growth @ 33% estimated GVA
Agricultural wastes – no growth
LA Collected Household Waste – growth
projections as defined by the WDA
MINIMISED GROWTH Industrial wastes – arisings declining at 1% per
annum
Commercial wastes – no growth
CD&E wastes – no growth
Agricultural wastes – no growth
3 Source: Environment Agency national surveys 1998 & 2003, NW survey 2006 & 2009 and
Defra national Survey 2009

12
LA Collected Household Waste– growth at
projections as defined by the WDA
1.4.4 Table 4 shows the forecast size of the principal streams under the Growth and
Minimised Growth scenarios before assumptions about recycling, recovery and
landfill performance are applied. Table 4 also provides details of the split between
LACW collected from households (LACW primary) and LACW which goes through a
secondary processing stage to produce RDF and recyclates (LACW Secondary).
The secondary element is included in the overall arisings forecast as Bradford is
committed to finding a local solution to managing LACW and has indicated the need
to account for secondary processing of waste going forward in order that the
contracts awarded account for this need.

0
Table 4 Annual Arisings Forecasts Under the Growth and Minimised Growth Assumptions4
Growth 2015 2016 2017 2018 2019 2020 2021
C&I 498,621 503,216 507,858 512,549 517,288 522,078 526,920
LACW Primary 200,419 205,018 212,056 218,277 224,613 226,684 228,747
LACW Secondary 145,648 148,990 154,104 158,625 163,229 164,735 166,235
Hazardous 19,338 19,595 19,856 20,119 20,386 20,657 20,932
CD&E 443,504 446,166 448,843 451,536 454,246 456,971 459,712
Agricultural 296,902 296,902 296,902 296,902 296,902 296,902 296,902
TOTAL 1,604,432 1,619,887 1,639,619 1,658,008 1,676,664 1,688,027 1,699,448
Growth 2022 2023 2024 2025 2026 2027 2028 2029 2030
C&I 531,811 536,753 541,749 546,797 551,900 557,058 562,269 567,539 572,863
LACW Primary 200,419 205,018 212,056 218,277 224,613 226,684 228,747 243,995 245,629
LACW Secondary 167,730 169,061 170,385 171,793 173,196 174,594 175,958 177,317 178,504
Hazardous 21,209 21,491 21,776 22,066 22,359 22,656 22,957 23,261 23,570
CD&E 462,471 465,245 468,036 470,844 473,670 476,512 479,372 482,248 485,141
Agricultural 296,902 296,902 296,902 296,902 296,902 296,902 296,902 296,902 296,902
TOTAL 1,710,928 1,722,089 1,733,307 1,744,798 1,756,354 1,767,971 1,779,582 1,791,262 1,802,609
Minimised Growth 2015 2016 2017 2018 2019 2020 2021
C&I 492,030 490,002 487,995 486,007 484,039 482,092 480,164
LACW Primary 200,419 205,018 212,056 218,277 224,613 226,684 228,747
LACW Secondary 145,648 148,990 154,104 158,625 163,229 164,735 166,235
Hazardous 18,893 18,705 18,518 18,333 18,151 17,969 17,790
CD&E 440,858 440,858 440,858 440,858 440,858 440,858 440,858
4 N.b. LACW figures remain the same under all growth scenarios because these are based on figures provided by the Waste Disposal Authority

1
Agricultural 296,902 296,902 296,902 296,902 296,902 296,902 296,902
TOTAL 1,594,750 1,600,475 1,610,433 1,619,002 1,627,792 1,629,240 1,630,696
Minimised Growth 2022 2023 2024 2025 2026 2027 2028 2029 2030
C&I 478,256 476,365 474,495 472,643 470,811 468,996 467,199 465,420 463,658
LACW Primary 230,805 232,637 234,459 236,396 238,327 240,249 242,124 243,995 245,629
LACW Secondary 167,730 169,061 170,385 171,793 173,196 174,594 175,958 177,317 178,504
Hazardous 17,612 17,437 17,263 17,091 16,921 16,752 16,585 16,420 16,256
CD&E 440,858 440,858 440,858 440,858 440,858 440,858 440,858 440,858 440,858
Agricultural 296,902 296,902 296,902 296,902 296,902 296,902 296,902 296,902 296,902
TOTAL 1,632,163 1,633,260 1,634,362 1,635,683 1,637,015 1,638,351 1,639,626 1,640,912 1,641,807
[Source: Needs Assessment forecasting model]
0
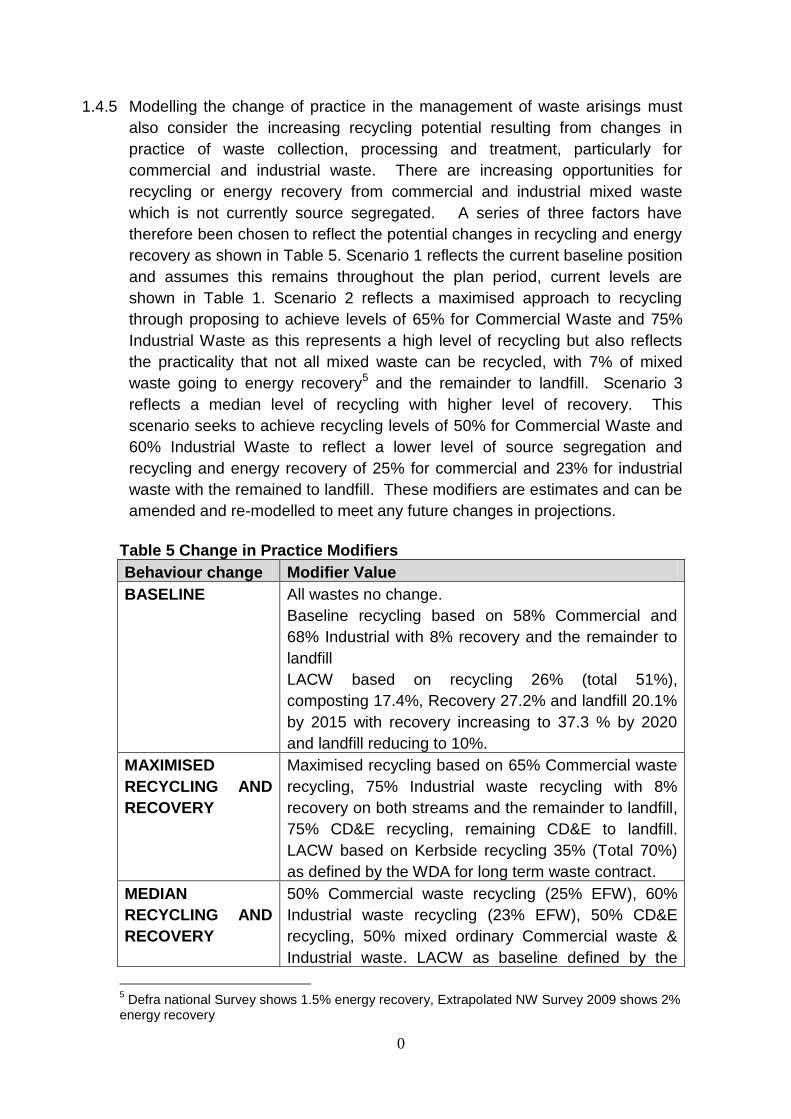
1.4.5 Modelling the change of practice in the management of waste arisings must
also consider the increasing recycling potential resulting from changes in
practice of waste collection, processing and treatment, particularly for
commercial and industrial waste. There are increasing opportunities for
recycling or energy recovery from commercial and industrial mixed waste
which is not currently source segregated. A series of three factors have
therefore been chosen to reflect the potential changes in recycling and energy
recovery as shown in Table 5. Scenario 1 reflects the current baseline position
and assumes this remains throughout the plan period, current levels are
shown in Table 1. Scenario 2 reflects a maximised approach to recycling
through proposing to achieve levels of 65% for Commercial Waste and 75%
Industrial Waste as this represents a high level of recycling but also reflects
the practicality that not all mixed waste can be recycled, with 7% of mixed
waste going to energy recovery5 and the remainder to landfill. Scenario 3
reflects a median level of recycling with higher level of recovery. This
scenario seeks to achieve recycling levels of 50% for Commercial Waste and
60% Industrial Waste to reflect a lower level of source segregation and
recycling and energy recovery of 25% for commercial and 23% for industrial
waste with the remained to landfill. These modifiers are estimates and can be
amended and re-modelled to meet any future changes in projections.
Table 5 Change in Practice Modifiers
Behaviour change Modifier Value
BASELINE
All wastes no change.
Baseline recycling based on 58% Commercial and
68% Industrial with 8% recovery and the remainder to
landfill
LACW based on recycling 26% (total 51%),
composting 17.4%, Recovery 27.2% and landfill 20.1%
by 2015 with recovery increasing to 37.3 % by 2020
and landfill reducing to 10%.
MAXIMISED
RECYCLING AND
RECOVERY
Maximised recycling based on 65% Commercial waste
recycling, 75% Industrial waste recycling with 8%
recovery on both streams and the remainder to landfill,
75% CD&E recycling, remaining CD&E to landfill.
LACW based on Kerbside recycling 35% (Total 70%)
as defined by the WDA for long term waste contract.
MEDIAN
RECYCLING AND
RECOVERY
50% Commercial waste recycling (25% EFW), 60%
Industrial waste recycling (23% EFW), 50% CD&E
recycling, 50% mixed ordinary Commercial waste &
Industrial waste. LACW as baseline defined by the
5 Defra national Survey shows 1.5% energy recovery, Extrapolated NW Survey 2009 shows 2%
energy recovery

1
WDA for long term waste contract based on Kerbside
30% (Total 60%).
1.4.6 Scenarios have therefore been modelled using the 3 sets of modifier factors
(no growth, growth and minimised growth) with the 3 changes in practice
modifiers (Baseline, Maximised and Median recycling and recovery) to
produce 9 outcomes with a range of different capacity requirements
depending on how waste is managed within the waste management
hierarchy.
1.4.7 The capacity of all the available sites with planning permission for waste
management are included in the model, together with information on annual
capacity of the site and duration of activity according to the planning
permissions. This information was updated using the EA WDI 2013 and
planning permission information provided by Bradford in July 2015. The
existing sites were identified through a review of the list of sites identified from
the EA Waste Data Interrogator, and the list of permitted waste sites as
supplied by the EA. The final list for was sent to Bradford at this stage to
provide any further information from the planning permission regarding the
capacity and end date of each site.
1.4.8 For all sites included in the model, the capacity information was taken from
the EA licence, Planning Permission information where available, and EA
permits. However it is important to note that this information does not always
correlate due to the way in which the EA issues its waste licences (the EA
uses standard maximum capacity limits) and therefore a review of past annual
throughputs was also undertaken to ascertain the most accurate information
for the available capacity at each site. This figure, once agreed with Bradford
is the figure used for available capacity at that site.
1.4.9 A comparison of the capacity gap at the end of the plan period across the
scenarios is shown in Tables 6-8. C&I waste arisings and management are
extrapolated from the North West survey results as explained previously.
Negative figures identify where there is no capacity gap.

2
Table 6 Comparison of the capacity gap at year 2030 across the 3 scenarios, assuming NO GROWTH for all wastes except Sewage and Low Level Radio Active wastes (tonnes)
Waste
Management
Scenario
1
Baseline
Scenario 2
Maximised
Recycling
Scenario 3
Median
Recycling
Landfill (C+I & LACW) 97,822 51,310 47,413
Landfill (Hazardous) 4,076 4,076 4,076
Landfill (C+D) 195,924 68,104 136,207
Energy from waste 100,607 86,601 181,218
Incineration (Specialist
High Temp) 861 861 861
Recycling (C+I & LACW) 316,756 366,199 281,918
Recycling (C+D) 116,141 303,802 203,814
Recycling (specialist
material) -2,322 -2,322 -2,322
Composting -18,457 -7,382 -13,821
Residual Mechanical
Treatment 179,500 161,751 171,501
Treatment plant -49,078 -49,078 -49,078
Table 7 Comparison of the capacity gap at year 2030 across the 3 scenarios, assuming GROWTH for all wastes except Sewage and Low Level Radio Active wastes (tonnes)
Waste Management
Scenario 1 Baseline
Scenario 2 Maximised Recycling
Scenario 3 Median Recycling
Landfill (C+I &LACW) 117,785 61,655 56,384
Landfill (Hazardous) 5,035 5,035 5,035
Landfill (C+D) 215,606 74,945 149,890
Energy from waste 119,648 102,346 214,443
Incineration (Specialist High Temp) 861 861 861
Recycling (C+I & LACW) 384,474 444,225 345,355
Recycling (C+D) 128,323 334,834 224,804
Recycling (specialist material) -2,306 -2,306 -2,306
Composting -9,260 4,421 -3,534
Residual Mechanical Treatment 217,203 195,277 207,322
Treatment plant -46,643 -46,643 -46,643

3
Table 8 Comparison of the capacity gap at year 2030 across the 3 scenarios, assuming MINIMISED GROWTH for all wastes except Sewage and Low Level Radio Active wastes (tonnes)
Waste
Management
Scenario
1
Baseline
Scenario 2
Maximised
Recycling
Scenario 3
Median
Recycling
Landfill (C+I &LACW) 101,772 53,158 50,364
Landfill (Hazardous) 3,471 3,471 3,471
Landfill (C+D) 195,924 68,104 136,207
Energy from waste 111,314 94,015 187,556
Incineration (Specialist
High Temp) 861 861 861
Recycling (C+I & LACW) 311,532 363,764 280,973
Recycling (C+D) 117,043 304,704 204,716
Recycling (specialist
material) -2,322 -2,322 -2,322
Composting -11,190 2,491 -5,464
Residual Mechanical
Treatment 213,504 191,578 203,623
Treatment plant -50,414 -50,414 -50,414
1.4.10 There are additional facilities for managing waste in Bradford which have
recently been granted permission, however they have not as yet been
implemented and therefore have not been included in the capacity available
within the model for managing Bradford’s waste. Should the facilities be
implemented, there could be an additional 290,000 tonnes per annum of
capacity for management through Energy from Waste. This would provide a
surplus of requirement under all scenarios for these management routes
within Bradford.
1.4.11 The full projected capacity gaps across each of the scenarios for the period
2015-2030 are set out in Appendix 1; the tables identify the annual capacity
requirements for each waste treatment type and can be used to identify pinch
points when policies or allocations are likely to be required to prevent under-
capacity issues. Appendix 2 sets out cumulative landfill capacity gaps under
each scenario throughout the period 2013-2030 to assist the identification of
the level of capacity required throughout the entire Plan period.
1.4.12 In order to ensure that sufficient opportunities are provided for new waste
management facilities of the right type, in the right place and at the right time,
it will be necessary for the Waste Management DPD to take a flexible
approach to meeting future waste management requirements. Increasing
4
energy costs and non fossil fuel incentives could well result in an increased
demand for energy recovery including in the form of smaller scale embedded
combined heat and power sources. In order to achieve this, it will be
important to provide a flexible approach in meeting future waste management
requirements and identifying suitable sites/areas.
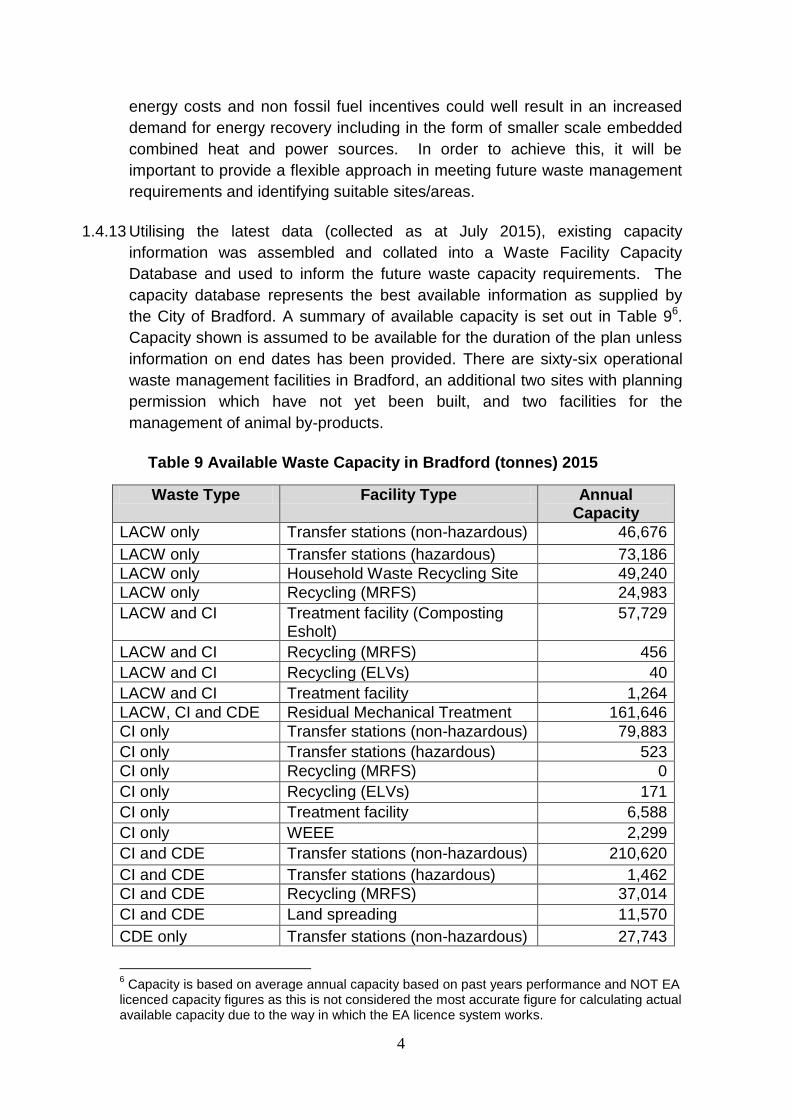
1.4.13 Utilising the latest data (collected as at July 2015), existing capacity
information was assembled and collated into a Waste Facility Capacity
Database and used to inform the future waste capacity requirements. The
capacity database represents the best available information as supplied by
the City of Bradford. A summary of available capacity is set out in Table 96.
Capacity shown is assumed to be available for the duration of the plan unless
information on end dates has been provided. There are sixty-six operational
waste management facilities in Bradford, an additional two sites with planning
permission which have not yet been built, and two facilities for the
management of animal by-products.
Table 9 Available Waste Capacity in Bradford (tonnes) 2015
Waste Type Facility Type Annual Capacity
LACW only Transfer stations (non-hazardous) 46,676
LACW only Transfer stations (hazardous) 73,186
LACW only Household Waste Recycling Site 49,240
LACW only Recycling (MRFS) 24,983
LACW and CI
Treatment facility (Composting Esholt)
57,729
LACW and CI Recycling (MRFS) 456
LACW and CI Recycling (ELVs) 40
LACW and CI Treatment facility 1,264
LACW, CI and CDE Residual Mechanical Treatment 161,646
CI only Transfer stations (non-hazardous) 79,883
CI only Transfer stations (hazardous) 523
CI only Recycling (MRFS) 0
CI only Recycling (ELVs) 171
CI only Treatment facility 6,588
CI only WEEE 2,299
CI and CDE Transfer stations (non-hazardous) 210,620
CI and CDE Transfer stations (hazardous) 1,462
CI and CDE Recycling (MRFS) 37,014
CI and CDE Land spreading 11,570
CDE only Transfer stations (non-hazardous) 27,743
6 Capacity is based on average annual capacity based on past years performance and NOT EA
licenced capacity figures as this is not considered the most accurate figure for calculating actual available capacity due to the way in which the EA licence system works.

5
Waste Type Facility Type Annual Capacity
CDE only Transfer stations (construction & demolition)
40,906
CDE only Land spreading 6,304
CDE only Treatment facility 54,028
Metallic wastes Recycling (ELVs) 4,732
Metallic wastes Recycling (Metals) 241,723
Metallic wastes WEEE 16,973
TOTAL 1,157,729
[Sources: Environment Agency Waste Data Interrogators 2006-2013 supplemented by
results of a survey undertaken for this assessment]
1.4.14 It is recommended that the City of Bradford consider the implications and
requirements of each of the proposed scenarios and select one set for the
purposes of planning for future waste facilities. In principle it is possible to
utilise different scenarios for the individual waste streams, however significant
modification will be required to the accompanying model supporting this report
and justification would be required as to why alternative scenarios have been
chosen from that agreed in preparation of this report.
1.4.15 The future management for residual LACW is currently under review. The
Council agreed in Jan 2015 to go out to a Competitive Dialogue Procedure
tendering to the open market for a long term solution to the management of
LACW from 2017. Each of the scenarios modelled have adopted the same
approach for LACW in line with the current procurement programme.
1.4.16 Following the completion of a soft market testing phase, the council expect
that the solution for LACW will be to pre-treat the waste stream to form an
RDF. However they are not specific on where either the pre-treatment facility
or thermal treatment facility would be provided and this could be within or
outside of Bradford. The waste modelling process has taken into account both
active existing sites and also sites with planning permission but not yet
constructed or operational which could all help provide capacity. In addition
information has been gained on facilities within the West Yorkshire region
which could possibly contribute to the need, although it is acknowledged that
a number of the facilities have already contracted out their capacity.
1.4.17 To cover a wider appraisal a review was undertaken of sub-regional capacity
for both LACW and C&I non-hazardous waste materials, highlighting any
known restrictions. Any capacity identified however may not necessarily be
available for the use of waste arisings from Bradford and may also be subject
to the Duty to Co-operate requirements. Findings are shown in Table 10.
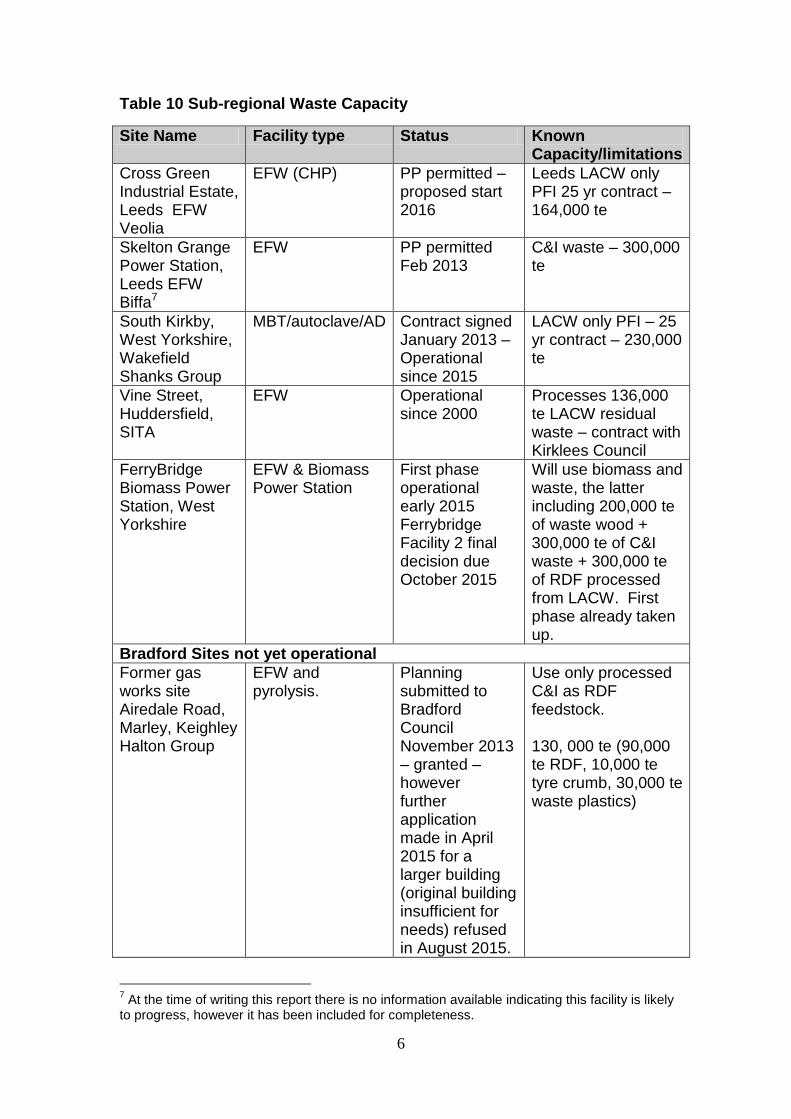
6
Table 10 Sub-regional Waste Capacity
Site Name Facility type Status Known Capacity/limitations
Cross Green Industrial Estate, Leeds EFW Veolia
EFW (CHP) PP permitted – proposed start 2016
Leeds LACW only PFI 25 yr contract –164,000 te
Skelton Grange Power Station, Leeds EFW Biffa7
EFW PP permitted Feb 2013
C&I waste – 300,000 te
South Kirkby, West Yorkshire, Wakefield Shanks Group
MBT/autoclave/AD Contract signed January 2013 – Operational since 2015
LACW only PFI – 25 yr contract – 230,000 te
Vine Street, Huddersfield, SITA
EFW Operational since 2000
Processes 136,000 te LACW residual waste – contract with Kirklees Council
FerryBridge Biomass Power Station, West Yorkshire
EFW & Biomass Power Station
First phase operational early 2015 Ferrybridge Facility 2 final decision due October 2015
Will use biomass and waste, the latter including 200,000 te of waste wood + 300,000 te of C&I waste + 300,000 te of RDF processed from LACW. First phase already taken up.
Bradford Sites not yet operational
Former gas works site Airedale Road, Marley, Keighley Halton Group
EFW and pyrolysis.
Planning submitted to Bradford Council November 2013 – granted – however further application made in April 2015 for a larger building (original building insufficient for needs) refused in August 2015.
Use only processed C&I as RDF feedstock. 130, 000 te (90,000 te RDF, 10,000 te tyre crumb, 30,000 te waste plastics)
7 At the time of writing this report there is no information available indicating this facility is likely
to progress, however it has been included for completeness.
7
Site Name Facility type Status Known Capacity/limitations
Biogen/Energos) Ripley Road
Gasification Planning permission granted 2010 and renewed in 2013
160,000 te of C&I waste only
[Sources: Bradford City Council; desk research of industry news sites]
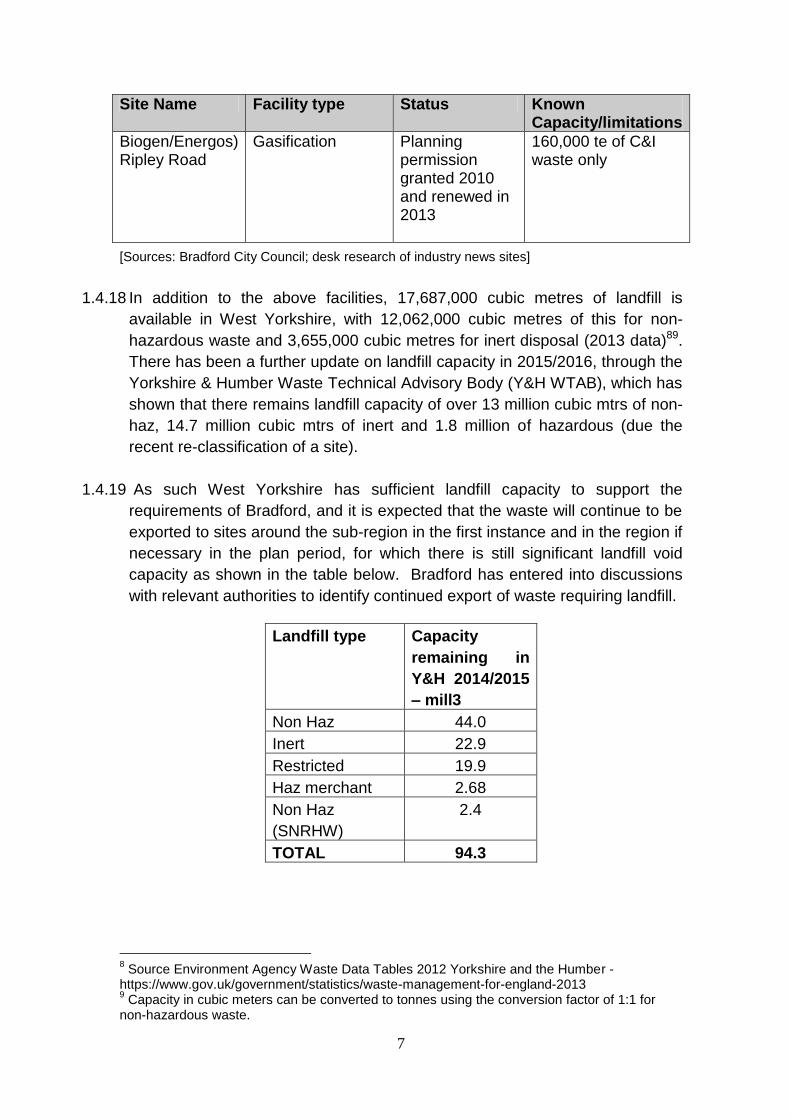
1.4.18 In addition to the above facilities, 17,687,000 cubic metres of landfill is
available in West Yorkshire, with 12,062,000 cubic metres of this for non-
hazardous waste and 3,655,000 cubic metres for inert disposal (2013 data)89.
There has been a further update on landfill capacity in 2015/2016, through the
Yorkshire & Humber Waste Technical Advisory Body (Y&H WTAB), which has
shown that there remains landfill capacity of over 13 million cubic mtrs of non-
haz, 14.7 million cubic mtrs of inert and 1.8 million of hazardous (due the
recent re-classification of a site).
1.4.19 As such West Yorkshire has sufficient landfill capacity to support the
requirements of Bradford, and it is expected that the waste will continue to be
exported to sites around the sub-region in the first instance and in the region if
necessary in the plan period, for which there is still significant landfill void
capacity as shown in the table below. Bradford has entered into discussions
with relevant authorities to identify continued export of waste requiring landfill.
Landfill type Capacity
remaining in
Y&H 2014/2015
– mill3
Non Haz 44.0
Inert 22.9
Restricted 19.9
Haz merchant 2.68
Non Haz
(SNRHW)
2.4
TOTAL 94.3
8 Source Environment Agency Waste Data Tables 2012 Yorkshire and the Humber -
https://www.gov.uk/government/statistics/waste-management-for-england-2013 9 Capacity in cubic meters can be converted to tonnes using the conversion factor of 1:1 for
non-hazardous waste.
8
1.4.20 It is recommended that the City of Bradford includes, within the Waste
Management DPD, information on existing capacity and an indication of the
number, scale and potential location for any facilities indicated as required to
meet future capacity needs as informed by this Report.
2. FUTURE CAPACITY REQUIREMENTS
2.1 Introduction
2.1.1 This section of the report deals with each of the principal waste streams in
turn, setting out:
Current arisings and capacity of existing facilities;
Future Arisings; and
Capacity of required facilities.
2.1.2 For each of the three scenarios explained in Paragraphs 1.4.2 a further set of
growth modifiers were applied, these are explained in paragraphs 1.4.3-1.4.5
and Table 3. A summary of the findings of the modelling process are
discussed below and presented in detail in Appendix 1.
2.2 LOCAL AUTHORITY COLLECTED WASTE (LACW)
Current Arisings and Capacity of Existing Facilities
2.2.1 A total of 226,085 tonnes of LACW was produced in 2013/14 in the City of
Bradford (Waste Arisings and Capacity Requirements PART A Report 2015).
2.2.2 The City of Bradford currently relies on a local merchant facility which uses
mechanical and hand sorting to extract recylates. Resulting RDF is
subsequently exported for energy recovery under interim arrangements. The
interim waste treatment arrangements are currently in place up to 2017 until
the Council adopts longer term arrangements for which it is currently
procuring.
2.2.3 Green waste composting takes place at Esholt WWTW within Bradford. There
is sufficient capacity at this site for LACW green waste composting; therefore
no sites are envisaged being required to meet this need.
2.2.4 LACW materials sent for recycling are managed through a wide variety of
outlets. Bradford has sufficient facilities for transfer of recyclable materials,
however, there appear to be few facilities available for recycling within
Bradford for LACW. There is a capacity gap identified for recycling throughout
the plan period for this waste stream.

9
2.2.5 However, local knowledge of transfer stations informed us of the recycling
being undertaken at some sites. This resulted in a more detailed review of
transfer stations being undertaken to see what was happening with waste
received at these sites through use of the EA WDI, and to identify if recycling
or other processing of waste was taking place. This was also supplemented
by information ascertained through phone calls with the site operators and
information provided by them as to the operations. When it could be
ascertained that transfer stations undertook recycling, an average recycling
rate of 35% was applied with the remaining capacity assumed to be transfer.
This has resulted in an increase in recycling capacity and a corresponding
reduction in transfer capacity within Bradford.
Future Arisings
2.2.6 The modelling reflects growth forecasts for LACW provided by the WDA.
Residual waste treatment capacity in the order of 130,000 – 135,000 tonnes
per annum as set out in the existing LACW contract will be needed to provide
for Bradford’s residual waste as a replacement for the interim arrangements.
Residual waste treatment and contract options are currently under
consideration.
LACW Required Facilities: Recycling Facilities
2.2.7 There is a gap in recycling capacity within Bradford, and currently most waste
is bulked up at transfer stations and managed elsewhere. Therefore there is a
capacity requirement of at least 45,000 tonnes per annum (no growth base
line recycling) up to almost 61,000 tonnes (growth and maximised recycling)
throughout the plan period (figures include recycling from secondary
processing).
LACW Required Facilities: Residual Mechanical Treatment Facilities
2.2.8 Whilst there is an initial gap in required facilities for residual mechanical
treatment as an option for the treatment of LACW waste (existing facility is
contract is due to end in 2017), contracts at existing sites could be extended.
However, the main site currently contracted may revert to C&I or to primarily a
waste transfer activity. Therefore, Bradford will need to consider identifying
capacity of at least 135,000 tonnes per annum to meet supply requirements
for LACW going forward. To ensure that an oversupply does not occur,
Bradford should continue to liaise with operators to assess the future potential
contribution to capacity needs the facility could meet, as well as ensuring they

10
account for any capacity provided through contract secured by the Waste
Management team.
LACW Required Facilities: Composting
2.2.9 Green waste is taken to Esholt WWTW by the Council to be mixed with
sewerage sludge for composting. A total of 30,175 tonnes of green waste
was collected in 2013/14 from both kerbside collections and Household Waste
Recycling Centres. This appears to as a direct result of an implemented
change in kerbside collection from sacks to wheelie bins in 2012 which has
resulted in an increase in the quantity of green waste collected. It is assumed
that the current arrangements retain adequate capacity to absorb any likely
increase in arisings as capacity at Esholt was above this.
LACW Required Facilities: Landfill
2.2.10 There is an identified need for landfill throughout the plan period, however as
discussed under 1.4.16, there is sufficient landfill capacity with West Yorkshire
which could help meet this need and if particular sites closed in West
Yorkshire, there is still considerable capacity cap within the Yorkshire and
Humber regional area. Bradford will need to continue to work closely with
neighbouring WPAs to discuss future landfill requirements for Bradford.
LACW Required Facilities: Energy Recovery
2.2.11 As referred to in Section 1.3, LACW collected in Bradford currently undergoes
mechanical treatment that produces a secondary product called RDF which
remains a waste even though it has been processed. Table 2 summarises the
quantity of RDF that was produced by this process in 2012. The forecasting
model identifies that there is a need for EfW capacity in Bradford to use this
RDF as a fuel to ensure that it is managed locally rather than exported to
other authorities or outside the UK, as happens currently. Bradford are
currently looking at options to manage this waste following the loss of PFI
Funding in 2013 and are expected to enter in to a new contract from 2017.
2.2.12 The main input to the mechanical treatment processes will be LACW with an
assumed level of 135,000 tonnes for management of waste arising in Bradford
in 2012. Both the mechanical treatment and energy from waste management
processes are able to co-treat C&I waste that is similar in composition to
LACW. An allowance has therefore been made similar to that outlined in the
Bradford PFI business case for secondary products arising from the
mechanical treatment of 35,000 tonnes per annum of C&I waste. This
additional load been included in the modelling to assess the total capacity

11
needed to produce RDF, manage extracted recyclables and for energy
recovery facilities.
2.2.13 RDF produced from LACW in Bradford is currently exported to Holland or
Denmark. It is proposed that this current interim contract and treatment
arrangements for Bradford’s residual LACW will only run until 2017. Bradford
is currently in the process of securing long term arrangements for the
management of LACW. There are two sites with planning permission (see
Table 10) which could help to meet the need for this element of LACW
requirement. If both facilities become operational, they will provide sufficient
capacity to meet the identified need for LACW and C&I. Should these facilities
not come forward then Bradford will need to consider how to meet the
identified gap throughout the plan period.
2.3 COMMERCIAL AND INDUSTRIAL (C&I) WASTE
Current Arisings and Existing Facilities
2.3.1 C&I data estimates have been based on 474,087 tonnes (2009, Extrapolated
NW C&I survey).
Figure 3 C&I waste arisings by sector
[Source: extrapolated from Environment Agency survey of C&I Arisings in North West
England, 2009]
Food, drink and tobacco
5%
Textiles/wood/paper/publishing
9%
Power & Utilities 6%
Chemical/non-metallic minerals
manufacturing 10%
Metal manufacturing
4%
Machinery & equipment (other
manufacturing) 13%
Retail & wholesale
26%
Other services 16%
Public sector 11%

12
2.3.2 The NW extrapolated survey gives a high level of commercial waste although
this reflects a high level of commercial waste recycling in the NW extrapolated
survey (62% of commercial waste estimated as recycled). However, the EA
Interrogator database indicates that a significantly higher proportion of waste
in the City of Bradford is managed through transfer facilities.
2.3.3 Waste transfer operations are increasingly undertaking waste segregation to
increase recycling rates and avoid the increasing cost of landfill disposal. It is
also the case that significant quantities of waste sent for recycling will be
managed through sites that are exempt from the full permitting requirements
and thus data is not captured by the EA Interrogator database. Many
recycling locations will be outside of the Plan area and indeed the exportation
of recyclate from the UK is a significant management route.
2.3.4 Recycling potential, particularly for commercial and industrial waste, is
increasing, with the greatest opportunity for mixed waste which is not currently
source segregated. Analysis of the 2009 extrapolated NW C&I survey
indicated that 80% of the category of mixed waste could be capable of
recycling or use for energy recovery.
Future Arisings Scenarios and Subsequent Capacity Gap
C&I Required Facilities: Transfer Stations
2.3.5 Waste transfer stations and bulking facilities provide a valuable component in
the efficient management of waste materials. In particular they are useful
when waste arisings are relatively small in quantity and widely distributed. For
this reason transfer stations are seen to be a significant feature of waste
management provision within the Plan area.
2.3.6 Under all growth projections and scenarios modelled there is no gap in
transfer station facilities within the Plan period. Transfer capacity exceeds
570,000 tonnes throughout the Plan period even with applied growth and
maximised recycling modifiers and therefore this is not shown in the tables at
the end of this report as a requirement during the Plan period. In the model,
capacity is allocated to recycling, treatment or disposal options. Transfer
facilities are therefore shown as a surplus although they may play an
important role in the chain of facilities used for any particular waste stream. It
should however be noted that due to the important role of transfer station
facilities in the Plan area, further capacity may be required to provide suitable
geographical distribution.

13
C&I Required Facilities: Recycling Facilities
2.3.7 The Baseline Scenario indicates that currently (2015) there is a gap in
available recycling capacity within the Plan area. The gap is significant for
both LACW and C&I waste streams. The gap is indicated to be in the order of
316,756 tonnes under no growth (estimated gap in 2015) rising to the order of
444,225 tonnes by 2030 under the maximised recycling and growth
scenario10. Whilst a proportion of recyclate is currently managed through
transfer and bulking facilities within the Plan area, final destination recycling
and reprocessing facilities lie mainly outside of the Plan area and therefore
current provision is met predominantly by export. However, it is understood
that transfer facilities also undertake an amount of recycling (c. 35%) which
would reduce the projected capacity gap for recycling facilities.
2.3.8 It is likely that increased national recycling provision for bulk recyclate
materials such as paper, card, glass, plastics and metals will be met by
increased capacity at regionally and nationally significant facilities, through
economies of scale. It is therefore likely that provision for final management
of increased levels of recyclate generated within the Plan area will be largely
provided for by export to recycling and processing facilities outside the Plan
area. However this does not prevent applications coming forward for recycling
of these waste streams over the plan period and the required number of
facilities/land take are indicated in tables 13-15 to address this. In the
absence of new capacity, it is recommended that the City of Bradford make
contact, under the Duty to Cooperate, with neighbouring/other Waste Planning
Authorities in order to establish whether they are aware of any foreseeable
changes which may affect the position over the expected life of the Plan (see
PART A Report for details pertaining to waste movements and Duty to
Cooperate).
C&I Required Facilities: Composting
2.3.9 Modelling shows a small gap in composting capacity by 2030 under Scenario
2. There are no permitted Aerobic Composting facilities within the Plan area.
Green Waste is taken to Esholt WWTW Biological Treatment Plant and
managed through this route and this is expected to continue. In 2015, just
over 57,000 tonnes of LACW and C&I green waste was treated at this facility.
2.3.10 A gap or surplus in treatment provision can be strongly influenced by the local
absence or provision of specialised treatment facilities which may only be
viable at a regional or national level. Specialised biological treatment capacity
10
This assumes Canal Road facility becomes available to manage C&I waste in 2018 when the current LACW contract ends.

14
provided by Esholt WWTW for green waste currently provides annual capacity
of around 58,000 tonnes per annum, and this is assumed to only accept
LACW although the licence does allow for C&I waste. Bradford currently takes
around 30,000 tonnes of Green Waste to this facility and the remaining
amount comes from WPAs within the Yorkshire and Humber region. Although
the Capacity available at this site would indicate a surplus in treatment
capacity for LACW, this capacity may in practice be taken up by “imported”
waste from neighbouring WPAs.
C&I Required Facilities: Metal Recycling Sites (specialist recycling; End of Life
Vehicles, Metals and Waste Electronic and Electrical Equipment [WEEE])
2.3.11 Modelling shows a surplus capacity under all growth projections and
scenarios throughout the Plan period therefore no additional ELV, Metals and
WEEE processing sites are likely to be required during the Plan period.
C&I Required Facilities: Treatment
2.3.12 Treatment includes a wide range of processes that may be required to deal
with specialist materials prior to recycling, energy recovery or final disposal.
C&I waste requiring treatment also includes hazardous waste. Environment
Agency hazardous waste records for 2013 show that in the order of 18,000
tonnes of hazardous waste were exported (see table 12 of the PART A
Report). Most of these arisings are treated or disposed of outside of Bradford.
The only hazardous waste treatment capacity within Bradford is clinical waste
treatment and records for 2013 show that approximately 2,135 tonnes of
healthcare arisings were treated in Bradford.
2.3.13 As detailed in paragraph 2.2.10, residual waste treatment processes are also
able to deal with C&I wastes that are of similar composition to residual LACW.
Table 8 summarises proposed treatment capacity which, could be
supplemented by procurement of alternative facility to treat LACW waste that
may offer capacity to manage C&I waste also.
C&I Required Facilities: Energy from Waste
2.3.14 In 2030 a requirement for energy recovery capacity is seen in all scenarios in
the order of 86,601 tonnes to 214,443 tonnes per annum (this figure is for
both C&I and LACW). The introduction of two energy recovery facilities with
existing planning permission11 would meet this need. Scenario 3 produces
the greatest demand for energy recovery facilities. If these two energy
11
Biogen/Energos (gasification) Ripley Road plant (180,000 tonnes per annum) and Aire Valley (130,000 tonnes per annum)

15
recovery facilities are not commissioned then the gap in energy recovery
requirement would be in the order of 214,000 tonnes in 2030 under Scenario
3 (assuming growth).
C&I Required Facilities: Non-Hazardous Landfill
2.3.15 Landfill requirements in 2030 for C&I wastes range from 59,000 tonnes under
Scenario 1 with no growth to 69,608 tonnes per annum in 2030 under
Scenario 1 with growth. Under Scenario 2 and using minimised growth, the
annual landfill requirement for C&I wastes falls to 34,863 tonnes per annum
tonnes by 2030. Under scenario 3 and minimised growth, the requirement for
landfill for C&I wastes drops from nearly 56,000 tonnes in 2015 to just over
26,000 tonnes in 2030. Currently, Bradford exports the majority of its landfill
waste to sites within West Yorkshire, with over 80% going to Wakefield (EA
WDI 2012), see Figure 3 below. As discussed above in paragraph 1.4.16,
there is significant void space available in West Yorkshire, and as such,
assuming agreement can be reached under Duty to Co-operate, it is not
expected that Bradford would seek to provide landfill capacity.
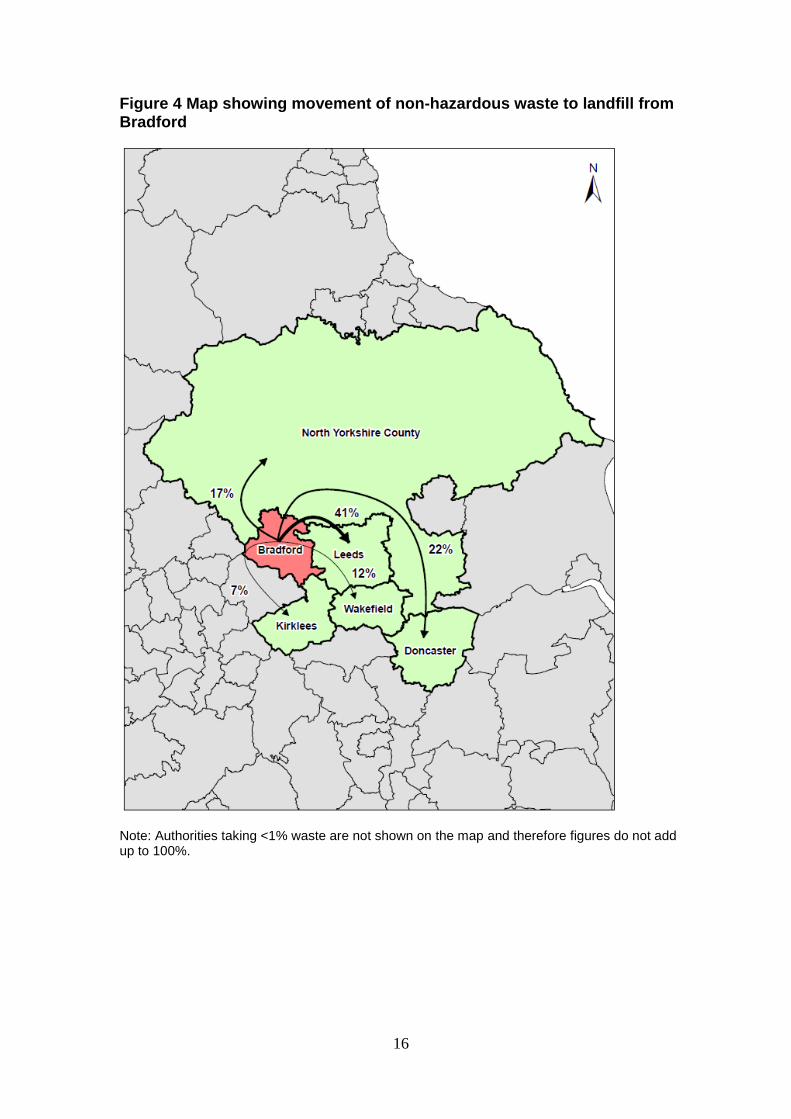
16
Figure 4 Map showing movement of non-hazardous waste to landfill from Bradford
Note: Authorities taking <1% waste are not shown on the map and therefore figures do not add up to 100%.
17
2.4 CONSTRUCTION, DEMOLITION AND EXCAVATION (CD&E) WASTE
2.4.1 Waste materials generated from Construction, Demolition and Excavation
(CD&E) operations include a wide range of surplus waste construction
materials as well as materials generated by the demolition and maintenance
of buildings and soils and sub-soils from excavation. Most of these materials
are inert with respect to their pollution potential. However, materials such as
wood are biodegradable, plasterboard produces a polluting leachate and
asbestos is classified as hazardous.
Current Arisings and Existing Facilities
2.4.2 Accurate data on the quantity of CD&E waste arisings has historically been
poor. Between 1999 and 2005 the Department of Communities and Local
Government conducted national surveys of arisings and use of alternatives to
primary aggregates. The latest national survey in 200512 suggested that the
production of recycled aggregate in the region had increased slightly since the
previous 2003 survey. However, due to the limited level of returns and at +/-
15% confidence level, the apparent changes in the 2003 and 2005 surveys
are not statistically significant. The data at a regional level is even less robust.
2.4.3 The PART A Report is based on data from the EA WDI (Waste Data
Interrogator, 2013) which showed a total of just over 214,306 tonnes of CD&E
waste is deposited in Bradford, with over 174,049 tonnes of this being
construction and demolition waste and just over 40,258 tonnes being
excavation waste. The EA WDI also showed 57,893 tonnes of CD&E waste as
originating in Bradford deposited in adjacent waste planning authority areas.
These totals represent a minimum as more CD&E will be coded generally as
Yorkshire and Humberside waste or managed through exempt facilities. In
practice most CD&E waste is managed through transfer stations in Bradford
or may be removed directly to sites outside the plan areas. If it is assumed
that CD&E waste arisings in the Yorkshire and Humberside region are
essentially managed within the region, a proportion of this total can be
estimated as arising in Bradford. Analysis of the EA Interrogator database for
2013 shows that when double counting of waste managed through transfer
and treatment facilities and final disposals are taken into account a total in the
order of 4.4 million tonnes was managed through permitted waste
management facilities.
2.4.4 Based on population, the ONS gives a Yorkshire and Humberside total of 5.3
million tonnes and Bradford 513,000 tonnes per annum, therefore the
12
Survey of Arisings and Use of Alternatives to Primary Aggregates in England, 2005. Construction, Demolition and Excavation Waste, Communities and Local Government.

18
proportion of waste arisings would be approximately 10%. Based on the most
recent ONS data release GVA for the Yorkshire and Humberside region, the
GVA in 2011 was £86.8 billion whereas Bradford’s total GVA for 2011 was
almost £8.3 billion giving again a proportion in the order of 10%. This would
give C&D arisings for Bradford in the order of 180,000 tonnes and Excavation
waste arisings of 260,000 tonnes.
2.4.5 There is no available data covering “Registered Exemptions” for CD&E which
would include registered exempted composting sites, burning practices on
land, spreading waste on land for reclamation/improvement and or sites used
for the storage of CD&E materials and mobile recycling of C&D. It is likely
that the level of arisings managed through exempt operations will continue
into the future and thus these arisings will not require additional future planned
capacity.
Future Arisings and Subsequent Capacity Gap
CD&E Required Facilities: Transfer Stations
2.4.6 Waste transfer stations and bulking facilities often provide a valuable
component in the transfer and bulking of CD&E waste materials. Modelling
under all scenarios and growth factors shows no gaps in provision over the
whole Plan period.
CD&E Required Facilities: Recycling
2.4.7 There is a shortfall of capacity for recycling of CD&E materials (principally
C&D waste) under Scenarios 2 and 3 over the plan period. Increasing
recycling rates will widen the gap, as would growth in waste arisings.
2.4.8 CD&E is also currently recycled / treated on site through mobile machinery.
These operations are permitted by local authorities and data on waste types
and throughput are not recorded in the EA Interrogator database and thus no
quantitative data is available. These operations are likely to remain an
important methodology for C&D recycling.
2.4.9 There is an identified need for additional capacity to support higher levels of
CD&E recycling early in the Plan period. Recycling of CD&E waste is
economically more viable at more localised facilities due to the lower value
and costs of transporting lower value higher density wastes and therefore the
recycling facilities for this waste stream are more likely to be required within
the Plan Area. CD&E recycling can be achieved by mobile plant working at
demolitions sites as well as at fixed facilities. Developments which produce a

19
high level of CD&E are encouraged to recycle this material on site using
mobile plant and it is expected that Bradford will continue to encourage such
practices to move the management of this waste up the hierarchy. The
capacity gap for CD&E is identified from the start of the plan period, therefore
facilities to process CD&E will be required from the outset. The gap ranges
from just over 116,000 tonnes in 2015 under scenario 1 with no growth up to
335,000 tonnes per annum under scenario 2 when applying growth in 2030. It
is considered that the gap could be met by the implementation of an extant
permission, which has a capacity of 200,000tpa, and by the continuation of
the management of CD&E on site.
CD&E Required Facilities: Landfill
2.4.10 Under the Baseline scenario with no growth the initial gap of 196,000 tonnes
in 2015 rises to just under 216,000 tonnes per annum at 2030 with growth.
Under maximised recycling with no growth the gap will be 68,104 tonnes per
annum by 2030 and 74,945 tonnes per annum with waste growth. Under
median recycling with no growth the gap will be 136,207 tonnes per annum by
2013 and 149,890 tonnes per annum with waste growth. However, as there is
in excess of 22 million cubic metres of inert waste capacity available in West
Yorkshire and planning permission (not yet implemented) for 2 million tonnes
in Bradford, it is considered there is sufficient landfill to meet this need. In
addition, infrastructure projects coming forward in Bradford and neighbouring
areas may require such materials for engineering purposes and therefore
Bradford are encouraged to look at the need for engineering material over the
plan period.
CD&E Required Facilities: Hazardous Landfill
2.4.11 There are no provisions for landfill of hazardous CD&E waste, namely
asbestos and asbestos contaminated waste, within the City of Bradford.
Whilst asbestos contaminated CD&E waste amounted to 880 tonnes in
2013,850 tonnes in 2012 indicating significant year on year variance, there will
be a gap in landfill provision for hazardous waste (from CD&E) under all
growth factors. Bradford does not have a landfill site which can manage this
waste, and there is insufficient need to warrant investment in landfill
specifically to meet the small requirement of Bradford. However, within West
Yorkshire, there are two sites licensed to take such waste, Skelton Grange in
Leeds and Thornhill Quarry in Kirklees. Bradford has worked with Kirklees
and Leeds through the Yorkshire and Humber Waste Technical Advisory Body
(Duty to Co-operate) to assess the potential for use of these sites throughout
the plan period.

20
2.5 HAZARDOUS WASTE
2.5.1 The 2005 Hazardous Waste (England and Wales) Regulations and the List of
Wastes (England and Wales) Regulations set out what is defined as
hazardous waste. Waste is classified as “Hazardous Waste” if it has
characteristics that make it harmful to human health, or to the environment,
either immediately or over an extended period of time.
2.5.2 Hazardous waste is a sub category of Local Authority Collected Waste,
Commercial and Industrial waste and CD&E classed materials. Estimated
totals for LACW, C&I waste and CD&E waste are inclusive of waste in the
sub-category of hazardous.
Current Arisings and Existing Facilities
2.5.3 A total of 19,084 tonnes of hazardous waste was recorded as arising in the
City of Bradford in 2013. The City of Bradford is a net exporter of hazardous
waste. In 2013 it imported 3,214 tonnes and exported 18,039 tonnes. A total
of 4,258 tonnes were managed in Bradford of this 2,185 tonnes were
recorded as healthcare treatment, 1,409 tonnes were managed through
transfer stations with 664 tonnes managed by recovery operations.
2.5.4 The future capacity requirement for hazardous waste has already been taken
into account under the main classes of waste materials for which hazardous
waste is a sub-set. However, hazardous waste facilities for treatment,
incineration and landfill are located outside the Plan area and it is anticipated
that provision will continue and remain available throughout the Plan period. It
should be noted that hazardous waste facilities require economies of scale so
that provision of facilities within the Plan area for the small quantities of
arisings would be unlikely to be viable unless a new facility were to import
significant quantities from outside the Plan area.
2.6 SEWAGE SLUDGE
2.6.1 There is one company who operate Waste Water Treatment Works (WWTW)
within Bradford and that is Yorkshire Water. The WWTW is one of the largest
sites in Europe at 388 hectares, providing sewerage treatment for a large
proportion of households within Bradford.
Future Arisings and Subsequent Capacity Gap
2.6.2 Yorkshire Water was contacted in order to gain a broad overview of their
future capacity requirements as far into the future as possible. The responses
indicated that at this stage they cannot give any indication of what future

21
requirements are likely to be with regard to waste water, especially not for the
entire Plan period up to 2028. However, Yorkshire Water have been involved
in consultations on Local Plans in the area and will continue this role going
forward, which would help inform any changes in growth requirements.
Yorkshire Water did not anticipate building new WWTW in Bradford but would
almost certainly be undertaking works at the existing WWTW over the plan
period.
2.6.3 Yorkshire Water published a 25-year document ‘Our Blueprint for Yorkshire:
The Next 25 Years’ in December 2013. A 5-year summary plan was
published in February 2015 which focuses on water quality compliance.
Required Facilities13
2.6.4 As a general principle, when greater capacity is required, WWTW operators
would try and place new plant on existing treatment works, or failing that
purchase land from an adjacent land owner. Therefore it is unlikely that new
sites will be required within the Plan area to handle waste water/sewage
sludge, particularly in view of the significant size of the existing YW site at 333
ha.
2.6.5 At present it is not envisaged that sites or capacity should be identified within
the Waste Management DPD for future use as WWTW as there is no current
requirement for additional facilities. Should any further land be required to
support the operation of Yorkshire Water, there is capacity within the existing
Esholt site which could meet that need. Yorkshire Water should be kept
informed of the plans progress and invited to comment at consultation stages.
2.7 AGRICULTURAL WASTE
2.7.1 Agricultural Waste is waste produced at agricultural premises as a result of
agricultural activity. Agricultural premises are defined in the Agriculture Act
1947 as land used for: horticulture, fruit growing, seed growing, dairy farming,
livestock breeding and keeping, grazing land, meadow land, osier land
(growing willow), market gardens and nursery grounds. It also includes
woodlands where that use is ancillary to the use of land for other agricultural
purposes. This definition includes all arable farming.
2.7.2 This waste is made up of the following substances, many of which can also be
defined as by-products and not necessarily wastes due to the fact they
13
The figures associated with waste water treatment capacity have not been included in Appendix 1(but can be found within the Forecasting Model Access Database) as the future capacity requirements are dependent upon the issues outlined under paragraph 2.6.2 of this report.
22
contain important nutrient resources and they are not defined as wastes when
applied to the land as fertiliser for the benefit of agriculture:
Compostable and digestible materials (farm yard manure, slurry,
vegetable);
Combustible materials (straw, silage wrap (plastic), bale twine and net
(plastic), fertiliser and seed bags (plastic), animal feed bags (plastic),
animal feed bags (paper & card), horticulture (plastic), tree guards
(plastic), paper seed bags (paper & card), and oil);
Hazardous and Difficult Waste14;chemical materials (silage effluent),
agrochemical (plastic), agrochemical (paper & card), animal health
(plastics), animal health (paper & card), animal health (glass), animal
health (rubber/metal), pesticide washings, sheep dip (organic phosphates)
and sheep dip (synthetic pyrethroids); and
Other (milk).
Current Arisings and Existing Facilities
2.7.3 There are 427 holdings in Bradford (DEFRA Local Authority Breakdown for
Key Crop Areas and Livestock numbers on agricultural holdings, Oct 2014
and DEFRA stats Food Farm Land use Livestock Results National Park Nov
2014). Therefore, the figures used are based on the best estimates available.
The City of Bradford generates around 291,000 tonnes of waste, the majority
of which is managed within the generating farm holding (Table 21 PART A
Report).
Future Arisings and Subsequent Capacity Gap
2.7.4 It will be necessary to provide for waste leaving the farm holdings amounting to
approximately just over 1,700 tonnes per annum (assuming no growth in the
volume of agricultural waste arisings). It is likely that in the future more waste
may be diverted from landfill for recycling, fulfilling the aspirations of waste
management moving up the waste hierarchy.
2.7.5 It is likely that the majority of agricultural waste will still be managed within the
farm holdings via land treatment/spreading and composting despite new
agricultural exemptions currently being implemented (PART A Report). The
quantities involved for management off-site from farm holdings are likely to be
so small they will be of low significance in the overall waste arisings for the City
of Bradford.
14
Difficult waste are those wastes which may be non hazardous but require special handling or treatment requirements
23
Required Facilities
2.7.6 The future arisings are very small (in the order of 1,000 tonnes per annum
assuming no growth in agricultural activity or significant change in agricultural
practice) and any required facilities to cover off farm holding recycling and
hazardous landfill would, in practice, be likely to require additional waste
materials to make any new facility viable. The capacity allowance should be
noted for the specialised treatment requirements for certain types of agricultural
waste such as animal by-products incineration and hazardous landfill. The
figures reflect the optimum level of treatment according to the waste hierarchy
and in reality some of the waste may not be able to be practically or cost
effectively recycled and therefore require treatment by other methods such as
landfill.
2.7.7 There is no immediate need to provide any new facilities solely to cover
agricultural wastes, the small capacity requirements for agricultural wastes
recycling are combined with C&I wastes and capacity gaps and new facility
requirements are therefore included within the totals in the section of the
report under C&I wastes. The “specialised” wastes generated that require
specialist treatment are likely to continue to be treated at such existing
specialised facilities over the plan period. It is noted that there are specialist
storage plants, processing (rendering) plants, incineration, co-incineration
plants and combustion plants all licensed and registered specifically for animal
by-products treatment only located already in Bradford15 (such as the
Incineration plants at Keighley and Bradford (operated by G and A Fort and
Mitchell by-products Ltd), and rendering/processing plants operated by
Omega Proteins Ltd and P Waddington and company). The rendering facilities
are specailised facilities of which there are a very limited number across the
UK (less than 10) and Bradford remains net importer of animal by-products.
2.8 LOW LEVEL RADIOACTIVE WASTE
2.8.1 Most (98%) of Low Level Waste (LLW) in the UK arises from operation of
nuclear power stations, nuclear fuel reprocessing facilities and also from the
decommissioning and clean-up of nuclear sites. The remaining 2% is
produced by non-nuclear industry users of radioactivity. As no nuclear sites
are located in the plan area, these non-nuclear industries are the sole
producers of LLW that will need to be planned for. Therefore, when compared
to the total LLW produced in the UK, the amount produced in Bradford is very
small.
15
http://www.defra.gov.uk/ahvla-en/disease-control/abp/premises/

24
Current Arisings and Existing Facilities
2.8.2 The EA were contacted to provide a list of sites where LLW arises in Bradford.
The results of this work identified two facilities: Bradford Royal Infirmary and
Bradford University.
2.8.3 The information received indicates that levels of LLW produced in Bradford
are minimal. This waste includes general items such as gloves, overshoes
and tissues which are disposed of as general laboratory waste, as well as
glassware and sharps which are contained in sharpsafes and assigned as
radioactive and disposed of as radioactive.
2.8.4 Volumes of waste are not requested from producers of LLW, however an
estimate has been made that the annual arising of LLW in the Sub-Region is
likely not to exceed 100m3.
Future Arisings and Subsequent Capacity Gap
2.8.5 There is no likelihood of a nuclear facility being located in Bradford in the next
20 years, which means it is highly unlikely that LLW will increase significantly
above current levels.
2.8.6 In March 2012 the UK Government produced ‘A Strategy for the Management
of Solid Low Level Radioactive Waste from the Non Nuclear Industry’. The
Strategy aims to:
Provide guidance and background information on this type of waste to
enable planning authorities to make informed decisions on planning
applications and to respond to concerns from their elected members and
constituents.
Clarify the respective roles of waste producers, the environment agencies,
planning authorities and the Nuclear Decommissioning Authority to enable
decisions to be made that properly recognize the responsibilities of others.
Ensure that waste producers and regulators are fully aware of how the
regulatory framework should be applied to LLW, particularly the need for
waste management plans, waste minimisation at source and use of the
waste hierarchy.
2.8.7 This Strategy has been produced in conjunction with the Nuclear
Decommissioning Authority, under the auspices of the Government’s
Radioactive Waste Policy Group (RWPG) to ensure appropriate integration
with the nuclear industry LLW strategy.

25
2.8.8 Research undertaken for the Strategy estimated that total UK arisings from
the non-nuclear industry are very unlikely to exceed 100,000 m3 per year. In
comparison, total waste arisings in England are around 272 million tonnes.
Non-nuclear LLW arisings are therefore very unlikely to exceed 0.1% by
volume of conventional waste arisings from the whole of the UK.
2.8.9 However, the document notes that participation in the LLW survey was less
than anticipated and therefore the quantification of waste arisings from the
non-nuclear industry across the whole of the UK remains very uncertain and is
to be treated with caution.
2.8.10 The Strategy concludes that the disposal network available to the non-nuclear
industry for radioactive waste is fragile and non-existent in some parts of the
country. This means waste can travel some distance from source to disposal
location.
Required Facilities
2.8.11 There are no landfill sites in Bradford permitted for controlled burial of LLW.
The nearest landfill to Bradford able to accept LLW is Clifton Marsh in the
county of Lancashire, which is permitted until 2035. The latest planning
permission relating to Clifton Marsh (Ref: LCC/2014/0162) restricts the
amount of LLW originating from outside the North West Region and imported
into the site to not more than 4,000 tonnes per annum.
2.8.12 Two facilities exist within Leeds to manage LLW, at the Knostrop treatment
works and these are identified in the Y&H Waste Position Paper as waste
management facilities in Y&H. The two sites are in close proximity at the
Knostrop treatment works, one taking aqueous LLRW of up to 109,500tpa and
the other taking primarily healthcare waste to a incineration facility with a
capacity of 17,000tpa.

26
3. SUMMARY OF FUTURE WASTE MANAGEMENT REQUIREMENTS
3.1 This section looks at the future waste management requirements for the City
of Bradford in line with the waste hierarchy. According to the Needs
Assessment, the indicative requirements for future waste management
facilities in the City of Bradford can be summarised as follows:
Future Capacity Requirements for LACW
There is surplus capacity for composting for LACW throughout the plan
period under all Scenarios assuming all available capacity can be
utilised by Bradford.
Residual waste treatment capacity initially in the order of 135,000 tonnes
per annum will be needed as a replacement for the interim arrangements
from 2017.
Part of the contract for LACW is management of residual waste. Until a
contract is in place to treat residual waste to form RDF, there is a gap of
135,000 tonnes from 2017 to the end of the plan period.
Scenario 1, no growth gap of 179,500 tonnes for residual mechanical
treatment from 2018 when the contract with Canal Road comes to an
end. Under baseline growth the gap widens from 19,222 tonnes in 2015
to 217,203 tonnes by 2030 and under baseline with minimised growth,
the gap is 19,002 tonnes in 2015 and by 2030 is 213,504 tonnes. The
contract at Canal Road ends in 2017 and the capacity gap widens
sharply after this to 194,515 tonnes (2018, baseline with growth) and
193,625 tonnes (2018, baseline with minimised growth). Landfill
requirements remain static at 39,000 tonnes through the plan period
under baseline no growth rising to just over 48,000 tonnes under growth.
Scenario 2 (Maximised recycling and no growth) the gap for Residual
Mechanical Treatment of 14,730 tonnes in 2015 becomes a gap of
161,751 tonnes by 2030. Under maximised recycling with growth the gap
increases from 16,073 tonnes in 2015 to reach 195,277 tonnes by 2030
and under maximised recycling with minimised growth the capacity
grows from 15,853 tonnes in 2015 to 191,578 tonnes by 2030. Landfill
requirements reduce from just under 36,000 tonnes in 2015 to 19,500 by
2030 under no growth, and reducing to just over 24,000 tonnes under
the growth option.
Scenario 3 (Median recycling and no growth) the gap for Mechanical
residual Treatment rises from 16,355 tonnes in 2015 to 171,501 tonnes
in 2030. With median recycling and growth the gap increases from
17,710 tonnes in 2015 to 207,322 tonnes by 2030 and with median
recycling and minimised growth the gap rises from 17,490 tonnes in
27
2015 to 203,623 tonnes in 2030. Landfill requirements are the same as
for maximised recycling for LACW.
Future Requirements for RDF and Recyclable Material for C&I and LACW
RDF is currently produced at a site in Bradford and the resulting product
is exported from the Plan area. However, it is assumed that treatment of
LACW at this site will cease on termination of an interim contract in
2017.
Provision of Residual Mechanical Treatment will result in secondary
products from treating both LACW waste and C&I as RDF 80% of
original input and recyclate 20% of the original input.
Total EfW requirements, including that for secondary RDF, are 100,607
tonnes per annum under the initial baseline and 214,443 tonnes per
annum under median recycling and growth by 2030.
There are a number of EfWs within the sub-region that are built, being
built or in the planning process, which specifically require RDF. The pre-
treatment of waste to create a RDF for export is possible and this energy
source may be used within Bradford. Should the plan provide for EfW
facilities to manage both LACW and C&I, the plan would need to provide
for 1 large EfW facility with an annual throughout sufficient to manage up
to 200,000 tonnes per annum, or up to 2 smaller facilities with an annual
throughout of 100,000 tonnes per annum (under baseline levels of
recycling).
There are a limited number of existing facilities for processing recyclable
LACW and C&I materials within Bradford. Therefore, these materials
are currently exported from the Plan area. There is an identified gap
throughout the Plan period. Work has been done to assess the level of
recycling taking place at WTS, where sites are known to undertake
recycling, an estimate of the level undertaken on site has been
undertaken and used to inform modelling, recycling is assumed to be in
the region of 35%.
Recycling facilities (e.g. Materials Recycling Facilities (MRF’s)) are
required to manage both LACW and C&I. Under baseline no growth the
requirements in 2030 are 316,756 tonnes rising to 444,225 tonnes in
2030 under growth and maximised recycling. The plan would need to
provide for either up to 4 large facilities with an annual throughout of
128,000 tonnes per annum (expected land take of 4ha), or up to 10
smaller facilities with an annual throughout of 50,000 tonnes per annum
(under baseline levels of recycling). However, it should be noted that the
outputs from recycling facilities can either be a product or a recyclate. If
a product is produced from the recycling facility then there is no further
management of waste required as it ceases to be a waste. If recyclate is

28
produced, this material can still be considered a waste requiring further
management. The management of the recyclate is currently largely
dependent on export from the Plan area and it is expected that this
position will continue in the current markets. However, if the plan needs
to provide facilities for the treatment for recyclate, then co-location on
allocated recycling facility sites should be considered in the first instance,
with sites of sufficient size to accommodate such co-location. It is
recognised that some WTS undertake recycling on site, where it can be
identified this is taking place, the modelling work recognises this,
however, in reality levels may be higher than estimated and the
requirement for recycling facilities could be lower.
Future Waste Capacity Requirements for C&I Waste
Waste requiring treatment consists largely of specialist hazardous
wastes which are treated outside of the Plan area and, due to the
specialist nature of the facilities that treat this waste, it is assumed that
this practice will continue throughout the Plan period;
There is no capacity gap for the recovery of energy from suitable C&I
waste provided that the new energy from waste capacity with planning
permission becomes operational. Should the permissions not come
forward, as stated above a single EfW with capacity of 200,000 tonnes
per annum would be required to manage both Bradford’s C&I and LACW
waste or up to 4 smaller facilities with an annual throughout of approx
50,000 tonnes per annum over the plan period, however should the 2
permitted facilities be built then this will meet Bradford’s requirements for
the plan period;
The requirement for non-hazardous landfill of C&I waste is in the order of
37,566 tonnes per annum by the end of the plan period if a maximised
recycling (growth) scenario is realised. However, there are no existing
landfill sites within Bradford, therefore it is assumed that there will be a
continued reliance on export for waste managed this way throughout the
plan period. The maximum requirement in 2015 is 58,822 tonnes per
annum under scenario 1 no growth.
Reviewing results by scenarios the following results can be seen for
landfill of C&I waste (assuming LACW has gone for residual waste
management treatment;
Scenario 1 (baseline, no growth) the landfill deficiency remains at 58,822
tonnes per annum for the whole plan period, under baseline with growth
the deficiency rises from 2015 to reach 69,608 tonnes by 2030 and
under baseline with minimised growth the deficiency is 58,470 in 2015
reducing to 53,595 tonnes by 2030.

29
Scenario 2 (maximised recycling, no growth) the deficiency reduces from
56, 367 tonnes in 2015 down to 31,810 tonnes by 2030 and with
maximised recycling minimised growth, the fall in landfill requirement
reduces to 29,069 tonnes by 2030.
Scenario 3 (median recycling, no growth) landfill requirements are
27,913 tonnes by 2030. Applying growth this rises to 32,295 tonnes by
2030 and by applying minimised growth the deficiency reduces to 26,275
tonnes by 2030.
There is a gap for composting of C&I waste by 2030 if this waste cannot
use Esholt. Should Esholt not be available, the maximum required by
2030 under Scenario 2 with growth would be 4,421 tonnes which could
be met by one small facility.
Future Waste Capacity Requirements for CD&E Waste
Additional recycling facilities are indicated as being required under all
scenarios. If the maximum recycling option is to be achieved by 2030,
facilities will be required to manage 334,834 tonnes per annum. It is
considered that this requirement could be met by the implementation of
an extant permission in Bradford, which has a capacity of 200,000tpa
and by the continuation of the management of CD&E on site.
Landfill capacity will be required principally for excavation waste for
which no alternative option is available. There is currently limited
operational landfill capacity within Bradford, however planning
permission was granted in 2013 for an inert landfill site with a capacity of
2 million tonnes, which would serve the needs for the plan period. Until
operational and if this site does not become operational, it is expected
that this waste will continue to be managed through exportation outside
of Bradford. As discussed earlier in the report, there is significant
capacity in West Yorkshire to manage this waste, and in addition
Bradford should consider future infrastructure requirements to assess
the use of such material for engineering works.
Hazardous landfill; asbestos and asbestos contaminated waste from
CD&E is currently exported for landfill which is the only management
option for this waste, a gap in the order of 5,035 tonnes per annum
appears by 2030 under growth, all scenarios. It is expected that this
waste will continue to be managed through exportation outside of
Bradford. There are landfill site licensed to take such waste within West
Yorkshire.
Reviewing results by scenarios the following results can be seen for
landfill and recycling;
Scenario 1 (baseline) the landfill gap under no growth is 195,924 tonnes
and for recycling 116,141 tonnes for the whole plan period. With growth

30
this rises for landfill from 197,100 in 2015 to reach 215,606 tonnes by
2030 and for recycling 116,845 in 2015 rising to 128,323 tonnes by
2030. Scenario 2 (maximised recycling) the landfill deficit under no growth/minimised growth is 174,618 tonnes in 2015, falling to 68,601 by 2030. Under growth, the landfill gap decreases from 175,666 tonnes in 2015 to 74,945 in 2030. Under no growth, the gap in C&D recycling capacity increases from 147,422 (2015) to 303,802 (2030). Under minimised growth the gap in C&D recycling capacity is 147,542 (2015) and rises to 304,339 by 2030. Under growth, the gap at 2030 is 334,834 tonnes.
Scenario 3 (median recycling) under no growth the landfill gap is at
185,969 tonnes in 2015 falling to 136,207 tonnes by 2030. With growth
the gap is 149,890 tonnes by 2030. Under no growth, the gap in
recycling rises from 130,757 tonnes in 2015 to 203,814 by 2030. Under
growth, the gap in C&D recycling is 316,882 tonnes in 2015, rising to
345,355 by 2030.
Future Waste Capacity Requirements for Agricultural Waste
Off-farm disposal is included within C&I waste provision;
There is no requirement for new facilities over the Plan period.
Future Waste Capacity Requirements for Sewage Sludge
Anticipate adequate provision by the Water Companies with any
additional requirement being met within existing operations.
Asset management plans to continue throughout the Plan period.
Future Waste Capacity Requirements Low Level Radioactive Waste
It is assumed that existing exports of LLW will continue during the Plan
period. The quantity of LLW arising in, and exported from, Bradford is
small and not considered significant. Therefore it is not proposed that
authorities accepting these wastes will be contacted under DtC.
Duty to Co-operate
Under all scenarios where the continued export of waste is likely to be the
management option going forward, it is recommended that Bradford engage in
early discussion with those authorities to which it is known waste is currently
exported to assess the continuation of the practice throughout the life of the
Waste Management DPD.
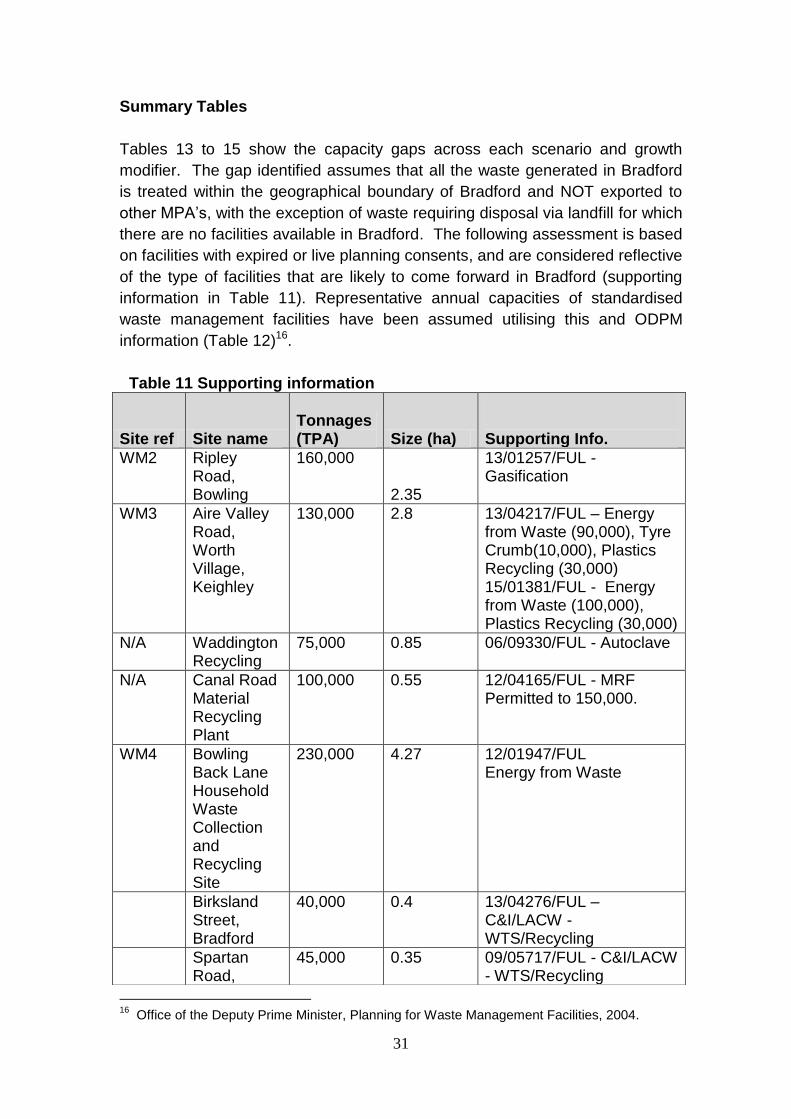
31
Summary Tables
Tables 13 to 15 show the capacity gaps across each scenario and growth
modifier. The gap identified assumes that all the waste generated in Bradford
is treated within the geographical boundary of Bradford and NOT exported to
other MPA’s, with the exception of waste requiring disposal via landfill for which
there are no facilities available in Bradford. The following assessment is based
on facilities with expired or live planning consents, and are considered reflective
of the type of facilities that are likely to come forward in Bradford (supporting
information in Table 11). Representative annual capacities of standardised
waste management facilities have been assumed utilising this and ODPM
information (Table 12)16.
Table 11 Supporting information
16
Office of the Deputy Prime Minister, Planning for Waste Management Facilities, 2004.
Site ref Site name Tonnages (TPA) Size (ha)
Supporting Info.
WM2 Ripley Road, Bowling
160,000
2.35
13/01257/FUL - Gasification
WM3 Aire Valley Road, Worth Village, Keighley
130,000 2.8 13/04217/FUL – Energy from Waste (90,000), Tyre Crumb(10,000), Plastics Recycling (30,000) 15/01381/FUL - Energy from Waste (100,000), Plastics Recycling (30,000)
N/A Waddington Recycling
75,000 0.85 06/09330/FUL - Autoclave
N/A Canal Road Material Recycling Plant
100,000 0.55 12/04165/FUL - MRF Permitted to 150,000.
WM4 Bowling Back Lane Household Waste Collection and Recycling Site
230,000 4.27 12/01947/FUL Energy from Waste
Birksland Street, Bradford
40,000 0.4 13/04276/FUL – C&I/LACW - WTS/Recycling
Spartan Road,
45,000 0.35 09/05717/FUL - C&I/LACW - WTS/Recycling

32
Table 12 Assumptions made
Facility Type Tonnage Land take
Materials Recycling/Reprocessing
Facilities (LACW & C&I waste)
128,000 tonnes 1 ha
Materials Recycling/Reprocessing
Facilities (C&D waste)
63,000 tonnes
1 ha
Non-hazardous non-inert landfill 100,000 to
500,000 tonnes (or
the equivalent void
space)
N/A
Non-hazardous inert landfill 100,000 tonnes N/A
Hazardous landfill 20,000 tonnes N/A
Composting 25,000 to 35,000
tonnes.
1 – 2 ha
Energy Recovery 100,000 – 200,000
tonnes
2 – 3 ha
Residual Mechanical Treatment 100,000 tonnes 1 ha
The assumed representative annual capacities of standardised waste
management facilities, set out in Table 12, have been applied to the capacity
Bradford
Victoria Works, Bradford
75,000 0.48 04/01425/FUL – C&I/LACW - WTS/Recycling
Neville Road, Bowling
104,000 C&D
13,000 &I/LACW
2.69 total
2.57 -C&D recycling
0.12 – WTS/Recycling C&I/LACW
04/03348/FUL and 06/03183FUL 2.57 -C&D recycling 0.12 – WTS/Recycling C&I/LACW
Hammerton Street, Bradford
75,000 0.85 04/04371/FUL – C&D Recycling
Progress Works, Hall Lane, Bowling
50,000 2.18 06/00502/FUL - C&D Recycling
Hallas Rough Quarry
200,000 1.2 10/01152/FUL & 13/01091/MAF – C&D Recycling

33
gap forecast. The purpose of doing this is to provide an indication of the land
take that would be required in order to meet future waste management
requirements. Tables 13 – 15 set out the anticipated land take required to meet
forecast gaps in waste management capacity. The total number of hectares of
the sites set out in the Waste Management DPD (17.62ha) is greater than the
maximum land take required under the capacity gap forecasts. A surplus land
take requirement, as put forward in the Waste Management DPD, is advised for
the following reasons:
Providing a choice and mix of potential waste management sites across
the District is important to support waste hierarchy objectives;
It ensures flexibility of the Plan respond to future circumstances and
changing approaches to waste management including technological
advancement;
An appropriate mix of sites will help accommodate different waste
streams allowing waste operators flexibility to develop the necessary
waste management facilities the District needs.

0
Table 13 Comparison of the capacity gap at year across the 3 scenarios, assuming NO GROWTH (Negative figures indicates no gap), all wastes except Sewage and Low Level Radioactive waste (tonnes) indicating total number of facilities required and landtake.
Waste Management Year Scenario 1
Baseline
Scenario 2
Max. Recycling
Scenario 3
Med. Recycling
Min no
Facilities
est. Land take
(ha)
Landfill (non-hazardous
C&I and LACW)
2015 97,822 92,111 91,757 N/A N/A
2020 97,822 63,589 61,464 N/A N/A
2030 97,822 51,310 47,413 N/A N/A
Landfill (hazardous) 2015 4,076 4,076 4,076 N/A N/A
2020 4,076 4,076 4,076 N/A N/A
2030 4,076 4,076 4,076 N/A N/A
Landfill (CD&E) 2015 195,924 174,618 185,969 N/A N/A
2020 195,924 68,104 136,207 N/A N/A
2030 195,924 68,104 136,207 N/A N/A
Energy recovery 2015 100,607 99,607 109,685 1 2 – 3 ha
2020 100,607 86,601 147,073 N/A N/A
2030 100,607 86,601 181,218 N/A N/A
Incineration (Specialist
High Temp)
2015 861 861 861 <1 N/A
2020 861 861 861 <1 N/A
2030 861 861 861 <1 N/A
Recycling (C&I and
LACW)
2015 316,756 322,508 313,401 3 3 ha
2020 316,756 353,920 302,012 N/A N/A
2030 316,756 366,199 281,918 N/A N/A
Recycling (aggregates
CD&E)
2015 116,141 147,422 130,757 4 Extant PP in
place

1
Waste Management Year Scenario 1
Baseline
Scenario 2
Max. Recycling
Scenario 3
Med. Recycling
Min no
Facilities
est. Land take
(ha)
2020 116,141 303,802 203,814 1 Extant PP in
place
2030 116,141 303,802 203,814 N/A N/A
Recycling (specialist
materials– including
metal recycling, End of
Life Vehicles and
WEEE
2015 -2,322 -2,322 -2,322 Surplus Surplus
2020 -2,322 -2,322 -2,322 Surplus Surplus
2030 -2,322 -2,322 -2,322 Surplus Surplus
Composting 2015 -18,457 -17,042 -18,115 Surplus Surplus
2020 -18,457 -7,382 -13,821 Surplus Surplus
2030 -18,457 -7,382 -13,821 Surplus Surplus
Residual Mechanical
Treatment
2015 17,854 14,730 16,355 1 0.5 -1 ha
2020 179,500 161,751 171,501 1 1 ha
2030 179,500 161,751 171,501 N/A N/A
Treatment Plant
(including Anaerobic
Digestion, specialised
treatment of
biodegradable liquids
and wastes, organic
waste treatment by
distillation)
2015 -49,078 -49,078 -49,078 Surplus Surplus
2020 -49,078 -49,078 -49,078 Surplus Surplus
2030 -49,078 -49,078 -49,078 Surplus Surplus
Total estimated land take 8 ha
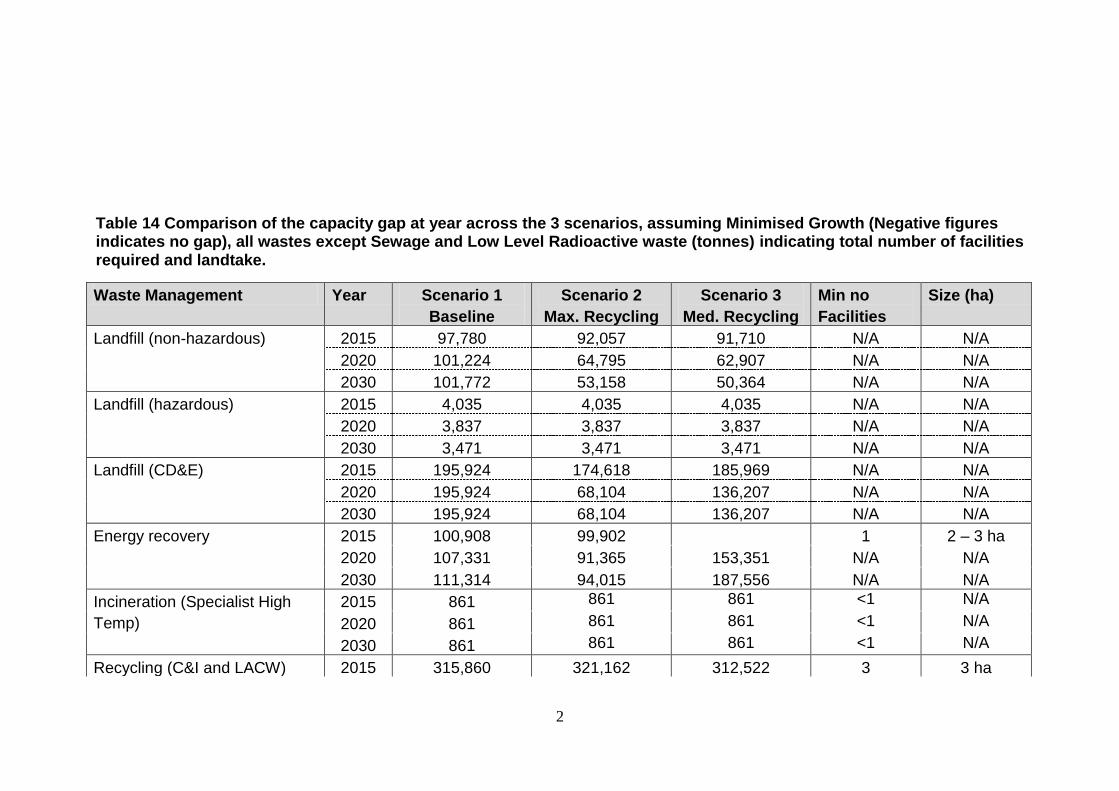
2
Table 14 Comparison of the capacity gap at year across the 3 scenarios, assuming Minimised Growth (Negative figures indicates no gap), all wastes except Sewage and Low Level Radioactive waste (tonnes) indicating total number of facilities required and landtake.
Waste Management Year Scenario 1
Baseline
Scenario 2
Max. Recycling
Scenario 3
Med. Recycling
Min no
Facilities
Size (ha)
Landfill (non-hazardous) 2015 97,780 92,057 91,710 N/A N/A
2020 101,224 64,795 62,907 N/A N/A
2030 101,772 53,158 50,364 N/A N/A
Landfill (hazardous) 2015 4,035 4,035 4,035 N/A N/A
2020 3,837 3,837 3,837 N/A N/A
2030 3,471 3,471 3,471 N/A N/A
Landfill (CD&E) 2015 195,924 174,618 185,969 N/A N/A
2020 195,924 68,104 136,207 N/A N/A
2030 195,924 68,104 136,207 N/A N/A
Energy recovery 2015 100,908 99,902 1 2 – 3 ha
2020 107,331 91,365 153,351 N/A N/A
2030 111,314 94,015 187,556 N/A N/A
Incineration (Specialist High
Temp)
2015 861 861 861 <1 N/A
2020 861 861 861 <1 N/A
2030 861 861 861 <1 N/A
Recycling (C&I and LACW) 2015 315,860 321,162 312,522 3 3 ha

3
Waste Management Year Scenario 1
Baseline
Scenario 2
Max. Recycling
Scenario 3
Med. Recycling
Min no
Facilities
Size (ha)
2020 317,964 357,733 304,976 N/A N/A
2030 311,532 363,764 280,973 N/A N/A
Recycling (aggregates CD&E) 2015 116,171 147,452 130,787 3 Extant PP
om plave
2020 116,678 304,339 204,351 N/A N/A
2030 117,043 304,339 204,716 N/A N/A
Recycling (specialist materials–
including metal recycling, End
of Life Vehicles and WEEE
2015 -2,322 -2,322 -2,322 Surplus Surplus
2020 -2,322 -2,322 -2,322 Surplus Surplus
2030 -2,322 -2,322 -2,322 Surplus Surplus
Composting 2015 -18,236 -16,809 -17,890 Surplus Surplus
2020 -13,984 -1,358 -8,699 Surplus Surplus
2030 -11,190 2,491 -5,464 <1 N/A
Residual Mechanical
Treatment
2015 19,002 15,853 17,490 1 0.5-1 ha
2020 199,735 179,500 190,616 1 1 ha
2030 213,504 191,578 203,623 1 1 ha
Treatment Plant (including
Anaerobic Digestion,
specialised treatment of
biodegradable liquids and
wastes, organic waste
treatment by distillation)
2015 -49,168 -49,168 -49,168 Surplus Surplus
2020 -49,604 -49,604 -49,604 Surplus Surplus
2030 -50,414 -50,414 -50,414 Surplus Surplus
Total estimated land take 9 ha
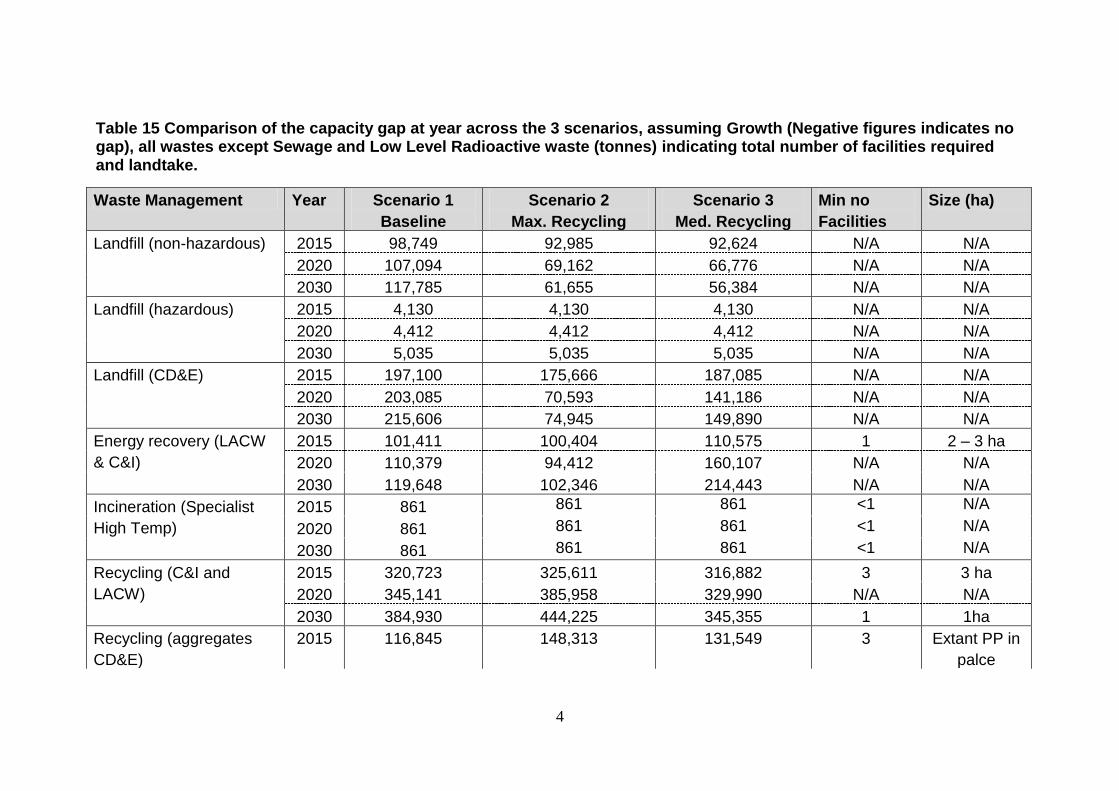
4
Table 15 Comparison of the capacity gap at year across the 3 scenarios, assuming Growth (Negative figures indicates no gap), all wastes except Sewage and Low Level Radioactive waste (tonnes) indicating total number of facilities required and landtake.
Waste Management Year Scenario 1
Baseline
Scenario 2
Max. Recycling
Scenario 3
Med. Recycling
Min no
Facilities
Size (ha)
Landfill (non-hazardous) 2015 98,749 92,985 92,624 N/A N/A
2020 107,094 69,162 66,776 N/A N/A
2030 117,785 61,655 56,384 N/A N/A
Landfill (hazardous) 2015 4,130 4,130 4,130 N/A N/A
2020 4,412 4,412 4,412 N/A N/A
2030 5,035 5,035 5,035 N/A N/A
Landfill (CD&E) 2015 197,100 175,666 187,085 N/A N/A
2020 203,085 70,593 141,186 N/A N/A
2030 215,606 74,945 149,890 N/A N/A
Energy recovery (LACW
& C&I)
2015 101,411 100,404 110,575 1 2 – 3 ha
2020 110,379 94,412 160,107 N/A N/A
2030 119,648 102,346 214,443 N/A N/A
Incineration (Specialist
High Temp)
2015 861 861 861 <1 N/A
2020 861 861 861 <1 N/A
2030 861 861 861 <1 N/A
Recycling (C&I and
LACW)
2015 320,723 325,611 316,882 3 3 ha
2020 345,141 385,958 329,990 N/A N/A
2030 384,930 444,225 345,355 1 1ha
Recycling (aggregates
CD&E)
2015 116,845 148,313 131,549 3 Extant PP in
palce

5
Waste Management Year Scenario 1
Baseline
Scenario 2
Max. Recycling
Scenario 3
Med. Recycling
Min no
Facilities
Size (ha)
2020 120,782 315,301 211,660 2 N/A
2030 128,323 334,834 224,804 N/A N/A
Recycling (specialist
materials– including
metal recycling, End of
Life Vehicles and WEEE
2015 -2,321 -2,321 -2,321 Surplus Surplus
2020 -2,316 -2,316 -2,316 Surplus Surplus
2030 -2,306 -2,306 -2,306 Surplus Surplus
Composting 2015 -18,119 -16,692 -17,773 Surplus Surplus
2020 -13,275 -649 -7,990 Surplus Surplus
2030 -9,260 4,421 -3,534 <1 N/A
Residual Mechanical
Treatment
2015 19,222 16,073 17,710 1 0.5-1 ha
2020 201,079 180,844 191,960 1 1 ha
2030 217,203 195,277 207,322 1 1 ha
Treatment Plant
(including Anaerobic
Digestion, specialised
treatment of
biodegradable liquids and
wastes, organic waste
treatment by distillation)
2015 -48,939 -48,939 -48,939 Surplus Surplus
2020 -48,222 -48,222 -48,222 Surplus Surplus
2030 -46,643 -46,643 -46,643 Surplus Surplus
Total estimate land take 10 ha