Embed Size (px)
Citation preview
Future Time Perspective, Socio-emotional Regulation, and Diurnal Cortisol Patterns
in Post-secondary Engineering Students
by
Katherine C. Cheng
A Dissertation Presented in Partial Fulfillment of the Requirements for the Degree
Doctor of Philosophy
Approved July 2017 by the Graduate Supervisory Committee:
Jenefer Husman, Chair
Kathryn Lemery-Chalfant Douglas Granger
Natalie D. Eggum-Wilkens Reinhard Pekrun
ARIZONA STATE UNIVERSITY August 2017
i
ABSTRACT
Built upon Control Value Theory, this dissertation consists of two studies that
examine university students’ future-oriented motivation, socio-emotional regulation,
and diurnal cortisol patterns in understanding students’ well-being in the academic-
context. Study 1 examined the roles that Learning-related Hopelessness and Future
Time Perspective Connectedness play in predicting students’ diurnal cortisol patterns,
diurnal cortisol slope (DS) and cortisol awakening response (CAR). Self-reported
surveys were collected (N = 60), and diurnal cortisol samples were provided over two
waves, the week before a mid-term examination (n = 46), and the week during
students’ mid-term (n = 40). Using multi-nomial logistic regression, results showed
that Learning-related Hopelessness was not predictive of diurnal cortisol pattern
change after adjusting for key covariates; and that Future Time Perspective
Connectedness predicted higher likelihood for students to have low CAR across both
waves of data collection. Study 2 examined students’ future-oriented motivation
(Future Time Perspective Value) and socio-emotional regulation (Effortful Control
and Social Support) in predicting diurnal cortisol patterns over the course of a
semester. Self-reported surveys were collected (N = 67), and diurnal cortisol samples
were provided over three waves of data collection, at the beginning of the semester (n
= 63), during a stressful academic period (n = 47), and during a relaxation phase near
the end of the semester (n = 43). Results from RM ANCOVA showed that Non-
academic Social Support was negatively associated with CAR at the beginning of the
semester. Multi-nomial logistics regression results indicated that Future Time
Perspective Value and Academic Social Support jointly predicted CAR pattern
ii
change. Specifically, the interaction term marginally predicted a higher likelihood of
students switching from having high CAR at the beginning or stressful times in the
semester to having low CAR at the end the semester, compared to those who had low
CAR over all three waves. The two studies have major limits in sample size, which
restricted the full inclusion of all hypothesized covariates in statistical models, and
compromised interpretability of the data. However, the methodology and theoretical
implications are unique, providing contributions to educational research, specifically
with regard to post-secondary students’ academic experience and well-being.
iii
To my family, for their love and support through thick and thin.
To my father, Alfred Li-Ping,
for giving me a vision and a great education –
for being my rock,
and for always encouraging me to move forward.
To my mother, Jing-Yau,
for her unwavering faith and unconditional love,
which has been the source of my persistence;
and for being an exemplar of what a strong woman is.
To my sister, Jessamine,
for being my greatest confidant,
and for teaching me math before I could even read –
those lessons came in handy.
Lastly, to grandmother Shih, who passed eleven years ago,
for inspiring my pursuit in interdisciplinary studies and well-being research.
iv
ACKNOWLEDGMENTS
I would like to acknowledgment my dissertation committee. First and
foremost, I thank my dissertation chair and mentor Dr. Jenefer Husman, for giving me
the opportunity to exercise my intrinsic motivation and realize a research dream; for
being a visionary educator, and a fighter in life; and for her patience in advising me
every step of the way. I would like to thank Dr. Natalie Wilkens, for setting the bars
high, yet consistently scaffolding me along the way; for her constant support in many
aspects of my life during the last year of my doctoral journey; I would not have come
so far without her help. I want to thank Dr. Kathryn Lemery-Chalfant, for being a
number one supporter; for providing critical feedback for both my comprehensive
exam and dissertation; and for reminding me to keep persistent during difficult times.
I would like to acknowledge Dr. Reinhard Pekrun, for his relentless positivity and
support with regard to my research ideas; and for his open-mindedness to possibilities
of expanding upon his lifework, Control Value Theory. I would like to thank Dr.
Douglas Granger, for his continuous support for both my comprehensive exam and
dissertation; his thorough, thoughtful, and constructive feedback, especially with
regard to the methodologies in salivary cortisol research, has been greatly helpful.
I would like to acknowledge the faculty and staff of T. Denny Sanford School
of Social and Family Dynamics at Arizona State University for their training and
support; for allowing an individualized doctoral student experience; and for providing
seed funding for salivary biomarker research, which made this dissertation a
possibility. Special thanks to Drs. Tracy Spinrad and Masumi Iida, who both served
v
on my doctoral comprehensive exam committee; they provided valuable feedback,
and played significant roles in my doctoral training. I would like to acknowledge the
Quantum Energy and Sustainable Solar Technology – Engineering Research Center
for their fiscal and practical support in this series of educational research. I would like
express appreciation for the IISBR, for providing practical help in the biomarker and
methodological portions of this series of studies. I would like to express my gratitude
to the Sanford School MASA faculty and the Quantitative Psychology faculty at
ASU, who have provided me with comprehensive tools for statistical analyses; and
for being most kind and responsive in answering any statistics-related questions.
Last, but not least, I would like to thank my family and friends. Specifically, I
acknowledge my comrades and peers from the Sanford School, the QESST–ERC, the
Department of Psychology, my lab-mates from the Husman-Brem Lab, and
undergraduate RAs (in particular Danny, Kurtis, and Ryan, who have spent time and
energy on the studies of this dissertation). Their friendships have been the best part of
this academic journey. I have learned from each of them, have been inspired by their
passion for life and dedication to learning and research, and they have kept me going
when stalling seemed like the only way out. I would like to acknowledge my family
and friends in and from Taiwan, who have witnessed my pursuit in higher education,
provided continuous moral support, and have tenderly tolerated my solitary retreats
into dissertation writing. Finally, I would like to thank Sunchin, for being a kind and
loving observer of my struggles, and for providing sound advice as I navigated my
way through this last period of graduate school; his support has been indispensable.
vi
TABLE OF CONTENTS
Page
LIST OF TABLES…………………………………………………........………......viii
LIST OF FIGURES…………………………………………………....………….…..xi
INTRODUCTION…………………...…………………………………………….......1
Physiological Stress Pathways………………………………………………...4
Diurnal Cortisol Patterns………………………………………………………6
Theoretical Framework for the Educational Context: Control Value Theory....7
Inclusion of Future Time Perspective…………………………………………9
The Current Studies…………………………………………………..………11
STUDY 1: FUTURE TIME PERSPECTIVE, HOPELESSNESS, AND
PHYSIOLOGICAL STRESS DYSREGULATION INDICATED BY DIURNAL
CORTISOL PATTERNS IN COLLEGE ENGINEERING STUDENTS…………...15
The Current Study……………………………………………………………25
Methods……………………………………………………………………....26
Results………………………………………………………………………..33
Discussion……………………………………………………………………49
STUDY 2: FUTURE TIME PERSPECTIVE (VALUE), EMOTION REGULATION,
AND SOCIAL SUPPORT PREDICTING DIURNAL CORTISOL PATTERN
CHANGE OVER THE COURSE OF A SEMESTER………………………………55
The Current Study……………………………………………………………66
Methods………………………………………………………………………67
vii
Page
Results………………………………………………………………………..77
Discussion…………………………………………………………………..105
GENERAL DISCUSSION….…………………………………….….……………..113
Theoretical Implications…………………………………………………….114
Practical Implications……………………………………………………….117
Strengths, Limitations, and Directions for Future Research....……………..118
Conclusion…….…………………………………………………………….120
REFERENCES…………………………………………………………….………..142
APPENDIX
A STUDY 1 BIVARIATE CORRELATION MATRIX OF RAW DATA...154
B STUDY 2 BIVARIATE CORRELATION MATRIX OF RAW DATA...156
viii
LIST OF TABLES
Table Page
1. Timeline for Study 1…………………………...…………….…114
2. Timeline for Study 2…………………………...…………….…115
3. Study 1 Number of Participants with Regards to Demographic
Information……………………..……………...………………….………….…116
4. Retention of Study 1 Diurnal Cortisol Data Sample Size at Each
Time point………………………………………………………117
5. Study 1 Descriptive Statistics: Mean Cortisol Levels between Two
Consecutive Days at Wake, 30-minutes Upon-awakening, and
Bedtime for Wave 1 and Wave 2……………………………….118
6. Study 1 Descriptive Statistics for Diurnal Cortisol Parameters:
Diurnal Cortisol Slope (DS) and Cortisol Awakening Response
(CAR) for Wave 1 and Wave 2.……...…………………………119
7. Study 1 Bivariate Correlations between Diurnal Cortisol
Parameters……………………………………………………....120
8. Study 1 t-tests and Descriptive Statistics: Examining Gender
Differences in Mean-level Cortisol (log-transformed µg/dL) and
Diurnal Cortisol Parameters….…………………………………121
9. Study 1 t-tests and Descriptive Statistics: Examining Minority
Status Differences in Mean-level Cortisol (Log-transformed µg/dL)
and Diurnal Cortisol Parameters…………….………………….122
ix
Table Page
10. Study 1 Estimated Descriptive Statistics of Diurnal Cortisol
Parameters after Adjusting for Missingness…………..……...…123
11. Study 1 Cross Tabulation for Association between DS Group
Status and CAR Group Status…..………………………………124
12. Study 2 Number of Participants over Time with Regards to
Demographic Information………………………………………125
13. Retention of Study 2 Diurnal Cortisol Data Sample Size at Each
Time Point………………………………………………………126
14. Study 2 Descriptive Statistics: Mean Cortisol Levels (µg/dL)
between Two Consecutive Days at Upon-awakening, 30-minutes
Upon-awakening, and Bedtime for Wave 1, Wave 2, and Wave
3....................................................................................................127
15. Study 2 Descriptive Statistics for Diurnal Cortisol Parameters:
Diurnal Cortisol Slope (DS) and Cortisol Awakening Response
(CAR) for Wave 1, Wave 2, and Wave 3……………...………..128
16. Study 2 Bivariate Correlations between Diurnal Cortisol
Parameters……………………………………………………....129
17. Study 2 t-tests and Descriptive Statistics: Examining Gender
Differences in Mean-level Cortisol (log-transformed µg/dL) and
Diurnal Cortisol Parameters…….………………………………130
x
Table Page
18. Study 2 t-tests and Descriptive Statistics: Examining Minority
Status Differences in Mean-level Cortisol (log-transformed µg/dL)
and Diurnal Cortisol Parameters………………….…………….131
19. Study 2 t-tests and Descriptive Statistics: Examining Under-
represented (UR) Minority Status Differences in Mean-level
Cortisol (log-transformed µg/dL) and Diurnal Cortisol
Parameters…..……………………………..………………..…..132
20. Study 2 Cross Tabulation for Association between DS patterns and
CAR Patterns over Time………………………...………..…….133

xi
LIST OF FIGURES
Figure Page
1. The Theoretical Model…………………………………………..134
2. Study 1 Bar Charts of Missing Diurnal Cortisol Data at Wave 2
with Regards to Minority Status………………………………...135
1
INTRODUCTION
University life is comprised of more than the academic sector of experiences;
within the university context, life includes social, personal, and emotional experiences
that may shape one’s well-being. Although the main focus of higher education and
related research has been on students’ learning, motivation, achievement, and
academic performance (e.g., Copeland, 2015; Drew, 2015; Nelson, Shell, Husman,
Fishman, & Soh, 2015), universities have focused more and more resources on the
student well-being as a means to help students realize their full potential in higher
education (e.g., Swaner, 2007). Well-being has been described in many ways, and
there is no clear consensus on the definition so far. Some refer to well-being as the
new definition of health, which encompasses not merely the absence of illness, but
also positive functioning, such as having plenty of physical resources, being able to
cope with normal life stresses, and the ability to work productively and contribute to
the community, etc. (Herzlich, 1973, p. 60; World Health Organization, 2014). In
motivation-related research, most refer to well-being as a psychological or subjective
construct, which either is comprised of happiness, positive affect, low negative affect,
and satisfaction of life (Diener & Suh, 1997; Headey, 2006; Sheldon & Kasser, 1995;
Vansteenkiste, Lens, Soenens, & Luyckx, 2006), or highlights positive psychological
functioning such as autonomy, environmental mastery, realization of potential, and
positive relationships with others (Rogers, 1961; Ryff, 1989; Waterman, 1993).
Dodge and colleagues argued that one’s psychological, social, and physical resources
can help balance dips in the dynamic equilibrium of one’s well-being due to

2
environmental or life challenges (Dodge, Daly, Huyton, & Sanders, 2012). Their see-
saw model suggests that moderate levels of life or environmental challenge could be
optimal for one’s positive functioning and development; however, excessive amounts
of challenge, in relation to one’s resources, could be disruptive for optimal well-
being. Similarly, in the university context, academic challenges (for example class
assignments, or examinations) could be beneficial for academic development (e.g.,
Flow Theory, Csikszentmihalyi, 2002); however, without adequate psychological,
social, or physical resources, students’ well-being could be at stake. Examining the
psychological and social antecedents to specific emotions and associated
physiological markers in the university context, therefore, can be helpful to address
well-being issues students may have in their university experience.
Notably, increasing amounts of literature emphasize the bio-psycho-social
nature of subjective well-being (Dodge et al., 2012; World Health Organization,
2016). In recent decades, research in health psychology has been able to locate bio-
psycho-social factors that are associated with well-being (Labbe & Kuczmierczyk,
2013; Sarafino & Smith, 2008). Studies examining social evaluative threat indicate
that prolonged or repeated psychosocial stress could be harmful to one’s well-being
via physiological stress pathways (Dickerson & Kemeny, 2004). Subjective well-
being, or the lack thereof, has been associated with physiological stress dysregulation
(e.g., Doane et al., 2013; Saxbe, Repetti, & Nishina, 2008). Interestingly, similar to
the dynamic equilibrium nature of well-being (the resources vs. challenges see-saw as
noted by Dodge et al., 2012; Heading & Wearing, 1991; 1992), a physiological stress
3
response is the body’s attempt to establish homeostasis in face of a stressor. Notably,
although students do need a certain degree of pressure or level of challenge to achieve
optimal learning and to develop deeper understanding of their course materials, if
students face repeated or prolonged exposure to stress without adequate resources to
cope, their well-being may be at stake. Socio-emotional support may help buffer or
alleviate stress, and increase mental and physical well-being (e.g., Karb, Elliott,
Dowd, & Morenoff, 2012), which is coherent to the concept of “resources” in the
well-being literature. In the educational context, however, few have integrated this
line of research on stress physiology in inspecting the bio-psycho-social aspects of
student well-being. Building upon Control Value Theory, which explores the
antecedents of specific academic emotions, and the multi-faceted nature of academic
emotions (Pekrun, 2006), researchers in educational psychology have begun to
examine physiological correlates of specific emotions in the educational context
(Spangler, Pekrun, Kramer, & Hoffmann, 2012). Given that academic emotional
experiences are a part of university life which may form students’ well-being
alongside their resources and challenges, the goals of this dissertation are to
investigate how students’ specific emotions, such as academic hopelessness, and
students’ motivational and socio-emotional regulatory factors, may predict
physiological stress dysregulation within the academic context (e.g., around
examination) via diurnal cortisol assessments, to locate correlates of well-being in
post-secondary education (see theoretical model in Figure 1).
4
Physiological Stress Pathways
A stress response is the body’s attempt to establish homeostasis in face of a
stressor. The stressor that in ancient times was related to survival, such as escaping a
predator, could in today’s environment be psychological or social, for example, taking
an exam, or giving a presentation to an audience. Upon stress, two systems in our
body are activated to produce a fight-or-flight response–the locus coereleus-
norepinephrine/sympathetic nervous system (LC-NE/SNS) and the hypothalamus-
pituitary-adrenal (HPA) axis (cf. Nelson, 2011). The LC-NE/SNS often corresponds
to stress in terms of a fight-or-flight reaction (imagine one’s bodily reactions when
encountering intense threat: increased heart rate, fast-paced breathing, blood flows to
muscles, sweaty palms, etc.), facilitating the body to react quickly to stress via the
autonomous nervous system. The HPA axis reacts with a slightly slower pace; it is
activated within minutes upon exposure to an environmental or psychosocial stressor,
starting from the release of the corticotropin-releasing hormone (CRH) in the
hypothalamus, which induces the release of the adrenocorticotropic hormone (ACTH)
in the pituitary gland, in turn eliciting the release of corticosteroids (cortisol for
humans) in the adrenal cortex. As an end product of the HPA axis, cortisol has been
named a stress hormone in recent literature. Cortisol secretion is in general helpful for
the body to adapt to social or environmental stressors (McEwen, 1998).
Notably, bodily reaction to a stressor is mediated by multiple interactive
systems, including the autonomic nervous system, the HPA axis, the immune system,
and metabolic hormones, etc. The coordination among these systems to achieve
5
stability over change is known as allostasis; it helps allocate bodily resources to
systems in more immediate need. Allostatic overload, however, may occur when
energy expenditure exceeds resources accessible (McEwen & Wingfield, 2003;
McEwen & Wingfield, 2010). If a stressor continues to be present beyond one’s alarm
reaction phase and resistance (coping) phase, it may produce dysregulation in
systems’ coordination and exhaustion in the individual, which results in maladaptive
consequences on behavior and health; this is known as the general adaptation
syndrome (Seyle, 1950). In other words, if one is faced with repeated or prolonged
psychosocial or environmental stress, such as experiencing repeated stressful
coursework and examinations in post-secondary education, there may be failure in
shutting down one’s stress response, and cortisol levels along with other products of
the stress response (e.g., inflammatory cytokines) may become dysregulated.
For example, the neuroendocrine-immune system interaction contains a
negative feedback loop between glucocorticoids and the immune system. Secretion of
cortisol can down-regulate some cytokines (e.g., interleukin-1, IL-1) preventing local
inflammation; increase in IL-1 can stimulate the release of CRH and ACTH, elevating
cortisol levels (Wilder, 1995). Consequences from stress dysregulation in the
neuroendocrine-immune system pertain to, but are not limited to, a subdued immune
system, autoimmune diseases, and shorter survival from cancer; other maladaptive
consequences include hippocampal neuronal damage, cardiovascular diseases, etc.
(Kemeny, 2009; Sephton et al., 2013; Sephton, Sapolsky, Kraemer, & Spiegel, 2000).
6
Diurnal Cortisol Patterns
The aforementioned stress dysregulation and health consequences have been
associated with abnormal diurnal cortisol patterns. Typically, cortisol levels follow a
natural diurnal rhythm, with morning levels higher (peaking at around 30-minutes
after awakening), and evening levels lower. The morning peak around 30-minutes
after awakening has been called the cortisol awakening response (CAR); it indicates
the body’s preparation to face the day. The natural decline of cortisol levels
throughout the day has been called the diurnal cortisol slope (DS), which signifies
cortisol recovery over the day. The diurnal rhythm has been found to show a flattened
effect under repeated or prolonged stress, with less profound morning peaks and
flattened evening recovery. The flattening of the diurnal rhythm signals that the body
has reached saturation of the allostatic load (McEwen, 1998), with little resource to
regulate cortisol levels back to diurnal normality (profound morning peaks and
evening recovery). CAR and DS, therefore, can be appropriate candidates to indicate
one’s allostatic profile, which is informative of one’s physiological stress regulation,
and has important implications on one’s well-being, as the allostatic load is linked to
other bodily systems important for daily functioning (such as the immune system,
cardiovascular system, and the central nervous system, as stated above). As cortisol
levels can be conveniently measured via assaying one’s saliva sample (cf., Granger et
al., 2007), CAR and DS could be quick, non-invasive indicators for physiological
stress regulation and enable researchers to gain objective insight into one’s well-being
and health.
7
Specifically, the flattening of one’s DS has been found to be associated with
factors that contribute to both mental and physical well-being, such as depression or
immunal suppression (e.g., Doane et al., 2013; Sephton et al., 2013; Sephton,
Sapolsky, Kraemer, & Spiegel, 2000). Flatter diurnal cortisol patterns were related to
high levels of psychosocial risk factors (cynicism, depression, and vital exhaustion),
whereas a steeper diurnal rhythm was related to psychosocial resources (social
support and coping), positive general health, and well-being (Sjögren, Leanderson, &
Kristenson, 2006). Notably, although CAR has been associated with one’s well-being
(Chida & Steptoe, 2009), CAR has also been found to have substantial intraindividual
variation over time, and has been found to be indicative of more momentary stress
regulation that fluctuates on a daily basis (Stalder et al., 2015). Nonetheless, as Dodge
and colleagues noted, the dynamic fluctuation of well-being is associated with recent
life events, therefore, it is valuable to assess CAR as an indicator of well-being. In
sum, the above literature suggests that diurnal cortisol patterns are related to one’s
functioning and well-being.
Theoretical Framework for the Educational Context: Control Value Theory
Many areas in social sciences have used interdisciplinary methods to examine
correlates of stress via both subjective (e.g., self-reports) and objective measures (e.g.,
physiological responses). In educational research, Control Value Theory suggests that
academic emotional experiences can be multi-faceted as well. According to Control
Value Theory, emotions can be represented by a hierarchically organized structure
that includes four second-order factors: the affective, cognitive, motivational, and
8
physiological components (Pekrun, 2006). Built upon Expectancy-Value Theory
(Vroom, 1964), Control Value Theory incorporates motivational, cognitive, and
physiological aspects of emotions, and explores emotional experiences related to
academic achievement (e.g., Pekrun, Goetz, Frenzel, Barchfeld, & Perry, 2011).
However, only a small number of educational research studies have taken advantage
of physiological measures to examine or describe students’ experiences in the
academic context (Spangler et al., 2002).
According to Control Value Theory, academic achievement emotions are
multi-faceted, suggesting that emotional experiences specific to the academic context
are paired with physiological reactions. As noted previously, if students were to
experience stressful academic events on a regular basis, students’ physiological stress
responses could be activated repeatedly, and context-specific emotions could
eventually either contribute to or become harmful for students’ health and well-being.
For example, it is reasonable to posit that the feeling of Hopelessness in learning
about a specific course could be associated with one’s saturated allostatic load (low
well-being), which may in turn be reflected on one’s physiological stress responses in
face of a mid-term examination of that course.
In line with Control Value Theory, I posit that motivational and affective
factors as well as regulatory factors associated with one’s academic experience could
help enhance or lower students’ well-being. Diurnal cortisol assessments may help
illustrate current theory, and contribute to interdisciplinary research, giving us insight
9
to students’ psychological and physical well-being which could be crucial for
academic persistence and success.
As Control Value Theory denotes, discrete academic achievement emotions
include, but are not limited to, enjoyment, hope, pride, anxiety, hopelessness, shame,
and anger, of which hopelessness is an under-examined emotion (Frenzel, Pekrun, &
Goetz, 2007; Pekrun, Goetz, Titz, & Perry, 2002), but could be particularly related to
students’ well-being. Research in psychology has discussed the associations between
general hopelessness and depressive symptoms, as well as predictions from
depressive symptoms to the flattening effect of diurnal cortisol (e.g., Pössel, Mitchell,
Sjögren, & Kristenson, 2015). However, direct associations between academic-related
hopelessness and students’ diurnal cortisol patterns in post-secondary educational
settings are yet to be explored. As academic-related hopelessness is a prospective
negative emotion, i.e., it is anticipatory in nature (Pekrun et al., 2002), although it is
context specific, i.e., specific to the academic context, it would be reasonable to
assume that in terms of temporal effects, the emotion could be related to dysregulated
diurnal cortisol patterns due to prolonged or repeated academic stress.
Inclusion of Future Time Perspective
Control Value Theory suggests that academic achievement emotions are
influenced by students’ appraisal antecedents, including subjective control over
achievement activities, as well as subjective outcome values of these activities
(Pekrun, 2006). In studying academic-related emotions, Control Value Theory has
integrated theories such as Expectancy-Value Theory (e.g., Turner & Schallart, 2001),
10
theories of attribution in achievement (Weiner, 1985), theories on perceived control
(Perry, 1991), etc.; however, albeit the burgeoning evidence that future-oriented
motivation could be meaningful appraisal antecedents for academic-related emotions
(e.g., Husman, Cheng, Puruhito, & Fishman, 2015), future time perspective theory has
not yet been integrated into the Control Value Theory framework. According to future
time perspective theory, future time perspective (FTP) is one’s perceptions about the
future and ability to consider the future; it has been described as “the degree to which
and the way in which the future is anticipated and integrated in the psychological
present of an individual, … FTP is a cognitive-motivational personality characteristic
that results from goal setting” (Lens, Paixao, Herrera, & Grobler, 2012). FTP has been
found to be an important motivational construct that enhances learning experiences
(Husman & Shell, 2008; Kauffman & Husman, 2004; Peetsma, 2000; Shell &
Husman, 2001), promotes intrinsic motivation (Vansteenkiste, Simons, Soenens, &
Lens, 2004), and supports active learning (Simons, Vansteenkiste, Lens, & Lacante,
2004). Studies in the time perspective literature show that FTP is a multidimensional
construct (Husman & Lens, 1999; Simons et al., 2004; Stouthard & Peetsma, 1999),
with sub-dimensions including: a) Connectedness, the tendency to anticipate future
consequences, to make cognitive connections between the present and the future; b)
Valence, or Value, the tendency to place value in future goals; c) Extension, how far
thoughts are projected into the future; and d) Speed, how quick time seems to pass
(Husman & Shell, 2008). Within these sub-dimensions, connectedness and valence
have been positively linked with control beliefs (Shell & Husman, 2001). As potential
11
appraisal antecedents within the Control Value Theory framework, it is plausible that
FTP Connectedness and FTP Value could contribute to one’s emotional experience
and well-being via influencing the subjective control and subjective outcome value
one has for academic activities.
In research regarding general FTP, King and Gaerlan (2014) found that FTP
was positively associated with Filipino university students’ positive academic
achievement emotions (hope, joy, and pride), and contrary to their hypothesis,
positively associated with anxiety, linking FTP to academic achievement emotions.
Qualitative analyses have, on the other hand, demonstrated that thoughts of future
goals were helpful in recovering from present negative emotions, such as test-related
shame, after an exam for college students, and acted as a means to protect goal-
striving efforts (Turner & Husman, 2008).
The Current Studies
The current work, within the dimensional perspective of FTP, explored the
specific roles that the sub-dimensions FTP Connectedness and FTP Value may have
as appraisal antecedents, specifically in conjunction with the affective and
physiological components of academic achievement emotions. This series of studies
examined post-secondary Engineering students as participants of particular interest.
Engineering students are a unique sample in that they encounter rigid curricula and
problem-solving challenges on a regular basis. These challenges elicit repeated stress
responses and frustration that may hinder their academic pursuit and program
completion (Chang, Cerna, Han, & Sa'enz, 2008; Hsieh, Sullivan, Sass, & Guerra,
12
2012; Suresh, 2007). Engineering educational research has focused on the importance
of motivational constructs in predicting students’ achievement and career plans (e.g.,
Jones, Paretti, Hien, & Knott, 2010). However, some research shows that for
Engineering students, both motivation and institutional integration (e.g., beliefs of
relationships with faculty and peers in college) play important roles in students’
persistence throughout their degree (French, Immekus, & Oakes, 2005). Motivation
toward future goals helps students to progress and persevere through the degree;
however, Engineering students do not necessarily acquire socio-emotional support in
their learning environments (such as from faculty or peers) despite having course
loads which may take heavy emotional tolls (e.g., Kötter et al., 2014). The nature of
the academic environment of post-secondary Engineering students, i.e., high stress
and low support, provides us with an opportunity to examine factors that may
contribute to better well-being in students.
This dissertation consists of a series of two studies. In Study 1, the focus was
on linking the negative achievement emotion hopelessness and FTP Connectedness to
diurnal cortisol slopes surrounding a mid-term exam in university Engineering
students. Firstly, I examined exam effects on diurnal cortisol slopes by comparing the
diurnal slope differences between the week before a mid-term and the week during a
mid-term in a sample of college engineering students (see Table 1 for timeline). From
self-reported surveys obtained the week prior to the mid-term, I examined Learning-
related Hopelessness, and its role as a risk factor for having flatter diurnal cortisol
patterns as mid-term approaches, i.e., comparing diurnal patterns a week before
13
(Wave 1) and the week during mid-term examinations (Wave 2). I also examined FTP
Connectedness as a protective factor in buffering the potential adverse effects that the
mid-term exam could have on students’ diurnal cortisol patterns, i.e., whether FTP
Connectedness relates to more fluctuation in diurnal cortisol patterns to cope with
exam stress.
In Study 2, the focus was on exploring the roles of emotion regulation and social
support in conjunction with FTP Value in predicting diurnal cortisol pattern change
over time (see Table 2 for timeline). Valuing a future goal in itself may not be sufficient
in goal pursuit or academic success. The striving that one undergoes in order to reach a
future goal, however, is essential for goal attainment. For students to continuously move
toward their future goals, it is crucial to have regulatory resources to maintain their
emotional and physical well-being. Therefore, I posited that regulatory factors would
also play a role in predicting students’ well-being in conjunction with FTP Value.
Emotion regulation has been found to predict academic achievement in youth samples
(Liew, 2012), and has been associated with lower momentary cortisol levels in an
adolescent sample under a social-evaluative threat task (Oldehinkel, Hartman,
Nederhof, Riese, & Ormel, 2011).
Moreover, perceived instructor affective support in college positively predicted
students’ course-related enjoyment, and negatively predicted course-related
hopelessness, which in turn resulted in higher academic motivation (Sakiz, 2012).
Social support (from teachers, friends, and parents) in a youth sample predicted positive
attitudes toward and higher sense of perceived ability on math and science subjects
14
(Rice et al., 2013). In line with Control Value Theory, it is plausible that both emotion
regulation and social support could provide students with more subjective control over
their academic tasks, thus contributing to their emotional experience and physiological
well-being. As these regulatory resources may influence students’ experiences through
a more prolonged period of time, it made sense to link them with diurnal cortisol slope
change over time. Although the above findings did not pertain to direct predictions in
students’ diurnal cortisol slopes, it is plausible that both emotion regulation and social
support could provide multiplicative value jointly with FTP Value in predicting
students’ well-being over time.
For Study 2, I examined diurnal cortisol patterns (CAR & DS) at three time
points over the course of a semester in a sample of post-secondary engineering
students (including both upper-class undergraduate students and graduate students in
the Engineering program); and I examined the moderating roles of emotion regulation
and social support in predicting FTP Value to diurnal cortisol slope change over the
three time points: beginning of semester, mid-term/major presentation week, and
recovery phase.
In sum, this dissertation provides grounding for theory integration and
expansion, and offers a framework for understanding university students’ well-being
within the academic context via diurnal cortisol assessments. It takes into account the
temporal aspects of emotions and motivation, as well as motivational and socio-
emotional regulatory factors to understand correlates of health and well-being in
students of post-secondary education.
15
Study 1: Future time perspective, hopelessness, and physiological stress
dysregulation indicated by diurnal cortisol patterns in college Engineering
students
Although attending college is an important steppingstone for preparing for the
workforce, the process of completing one’s college degree may be overwhelming at
times (Bland, Welle, Melton, & Bigham, 2012). College students’ mental and
physical health and stamina are important for them to get through challenging
academic environments. An indicator for physiological stress regulation is the diurnal
cortisol pattern, which has been found to be associated with well-being (e.g.,
Dmitrieva, Almeida, Dmitrieva, & Pieper, 2013). Salivary cortisol is easy to obtain
and non-intrusive, making it a convenient biomarker for stress and health (Doane,
Chen, Sladek, van Lanten, & Granger, 2015). In the past several years, literature on
the toll that continuous stress can play on one’s well-being has been well established
(e.g., Kemeny, 2009). As educators, there is a need for us to understand the effects of
stressors in academic settings and the possible moderators of that stress to pinpoint
antecedents that may help enhance the well-being of students. There has been an
exploration of emotions within the educational context; for example, Control Value
Theory describes the antecedents and multi-faceted nature of emotions in the
academic context (Pekrun, 2006). Physiological associations with specific emotions in
the learning context, although posited in the theory, have not been examined much
(Spangler et al., 2002). The current study investigates students’ physiological stress
manifestations during their mid-term examination week by examining their diurnal
16
cortisol patterns; the study also assesses motivational and emotional factors that may
contribute to differences in students’ physiological stress manifestation.
Diurnal Cortisol Patterns
Cortisol, a stress hormone, has received attention from psychological
researchers because of its regulatory role in the central nervous system, the metabolic
system, and the human immune system (Kemeny, 2009; Miller, Chen, & Zhou, 2007).
Cortisol levels in the blood stream follow a diurnal rhythm —morning levels are
highest (peaking at 30-minutes upon awakening, know as the cortisol awakening
response, CAR), and gradually decline throughout the day (the recovery phase, known
as the diurnal slope, DS). This daily rhythm is the so-called diurnal cortisol pattern.
Under acute stressful situations, momentary cortisol levels typically increase allowing
the body to allocate resources to cope with the stressor (e.g., Dickerson & Kemeny,
2004; Lovell, Moss, & Wetherell, 2011). However, excess amounts of cortisol from
repeated stress exposure may send negative feedback signals to the brain, causing a
down-regulation in cortisol secretion, which has been termed hyporeactivity (e.g.,
Hankin, Badanes, Abela, & Watamura, 2010) or hypocortisolism (Gunnar &
Vazquez, 2001; Heim, Ehlert, & Hellhammer, 2000). Chronic elevations in cortisol
levels, may eventually cause dysregulation in the diurnal rhythm, i.e., the diurnal
cortisol slope becomes flatter (e.g., Dmitrieva et al., 2013; Doane et al., 2015; Karb et
al., 2012). A flatter diurnal cortisol slope, which implies a less profound boost of
cortisol in the morning and lack of reduction in cortisol over the day, has been
associated with lower well-being, including trait loneliness (Doane & Adam, 2010),
17
negative affectivity (Hoyt, Craske, Mineka, & Adam, 2015), depressive symptoms
and anxiety (Pössel, Mitchell, Sjögren, & Kristenson, 2015, Saridjan et al., 2014), and
suppressed immunity (Sephton et al., 2013). Given the negative mental and
physiological consequences associated with flattened diurnal cortisol slopes, it is of
interest to unravel potential risk factors and buffering factors to enhance students’
well-being when faced with adverse or stressful academic situations.
Biomarkers provide researchers with a valuable tool for understanding the
physiological manifestations of stress, arousal, and well-being. These tools, however,
have not yet provided us with insight into the particular emotional experiences of
students within the academic setting, nor do they incorporate motivational correlates
into the picture. Cortisol has been examined on different temporal levels, such as with
regards to trait characteristics (e.g., trait loneliness predicting diurnal cortisol slopes),
daily variations (e.g., loneliness of previous day predicting day-of cortisol awakening
response), as well as momentary predictions (e.g., momentary loneliness predicting
cortisol level; Doane & Adam, 2010).
The current study examined students’ well-being with respect to the
occurrence of a mid-term. As students may anticipate the mid-term days, or even
weeks, before the exam occurs, it was reasonable to posit that the mid-term
examination of a specific course would have an effect on students’ physiological
stress regulation over longer time frames, indicated by the cortisol parameters with a
longer temporal implication, i.e., diurnal cortisol patterns (DS and CAR), instead of
momentary pre-test or post-test cortisol levels. Notably, the current study examined
18
diurnal cortisol samples during the week before the mid-term exams (Wave 1) and the
week during mid-term exams (Wave 2). Given that the mid-term is a stressful event, I
posited that in general students would have a flatter DS and smaller CAR during
Wave 2 compared to Wave 1. However, it is important to acknowledge that there
could be individual differences in terms of diurnal cortisol patterns between waves;
specifically, students who are low in psycho-social resources may have consistently
flatter diurnal cortisol patterns across the two waves, signifying allostatic saturation
and the inability for the body to respond to the stressful event. I posited that these
individual differences in diurnal cortisol patterns could be predicted by correlates in
the academic setting such as Learning-related Hopelessness specific to the class of
said mid-term examination and students’ future time perspective. As there were
multiple factors that could influence the daily levels and fluctuation of cortisol
secretion, such as differences in sleep duration, cigarette use, and medication use,
these factors were proposed to be included as covariates to adjust for potential
confounding effects they may have on the diurnal cortisol patterns (Dmitrieva et al.,
2013; Granger et al., 2009; Mrug, Tyson, Turan, & Granger, 2015).
Hopelessness as a Risk Factor
Hopelessness specific to the academic setting is an under-studied emotion
(Frenzel et al., 2007). Hopelessness, specific to the academic setting, is a negative
prospective emotion, and has been linked to the anticipation of academic failure
instead of success (Pekrun, 2006). For example, a student who reported more
Learning-related Hopelessness (LHL) could feel helpless, less confident, more
19
resigned about a specific course, and would feel that they are unable to cope with
specific class challenges. Importantly, the deactivating nature of LHL could be
associated with physiological dysregulation in face of a challenge or stressful event,
making a student unable to boost up required resources upon demand.
Although LHL is an understudied emotion, the antecedents and effects of
general hopelessness are well established. Antecedents of general hopelessness for
undergraduate students include perfectionism, poor problem-solving skills, and
emotion dysregulation (O’Connor & O’Connor, 2003; Pössel et al., 2015; Rice,
Leever, Christopher, & Porter, 2006; Vatan, Lester, & Gunn, 2014). The feeling of
hopelessness has been associated with students’ decreased learning, disengagement in
schooling, negative well-being, such as depression, poorer physical health, and even
suicidality in college (e.g., Au, Watkins, & Hattie, 2010; Fellner-Rosenberg, 1989;
McCarthy, 1992; Range & Penton, 1994). Clearly general hopelessness is negatively
related to well-being. One question that still needs to be addressed is the possible
magnitude of the effect of contextually specific LHL on students’ wellbeing.
Although the student may feel masterful in other domains in life, I argued that
LHL may undermine one’s well-being due to events of a specific class (e.g.,
becoming more vulnerable to illness around an exam). As important as this emotion
may be to students, few researchers explored LHL as a risk factor for well-being in
academic settings (e.g., Burić, & Sorić, 2012; van Santen et al., 2011), specifically in
post-secondary university students.
20
Future Time Perspective as a Protective Factor
In contrast to the prospective negative emotion Learning-related Hopelessness,
it is reasonable to expect that students’ mental representations of their long-term
personal futures may help release negative anticipations upon challenging life events.
Future time perspective (FTP) is the study of one’s perceptions of the future.
Specifically, FTP can be understood in the goal-setting and planning context. The
longer or deeper one’s FTP, the further into the future one’s time perspective is
extended, and the greater the number of goals one will possess (Simons,
Vansteenkiste, Lens, & Lacante, 2004). Under the cognitive-motivational construct of
FTP, four sub-dimensions have been found, including Valence, Connectedness,
Extension, and Speed (Husman & Shell, 2008). Of the four FTP subscales, FTP
Connectedness (FTPC) denotes the cognitive ability one has to make connections
between present activities and future goals; those with high FTPC would have a
general feeling of connectedness to and plan-fullness about the future.
FTPC has been found to predict students’ achievement in post-secondary
educational settings (Shell & Husman, 2001). Most literature in motivational research
suggests that intrinsic motivation is what makes tasks at hand enjoyable, whereas
utility value, which denotes how a task at hand is fits into one’s future plans (e.g.,
taking a class to fulfill degree requirement) has been linked with external motivation
(Wigfield & Eccles, 2000). This line of motivational research suggests that intrinsic
motivation supports students’ positive psychological well-being (Ryan & Deci, 1985).
However, in future-oriented motivation research, it is found that FTP Connectedness
21
enables and individual to bring meaning to current academic tasks by connecting the
present with the future (e.g., studying hard to pass an exam to graduate from the
program and become an engineer). It is argued that such connectedness from the
present to future goals enables one to experience intrinsic motivation for a current
task, and in turn have positive emotional experiences from said task (Husman,
Derryberry, Crowson, & Lomax, 2004). In past studies it has been found that
individuals who are depressed and hopeless have an unrealistically negative attitude
towards their future (Beck, Weissman, Lester, & Trexler, 1974); research also shows
that individuals who are more hopeless tend to have greater gaps between their actual
quality of life and their future (aspired) quality of life, indicating poor present well-
being (Moore, Höfer, McGee, & Ring, 2005). It is plausible that FTPC could allow
individuals to ruminate less on present negativity and divert more mental or physical
resources on future goals, which could potentially lead to better well-being. The
current study examined how FTPC, one’s ability to make meaning of present
academic tasks with future goals in mind, played a role in protecting students’ well-
being from stressful academic events, such as mid-term examinations.
Theoretical Framework
Control Value Theory posits that academic achievement emotions are those
that are aroused due to achievement-related activities (Pekrun, 2006). Achievement
emotions can be described in two dimensions, i.e., valence (positive vs. negative,
pleasant vs. unpleasant), and activation (activating vs. deactivating, such as exuberant
vs. relaxed), and hopelessness is a negative deactivating emotion that has been found
22
to be associated with performance-avoidant goals (Pekrun & Perry, 2014).
Hopelessness has been identified as a prospective emotion based on expectations of
failure. In other words, it is anticipated that there be will a negative outcome, and
subjective control over this outcome is low (Pekrun, 2006). Hopelessness comes from
a cognitive focus on the non-attainability of success or the inevitability of failure
(Pekrun, Frenzel, Goetz, & Perry, 2007). Such emotional experience could be quite
frustrating for students, and certainly is not beneficial for students’ well-being. The
focus of achievement-related emotional research, however, has been mostly on
academic anxiety. Few studies have incorporated academic-specific hopelessness into
investigation with regards to academic stress.
In addition, according to Control Value Theory (Pekrun, 2006), achievement
emotions can be accounted for by multiple second-order facets—including the
affective, motivational, physiological, and cognitive facets. Notably, although
academic achievement emotions include the facet of physiological response, few
studies examined physiological markers in relation to self-reported achievement
emotions. In adult samples, a meta-analysis showed that emotions were predictive of
cortisol responses to social evaluative threat in experimental settings; specifically,
surprise, worry, and fear positively predicted cortisol levels in adults (Denson,
Spanovic, & Miller, 2009). In the rare event of investigating associations between
biomarkers and test-related emotions surrounding an actual test-taking event in
university students, researchers found that high trait anxiety was associated with
elevated cortisol levels following the exam, and low trait anxiety was associated with
23
decrease in cortisol after the exam (e.g., Spangler et al., 2002). Although different
from hopelessness, research on anxiety informs us that academic-specific negative
emotion does have associations with physiological stress responses. The hormonal
underpinnings of negative deactivating emotions such as Learning-related
Hopelessness, however, are yet to be explored. Given that Learning-related
Hopelessness (LHL) is anticipatory in nature and could be associated with more
prolonged physiological effects, albeit its academic specific nature, I posit that
Learning-related Hopelessness would be associated with diurnal cortisol patterns
surrounding an examination, which is indicative of a longer temporal effect, instead of
around the traditionally experimentally investigated momentary cortisol levels
collected right before, during, and after experimental stress tasks or examination
events. Specifically, given that general hopelessness has been often associated with
one’s poor well-being, it would be reasonable to suspect that LHL would be
predictive of a flatter DS and a smaller CAR, and less fluctuation in diurnal cortisol
patterns in face of stress, which indicates negative well-being due to stress
dysregulation.
Moreover, Control Value Theory may provide insight into pinpointing paths to
prevent the drastic downstream effects of academic stress. Control Value Theory is an
integrated framework built upon the expectancy-value theory (Vroom, 1964), theories
of attribution in achievement (Weiner, 1985), theories on perceived control (Perry,
1991), etc. The framework provides theoretical support for and empirical foundations
for the motivational facet of emotional experiences (e.g., Pekrun, Goetz, Frenzel,
24
Barchfeld, & Perry, 2011). In particular, Control Value Theory suggests that
achievement emotions are influenced by appraisal antecedents of the students,
including subjective control over achievement activities, as well as subjective
outcome values of these activities.
Research in future time perspective (FTP), one’s ability to consider the future,
shows consistency with control-value theory. FTP been found to be important in
enhancing learning experiences for university students (Husman & Shell, 2008;
Kauffman & Husman, 2004; Shell & Husman, 2001). Specifically, FTP
Connectedness has been found to predict endogenous perceptions of instrumentality,
one’s perception of how gaining competence in a current task can help reach long-
term future goals (Hilpert et al., 2012). Endogenous perceptions of instrumentality
was found to be supportive of intrinsic motivation, which may in turn increase
students’ positive emotions towards learning (Husman et al., 2004). I therefore
suspect that students’ future orientation, specifically FTPC, may play a crucial role as
an appraisal antecedent, protecting students against academic adversity, enhancing
students’ well-being, and buffering the physiological stress responses surrounding
students’ mid-term examination in post-secondary educational settings. As FTPC is a
general cognitive-motivational tendency (I used a domain-general FTP measure; c.f.
Hilpert et al., 2012) which is associated with long-term goal pursuits instead of
momentary state affects, I expected to see FTPC’s association with students’ well-
being as represented by diurnal cortisol patterns.
25
The Current Study
The aims of the current study included 1) to examine the mid-term
examination effects for college students, i.e., the difference in diurnal cortisol a week
before the exam (Wave 1), and the week during mid-term examination (Wave 2); 2)
to examine Learning-related Hopelessness (LHL) as a risk factor in predicting exam
effects for diurnal cortisol slopes (DS) and cortisol awakening responses (CAR)
surrounding college students’ mid-term; 3) to examine FTPC as a protective factor in
predicting exam effects for DS and CAR surrounding college students’ mid-term.
Specifically, I hypothesized that Ha) there will be an overall exam-stress effect,
namely, students in general will show a steeper DS and larger CAR at Wave 1 (week
before mid-terms), and a flatter DS and smaller CAR at Wave 2 (day immediately
before mid-term), as an indication of the stressful experience that mid-term
examinations are for Engineering college students. Hb) students will vary in terms of
physiological stress manifestations: specifically, I hypothesized that some students
will have healthy patterns of diurnal cortisol (steep DS, large CAR) for both waves
(Healthy group); some students will have lower well-being at Wave 2 as an adaptive
response (a flatter DS and smaller CAR during Wave 2) to the mid-term exam stress
(Exam-stress group); whereas some students with flatter DS and smaller CAR at
Wave 1 will experience a non-response at Wave 2 (flat DS and small CAR for both
waves) indicating poor well-being over time (Dysregulated group). Hc1) Students with
more LHL will have low DS and CAR and less fluctuation in diurnal cortisol patterns
between the two waves indicating poor adaptation and stress dysregulation (predictive
26
of Dysregulated group). Hc2) FTPC would predict a steeper DS for both waves, or
more fluctuation (from steep to flat) as an indicator of well-being or adaptive stress
regulation before and during the week of exam (predictive of Health group & Exam-
stress group).
The current study was innovative not only by allowing us to understand
physiological correlates for hopelessness in post-secondary education, but also in that
I examined students’ hopelessness in the academic, domain-specific context (i.e.,
Learning-related Hopelessness), instead of using traditionally constructed general
hopelessness (such as the Beck Hopelessness Scale, e.g., Fellner-Rosenberg, 1989;
Pompili et al., 2013) which has been under-examined in research that typically
incorporates biomarkers into well-being investigation, such as in developmental
psychology and social psychology research. More importantly, the current study
weaves FTP theory with Control Value Theory, in suggesting FTPC as an appraisal
antecedent construct in predicting the physiological correlates of academic-related
emotions. I proposed that the current study would contribute theoretically to current
literature, and that findings would be beneficial for educators and educational
researchers to identify potential pathways of enhancing college students’ well-being.
Methods
Participants
Data were collected from two sections of a required engineering course. This
course, Circuits, is one of the more challenging courses electrical engineering students
take during their sophomore year. Among the sampled class sections, a total of
27
seventy-one students consented to participate in the survey part of the study, of which
sixty students consented to participate in the saliva collection part of the study. The
mean age of the sample was 21.31 years (SD = 2.95), and approximately 27% were
female. In terms of race/ethnicity, there were approximately 52% White, 13% Asian,
13% Hispanic, 3% Black, and 8% mixed-race participants. Sixty students of all
seventy-one participants provided valid surveys; for Wave 1 (week before mid-term),
forty-eight participants provided valid saliva samples, and for Wave 2 (week of mid-
term), forty-four participants completed the diurnal samples over the two waves of the
study.
Procedures
All procedures were approved by the university institutional review board
prior to data collection. Data collection for the current study spanned two consecutive
weeks for each class. During Wave 1 participants consented, filled out the first online
survey, and provided baseline diurnal salivary samples for two consecutive days
(upon-awakening, 30-minutes after awakening, before lunch, before bed-time, with a
total of 8 tubes). Wave 2 was the students’ mid-term examination week, and
participants provided their second set of diurnal samples for two consecutive days
(another 8 tubes) prior to their exam day. For both sets of diurnal saliva collection,
participants were provided collection packets with detailed instructions about how to
collect and store their sample tubes, as well as daily checksheets to record what they
have consumed (high sugar, high sour contents, drugs/medicine, etc.), and whether or
not they have experienced stressful events prior to sample collection.
28
Diurnal Cortisol Sampling. Procedures regarding saliva collection
specifically followed rules written by the Institution of Interdisciplinary Salivary
Bioscience Research (IISBR) at Arizona State University led by Dr. Douglas Granger.
The suggested protocol of sample collection included rinsing the mount with water 10
minutes prior to collection, and to complete the checksheet items (including time of
collection, medications, sleep time and sleep duration etc.) associated with each
sample, to document if they had dairy, acidic or high sugar-content foods 20 minutes
prior to sample collection, and report if they were ill or have oral health problems etc.
Students were instructed to refrigerate or freeze their diurnal saliva samples
immediately after collections, and put them in an ice-packet during transportation.
The saliva samples were kept frozen in our research lab for less than two weeks
before all samples were received and organized in grid boxes, and transported in an
ice-chest to the IISBR at ASU and were stored in freezers prior to being assayed for
cortisol (µg/dL); each sample was assayed for duplicates for assay reliability. The
level of cortisol for each time point of each wave was an average between the two
consecutive days of sample collection in each wave. Outliers were windsorized at
1.81 µg/dL for data analysis (equivalent to 50nmol/L; Nicolson, 2008).
Measures
Academic achievement emotions. Students completed self-reports on the
Achievement Emotions Questionnaire (AEQ). The AEQ includes 53 learning-related
emotions items, of which 11 items were on Learning-related Hopelessness (Pekrun et
al., 2011). Sample items include “I’m resigned to the fact that I don’t have the
29
capacity to master this material”, and “My hopelessness undermines all my energy”;
items were situated before, during, and after studying/learning (Cronbach’s a = .64;
5-point Likert scale from 1 = Strongly disagree to 5 = Strongly agree). The AEQ was
surveyed at Wave 1, day 1. The Learning-related Hopelessness (LHL) composite was
calculated by averaging the scores across the 11 items.
Future time perspective – Connectedness. Students completed self-reports
on their Future Time Perspective – Connectedness subscale using the Future Time
Perspective Scale (Husman & Shell, 2008). The Future Time Perspective scale
Connectedness subscale (FTPC) includes 11 items (Cronbach’s a = .88; 5-point
Likert scale, from 1 = Strongly disagree to 5 = Strongly agree), such as, “One should
be taking steps today to help realize future goals.”
Diurnal cortisol patterns. Mean cortisol levels of the two consecutive days
for each wave were computed to create T1, T2, and T3 cortisol levels for each wave.
Log transformations were performed for each time point before any calculation for
indicators occurs if the data is positively skewed. Three samples, i.e., upon awakening
(T1), 30-minute after awakening (T2), and before bed-time samples (T3) were used to
create the diurnal cortisol slope (DS) and the cortisol awakening response (CAR) for
each wave. The before lunch time sample was excluded from the diurnal cortisol
pattern analysis, for two reasons, one being that students’ lunch times were extremely
variable, second being that common practices for diurnal pattern calculation does not
require this time point to be included for calculation.
30
DS was calculated by subtracting the before bedtime sample (T3) from the
morning awakening sample (T1) after both are log transformed, and dividing this
deviation by awake hours (DeSantis, Adam, Hawkley, Kudielka, & Cacioppo, 2015).
The two morning samples were used to calculate the cortisol awakening response
(CAR) for each wave. CAR was calculated by subtracting wake level T1 from peak
level T2, also after both are log transformed.
Covariates. Gender and race/ethnicity were included as covariates, as they
have been found to be associated with diurnal cortisol patterns (e.g., DeSantis et al.,
2015). From checksheet data, I included sleep duration as a covariate, and
dichotomized variables cigarette use and medication use of any of the following six
types of prescription and over-the-counter medicines that have been shown to
influence cortisol levels: steroid inhalers, other types of steroid medications,
medications or creams containing cortisone, birth control pills, and anti-depressant or
anti-anxiety medications (Dmitrieva et al., 2013; Granger et al., 2009), and included
them as covariates.
Plan of Analysis
Descriptive statistics and bivariate correlations were performed in SPSS,
including means, standard deviations, and zero-order bivariate correlations on
Learning-related Hopelessness, FTPC, and diurnal cortisol levels. First, I used
repeated measures ANCOVA to examine exam-stress effects between the two waves
of diurnal cortisol patterns for both DS and CAR (regardless of grouping but taking
into account the covariates). This step was meant to test whether there are general
31
trends in students’ physiological responses to the mid-term exam. Next, I used
regression models to examine relations between Wave 1 variables, and predictions
from Wave 1 LHL and FTPC to DS and CAR patterns (comparing the groups) across
the waves. I examined my hypotheses using the following analysis:
I examined Ha) there will be an overall exam-stress effect, namely, students in
general will show a steeper DS and larger CAR at Wave 1 (week before mid-terms),
and a flatter DS and smaller CAR at Wave 2 (day immediately before mid-term), as
an indication of the stressful experience that mid-term examinations are for
Engineering college students by using repeated measures one-way ANCOVA
between Wave 1 and Wave 2 data for both DS and CAR; covariates (e.g., sleep hours)
was included in the model. This provided support for the exam-stress effects the mid-
term has on students’ physiological stress regulation. Large negative values from
contrasting Wave 2 diurnal cortisol patterns to Wave 1 diurnal cortisol patterns would
be able to support this hypothesis, indicating flattened diurnal cortisol patterns.
Hypothesis Hb) students will vary in terms of physiological stress
manifestations: specifically, some students will have healthy patterns of diurnal
cortisol (steep DS, large CAR) for both waves (Healthy group); some students will
have lower well-being at Wave 2 as an adaptive response (a flatter DS and smaller
CAR during Wave 2) to the mid-term exam stress (Exam-stress group); whereas some
students with flatter DS and smaller CAR at Wave 1 will experience a non-response at
Wave 2 (flat DS and small CAR for both waves) indicating poor well-being over time
(Dysregulated group) was examined by assigning groups via investigating the diurnal
32
cortisol pattern change in each student. I proposed to form groups using the following
criteria: one standard deviation above the mean as high, one standard deviation below
the mean as low, and between these two points as medium. Students who showed
high-high patterns of diurnal cortisol (DS and/or CAR) for both waves would be
assigned to the Healthy group. Students who showed a flattening effect of diurnal
cortisol patterns from Wave 1 to Wave 2 (for example high-medium, high-low, or
medium-low) would be assigned to the Exam-stress group. Students who showed flat
diurnal cortisol patterns for both waves (low-low DS and/or CAR) would be assigned
to the Dysregulated group. It was possible that there would be students who would
not fit into any of the three groups, for example those who showed a steeper diurnal
cortisol pattern at Wave 2 (e.g., medium-high, low-medium); I proposed to further
investigate whether or not, and how, they would be incorporated in the analysis.
I examined Hc1) Students with more LHL at Wave 1 will have low DS and CAR
and less fluctuation in diurnal cortisol patterns between the two waves indicating
poor adaptation and stress dysregulation (predictive of Dysregulated group) by using
multinomial logistic regression models to predict group status for DS and CAR
patterns as the dependent variables (the Healthy group, Exam-stress group, and
Dysregulated group). The independent variable was LHL at Wave 1. Covariates such
as gender, race/ethnicity, cigarette use, medicine use, and sleep hours were proposed
to be included in the model. The proposed criteria to support this hypothesis was that
odds ratio of LHL for the Dysregulated group compared to the Healthy and Exam-
stress group should be greater than 1, indicating increased probability for more
33
Hopelessness in the Dysregulated group, which would be supportive of LHL being a
risk factor for well-being.
I examined Hc2) FTPC would predict a steeper DS for both waves, or more
fluctuation (from steep to flat) as an indicator of well-being or adaptive stress
regulation before and during the week of exam (predictive of Healthy group & Exam-
stress group) by using multinomial logistic regression models to predict group status
for DS and CAR patterns as the dependent variables (the three groups would be
dummy coded). The independent variable was FTPC at Wave 1. Covariates such as
gender, race/ethnicity, cigarette use, medicine use, and sleep hours were proposed to
be included in the model. The proposed criteria to support this hypothesis was that
odds ratio of FTPC for the Healthy and Exam-stress group compared to the
Dysregulated group should be greater than 1, indicating the probability for more
future time perspective (Connectedness) in the Healthy group and Exam-stress group
compared to the Dysregulated group, which would be supportive of FTPC being a
protective factor for well-being.
Results
Participant Demographics
A total of 71 students enrolled in Study 1, and out of these participants, 60
completed their surveys. Out of all the participants who completed surveys for Study
1 (N = 60), 72% were male students (n = 41) and 28% were female students (n = 16);
with regards to race/ethnicity, 2% were American Indian, 15% were Asian, 15% were
Hispanic, 3% were Black, 53% were White, 0% were Pacific Islanders, and 8% were
34
of mixed racial background. Three students out of the 60 participants had missing
gender data (5%), and two had missing race/ethnicity data (3%). The participants had
a mean age of 21.36 years (SD = 2.95).
Attrition analysis. Of the 60 participants who completed their survey data, 23
students attrited between survey collection and Wave 1 cortisol collection (a total of
46 students participated in Wave 1 cortisol collection); another six students attrited
between Wave 1 and Wave 2 data collection (a total of 40 students participated in
both Wave 1 and Wave 2 cortisol collection). Table 1 shows participants’
demographic information with regards to study participation and attrition over time,
comparing those who completed survey data, participated in Wave 1 cortisol
collection, and participated in Wave 2 cortisol collection. According to cross
tabulation analysis and t-test results performed in SPSS v.22, no significant
association between attrition over time and gender or age was found. However, using
cross tabulation, Pearson Chi-square results showed that if the race/ethnicity variable
was recoded, to avoid low cell count, into White vs. Minority, there was a significant
association between attrition and minority status, c2(2, N = 58) = 6.19 (p = .045),
indicating that attrition was significantly higher in ethnic minorities. Notably,
recoding race/ethnicity into Under-represented Minority vs. Others, with Under-
represented Minority consisting of American Indian, Hispanic, Black, and Mixed
Race groups, the association between attrition over time and Under-represented
Minority status was also significant (c2(2, N = 58) = 7.46, p = .024). When examining the
attrition from Wave 1 cortisol collection to Wave 2 cortisol collection, gender and age
35
again showed no significant association with attrition. Both minority status coding
systems were found to be significantly associated with attrition between waves, i.e.,
White vs. Minority (c2(1, N = 44) = 5.17, p = .023) and Under-represented Minority vs.
Others (c2(1, N = 44) = 6.43, p = .011), were found to be significantly associated with
between-wave attrition.
Covariate Data
Participants reported to have slept for an average of 7.93 hours (SD = 1.34;
range = 4.87 to 10.50) during the nights before two consecutive days of Wave 1
cortisol collection, and slept for an average of 7.93 (SD = 1.81; range = 4.50 to 12.50)
during the nights before two consecutive days of Wave 2 cortisol collection. Check-
sheet data from the diurnal cortisol saliva kits indicated that during Wave 1, 25
students reported to have experienced a stressful event within the 24 hours prior to
their saliva sample collection; three students reported smoking within 12 hours of
saliva collection; and 20 students reported have taken medication (a dichotomized
variable for intake of allergies medication, pain killers, contraceptives, medication for
a chronic health concern, or other) within 24 hours of saliva collection. During Wave
2, 22 students reported to have experienced a stressful event within the 24 hours prior
to their saliva sample collection; one student reported smoking within 12 hours of
saliva collection; and 13 students reported have taken medication within 24 hours of
saliva collection.
36
Preliminary Analysis
Raw cortisol data were examined, and one participant had an outlier data point
great than 1.81 µg/dL (equivalent to 50 nmol/L, approximately the highest non-
stimulated salivary cortisol level for healthy subjects; Nicolson, 2008) at 30-minutes
upon wakening during Wave 1 Day 2 which was windsorized at 1.81µg/dL. All other
cortisol data were within the bounds of 1.81 µg/dL. One case was excluded from
cortisol data analysis due to staying up all night during both Wave 1 and Wave 2 data
collection.
After the exclusion, 45 participants had cortisol data for Wave 1, and 39
participants had cortisol data for Wave 2. For Wave 1 data collection, one participant
only submitted their Day 1 samples. During Wave 2 data collection, for Wake level
cortisol (samples collected upon awakening), two participants only submitted their
Day 1 samples, and two participants only submitted their Day 2 samples; for Peak
level cortisol (collected 30-minutes upon awakening), one participant only submitted
their Day 1 sample, and two participants only submitted their Day 2 samples; for
Bedtime cortisol, two participants only submitted Day 2 samples (Table 2).
The cortisol values were then averaged between the two consecutive days at
each time point for each wave. As noted, some participants were missing one or both
days of cortisol samples, however, one day of missingness was allowed for the
averaged cortisol levels at each time point to maximize retention of cortisol data (see
Table 2).
37
Descriptive statistical analysis (Table 3) indicated that there were excess
skewness and kurtosis in the mean cortisol values (skewness range = -.03 to 5.07;
kurtosis range = -1.04 to 28.55) therefore the mean cortisol values were log-
transformed to approximate normality. For each wave, a composite to represent the
diurnal cortisol slope (DS) was then calculated by subtracting mean bedtime cortisol
(Bed) from mean awakening cortisol (Wake) and dividing the score by awake hours
for each participant; a composite to represent the cortisol awakening response (CAR)
was calculated by subtracting mean awakening cortisol from mean 30-minute upon
awakening cortisol (Peak) for each wave (see Table 4).
Bivariate correlations between the diurnal cortisol parameters were examined
(Table 5). Results showed that Wave 1 DS and Wave 2 DS were significantly
positively correlated (r = .59, p < .001), Wave 1 DS and Wave 1 CAR were
significantly negatively correlated (r = -.45, p < .01), and Wave 1 CAR and Wave 2
CAR were significantly positively correlated (r = .74, p < .001). As a preliminary
examination with regard to diurnal cortisol parameter’s relation with Study 1 main
predictors, Wave 1 DS was significantly negatively correlated with Learning-related
Hopelessness (r = -.33, p < .05); and Wave 2 CAR was marginally negatively
correlated with Future Time Perspective Connectedness (r = -.28, p < .10).
Gender differences for mean-level cortisol and diurnal cortisol parameters
were also examined (Table 6). Results showed that there were no significant
differences between males and females with regards to mean-level cortisol. A
marginally significant difference in Wave 1 DS was found between males (M = .11,
38
SD = .07) and females (M = .07, SD = .04), with male students having higher DS at
Wave 1 than their female counterparts (t = 1.74, p < .10). The effect size for this
analysis (d = .70) was found to exceed Cohen’s (1988) convention for a medium
effect size (d = .50). There were no significant gender differences in all other diurnal
cortisol parameters, though notably effect sizes for DS at Wave 1 (d = .61) and CAR
at Wave 1 (d = .56) also exceeded the convention for a medium effect size (d = .50);
and effect size for CAR at Wave 2 (d = .49) approached the medium effect size.
Minority status differences for mean-level cortisol and diurnal cortisol
parameters were also examined (Table 7). Results showed that a significant difference
was found in Wave 1 Wake level cortisol, between Minorities including American
Indian, Asian, Hispanic, Black, Mixed Race students (M = -1.29, SD = .44) and White
students (M = -.94, SD = .42), with Minorities having a significant lower mean Wake
level cortisol (log-transformed) than their White peers (t = 2.61, p < .05). The effect
size for this analysis (d = .81) exceeded Cohen’s (1988) convention for a large effect
size (d = .80). Wave 1 CAR was found to be significantly higher in Minorities (M
= .63, SD = .62) and White (M = .22, SD = .43), with Minority students having higher
CAR at Wave 1 than their White peers (t =-2.51, p < .05). The effect size for this
analysis (d = .77) exceeded Cohen’s (1988) convention for a medium effect size (d
= .50). Statistically significant differences (t-tests) were not found when the minority
status included Underrepresented Minorities only. However, effect sizes comparing
Underrepresented Minorities vs. Others for log-transformed Wave 1 Wake level
cortisol (d = .56), Wave 1 Bedtime cortisol (d = .59), Wave 2 Bedtime cortisol (d
39
= .53), and Wave 1 CAR (d = .52) exceeded Cohen’s convention for a medium effect
size (d = .50).
Missing Data Analysis
For Wave 1 cortisol, 14 participants out of the total valid participants (N = 59)
had missing data on both days of data collection (23.7%). For Wave 2 cortisol, 20
participants out of the total valid participants had missing data on both days of data
collection (33.9%).
Using logistic regression, it was found that Minority status (all racial/ethnic
minorities) significantly predicted missingness in Wave 2 DS (χ2(1, N = 57) = 4.815, p
= .028), explaining 10.9% (Nagelkerke R2) of the variance in Wave 2 DS missingness
and correctly classifying 64.9% of cases. White students were 3.33 times more likely
to have data for Wave 2 DS than their Minority peers (B = 1.20, SE = .56, p = .032).
Minority status also significantly predicted missingness in Wave 2 CAR (χ2(1, N = 57) =
4.709, p = .030), again, explaining 10.9% (Nagelkerke R2) of the variance in Wave 2
CAR missingness and correctly classifying 64.9% of cases. White students were 3.43
times more likely to have data for Wave 2 CAR than their minority counterparts (B =
1.23, SE = .58, p = .034).
Similarly (see Figure 1), under-represented Minority status (American Indian,
Hispanic, Black, and Mixed Race) significantly predicted missingness in Wave 2 DS
(χ2(1, N = 57) = 5.071, p = .024), explaining 11.4% (Nagelkerke R2) of the variance in
Wave 2 DS missingness and correctly classifying 66.7% of cases. Under-represented
Minorities were 3.81 times more likely to exhibit missingness in Wave 2 DS than
40
their counterparts (B = 1.34, SE = .61, p = .028). Under-represented Minority status
also significantly predicted missingness in Wave 2 CAR (χ2(1, N = 57) = 5.849, p = .016),
explaining 13.4% (Nagelkerke R2) of the variance in Wave 2 CAR missingness and
correctly classifying 70.2% of cases. Under-represented Minorities were 4.29 times
more likely to exhibit missingness in Wave 2 CAR than their counterparts (B = 1.46,
SE = .61, p = .018).
Experience of stressful life events 24 hours within cortisol collection
(dichotomized variable, 0 = no events experienced, 1 = at least one event was
experienced) at Wave 1 marginally predicted missingness in Wave 2 DS (χ2(1, N = 40) =
4.968, p = .026), explaining 17.3% (Nagelkerke R2) of the variance in Wave 2 DS
missingness and correctly classifying 75.0% of cases. Those who were stressed within
24 hours of data collection during Wave 1 were 7.88 times more likely to have
missing data in DS at Wave 2 (B = 2.06, SE = 1.12, p = .064). Stressful life events,
did not significantly predict missingness in Wave 2 CAR. All other demographic
variables (gender, age) and covariates (sleep hours, smoking, and medication use) did
not significantly predict missingness in diurnal cortisol parameters.
Some Wave 1 survey variables that were outside of the substantive interest of
this project were included in missing data analysis as auxiliary variables to address
missingness, but were outside of the substantive interest of this project, such as
Learning-related Pride and Self-efficacy. Learning-related Pride marginally predicted
missingness in Wave 1 CAR (χ2(1, N = 59) = 3.802, p = .051), explaining 9.4%
(Nagelkerke R2) of the variance in Wave 1 CAR missingness and correctly classifying
41
76.3% of cases. Those who reported more Learning-related Pride in their survey
were .273 times less likely to have data for CAR at Wave 1 (B = 1.30, SE = .72, p
= .071). Self-efficacy significantly predicted missingness in Wave 2 DS (χ2(1, N = 59) =
4.674, p = .031), explaining 10.2% (Nagelkerke R2) of the variance in Wave 2 DS
missingness and correctly classifying 57.6% of cases. Those who reported more Self-
efficacy in their survey were .622 times less likely to have data for DS at Wave 2 (B =
-.48, SE = .23, p = .040). Self-efficacy marginally predicted missingness in Wave 2
CAR (χ2(1, N = 59) = 3.773, p = .057), explaining 8.6% (Nagelkerke R2) of the variance
in Wave 2 CAR missingness and correctly classifying 64.4% of cases. Those who
reported more Self-efficacy in their survey were .642 times less likely to have data for
CAR at Wave 2 (B = -.44, SE = .24, p = .064).
The above analyses on missing data suggested that further steps to address
missingness should take place for Study 1. Therefore, Full Information Maximum
Likelihood (FIML) was performed in Mplus v.7 and variables that were related to
missingness were used as auxiliary variables to adjust for missing data (Enders,
2010).
Comparing Wave 1 and Wave 2 Diurnal Cortisol Patterns
To examine hypothesis Ha) that there will be an overall exam-stress effect,
namely, students in general will show a steeper DS and larger CAR at Wave 1 (week
before mid-terms), and a flatter DS and smaller CAR at Wave 2 (day immediately
before mid-term), as an indication of the stressful experience, models mimicking t-
tests and Repeated-Measures Analysis of Covariance (RM ANCOVA) were used.
42
Typical t-tests and RM ANCOVAs were not used because of the need to address
missing data and include auxiliary variables. Models were instead estimated in Mplus
such that the diurnal cortisol parameters between Waves 1 and 2 were compared via
Wald tests, adjusting for missingness using FIML and auxiliary variables. In one set
of models, covariates were not included and differences in diurnal cortisol parameter
means were assessed with Wald tests constraining means equal over time. In another
set of models covariates were included. Diurnal cortisol parameters were predicted by
mean-centered time-invariant covariates and wave-corresponding time-variant
covariates. Differences in adjusted means across the two waves of data were assessed
with Wald tests examining differences in intercepts of the diurnal cortisol parameters.
Wald tests: Wave 1 and Wave 2 differences in DS and CAR. Wald tests
and FIML were used in Mplus to mimic t-tests in assessing the mean-level differences
between waves for both cortisol parameters DS and CAR. For DS differences
between waves, Wave 1 Learning-related Pride and Self-efficacy were entered as
Auxiliary variables; model fit was good overall, c2(1, N = 60) = .21 (p = .65), RMSEA
= .00 (95% CI: [.00, .26]), CFI = 1.00, and SRMR = .05. The Wald test with
parameter constraint of equal means for Diurnal Slopes was non-significant (c2(1, N =
60) = .79, p = .37), indicating that no significant mean-level difference was found
between the two waves of data. For CAR differences between waves, Wave 1 Self-
efficacy was entered as Auxiliary variable; model fit yielded fair to poor fit, c2(1, N = 60)
= 2.87 (p = .09), RMSEA = .18 (95% CI: [.00, .43]), CFI = .94, and SRMR = .12. The
Wald test with the parameter constraint of equal means for CAR was non-significant
43
(c2(1, N = 60) = 1.08, p = .30), indicating that no significant mean-level difference was
found between the two waves of data. See Table 8 for estimated descriptive statistics
of DS and CAR. Wave 1 DS was slightly higher than Wave 2 DS, and Wave 1 CAR
was slightly lower than CAR at W2. The bivariate correlation between Wave 1 DS
and Wave 2 DS was r = .59 (p < .001). The bivariate correlation between Wave 1
CAR and Wave 2 CAR was r = .74 (p < .001).
Wald tests: diurnal cortisol differences between waves adjusting for
covariates. Wald tests using FIML were performed in Mplus to examine differences
in adjusted means between waves for both DS and CAR, adjusting for missingness
and covariates, to mimic RM ANCOVAs. All covariates were mean centered, creating
an interpretable intercept that represented adjusted means of the outcome variables.
The adjusted means were compared via a Wald test which constrained intercepts to be
equal. To assess DS and CAR respectively, two models were run to assess the
between-wave differences.
In the first model, W1 DS and W2 DS were regressed on time-invariant
covariates Gender, Age, Minority Status, as well as corresponding time-variant
covariates Medication, Sleep Hours, Smoking, and Stressful Events (prior to saliva
sampling); Wave 1 Learning-related Pride and Self-efficacy were entered as Auxiliary
variables. Given that the full model was not identified, I had to probe a more
parsimonious model, with select covariates. As a result, in the final model for DS,
Wave 1 DS was regressed on Gender, Minority Status, W1 Sleep Hours, and W1
Smoking; Wave 2 DS was regressed on Gender, Minority Status, W2 Sleep Hours,
44
W2 Stress Events, and W2 Smoking. The model yielded fair fit, c2(6, N = 60) = 9.70 (p
= .14), RMSEA = .10 (95% CI: [.00, .21]), CFI = .87, and SRMR = .09. According to
the Wald test comparing the adjusted means (intercepts), no significant difference was
found between DS at W1 and DS at W2 (c2(1, N = 60) = .77, p = .38). Model estimates of
covariates predicting DS showed that Gender significantly predicted DS at W1, with
female students exhibiting .046 units lower in DS at W1 than their male counterparts
(p = .047). Sleep Hours at W1 marginally predicted DS at W1, with each hour
increase in sleep yielding a .012 unit increase in W1 DS (p = .075). Smoking at W1
also marginally predicted W1 DS, with smoking at Wave 1 associated with a .067-
unit decrease in DS at Wave 1 than non-smokers (p = .060). The total variance
explained for DS at W1 was 19.6% (p = .075). For Wave 2 DS, covariate model
estimates indicated that experiences of Stressful Event(s) within 24 hours of saliva
collection at W2 significantly predicted a .040-unit decrease in DS at W2 than those
who did not experience a Stressful Event (p = .024). The total variance explained for
DS at W2 was 25.1% (p = .038). All other covariates did not significantly predict DS
at W1 or W2.
In the second model, W1 CAR and W2 CAR were regressed on time-invariant
covariates Gender, Age, Minority Status, as well as corresponding time-variant
covariates Medication, Sleep Hours, Smoking, and Stressful Events; Wave 1 Self-
efficacy was entered as Auxiliary variable. Given that the full model was not
identified, I had to probe a more parsimonious model, with select covariates. As a
result, in the final model for CAR, Wave 1 CAR was regressed on Gender, Minority
45
Status, W1 Sleep Hours, and W1 Smoking; Wave 2 DS was regressed on Gender,
Minority Status, W2 Sleep Hours, W2 Stress Events, and W2 Smoking. The model
yielded good fit, c2(5, N = 60) = 5.02 (p = .41), RMSEA = .009 (95% CI: [.00, .18]), CFI
= .999, and SRMR = .06. According to the Wald test comparing the adjusted means
(intercepts), a significant difference was found between CAR at W1 and CAR at W2
(c2(1, N = 60) = 13.99, p < .001). Model estimates of covariates predicting CAR at Wave
1 showed that experience of any Stressful Event during Wave 1 marginally
predicted .23 units lower of CAR at W1 than those who did not experience a Stressful
Event (p = .061). The total variance explained for CAR at W1 was 19.7% (p = .049).
For Wave 2 CAR, covariate model estimates indicated that each unit increase in Age
significantly predicted .056 units lower of CAR at W2 (p = .030); and each hour
increase in sleep prior to the exam at W2 significantly predicted .15 units lower of
CAR at W2 (p < .001). The total variance explained for CAR at W2 was 28.9% (p
= .006). All other covariates did not significantly predict CAR at W1 or W2.
Grouping: Patterns in Diurnal Cortisol Change
To examine hypothesis Hb), that students will vary in terms of physiological
stress manifestations: specifically, some students will have healthy patterns of diurnal
cortisol (steep DS, large CAR) for both waves and that some students will have
decreased well-being at Wave 2, grouping of participants who showed similar diurnal
cortisol pattern change over time was performed in SPSS. Diurnal cortisol parameters
were split by the median (see Table 4) to create a boundary defining “low” (i.e.,
46
below the median) and “high” (i.e., above the median) levels for each parameter at
each wave.
Individual differences in diurnal cortisol change over time. In support of
hypothesis Hb), students showed individual differences in diurnal cortisol pattern
change over time. Specifically, four patterns for diurnal slope (DS) change over time
were created in students between W1 and W2: low-low (n = 11), low-high (n = 3),
high-high (n = 13) and high-low (n = 5). Four patterns for cortisol awakening
response (CAR) change over time were created in students between W1 and W2: low-
low (n = 17), low-high (n = 2), high-high (n = 17) and high-low (n = 2). Cross
tabulation for DS group status and CAR group status was assessed and reported in
Table 9.
Predicting Group Status: Multinomial Logistic Regression Models
To examine hypotheses Hc1), that students with more LHL at Wave 1 will
have low DS and CAR and less fluctuation in diurnal cortisol patterns between the
two waves indicating poor adaptation and stress dysregulation and Hc2) that FTPC
would predict a steeper DS for both waves, or more fluctuation (from steep to flat) as
an indicator of well-being or adaptive stress regulation before and during the week of
exam, multinomial logistic regression models in Mplus (using FIML) were estimated
to predict group status for DS and CAR patterns as the dependent variables. In order
to build predictive multinomial logistic regression models that would efficiently work
for the sample size in this study, I examined the covariates in predicting group status
47
prior to including key variables of the study into the models for DS and CAR
respectively.
Predicting DS groups. First, each covariate was entered into the covariates-
only multinomial logistic regression model separately. Among all covariates, results
showed that only Gender marginally predicted a higher likelihood of being in the
Low-high group compared to the High-high group for DS change over time.
Specifically, female students were 22.53 times more likely to be in the Low-high
group compared to the High-high group (B = 3.12, SE = 1.60, p = .052) for DS change
over time. All other covariates did not predict DS group status. The marginal
association between Gender and DS group status remained (B = 3.82, SE = 2.26, p
= .091) when adding covariates that showed the next lowest p-values in their group
status predictions, such as W1 Stress Event, W2 Medication, and W2 Sleep Hours, in
an identified model. In this final base model (n = 59), female students were 45.38
times more likely to be in the Low-high group compared to the High-high group.
The main hypothesized variables were then entered into the final base model.
Results from a multinomial logistic regression model with FTP Connectedness at W1
as a predictor and Gender, W1 Stress Events, W2 Medication, and W2 Sleep Hours as
covariates (N = 60) showed that FTPC at W1 did not significantly predict group status
of DS change over time. Results from a multinomial logistic regression model with
Learning-related Hopelessness (LHL) at W1 as a predictor and Gender, Smoking at
W1, and Stressful Events at W2 as covariates (N = 60) showed that LHL at W1 also
did not significantly predict group status of DS change over time.
48
Predicting CAR groups. First, each covariate was entered into the
covariates-only multinomial logistic regression model separately. Among all
covariates, results showed that Gender significantly predicted a lower likelihood of
being in the Low-low group compared to the High-high group for CAR change over
time. Specifically, female students were .17 times less likely to be in the Low-low
group compared to the High-high group (B = -1.80, SE = .90, p = .045) for CAR
change over time. Wave 2 Sleep Hours significantly predicted a higher likelihood of
being in the Low-low group compared to the High-High group for CAR change over
time. Specifically, with each hour increase in sleep right before the mid-term, it was
2.75 times more likely for students to be in the Low-low group compared to the High-
high group (B = 1.01, SE = .37, p = .006) for CAR change over time. Wave 2 Stress
Events significantly predicted a higher likelihood of being in the Low-low group
compared to the High-High group for CAR change over time. The experience of
stressful events prior to the midterm was associated with 7.39 times more likely for
students to be in the Low-low group compared to the High-high group (B = 2.00, SE
= .90, p = .026) for CAR change over time. The association between W2 Sleep Hours
and CAR group status (B = 1.14, SE = .51, p = .025) remained significant, and that of
W2 Stress Events and CAR group status (B = 2.40, SE = 1.23, p = .052) remained
marginally significant, when adding covariates that showed the next lowest p-values
in their group status predictions along with Gender, such as W2 Medication, in an
identified model. In this final base model (n = 59), students were 3.12 times more
likely to be in the Low-low group compared to the High-high group with each hour
49
increase in sleep, holding other covariates constant; and with stressful experiences
before the exam, they were 11.03 times more likely to be in the Low-low group
compared to the High-high group, holding other covariates constant.
The hypothesized main variables were then entered into the final base model.
In order to achieve model identification and proper fit, only W2 Sleep Hours was
retained as a covariate. Results from a multinomial logistic regression model with
FTP Connectedness (FTPC) at W1 as a predictor and W2 Sleep Hours as a covariate
(N = 60) indicated that FTPC at W1 significantly predicted group status of CAR
change over time (B = 3.14, SE = 1.41, p = .025). Each unit increase in FTPC was
associated with students being 23.05 times more likely of being in the Low-low CAR
group compared to the High-high CAR group. Results from a multinomial logistic
regression model with Learning-related Hopelessness (LHL) at W1 as main predictor
and Stressful Events and Sleep Hours at W2 as covariates showed that LHL at W1 did
not significantly predict group status of CAR change over time.
Discussion
The overall objective for this study was to examine exam effects on students’
well-being circa a mid-term examination, and whether stress effects on students’
diurnal stress physiological responses would be associated with a context-specific
negative academic emotion (Learning-related Hopelessness), and students’ future-
oriented motivation (Future Time Perspective Connectedness).
50
Exam Stress Effects for Diurnal Cortisol Parameters
The first main goal of this study was to examine whether students would show
a mean-level difference in diurnal cortisol parameters such as the diurnal cortisol
slope (DS) or cortisol awakening response (CAR) the week before and the week
during a mid-term examination. It was proposed that both DS and CAR would
represent student’s physiological well-being and would be lower during the week of
the exam, as a manifestation of students’ well-being being compromised the week of
mid-term exams (Ha). Findings indicated that students showed no difference in DS
between the two weeks. However, there was a significant CAR difference between
waves. CAR was on average higher during the week of mid-terms, immediately prior
to the mid-term, compared to the week prior to mid-terms. Although the direction of
this finding is inconsistent with the hypothesis (i.e., study results showed that CAR
increased rather than decreased), the finding is supported by previous literature,
indicating that normative undergraduate students showed increased CAR in response
to an academic exam period (Hewig et al., 2008). These findings imply that,
compared to DS, CAR may be a diurnal cortisol parameter that is more susceptible to
daily stress for college students, and is positively associated with the stressful
academic events. Findings support the argument made by previous literature that CAR
could be representative of day-to-day stress (Almeida, Piazza, & Stawski, 2009),
acting as a marker of anticipatory stress of the day, instead of chronic stress (Fries,
Dettenborn, & Kirschbaum, 2009).
51
Patterns of Diurnal Cortisol Change circa a Mid-term Exam
The second main goal of this study was to examine whether students will vary
in terms of physiological stress manifestations, specifically, whether students would
exhibit differences in diurnal cortisol pattern change circa a mid-term examination
(Hb). It was hypothesized that some students would show steep DS and large CAR for
both waves (Healthy group); some students will have lower well-being at Wave 2 as
an adaptive response (a flatter DS and smaller CAR during Wave 2) to the mid-term
exam stress (Exam-stress group); whereas some students would exhibit flat DS and
small CAR for both waves, indicating poor well-being over time (Dysregulated
group).
Results showed that four distinct patterns of diurnal cortisol change over the
two waves of data collection (Week before mid-term, and Week of mid-term) were
formed. Some students had relatively high DS or CAR over the two weeks; some
students had relatively low DS or CAR over the two weeks; some students switched
from having low DS or CAR during the first week to having high DS or CAR during
mid-term; remaining students switched from having high DS or CAR to having low
DS or CAR over the two weeks. These findings were supportive of the hypothesis in
that individual differences in stress physiology could be found when students
experience an academic stressful experience such as a mid-term exam (Weekes et al.,
2006). However, inconsistent with the study hypothesis, many students had a different
DS pattern in relation to their CAR pattern (see Table 11). The finding supports the
competing argument that DS and CAR may have differential implications with regard
52
to a stressful experience (Fries et al., 2009), which was consistent with the first main
finding of this study.
Predicting Diurnal Cortisol Patterns over Time
The third main goal of the study was to further examine predictors of well-
being, manifested by diurnal cortisol pattern change over time. Specifically, the role
of context-specific negative emotion, Learning-related Hopelessness as a risk factor
of having low or decreased well-being over time (Hc1), and the role of Future Time
Perspective Connectedness as a protective factor (Hc2) for sustained well-being over
time were examined. Findings indicated that after adjusting for covariates, Future
Time perspective Connectedness significantly predicted a higher likelihood of having
a stable low value of Cortisol Awakening Response circa a mid-term examination
compared to having a stable high value of CAR over time. The direction of this
prediction was not supportive of the theory and hypothesis (it was hypothesized that
FTPC would predict higher CAR over time as an indication of sustained well-being).
However, given that CAR may be indicative of the anticipation of a same-day
stressful experience, or momentary well-being, rather than a more long-term well-
being (Fries et al., 2009), this finding is consistent with the hypothesis in that FTPC
could be a protective factor for students’ daily well-being in response to anticipatory
academic stress. In other words, the negative relationship between CAR and FTPC
may be evidence that students’ ability to feel connected to a future goal is associated
with the anticipation of a manageable, instead of stressful, academic experience
(Turner & Husman, 2008).
53
Strengths and Implications
The current study examined Learning-related Hopelessness and Future Time
Perspective Connectedness and their predictions for diurnal cortisol pattern change
circa a mid-term examination in university students. The study was designed to
explore students’ emotional and motivational experiences in an academic context, and
examine how these components may predict students’ well-being given a stressful
academic experience. In the past, researchers have examined cortisol levels during
low vs. high examination stress periods (e.g., Weekes et al., 2006) in an academic
environment. However, very few have explored diurnal cortisol patterns during an
ecological exam stress period, in relation to learning-related emotional (i.e., Learning-
related Hopelessness) and motivational constructs (i.e., Future Time Perspective
Connectedness), which makes the current study unique and additive to current
literature.
Given the known relations between heightened CAR and decreased
psychological well-being and health (Nelemans et al, 2014; Ulrike, Reinhold, & Dirk,
2013; Vrshek-Schallhorn, Doane, Mineka, & Zinbarg, 2013; Adam et al., 2014; Chida
& Steptoe, 2009), this study contributes to current literature via its innovative
revelation that students’ future-oriented motivation (e.g., FTPC) may be useful in
keeping CAR low at a stressful period within an academic semester. The finding
sheds light to future educational intervention research, as educational interventions
that address students’ future-oriented motivation may become helpful in sustaining
their physiological and psychological well-being.
54
Limitations and Future Directions
The study was limited by the sample size. Specifically, the statistical models
for hypotheses Ha, Hc1, and Hc2 were compromised as the models could not withhold
the inclusion of all hypothesized time-variant and time-invariant covariates. Instead,
only the most potent covariates were included to examine these models. The lack of a
larger sample restricted the interpretability of the data. Future studies should be
conducted with a larger sample size to better address and support the research
hypotheses and generalize to the university population.
An additional limitation of this study is the lack of inclusion of detailed sleep
information. Literature has shown that sleep problems may affect cortisol levels as
well (Mrug, Tyson, Turan, & Granger, 2015). It is possible that dysregulation in
students’ sleep patterns (e.g., sleep-wake problems, parasomnias, etc.) could have an
influence on their diurnal cortisol patterns. To rule out the implications of poor quality
of sleep, future research should include a sleep problem questionnaire, in addition to a
record of the number of hours slept, in their diurnal cortisol sampling kit to adjust for
sleep quality and quantity.
In future studies, it would be meaningful to address other discrete academic-
related emotions that could also be related to students’ well-being, such as anger,
enjoyment, hope, anxiety, and shame. It is plausible that the academic emotional
experience can be associated with students’ chronic or momentary well-being via
many channels. It would also be important for future studies to clarify the influences
of domain-specific academic experiences (e.g., class-related, learning-related, or test-

55
related experiences) on students’ chronic or momentary well-being (Goetz, Frenzel,
Pekrun, & Hall, 2006), to better foster students’ health and success in post-secondary
education.
56
Study 2: Future time perspective (value), emotion regulation, and social
support predicting diurnal cortisol slope change over the course of a semester
As described by Dodge and colleagues (2012), one’s well-being is a dynamic
equilibrium between psychological, social, and physical resources and the life
challenges one faces. This idea of dynamic well-being emphasizes that the attempts
an individual makes to return to a stable point of well-being is a part of the definition
of well-being. Similarly, physiological stress manifestations are known to have daily
fluctuations and have tendencies for homeostasis (Smyth, Hucklebridge, Thorn,
Evans, & Clow, 2013); however, while studies have discussed the links from the
physiological stress pathways to one’s well-being (e.g., Doane & Adam, 2010; Hoyt
et al., 2015), few studies have focused on examining the patterns of the diurnal
fluctuations of stress hormones over multiple time points where individuals would
have different levels of life stress.
The current study attempts to address well-being change over time in
university Engineering students by examining diurnal cortisol patterns over the course
of an academic semester. The study explores motivational and regulatory factors that
may contribute to a healthy fluctuation of well-being, and what predicts exhaustion at
the end of the semester in the university context. Specifically, the tendency student
has to assign value to their future goals and the socio-emotional regulatory resources
that a student has in the university context are examined as predictors for the
fluctuation of well-being over time in this study.
57
Diurnal cortisol patterns
Research in cortisol, an end product of the hypothalamas-pituitary-adrenal axis
(HPA-axis), has spurred much attention in the recent decade or two, as researchers
have found many psychological and social factors associated with this physiological
stress hormone. Reactivity upon acute stress could cause an increase in cortisol
secretion; repeated psychosocial stress exposure, e.g., chronic stress, could result in
saturation of the allostatic load (Susman, 2006), and was found to be related to
dysregulation in cortisol secretion. In other words, excess amounts of cortisol from
repeated stress exposure may send negative feedback signals to the brain, causing a
down-regulation in cortisol secretion, which has been termed hyporeactivity (e.g.
Hankin et al., 2010) or hypocortisolism (Gunnar & Vazquez, 2001; Heim et al.,
2000). The study of the daily fluctuation in cortisol levels, i.e., diurnal cortisol
patterns, reflects such attenuated physiological effects from repeated stress, and has
been consistently associated with the well-being of both youth and adult samples (see
Figure 1). Steeper diurnal cortisol slopes (DS, i.e., the reclining of cortisol levels from
morning to bedtime), and larger cortisol awakening responses (CAR, i.e., the morning
peak after awakening), representing good regulation with high cortisol levels in the
morning and decreased levels throughout the day, has been found to be related to
positive well-being such as positive affectivity and social support (Hoyt et al., 2015;
Sladek & Doane, 2015; Slatcher, Selcuk, & Ong, 2015). Flatter diurnal cortisol
slopes, with an attenuated recovery slope throughout the day, have been associated
with less optimal factors, such as trait loneliness (or chronic loneliness), depression,
58
anxiety, and suppressed immunity (Doane & Adam, 2010; Hoyt et al., 2015; Pössel et
al., 2015; Saridjan et al., 2014). Smaller CAR has been found to be associated with
job stress, general life stress, fatigue, and burnout (Chida, & Steptoe, 2009). Notably,
Sjögren and colleagues (2006) found that steeper diurnal rhythm was related to social
support, general health, and well-being.
Diurnal Cortisol over Time
Although the diurnal cortisol patterns seem to be consistently associated with
physiological correlates in health and well-being, not many studies have examined
diurnal cortisol patterns over time, i.e., the change in diurnal cortisol over multiple
time-points. Several studies have used longitudinal modeling to examine within-day
diurnal cortisol fluctuation over a single wave of data collection, and the association
between the diurnal slope and predictors or outcomes that preceded or followed the
saliva collection (e.g., Hoyt et al., 2015; Slatcher et al., 2015). Few studies have
examined the change in DS or CAR over multiple time-points, and the mechanisms
associated with longitudinal change in diurnal cortisol patterns. Singh-Manoux and
colleagues (2014) examined DS longitudinally, however, they only used two waves of
data over a period of five years. As an extension of Study 1, the current study
proposes to examine diurnal cortisol patterns over three waves of data in the course of
one academic semester.
Diurnal Cortisol in Educational Settings. In addition, much of the literature
that has examined diurnal cortisol and its correlates has been embedded in
developmental or social psychology contexts (e.g., Slatcher & Robles, 2013; Saxbe,
59
Repetti, & Nishina, 2008). However, few studies in educational research have
considered using diurnal cortisol, or physiological markers of any kind, to help locate
motivational and psychological correlates that could be associated with students’
well-being, which could be crucial for optimizing students’ performance and
persistence in school.
Future Time Perspective
Future time perspective (FTP) is “the degree to which and the way in which the
future is anticipated and integrated in the psychological present of an individual, …
FTP is a cognitive-motivational personality characteristic that results from goal
setting” (Lens et al., 2012). From a goal-setting perspective, FTP can be defined as
the present anticipation of goals in the near future, where people with longer or deeper
FTP formulate relatively more long-terms goals (Nuttin & Lens, 1985).
FTP–Value. According to the Future Time Perspective Theory, the value of a
goal or reward decreases as the length of the temporal delay increases. However, for
those with long FTP, the decrease in value would become less steep than those with
shorter FTP. In other words, the incentive value of an anticipated future goal is higher
for individuals with longer FTP (Rachlin, 1995; Lens et al., 2012). Individuals who
have longer FTP may be more motivated towards goals precisely because the
incentive value of delayed goals would be higher (Husman & Shell, 2008). Of the
four dimensions found in the FTP construct, including Value, Extension, Speed, and
Connectedness, the current study focused on FTP Value (FTPV, or FTP Valence),
which denotes the importance one places on goals attainable in the future (Simons et
60
al., 2004; Husman & Shell, 2008). In a study on young adults conducted at the
University of Helsinki (Salmela-Aro & Nurmi, 1997), university students who had
future goals that were “age-graded developmental tasks” (tasks relevant to their
developmental stage and life situation, such as family goals or achievement goals)
showed better well-being two years later (lower depression and higher self-esteem). In
line with these findings, it is plausible that individuals who have high value in certain
future goals may exhibit higher levels of well-being (e.g., university students who
have achievement future goals), given that they are able to attain these goals.
However, anticipation does not warrant goal attainment; high FTPV would not
necessary warrant the much needed regulatory abilities to strive for and continue to
work towards, despite repeated frustration, said future goals. I therefore posited that
high FTPV would be beneficial for individuals’ well-being and would stabilize
students’ diurnal cortisol slopes across time, given that they have the regulatory
resources (including emotional regulation and social support) to face the adversity
that comes with rigid course-work in post-secondary studies. Specifically, students
who were high on FTPV and had good regulation would be more likely to have
healthy physiological responses to stress, either having steep diurnal patterns
throughout the semester (able to remain healthy and resilient), or an adaptive response
(i.e., being able to recover after the mid-term even though their diurnal patterns
flattened during mid-term). On the other hand, students who had high FTPV, yet
lacked the emotion regulation or social support to attain future goals, could
experience higher levels of frustration, which could be reflected in their well-being
61
represented by diurnal cortisol patterns, i.e., flatter diurnal cortisol slopes. In other
words, I suspected that emotion regulation and social support would interact with
FTPV in predicting well-being as represented by healthy diurnal cortisol patterns over
time, which, in the current study, was over the course of one semester.
Emotion-related Regulation
Emotion regulation, broadly defined as the changes associated with activated
emotions (Cole, Martin, & Dennis, 2004) has been linked to well-being quite often in
recent literature. For adult samples, multiple constructs have been used to examine
emotion regulation and its relation to well-being. Such regulation constructs include
but are not limited to cognitive reappraisal and executive functioning. Cognitive
reappraisal, i.e., cognitively changing how one thinks about an emotion-eliciting
situation has been found to predict positive emotions, better social functioning, and
psychological well-being (Gross & John, 2003). Executive functioning, the regulating
strategies focused on mental shifting, information updating, and monitoring, was
found to be associated with heart rate variability, a physiological marker which
indicates self-regulatory processes and goal-directed behavior and adaptation. Thus
far, there is no consensus on a definition of emotion regulation, nor is there a singular
construct used to measure emotion regulation. Rather than to focus on searching for a
unified definition, it is helpful to focus on processes involved by examining emotion-
related regulation.
Emotion-related regulation has been defined as “processes used to manage and
change if, when, and how one experiences emotions and emotion-related motivational
62
and physiological states, as well as how emotions are expressed behaviorally” (Gross,
2007, p. 288). Emotion-related regulation therefore includes both the regulation of
emotion reactivity and the regulation of behavior associated with an emotion. For the
current study, I focus on one of the emotion-related regulation constructs, effortful
control.
Effortful Control. In line with the field of developmental psychology,
effortful control has been found to be one of the dimensions that encompass one’s
temperament, and has been identified as a construct that facilitates one’s emotion-
related and behavior-related self-regulation (Eisenberg et al., 2012; Eisenberg &
Spinrad, 2004; Liew, 2012; Valiente, Swanson, & Lemery-Chalfant, 2009). Effortful
control (EC) denotes one’s ability to inhibit a dominant response and/or activate a
subdominant response according to individual needs or in face of environmental
demands (Rothbart & Bates, 2006).
In educational settings, EC has been found to be related to school readiness for
preschoolers (Blair, 2002), and predicted academic achievement in children (Blair &
Razza, 2007; Liew, McTigue, Barrois, & Hughes, 2008; Swanson, Valiente, &
Lemery-Chalfant, 2012; Valiente et al., 2013). However, despite evidence of EC
predicting positive school outcomes in children, the role of EC in higher education
has not been examined as much. Given that the scales used to measure effortful
control extend from infancy to adulthood across developmental stages (Rothbart &
Bates, 2006), using EC as an emotion-related regulation construct gives educational
63
researchers an opportunity to address this phenomenon across multiple stages of
development.
So far, EC in adolescence and emerging adulthood has been discussed in
literature pertaining to well-being. For example, higher levels of effortful control in
adolescence were related to lower levels of problematic substance use in early
adulthood (Piehler, Veronneau, & Dishion, 2012); EC also moderated the associations
between temperamental positive affectivity and negative affectivity and depressive
symptoms, where low positive affectivity and high negative affectivity predicted
depressive symptoms only when EC was low (Verstraeten, Vasey, Raes, & Bijttebier,
2009). Although predictions from EC to the diurnal cortisol slope are unclear, EC has
negatively predicted depressive symptoms, additionally, depressive symptoms have
been linked to flatter diurnal slopes in multiple studies (e.g., Doane et al., 2013;
Doane et al., 2011).
With these findings in mind, it made sense to examine EC as an emotion
regulation construct for university students within the educational context, in
predicting their well-being. In particular, EC may be an important regulatory resource
for post-secondary students to strive for their future goals, especially when rigid
university course work demands more attentional focus and self-regulation. The
current study thus proposes to examine not only the association between EC and well-
being in a post-secondary education sample, but also the moderating role of EC in
predicting diurnal cortisol slopes over time (representing well-being) from FTPV
(representing the valence one puts on future goals) in the current study. Specifically, I
64
posited that individuals high on both FTPV and EC would have an easier time
envisioning future goals, and regulating themselves to achieve their future goals, and
thus would have better-regulated and stabilized diurnal cortisol patterns, i.e., a steeper
diurnal slope over time, or indication of recovery from the mid-terms; whereas
individuals high on FTPV but low on EC may experience a flattening of diurnal
cortisol slope over time, with no sign of recovery during Wave 3.
Social Support
In general, social support has been found to be a stress buffer (Cohen & Wills,
1985). General social support was found to be significantly positively related to
university students’ subjective well-being, i.e., happiness and life satisfaction
(Lonnqvist & Deters, 2016). Specifically, social connections or lack thereof (i.e.,
loneliness) have been associated with diurnal cortisol patterns. For example, Doane
and Adam (2010) found that university students with higher trait loneliness showed
flatter diurnal cortisol slopes. Academic-specific social support in the educational
setting, however, has not been studied much. From a developmental standpoint, social
functioning predicted academic achievement in elementary school students (kids high
on both were positively viewed by teachers and peers, e.g., Valiente et al., 2011).
However, social networking may be less beneficial for students’ academic
achievement in middle or high school, as students may be shifting their focus in life to
peer affiliation or popularity instead of course work (e.g., Peetsma, 2000).
Nonetheless, in post-secondary educational settings, students may already have been
stratified to have certain future goals in mind, and could benefit from social
65
interactions for their academic success. For example, college students may form study
groups to help each other digest heavy course material, or motivate each other to do
well in various academic settings. In a Swedish study, findings showed that in
university students, optimism in achievement goals was positively related to social
optimism, and negatively associated with social withdrawal; in addition,
longitudinally, university students who had postponed life transitions (to career or to
romantic partnership) had more depression and task avoidance, and less optimism in
both social and academic situations (Salmena-Aro, Kiuru, Nurmi, & Eerola, 2014).
Given such evidence, it was logical to posit that social support within the academic
context, for example via peer or faculty support, could be crucial to post-secondary
students’ well-being. As a result, in the current study I posited that academic social
support would be associated with students’ well-being as represented by a healthy
diurnal cortisol slope at baseline (Wave 1). In addition, for individuals with high
FTPV, social support may be beneficial in providing additional resources for students
to work toward their future goals; students without adequate academic social support
may find themselves struggling more in achieving their goals. Therefore, I posited
that social support will interact with FTPV in predicting students’ well-being over
time, specifically, individuals high on both composites would have steeper and more
stable diurnal cortisol slopes over time, or would show better recovery from stress
over time; whereas individuals high on FTPV but low on social support may
experience a flattening of diurnal cortisol slope over time and no recovery from stress
(see Table 2).
66
The Current Study
In sum, the aims of this study included, 1) to examine the interactive effects
between how students’ FTPV and their effortful control predict well-being
represented by diurnal cortisol patterns and pattern change over the course of a
semester; 2) to examine post-secondary engineering students’ social support in their
academic environment, and whether students’ social support would moderate the
effects that FTP Value has in predicting their well-being represented by diurnal
cortisol patterns over the semester. I proposed that I will see different groups of
students showing differential diurnal cortisol patterns over time, such as: 1) healthy
group (steep DS, large CAR, across three waves), 2) exam-stress group (flattened
during Wave 2 but recovered during Wave 3, showing adaptive stress responses), and
3) exhaustion group (continual flattening over the semester). I posited that correlates
proposed in the current study will be able to predict group classification.
The study hypotheses thus included: Hypothesis a) Students’ effortful control
and social support would be positively associated with steeper cortisol slopes (DS)
and larger cortisol awakening responses (CAR) at Wave 1 (baseline). Hypothesis b)
Students’ effortful control and social support would predict less flattening in diurnal
cortisol patterns across the semester (over three waves of data collection), or would
predict a recovery during Wave 3 from Wave 2 exam-stress (healthy group and exam-
stress group). Hypothesis c) Given that students have high effortful control, high
FTPV would predict a healthier pattern of diurnal cortisol change over time, e.g.,
steep at Wave 1, flatter at Wave 2, and steep at Wave3, or steep across all three waves
67
(healthy group and exam-stress group); whereas high FTPV and low EC would be
associated with non-recovery in diurnal cortisol patterns over the semester,
specifically smaller CAR and DS at Wave 3 (exhaustion group). Hypothesis d) Given
that students have high social support, high FTPV would predict a healthier pattern of
diurnal cortisol change over time, e.g., steep at Wave 1, flatter at Wave 2, and steep at
Wave 3, or steep across all three waves (healthy group and exam-stress group);
whereas high FTPV and low social support would be associated with non-recovery in
diurnal cortisol patterns over the semester, specifically smaller CAR and DS at Wave
3 (exhaustion group).
Method
Participants
A total of 80 post-secondary engineering students were enrolled in this study,
including both upper-level undergraduate students and graduate students at a large
public university in the southwest of the US. The proposed sample of participants in
this study was to have approximately 10-15% of students with Hispanic/Latino
ethnicity background, and approximately 10-15% female students, which would be
representative of the populations of ASU engineering students in terms of diversity.
The proposed sample of participants was to have approximately half of the students
recruited from the School of Engineering who were in an Engineering program, and
half of the students affiliated with an Engineering Research Center at the university.
No ethnic/racial or gender group was excluded. Participants were proposed to have an
68
age range of 20-30 years of age. Exclusion criteria was students below 18 years of
age.
Design
This project employed a longitudinal design with multiple data collection time
points throughout the course of one semester (see Table 2). I examined engineering
students’ survey data and the change in diurnal cortisol slopes throughout the
semester. The first wave of data collection was at the beginning of the semester
(Wave 1, W1, circa week three); second wave was in the middle of the semester
during a stressful academic event (Wave 2, W2, the stressful phase); and the third
wave was at the end of the semester during a time of relatively less stress (Wave 3,
W3, serving as a recovery/relaxation phase). During each wave, students provided
diurnal saliva samples over two consecutive days, and I examined students’ future
time perspective, their emotional regulation, and social support via self-reported
surveys (see below for measures).
Procedures
Participant recruitment started during week two of the spring semester—which
entailed study introduction and student consent—and data collection began during the
third week of the academic semester (W1). For recruitment, the research team entered
engineering research labs and engineering classrooms to hand out fliers, and ask
students to complete consent forms via hard-copy or online in order to participate in
the study. Students visited a central location for a short training for cortisol sample
collections (this was implemented by trained RAs) upon enrollment. Students filled
69
out all self-reports online (they were given the option of hard-copy surveys if
preferred), and were given a saliva collection kit to collect their saliva samples for
two consecutive days, three times per day for each wave (see below for cortisol
collection). The survey took less than 30 minutes to complete. They turned in their
samples (and surveys if hard-copy) upon collection completion, and were
compensated $10, $15, and $25 per wave to encourage continual participation. The
second wave of data collection was at mid-semester (W2), and also included both
student self-reports and diurnal salivary cortisol collection. The third wave of data
collection was near the end of the semester (W3), again including self-reports and
diurnal saliva collection. Researchers only entered the classrooms and labs during
participant recruitment week. All other communications, including contacting
students for reminders, scheduling saliva kit drop-offs, and providing participation
incentives were over email communication and text messaging if the students opted in
to receive text message reminders. The research team held research office hours for
saliva kit drop-offs and to provide students their incentives.
Measures
Future time perspective. Students provided self-reported responses on the
Future Time Perspective – Value subscale (FTPV; Cronbach’s a = .72; Husman &
Shell, 2008), which includes seven items, on a Likert scale of 1 to 5 (1 = Strongly
disagree to 5 = Strongly agree). Sample items included “Given the choice, it is better
to get something you want in the future than something you want today,” or “The
most important thing in life is how one feels in the long run.”
70
Effortful control. Effortful Control Scale (EC; short form from the Adult
Temperament Questionnaire; from previous literature, EC subscales had Cronbach’s
a = .66 - .88; Evans & Rothbart, 2007) included a total of 19 items on three subscales,
including Activation Control (e.g., “I can keep performing a task even when I would
rather not do it”), Attentional Control (e.g., “It’s often hard for me to alternate
between two different tasks”, and Inhibitory Control (e.g., “Even when I feel
energized, I can usually sit still without much trouble if it’s necessary), reported on a
scale of 1 to 7 (1 = Extremely untrue of you, 7 = Extremely true of you). I used an EC
composite score for emotion regulation by averaging students’ scores on the three EC
subscales.
Social support. Quality of Relationships Inventory (Pierce, Sarason, &
Sarason, 1991; revised for engineering students), and the Social Network
Questionnaire (revised for engineering students). A context-specific Social Support
composite variable was created to evaluate students’ overall social support in the
engineering program. The items were standardized and averaged to from a composite.
Both the Quality of Relationships Inventory and Social Network Questionnaire was
also adapted to include relationships with both peer and faculty within the engineering
academic context. Two subscales of social support were calculated, including an
Academic Social Support subscale, and Non-academic Social Support Subscale
(which included items pertaining to family, friends, and co-workers, from the original
items).
71
Self-reported health. Students’ self-reported health was measured by a 12-
item short form health survey (SF-12 Health Survey; Ware, Kosinski, & Keller,
1996). Self-reported health served as an additional indicator for students’ well-being.
Salivary cortisol. Diurnal samples along with a checklist of items regarding
salivary sampling was collected for two consecutive days for each wave. Diurnal
samples were collected sublingually three times per day, i.e., upon awakening, 30-
minutes after awakening (for the cortisol awakening response), and before bedtime
(for recovery). Each sample took two minutes to complete. In addition, each sample
had a corresponding check-sheet that students completed when taking each saliva
sample that records the time of collection, sleep hours, and food/drink/drug
consumption before taking the sample. For this study, a sleep problem survey (see
covariates section below) was also included in the checksheet packets for each wave
of saliva data. The samples were kept in ice-packets or the refrigerator before and
during transportation. The packets were sent in the research lab for low temperature
storage for each wave.
The saliva samples were then shipped to the Cortisol Lab at the University of
Trier in Germany for low temperature storage and cortisol analyte assays, as the assay
costs and assay schedule at Trier were most suitable for the study’s budgets and
timeline. The saliva samples were stored at -20 °C until analysis at Trier. After
thawing, saliva samples were centrifuged at 2000 g for 10 minutes, which resulted in
a clear supernatant of low viscosity. 100ul of saliva were used for duplicate analysis.
Cortisol levels were determined employing a competitive solid phase time-resolved
72
fluorescence immunoassay with flouromeric end point detection (DELFIA). 96-well-
Maxisorb microtiterplates were coated with polyclonal swine anti-rabbit
immunoglobulin. After an incubation period of 24h at 4°C plates were washed three
times with washbuffer (pH=7,4). In the next step the plates were coated with a rabbit
anti-cortisol antibody and were incubated for 48h at 4°C. Synthetic saliva mixed with
cortisol in a range from 0-100nmol/l served as standards. Standards, controls (saliva
pools) and samples were given in duplicate wells. 50µl of biotin-conjugated cortisol
were added and after 30min of incubation the non-binding cortisol / biotin-conjugated
cortisol would be removed by washing (3x). 200µl europium-streptavidin (Perkin
Elmerc, Liefe science Turku, Finnland) was added to each well and after 30 minutes
and 6 times of washing 200µl enhancement solution was added (Pharmacia, Freiburg,
Germany). Within 15 min on a shaker the enhancement solution induced the
fluorescence, which could be detected with VICTOR™ X4 Multilabel Plate Reader
(Perkin Elmer, Massachusetts, USA). With a computer-controlled program a standard
curve was generated and the cortisol concentration of the samples were calculated.
The intra-assay coefficient of variation was between 4.0% and 6.7%, and the
corresponding inter-assay coefficients of variation was between 7.1% -9.0%. Outliers
that were three standard deviations away from the mean of each sample were
excluded or windsorized for statistical analyses. Data was windsorized at 1.81 µg/dL
(equivalent to 50nmol/L; Nicolson, 2008).
Diurnal cortisol patterns. Mean cortisol levels of the two consecutive days
for each wave were computed to create T1, T2, and T3 cortisol levels for each wave.
73
Log transformations was performed for each time point before any calculation for
indicators occurs if the data is positively skewed. Three samples, i.e., upon awakening
(T1), 30-minute after awakening (T2), and before bed-time samples (T3) were used to
create the diurnal cortisol slope (DS) and the cortisol awakening response (CAR) for
each wave. DS was calculated by subtracting the before bedtime sample (T3) from the
morning awakening sample (T1) after both are log transformed, and dividing this
deviation by awake hours (DeSantis, Adam, Hawkley, Kudielka, & Cacioppo, 2015).
The two morning samples were used to calculate the cortisol awakening response
(CAR) for each wave. CAR was calculated by subtracting wake level T1 from peak
level T2, also after both are log transformed.
Covariates. Demographic information for each wave of survey was collected
for covariates in the models, including gender, race/ethnicity, and age. For each wave,
students also reported their sleep duration in the saliva checksheets, and well as their
sleep problems in a Sleep Questionnaire (see Mrug et al., 2015) along with their
checksheets, allowing for sleep duration and sleep problems to be included as
covariates in the models. I included Learning-related Hopelessness as a covariate as it
has been found to be correlated with diurnal cortisol patterns in Study 1 in preliminary
analyses. In addition, I dichotomized variables for both cigarette use and medication
use of any of the following six types of prescription and over-the-counter medicines
that have been shown to influence cortisol levels: steroid inhalers, other types of
steroid medications, medications or creams containing cortisone, birth control pills,
74
and anti-depressant or anti-anxiety medications (Dmitrieva et al., 2013; Granger et al.,
2009), and included them as covariates.
Statistical Analysis
Descriptive statistics and bivariate correlations were performed in SPSS,
including means, standard deviations, and zero-order bivariate correlations on all key
variables and diurnal cortisol levels. Multiple regression analyses allowed me to
address Hypothesis a) Students’ effortful control and social support would be
positively associated with steeper cortisol slopes (DS) and larger cortisol awakening
responses (CAR) at Wave 1 (baseline), with covariates (e.g., sleep hours) included,
which provided support for concurrent associations between stress regulation and
socio-emotional-related regulation in the baseline measures.
Prior to examining diurnal cortisol patterns over time for Hypotheses b), c), and
d), I used repeated measures ANCOVA as preliminary analysis to examine whether
there are wave differences for both CAR and DS, regardless of predictors, and I used
post-hoc comparisons to examine between wave differences to look at overall diurnal
cortisol patterns over the semester.
I examined Hypotheses b), c) and d) using multinomial logistic regression
models, with three groups for classification. I proposed to form the groups by using
the following criteria: one standard deviation above the mean as high, one standard
deviation below the mean as low, and between these two points as medium. The
flattening effect of diurnal cortisol patterns from exam stress would be determined if
an individual has high DS or CAR at Wave 1, and medium DS or CAR Wave 2; or if
75
an individual has high/medium DS or CAR at Wave 1 and low DS or CAR at Wave 2.
Recovery from stress would be determined if an individual had low/medium DS or
CAR at Wave 2, but high DS or CAR at Wave 3; or from low DS or CAR at Wave 2
and medium DS or CAR at Wave 3. I proposed that if an individual remained high
across three waves they would be assigned to the healthy group; if an individual
showed a pattern of flattening and then recovery, for example if they have high-low-
medium or medium-low-medium, they would be assigned to the exam-stress group; if
an individual showed a pattern of flattening from Wave 1 to Wave 2 and does not
recover at Wave 3, or if they remained low in all three waves, they would be assigned
to the exhaustion group. Each individual had a group assignment for DS and CAR,
and I examined both parameters for the following models. For people not assigned to
the above groups, I investigated further to see if another group should be formed, or
whether/how they should be included into the analyses.
I looked at main effects for EC and social support (SS) in the predictions, to
examine Hypothesis b) Students’ effortful control and social support would predict
less flattening (healthy group) in diurnal cortisol patterns across the semester (over
three waves of data collection), or would predict a recovery during Wave 3 from
Wave 2 exam-stress (exam-stress group) compared to the exhaustion group. I
examined the two-way interaction term between FTPV and EC to address Hypothesis
c) Given that students have high effortful control, high FTPV would predict a
healthier pattern of diurnal cortisol change over time, e.g., steep at Wave 1, flatter at
Wave 2, and steep at Wave 3, or steep across all three waves (healthy group and
76
exam-stress group compared to the exhaustion group); whereas high FTPV and low
EC would be associated with non-recovery in diurnal cortisol patterns over the
semester, specifically smaller CAR and DS at Wave 3 (exhaustion group). Lastly, I
examined the two-way interaction term between FTPV and SS to address Hypothesis
d) Given that students have high social support, high FTPV would predict a healthier
pattern of diurnal cortisol change over time, e.g., steep at Wave 1, flatter at Wave 2,
and steep at Wave 3, or steep across all three waves (healthy group and exam-stress
group); whereas high FTPV and low social support would be associated with non-
recovery in diurnal cortisol patterns over the semester, specifically smaller CAR and
DS at Wave 3 (exhaustion group). For each logistic regression model, I looked at the
significance of the predictors, and the significance of the interaction terms. I
examined the odds ratio for each coefficient to compare the predictions of the groups.
I proposed that if the interaction term for either FTPVxEC or FTPVxSS were
significant, I would expect to see the odds ratio of the interaction term for the Healthy
and Exam-stress group to be greater than 1 compared to the Exhaustion group, which
would be supportive of my hypothesis.
Power analysis. Power analyses were used to determine the sample size
necessary to detect effects if they are present. The power of a logistic regression
model can be estimated using the statistical program G*Power (Faul, Erdfelder, Lang,
& Buchner, 2007; Faul, Erdfelder, Buchner, & Lang, 2009). For the current project,
assuming that I had a medium effect size (odds ratio) of 3.5, alpha of .05 for my
model, and would like to achieve a power of .95, I would need a total sample size of
77
66 participants. If I had an effect size of 3.5, alpha of .05, and would like to achieve a
power of .80, I would need a total sample size of at least 44 participants.
According to the estimations, in order to achieve adequate power (i.e., power
above .80), the study would at least need 44 participants, and ideally more than 66
participants. Considering the budget of our study, and the implementation difficulty
and typical small samples of bioscience interdisciplinary research, I considered a total
of 44 and above participants adequate for this project given an odds ratio of 3.5.
Results
Participant Demographics
Out of the total of 80 students who enrolled to participate in Study 2, 67
students completed Wave 1 Survey collection; out of these students, 55% were male
(n = 37) and 43% were female (n = 29). With regards to race/ethnicity, 2% were
American Indian, 35% were Asian, 6% were Hispanic, 2% were Black, 50% were
White, 0% were Pacific Islanders, and 6% were of mixed racial/ethnic background.
One student (2%) of the 67 participants who completed Wave 1 Survey had missing
gender, race, and age data. All participants were 18 years or older, and had a mean
age of 23.05 years (SD = 4.92; Median = 22). See Table 10 for Study 2 participants’
demographic information.
Attrition Analysis. Of the 67 participants who completed their survey data,
63 students submitted any Wave 1 cortisol samples, 47 students submitted any Wave
2 cortisol samples, and 43 students submitted any Wave 3 cortisol samples (Table 10).
Of the 67 participants, 40 students had cortisol data for all three waves; four students
78
submitted no cortisol data at all; 13 students only submitted Wave 1 cortisol samples,
and attrited during Wave 2 and Wave 3 cortisol collection; seven students only
submitted cortisol samples for Wave 1 and Wave 2, and attrited during Wave 3 data
collection; three students only submitted cortisol samples for Wave 1 and Wave 3,
and did not submit their cortisol samples during Wave 2. According to cross
tabulation analysis performed in SPSS v.22, Pearson Chi-square results showed a
significant association between all data (survey and cortisol) attrition over time and
gender, c2(4, N = 66) = 11.72 (p = .020), with Male students’ attrition rate higher than
Females. Further, examining cortisol data attrition over time, Male students showed
higher attrition in cortisol data than their Female counterparts, with a Pearson Chi-
square of c2(2, N = 62) = 6.26 (p = .044). In addition, Pearson Chi-square results showed
that if the race/ethnicity variable was recoded, to avoid low cell count, into White vs.
Minority, there was a marginal significant association between cortisol data attrition
and minority status, c2(2, N = 62) = 5.34 (p = .069), indicating that attrition was
marginally higher in ethnic minorities. A one-way ANOVA examining whether age
was associated with attrition in cortisol data showed that there was a marginal
significant difference in age for those who had no attrition in cortisol data compared
to those who attrited for one or two waves (F(13,48) = 1.91, p = .052), indicating that
attrition in cortisol data was marginally higher in older students.
Covariate Data
Participants reported to have slept for an average of 7.16 hours (SD = 1.16;
range = 3.75 to 10.00) during the nights before the two consecutive days of Wave 1
79
cortisol collection, slept for an average of 7.18 hours (SD = 1.42; range = 2.42 to
10.00) during the nights of Wave 2 cortisol collection, and slept for an average of 7.57
hours (SD = 1.50; range = 2.75 to 11.50) during the nights of Wave 3 cortisol
collection. Participants reported to have an average of 1.99 (SD = .40) Sleep Problems
(on a scale of 1 = Never to 5 = Everyday) during Wave 1, an average of 2.01 (SD
= .33) Sleep Problems during Wave 2, and an average of 1.97 (SD = .34) Sleep
Problems during Wave 3. Check-sheet data from the diurnal cortisol saliva kits
indicated that during Wave 1, 18 students reported to have experienced a stressful
event within the 24 hours prior to their saliva sample collection; five students reported
smoking within 12 hours of saliva collection; and 20 students reported have taken
medication (a dichotomized variable for intake of allergies medication, pain killers,
contraceptives, medication for a chronic health concern, or other) within 24 hours of
saliva collection. During Wave 2, 20 students reported to have experienced a stressful
event within the 24 hours prior to their saliva sample collection; two students reported
smoking within 12 hours of saliva collection; and 15 students reported have taken
medication within 24 hours of saliva collection. During Wave 3, 11 students reported
to have experienced a stressful event within the 24 hours prior to their saliva sample
collection; no students reported smoking within 12 hours of saliva collection; and 11
students reported have taken medication within 24 hours of saliva collection.
Preliminary Analyses
Cortisol samples. Raw cortisol data were examined, and values that were
higher than 50 nmol/L (approximately the highest non-stimulated salivary cortisol
80
level for healthy subjects; Nicolson, 2008) were windsorized at 50 nmol/L; including
two samples at Wave 1 Day 1 Wake-time, three samples at Wave 1 Day 1 Peak-time,
one sample at Wave 1 Day 2 Wake-time, one sample at Wave 1 Day 1 Peak-time, and
two samples at Wave 1 Day 2 Bedtime. No Wave 2 or Wave 3 raw cortisol data were
higher than 50 nmol/L.
During Wave 1 data collection, for Wave-level cortisol collection (samples
collected upon awakening), 61 participants submitted samples for both consecutive
days of saliva collection, one participant submitted Day 1 sample only, and one
participant submitted Day 2 sample only. For Wave 1 Peak-level cortisol collection
(collected 30-minutes upon awakening), 61 participants submitted samples for both
consecutive days of saliva collection, one participant submitted Day 1 sample only,
and one participant submitted Day 2 sample only. For Wave 1 Bedtime cortisol
collection, 60 participants submitted samples for both consecutive days of saliva
collection, and three participants only submitted their Day 2 samples. During Wave 2
data collection, for Wave-level cortisol collection, 43 participants submitted samples
for both consecutive days, two participants only submitted their Day 1 samples, and
three participants only submitted Day 2 samples. For Wave 2 Peak-level cortisol
collection, 43 participants submitted samples for both consecutive days, one
participant submitted Day 1 sample only, and three participants only submitted their
Day 2 samples. For Wave 2 Bedtime cortisol collection, 43 participants submitted
samples for both consecutive days, one participant submitted Day 1 sample only, and
two participants only submitted their Day 2 samples. During Wave 3 data collection,
81
for Wave-level cortisol collection, 41 participants submitted samples for both
consecutive days, and two participants only submitted their Day 1 samples. For Wave
3 Peak-level cortisol collection, 41 participants submitted samples for both
consecutive days, and two participants only submitted their Day 1 samples. For Wave
3 Bedtime cortisol collection, 42 participants submitted samples for both consecutive
days, and one participant submitted Day 1 sample only (Table 11).
The cortisol values were then averaged between the two consecutive days at
each time point for each wave. As noted, some participants were missing one or both
days of cortisol samples, however, one day of missingness was allowed for the
averaged cortisol levels at each time point to maximize retention of cortisol data (see
Table 11).
Descriptive statistical analysis (Table 12) indicated that there were excess
skewness and kurtosis in the mean cortisol values (skewness range = -.03 to 5.07;
kurtosis range = -1.04 to 28.55) therefore the mean cortisol values were log-
transformed to approximate normality. For each wave, a composite to represent the
diurnal cortisol slope (DS) was then calculated by subtracting log-transformed mean
bedtime cortisol (Bed) from log-transformed mean awakening cortisol (Wake) and
dividing the score by awake hours for each participant; a composite to represent the
cortisol awakening response (CAR) was calculated by subtracting log-transformed
mean awakening cortisol from log-transformed mean 30-minute upon awakening
cortisol (Peak) for each wave. Wave 1 CAR and Wave 2 CAR contained outliers that
were three standard deviations below the mean, and both cases were windsorized at
82
the -3SD level (-1.69 for Wave 1 CAR, and -1.53 for Wave 2 CAR). Descriptive
statistics for the diurnal cortisol parameters DS and CAR post-windsorization can be
found in Table 13, with all skewness and kurtosis within normal bounds.
Bivariate correlations between the diurnal cortisol parameters were examined
(Table 14). Results showed that Wave 1 DS and Wave 2 DS were significantly
positively correlated (r = .54, p < .001), Wave 1 DS and Wave 3 DS were marginally
positively correlated (r = .28, p = .095), Wave 1 CAR and Wave 3 CAR were
marginally positively correlated (r = .28, p = .071), Wave 2 DS and Wave 2 CAR
were marginally negatively correlated (r = -.28, p = .086), Wave 1 DS and Wave 3
CAR were significantly positively correlated (r = .31, p = .049).
Gender differences for mean-level cortisol and diurnal cortisol parameters
were also examined (Table 15). Results showed that there was a significant difference
between males (M = 2.26, SD = .61) and females (M = 2.75, SD = .66) with regards to
Peak-level cortisol at Wave 1 (t = -3.01, p = .004, 95% CI [-.82, -.16]), with female
students having higher W1 Peak-level cortisol. The effect size for this analysis (d
= .77) was found to exceed Cohen’s (1988) convention for a medium effect size (d
= .50) and approached a large effect size (d = .80). A significant difference between
males (M = 2.20, SD = .44) and females (M = 2.58, SD = .64) with regards to Wave 3
Peak-level cortisol (t = -2.26, p = .029, 95% CI [-.72, -.04]) was found, with female
students having higher W3 Peak-level cortisol. The effect size for this analysis (d
= .69) was found to exceed the medium effect size (d = .50). A marginally significant
difference in Wave 1 CAR was found between males (M = .17, SD = .58) and females
83
(M = .41, SD = .44), with female students having higher CAR at Wave 1 than their
male counterparts (t = -1.74, p = .087, 95% CI [-.51, .04]), with the Cohen’s d
approaching medium effect size (d = .47). A significant difference in Wave 3 CAR
was found between males (M = -.08, SD = .49) and females (M = .34, SD = .49),
again, with female students having higher CAR at Wave 3 than their male
counterparts (t = -2.80, p = .008, 95% CI [-.73, -.12]). The effect size for this analysis
(d = .86) was found to exceed Cohen’s (1988) convention for a large effect size (d
= .80). There were no significant gender differences in all other diurnal cortisol
parameters, though notably the effect size for the differences in DS at Wave 2 (d
= .39) exceeded a small effect size (d = .20), and approached a medium effect size.
Minority status differences for mean-level cortisol and diurnal cortisol
parameters were also examined (Table 16). Results showed that a significant
difference was found in Wave 2 Peak-level cortisol, between Minorities, including
American Indian, Asian, Hispanic, Black, Mixed Race students (M = 2.70, SD = .46),
and White students (M = 2.24, SD = .64), with Minority students having significantly
higher Peak level cortisol (log-transformed) than their White peers (t = -2.75, p
= .009, 95% CI [-.80, -.12]). The effect size for this analysis (d = .83) exceeded that of
a large effect size (d = .80). A significant difference between Minorities (M = .34, SD
= .49) and White students (M = -.01, SD = .54) with regards to Wave 2 CAR was
found, with Minorities having a larger CAR than their White peer (t = -2.30, p = .026,
95% CI [-.66, -.04]). The effect size for this analysis (d = .69) exceeded a medium
effect size (d = .50). Statistically significant differences (t-tests) were not found when
84
the minority status included Under-represented Minorities only. However, effect sizes
for the t-tests comparing Under-represented Minorities vs. Others were notable (Table
17), including W2 Peak level cortisol (d = .58), W3 Peak level cortisol (d = .55), W3
DS (d = .69), and W3 CAR (d = .59), all of which exceeded a medium effect size (d
= .50).
Missing Data Analysis
For Wave 1 cortisol, four participants out of the total valid participants (N =
67) had missing data on both days of data collection (6.0%). Four participants had
missing data for W1 CAR, and nine participants had missing data for W1 DS. For
Wave 2 cortisol, 20 participants out of the total valid participants had missing data on
both days of data collection (29.9%). Twenty participants had missing data for W2
CAR, and 28 participants had missing data for W2 DS. For Wave 3 cortisol, 24
participants out of the total valid participants had missing data on both days of data
collection (35.8%). Twenty-four participants had missing data for W3 CAR, and 27
participants had missing data for W3 DS.
Using logistic regression, it was found that among the time-variant covariates,
Wave 1 Stress Events significantly predicted missingness in Wave 2 DS (c2(1, N = 60) =
3.874, p = .049), explaining 8.5% (Nagelkerke R2) of the variance in Wave 2 DS
missingness and correctly classifying 66.7% of cases. Experiencing Stress Events
prior to data collection during Wave 1 was associated with participants being 3.13
times more likely to have missing data in Wave 2 DS (p = .051). Wave 1 Stress
Events also significantly predicted missingness in Wave 2 CAR (c2(1, N = 60) = 4.902, p
85
= .027), explaining 11.6% (Nagelkerke R2) of the variance in Wave 2 CAR
missingness and correctly classifying 75.0% of cases. Experiencing Stress Events
prior to data collection during Wave 1 was associated with participants being 4.00
times more likely to have missing data in Wave 2 CAR (p = .028). Wave 1 Smoking
significantly predicted missingness in Wave 3 DS (c2(1, N = 60) = 4.669, p = .031),
explaining 10.3% (Nagelkerke R2) of the variance in Wave 3 DS missingness and
correctly classifying 70.0% of cases. Smoking prior to data collection during Wave 1
was marginally associated with participants being 8.94 times more likely to have
missing data in Wave 3 DS (p = .058). Wave 1 Medication marginally significantly
predicted missingness in Wave 2 DS (c2(1, N = 60) = 3.792, p = .052), explaining 8.4%
(Nagelkerke R2) of the variance in Wave 2 DS missingness and correctly classifying
63.3% of cases. Taking medication prior to data collection during Wave 1 was
associated with participants being .306 times less likely to have missing data in Wave
2 DS (p = .065). Wave 1 Medication significantly predicted missingness in Wave 2
CAR (c2(1, N = 60) = 4.030, p = .045), explaining 9.6% (Nagelkerke R2) of the variance
in Wave 2 CAR missingness and correctly classifying 75.0% of cases. Taking
medication prior to data collection during Wave 1 was associated with participants
being .231 times less likely to have missing data in Wave 2 CAR (p = .073).
Wave 2 Sleep Duration (hours slept night before cortisol collection)
significantly predicted missingness in Wave 3 DS (c2(1, N = 46) = 4.452, p = .035),
explaining 14.7% (Nagelkerke R2) of the variance in Wave 3 DS missingness and
correctly classifying 80.4% of cases. Each hour increase in Sleep Duration was
86
associated with participants being 1.76 times more likely to have data for Wave 3 DS
(p = .051). Wave 2 Sleep Problems significantly predicted missingness in Wave 3 DS
(c2(1, N = 46) = 4.042, p = .044), explaining 13.4% (Nagelkerke R2) of the variance in
Wave 3 DS missingness and correctly classifying 80.4% of cases. Each unit increase
in W2 Sleep Problems was associated with participants being 13.16 times more likely
to have data for Wave 3 DS (p = .068). Wave 2 Sleep Problems significantly
predicted missingness in Wave 3 CAR as well (c2(1, N = 46) = 4.152, p = .042),
explaining 15.0% (Nagelkerke R2) of the variance in Wave 3 CAR missingness and
correctly classifying 84.8% of cases. Each unit increase in Sleep Problems was
associated with participants being 19.80 times more likely to have data for Wave 3
CAR (p = .071). None of the time-invariant covariates (Gender, Minority Status,
Under-represented Minority Status, or Age) predicted missingness in the diurnal
cortisol parameters.
Some Wave 1 survey variables that were outside of the substantive interest of
this project were included in missing data analysis as potential auxiliary variables to
address missingness, such as Emotion Regulation Reappraisal and Emotion
Regulation Suppression. Emotion Regulation Reappraisal marginally predicted
missingness in Wave 2 DS (c2(1, N = 60) = 3.759, p = .053), explaining 7.5%
(Nagelkerke R2) of the variance in Wave 2 DS missingness and correctly classifying
76.3% of cases. Those who reported more Emotion Regulation Reappraisal in their
survey were 2.104 times more likely to have data for DS at Wave 2 (p = .067).
Emotion Regulation Suppression significantly predicted missingness in Wave 2 DS
87
(c2(1, N = 60) = 5.382, p = .020), explaining 10.6% (Nagelkerke R2) of the variance in
Wave 2 DS missingness and correctly classifying 65.2% of cases. Those who reported
more Emotion Regulation Suppression in their survey were 2.014 times more likely to
have data for DS at Wave 2 (p = .027). Emotion Regulation Suppression significantly
predicted missingness in Wave 2 CAR (c2(1, N = 60) = 3.946, p = .048), explaining 8.2%
(Nagelkerke R2) of the variance in Wave 2 CAR missingness and correctly classifying
74.2% of cases. Those who reported more Emotion Regulation Suppression in their
survey were 1.877 times more likely to have data for CAR at Wave 2 (p = .055).
Emotion Regulation Suppression also significantly predicted missingness in Wave 3
DS (c2(1, N = 60) = 5.489, p = .019), explaining 10.8% (Nagelkerke R2) of the variance
in Wave 3 DS missingness and correctly classifying 69.7% of cases. Those who
reported more Emotion Regulation Suppression in their survey were 2.037 times more
likely to have data for DS at Wave 3 (p = .026). Lastly, Emotion Regulation
Suppression significantly predicted missingness in Wave 3 CAR (c2(1, N = 60) = 8.211, p
= .004), explaining 16.0% (Nagelkerke R2) of the variance in Wave 3 CAR
missingness and correctly classifying 72.7% of cases. Those who reported more
Emotion Regulation Suppression in their survey were 2.474 times more likely to have
data for CAR at Wave 3 (p = .008).
The above missing data analyses suggested that further steps to address
missingness should take place for Study 2. Therefore, Full Information Maximum
Likelihood (FIML) was performed in Mplus v.7 and variables that were related to
88
missingness were used as auxiliary variables to help adjust for missing data (Enders,
2010).
Examining Associations at Wave 1
The first main goal of this study was to investigate whether baseline (Wave 1)
socio-emotional regulatory factors would be associated with concurrent physiological
stress regulation, represented by diurnal cortisol parameters DS and CAR. The
proposed hypothesis (Hypothesis a) was that students’ effortful control and social
support (academic and non-academic) would be positively associated with steeper
cortisol slopes (DS) and larger cortisol awakening responses (CAR). To examine this
hypothesis, multiple regression models predicting Wave 1 DS and Wave 1 CAR were
estimated in Mplus to adjust for missing data using FIML estimation, and covariates
were included in the models to adjust for the diurnal parameter predictions.
Covariates for baseline multiple regressions included Wave 1 Sleep Hours, Sleep
Problems, Medication, Smoking, Stress Events (within 24 hours of saliva collection),
Future Time Perspective Connectedness, Learning-related Hopelessness, Gender,
Minority Status, and Age. A total of six multiple regression analyses were estimated,
one regression model for each main predictor variable (Effortful Control, Academic
Social Support, and Non-academic Social Support) with all covariates included, to
predict Wave 1 DS and Wave 1 CAR respectively.
Multiple regression predicting Wave 1 DS. In a multiple regression model
predicting Wave 1 DS with all hypothesized covariates mean-centered and included, it
was found that holding all covariates constant, Effortful Control did not significantly
89
predict DS at W1 (B = .009, SE = .010, p = .35). In a second multiple regression
model predicting Wave 1 DS, with all hypothesized covariates mean-centered and
included, it was found that holding all covariates constant, Academic Social Support
did not significantly predict DS at Wave 1 (B = .008, SE = .007, p = .28). In this
model, among the covariates, Sleep Hours marginally positively predicted DS at W1,
with each hour increase in Sleep Hour predicting a .008 unit increase in W1 DS (B
= .008, SE = .005, p = .056). In a third multiple regression model predicting Wave 1
DS, with all hypothesized covariates mean-centered and included, it was found that
holding all covariates constant, Non-academic Social Support did not significantly
predict DS at Wave 1 (B = .006, SE = .011, p = .58). Results did not support the
hypothesis for concurrent Social Support and Effortful Control’s positive association
with DS at Wave 1.
Multiple regression predicting Wave 1 CAR. In a multiple regression model
predicting Wave 1 CAR with all hypothesized covariates mean-centered and included,
it was found that holding all covariates constant, Effortful Control did not
significantly predict CAR at W1 (B = -.15, SE = .12, p = .22). In a second multiple
regression model predicting Wave 1 CAR, with all hypothesized covariates mean-
centered and included, it was found that holding all covariates constant, Academic
Social Support did not significantly predict CAR at Wave 1 (B = .001, SE = .093, p
= .99). In a third multiple regression model predicting Wave 1 CAR, with all
hypothesized covariates mean-centered and included, it was found that holding all
covariates constant, Non-academic Social Support marginally negatively predicted
90
CAR at Wave 1 (B = -.23, SE = .13, p = .091), indicating that higher Non-academic
social support was associated with lower CAR at W1. The same model also showed
that Gender marginally positively predicted W1 CAR (B = .23, SE = .14, p = .098),
indicating that female students on average had higher trend of CAR at W1 than their
male counterparts. Results did not support the hypothesis for the positive association
between concurrent Effortful Control and Academic Social Support with CAR at W1;
however, results indicated that Non-academic Social Support was marginally
associated with having lower CAR at W1.
Examining Diurnal Cortisol Patterns Over time
The second main goal of this study was to examine whether the socio-
emotional regulatory factors could predict the fluctuation of well-being, represented
by diurnal cortisol parameters (DS and CAR) over time. Prior to assessing Hypotheses
b) to d), within-individual wave differences across the three waves for CAR and DS
were examined. In order to examine mean-level differences, models mimicking
Repeated-Measures Analysis of Covariance (RM ANCOVA) were used. Typical RM
ANCOVAs were not used because of the need to address missing data and include
Auxiliary variables. In one set of models, covariates were not included and omnibus
differences in diurnal cortisol parameter means over Waves 1-3 were assessed with
Wald tests constraining means equal over time. In another set of models, covariates
were included. Time-invariant covariates included Gender, Race, and Age; time-
variant covariates included Smoking, Medication, Sleep Problems, Sleep Hours,
Stress Events (prior to saliva collections); and Study 1 key variables Wave 1 FTP
91
Connectedness, and Learning-related Hopelessness were also included as covariates.
Auxiliary variables that were not main variables of the study but were found to be
associated with missingness in cortisol data were included in the models, such as
Emotion Regulation Reappraisal and Emotion Regulation Suppression. Mean-level
differences across the three waves were assessed with an omnibus test of differences
in intercepts (means adjusted for covariates) by Wald tests, constraining the intercepts
to be equal. Post-hoc comparisons with Wald tests were used to examine between
wave differences.
Notably, due to limited sample size (N = 67), the full models for DS and CAR
repeated measures assessment resulted in model non-identification. Taking the sample
size and number of parameters into consideration, I excluded covariates that had the
highest p-values from the models to achieve model identification and improve fit. As
a result, only select covariates were included in the final models for DS and CAR
respectively, specified below.
Diurnal cortisol slope differences overtime. Diurnal Cortisol Slope (DS)
differences across waves were examined, with Wave 1 DS regressed on mean-
centered covariates Wave 1 Sleep Hours and Wave 1 Medication, Wave 2 DS
regressed on Gender and Learning-related Hopelessness, and Wave 3 DS regressed on
Future Time Perspective Connectedness and Learning-related Hopelessness.
Auxiliary variables were included (i.e., Wave 1 Emotion Regulation Reappraisal,
Wave 1 Emotion Regulation Suppression, Wave 1 Sleep Problems, Wave 2 Sleep
Problems, Wave 1 Smoking, and Wave 1 Stress Events).
92
The final model yielded good model fit, c2(17, N = 67) = 13.76 (p = .68), RMSEA
= .00 (95% CI: [.00, .09]), CFI = 1.00, and SRMR = .086. The Wald test with
parameter constraints of equal adjusted means (intercepts) for Diurnal Slopes across
all three waves was non-significant (c2(2, N = 67) = 1.14, p = .57), indicating that no
significant mean-level difference was found across the three waves of data. Among
the covariates, Wave 1 Sleep Hours marginally predicted Wave 1 DS, with each hour
increase in sleep resulting in a trend of .006-unit increase in DS (B = .006, SE = .003,
p = .085); Learning-related Hopelessness (LHL) significantly predicted Wave 2 DS,
with each unit increase in LHL yielding a .015-unit decrease in Wave 2 DS (B =
-.015, SE = .007, p = .034); Gender marginally predicted Wave 2 DS, with female
students having a slightly higher Wave 2 DS than males (B = .020, SE = .011, p
= .057); Wave 2 Sleep Hours significantly predicted Wave 2 DS, with each hour
increase in sleep yielding a .008-unit increase in DS at Wave 2 (B = .008, SE = .004, p
= .031); Wave 2 Smoking significantly predicted Wave 2 DS, with smokers having a
lower DS at Wave 2 (B = -.076, SE = .022, p = .001). The total variance explained for
Wave 1 DS was R2 = .06 (p = .28), for Wave 2 DS was R2 = .38 (p < .001), and for
Wave 3 DS was R2 = .06 (p = .37).
Cortisol awakening response differences over time. Cortisol Awakening
Response (CAR) differences between waves were examined, with Wave 1 CAR
regressed on mean-centered covariates Wave 1 Sleep Hours and Gender, Wave 2
CAR regressed on Wave 2 Sleep Problems, Sleep Hours, Medication and Minority
Status, and Wave 3 CAR regressed on Gender and Age. Auxiliary variables were
93
included (i.e., Wave 1 Emotion Regulation Suppression, Wave 1 Stress Events, Wave
2 Stress Events, and Wave 1 Smoking).
The final model yielded fair fit, c2(15, N = 67) = 22.94 (p = .085), RMSEA = .09
(95% CI: [.00, .16]), CFI = .76, and SRMR = .10. The Wald test with parameter
constraints of equal adjusted means (intercepts) for Diurnal Slopes across all three
waves was significant (c2(2, N = 67) = 7.94, p = .019), indicating that a significant mean-
level difference was found across the three waves of data. Among the covariates,
Gender significantly predicted both Wave 1 and Wave 3 CAR, with female students
having higher Wave 1 CAR than male students (B = .29, SE = .13, p = .025), and
again having higher Wave 3 CAR than males (B = .56, SE = .16, p < .001); Wave 1
Sleep Hours significantly predicted Wave 1 CAR, with each hour increase in sleep
resulting in a .12-unit decrease in CAR (B = -.12, SE = .06, p = .035); Minority Status
significantly predicted Wave 2 CAR, with minority students having higher Wave 2
CAR than their White peer (B = .73, SE = .18, p < .001); Wave 2 Sleep Hours
marginally predicted Wave 2 CAR, with each hour increase in sleep resulting in a
trend of .09-unit decrease in CAR (B = -.09, SE = .05, p = .086); Wave 2 Sleep
Problems significantly predicted Wave 2 CAR, with each unit increase in sleep
problems resulting in a .57-unit decrease in CAR (B = -.57, SE = .27, p = .037); Wave
2 Medication significantly predicted Wave 2 CAR, with those who medicated having
a higher CAR at Wave 2 (B =.58, SE = .20, p = .004); and Age significantly predicted
Wave 3 CAR, with each year increase in age associated with an increase in Wave 3
CAR (B = .03, SE = .01, p = .03). The total variance explained for Wave 1 CAR was
94
R2 = .14 (p = .099), for Wave 2 CAR was R2 = .28 (p = .008), and for Wave 3 CAR
was R2 = .21 (p = .033).
Post hoc analyses also using Wald tests showed that on average, adjusting for
covariates and missingness, there was no significant difference (c2(1, N = 67) = 2.28, p
= .13) between the estimated CAR at W1 (M = .29, SD = .06) and CAR at W2 (M
= .16, SD = .08). Post hoc Wald test comparing Wave 1 CAR and Wave 3 CAR (M
= .05, SD = .08) showed that a significant mean-level difference between Wave 1 and
Wave 3 CAR (c2(1, N = 67) = 7.90, p = .005) was found, with CAR at W1 being
significantly greater than that of W3. Lastly, no significant difference was found
between Wave 2 CAR and Wave 3 CAR (c2(1, N = 67) = 1.66, p = .20).
Grouping: Patterns in Diurnal Cortisol over Time
Next, individuals were assigned to groups, according to their diurnal cortisol
patterns over time, and group status was predicted using multinomial logistic
regressions to assess overall diurnal cortisol patterns over the semester in examination
of Hypotheses b) to d). Grouping of participants who showed similar diurnal cortisol
pattern change over time was performed in SPSS. Diurnal cortisol parameters were
split by the median (see Table 13) to create a boundary defining “low” (i.e., below the
median) and “high” (i.e., above the median) levels for each parameter at each wave.
Patterns for diurnal slope over time. The total number of valid participants
assigned for DS groups was 30 out of all 67 participants. Missing group assignments
were largely due to attrition over time, lack of bedtime samples or lack of
documentation of hours awake to complete the DS composite calculation. Among the
95
valid participants, eight patterns were found with regards to the high or low levels of
DS across the three waves, including high-high-high (n = 5), high-high-low (n = 5),
high-low-low (n = 3), high-low-high (n = 3), low-high-high (n = 3), low-low-high (n
= 5), low-high-low (n = 1), and low-low-low (n = 5).
Patterns for cortisol awakening response. The total number of valid
participants assigned for CAR groups was 40 out of all 67 participants. Missing group
assignments were mostly due to attrition over time. Among the valid participants,
eight patterns were found with regards to the high or low levels of CAR across the
three waves, including high-high-high (n = 9), high-high-low (n = 5), high-low-low (n
= 5), high-low-high (n = 3), low-high-high (n = 2), low-low-high (n = 5), low-high-
low (n = 4), and low-low-low (n = 7).
Group status for diurnal cortisol patterns. In order to reduce pattern groups
to maximize the participant number in each group for prediction of patterns over time,
patterns high-high-low, high-low-low, and low-high-low were combined as one group
to represent a flattening effect of diurnal cortisol over the semester, specifically
towards the end of the semester. Patterns high-low-high, low-high-high, and low-low-
high were combined as one group to represent recovery in diurnal cortisol levels over
the semester, specifically towards the end of the semester. High-high-high and low-
low-low were kept as individual groups to represent stably high and stably low
patterns respectively.
Notably, as can be seen by the frequencies cross tabulated in Table 18, there
was no significant association between patterns for DS over time and patterns for
96
CAR over time, c2 (49, n = 30) = 43.97, p = .68. Given this information, in addition to the
overall non-positive relations between concurrent DS and CAR (see Table 14), it was
indicative that DS and CAR levels likely characterized stress regulation in a different
manner. Consequently, the hypothesized group names (e.g., healthy, exam-stress,
exhausted groups) for this study that were rather rigid across DS and CAR, and that
were suggestive of positive or negative well-being according to how the patterns
fluctuated for both DS and CAR, were not assigned to the groups. Instead, I referred
to the groups as Chronic-high, Recovery, Flattening, and Chronic-low groups for
both DS patterns over time and CAR patterns over time, which depicted the
fluctuation of the levels over time for each diurnal cortisol parameter, rather than
associating positive or negative denotation for well-being according to the direction of
fluctuation.
As a result, for DS patterns over time (n = 30), five participants were in the
Chronic-high group (16.7%), 11 participants were in the Recovery group (36.7%),
nine participants were in the Flattening group (30.0%), and five participants were in
the Chronic-low group (16.7%). CAR patterns over time (n = 40) resulted in nine
participants in the Chronic-high group (22.5%), 10 participants in the Recovery group
(25.0%), 14 participants in the Flattening group (35.0%), and seven participants in the
Chronic-low group (17.5%).
Predicting Diurnal Cortisol Patterns over Time
Covariates. In order to build predictive multinomial logistic regression
models that would efficiently work for the sample size in this study, I examined the
97
covariates in predicting group status prior to including key variables of the study into
the models. A full model with all covariates was assessed.
For DS group status (n = 30), among the time-invariant variables, Gender
marginally predicted DS group status, with female students having a 4.17 increase in
the relative log odds of being in the Recovery group vs. Chronic-low group,
indicating that it was 64.77 times more likely for female students compared to male
students to be in the Recovery group compared to the Chronic-low group (p = .078)
for DS patterns over time. In addition, female students had a 3.87 increase in the
relative log odds of being in the Flattening group vs. Chronic-low group, indicating
that it was 48.10 times more likely for female students compared to male students to
be in the Flattening group compared to the Chronic-low group (p = .092) for DS
patterns over time. Wave 1 Future Time Perspective Connectedness (FTPC)
marginally predicted DS group status, with FTPC associated with a 3.16 decrease in
the relative log odds of being in the Recovery group vs. the Chronic-low group,
indicating that it was 4.2% less likely for students to be in the Recovery group vs. the
Chronic-low group with each unit increase in FTPC at Wave 1 (p = .085) for DS
patterns over time.
With regard to CAR group status (n = 40), adjusting for all covariates, Gender
significantly predicted CAR group status, with female students having a 5.25 increase
in the relative log odds of being in the Recovery group vs. the Chronic-low group,
indicating that it was 190.31 times more likely for female students compared to male
students to be in the Recovery group compared to the Chronic-low group (p = .019).
98
Wave 1 FTPC marginally predicted CAR group status, with FTPC associated with a
6.54 increase in the relative log odds of being in the Chronic-high group vs. the
Chronic-low group, indicating that it was 691.70 times more likely for students to be
in the Chronic-high group vs. the Chronic-low group with each unit increase in FTPC
at Wave 1 (p = .095) for CAR patterns over time. Wave 1 Sleep Hours marginally
predicted CAR group status, with Sleep Hours associated with a 2.92 increase in the
relative log odds of being in the Recovery group vs. the Chronic-low group,
indicating that it was 18.44 times more likely for students to be in the Recovery group
vs. the Chronic-low group with each hour increase in Sleep Hours at Wave 1 (p
= .068) for CAR patterns over time.
All covariates that were significant or marginally significant in predicting
group statuses were entered in multinomial logistic regressions for DS and CAR
group respectively. Covariates that yielded p-values > .10 in predicting group statuses
were excluded from the multinomial logistic regression models to accommodate for a
balance between number of estimated parameters and the small sample sizes of this
study.
Regulatory factors: Effortful Control and Social Support. To examine
Hypothesis b), that students’ socio-emotional regulation such as effortful control and
social support (academic and non-academic) would predict a healthier or more
adaptive diurnal cortisol pattern over time, multinomial logistic regressions were
performed to predict group status for DS (n = 30) and CAR (n = 40) in Mplus, and
FIML was used to adjust for missing data.
99
Effortful Control. In a model with only the main variable Effortful Control as
the predictor variable (no covariates), results showed that Effortful Control did not
significantly predict DS group status, with non-significance for Chronic-high vs.
Chronic-low (B = 1.40, SE = 1.43, p = .33), Recovery vs. Chronic-low (B = -1.20, SE
= 1.00, p = .23), and Flattening vs. Chronic-low (B = -.46, SE = 1.03, p = .65). In a
model adjusting for covariates Gender and FTP Connectedness, results again showed
that Effortful Control did not significantly predict DS group status, with non-
significance for Chronic-high vs. Chronic-low (B = 1.71, SE = 1.67, p = .31),
Recovery vs. Chronic-low (B = -.98, SE = 1.15, p = .39), and Flattening vs. Chronic-
low (B = -.29, SE = 1.21, p = .81).
In a model with only the main variable Effortful Control as the predictor
variable (no covariates), results showed that Effortful Control did not significantly
predict CAR group status, with non-significance for Chronic-high vs. Chronic-low (B
= .112, SE = .90, p = .90), Recovery vs. Chronic-low (B = .95, SE = .92, p = .30), and
Flattening vs. Chronic-low (B = .37, SE = .82, p = .65). In a model adjusting for
covariates Gender, FTP Connectedness, and Wave 1 Sleep Hours, results again
showed that Effortful Control did not significantly predict CAR group status, with
non-significance for Chronic-high vs. Chronic-low (B = .49, SE = 1.16, p = .67),
Recovery vs. Chronic-low (B = 1.37, SE = 1.11, p = .22), and Flattening vs. Chronic-
low (B = .69, SE = .87, p = .42).
Academic Social Support. In a model with only the main variable Academic
Social Support as the predictor variable (no covariates), results showed that Academic
100
Social Support did not significantly predict DS group status, with non-significance for
Chronic-high vs. Chronic-low (B = .37, SE = 1.02, p = .72), Recovery vs. Chronic-
low (B = -.28, SE = .84, p = .74), and Flattening vs. Chronic-low (B = -.19, SE = .87,
p = .83). In a model adjusting for covariates Gender and FTP Connectedness, results
again showed that Academic Social Support did not significantly predict DS group
status, with non-significance for Chronic-high vs. Chronic-low (B = .42, SE = 1.05, p
= .69), Recovery vs. Chronic-low (B = -.22, SE = .88, p = .81), and Flattening vs.
Chronic-low (B = -.18, SE = .92, p = .84).
In a model with only the main variable Academic Social Support as the
predictor variable (no covariates), results showed that Academic Social Support did
not significantly predict CAR group status, with non-significance for Chronic-high vs.
Chronic-low (B = -.36, SE = .86, p = .67), Recovery vs. Chronic-low (B = -.66, SE
= .83, p = .43), and Flattening vs. Chronic-low (B = -.53, SE = .79, p = .50). In a
model adjusting for covariates Gender, FTP Connectedness, and Wave 1 Sleep Hours,
results again showed that Academic Social Support did not significantly predict CAR
group status, with non-significance for Chronic-high vs. Chronic-low (B = -.25, SE
= .98, p = .80), Recovery vs. Chronic-low (B = -.43, SE = .99, p = .66), and Flattening
vs. Chronic-low (B = -.46, SE = .82, p = .58).
Non-academic Social Support. In a model with only the main variable Non-
academic Social Support as the predictor variable (no covariates), results showed that
Non-academic Social Support did not significantly predict DS group status, with non-
significance for Chronic-high vs. Chronic-low (B = 1.22, SE = 1.74, p = .48),
101
Recovery vs. Chronic-low (B = 2.59, SE = 1.73, p = .14), and Flattening vs. Chronic-
low (B = .02, SE = 1.34, p = .99). In a model adjusting for covariates Gender and FTP
Connectedness, results again showed that Non-academic Social Support did not
significantly predict DS group status, with non-significance for Chronic-high vs.
Chronic-low (B = 1.17, SE = 1.84, p = .53), Recovery vs. Chronic-low (B = 2.29, SE =
1.80, p = .20), and Flattening vs. Chronic-low (B = -.08, SE = 1.53, p = .96).
In a model with only the main variable Non-academic Social Support as the
predictor variable (no covariates), results showed that Non-academic Social Support
did not significantly predict CAR group status, with non-significance for Chronic-
high vs. Chronic-low (B = -.73, SE = 1.76, p = .68), Recovery vs. Chronic-low (B = -
1.50, SE = 1.64, p = .36), and Flattening vs. Chronic-low (B = -2.14, SE = 1.58, p
= .18). In a model adjusting for covariates Gender, FTP Connectedness, and Wave 1
Sleep Hours, results again showed that Non-academic Social Support did not
significantly predict CAR group status, with non-significance for Chronic-high vs.
Chronic-low (B = -1.00, SE = 2.48, p = .69), Recovery vs. Chronic-low (B = -2.37, SE
= 2.36, p = .32), and Flattening vs. Chronic-low (B = -3.23, SE = 2.27, p = .16).
Future Time Perspective Value and Effortful Control. To examine
Hypothesis c), that students who have high effortful control (EC) and high future time
perspective value (FTPV) would display healthier patterns of diurnal cortisol change
over time, whereas high FTPV and low EC would be associated with less than ideal
patterns in diurnal cortisol over the semester, multinomial logistic regressions with an
102
interaction term of the two main variables were performed to predict group status of
DS (n = 30) and CAR (n = 40), and FIML was used to adjust for missing data.
Interaction effect predicting DS groups. No significant interaction effect was
found between FTPV and Effortful Control in predicting DS group status. In a model
with main variables only (FTPV, EC, and their interaction term [formed by mean-
centering and multiplying the two main variables]), results showed non-significance
in the interaction term coefficient for Chronic-high vs. Chronic-low (B = 2.72, SE =
2.64, p = .34), Recovery vs. Chronic-low (B = .88, SE = 1.81, p = .63), and Flattening
vs. Chronic-low (B = .29, SE = 1.80, p = .87). After adjusting for covariates Gender
and FTP Connectedness, results again showed non-significance in the interaction term
coefficient for Chronic-high vs. Chronic-low (B = 3.75, SE = 3.20, p = .24), Recovery
vs. Chronic-low (B = .63, SE = 2.06, p = .76), and Flattening vs. Chronic-low (B =
-.27, SE = 2.15, p = .90).
Interaction effect predicting CAR groups. No significant interaction effect
was found between FTP Value and Effortful Control in predicting CAR group status.
In a model with main variables only (FTPV, EC, and their interaction term), results
showed non-significance in the interaction term coefficient for Chronic-high vs.
Chronic-low (B = -.28, SE = 1.70, p = .87), Recovery vs. Chronic-low (B = .67, SE =
1.67, p = .69), and Flattening vs. Chronic-low (B = .30, SE = 1.48, p = .84). After
adjusting for covariates Gender, FTP Connectedness, and Wave 1 Sleep Hours, results
again showed non-significance in the interaction term coefficient for Chronic-high vs.
103
Chronic-low (B = -.88, SE = 2.21, p = .69), Recovery vs. Chronic-low (B = .40, SE =
1.85, p = .83), and Flattening vs. Chronic-low (B =.057, SE = 1.54, p = .97).
Future Time Perspective Value and Social Support. To examine
Hypothesis d), that students who have high social support and high FTPV would
display healthier patterns of diurnal cortisol change over time, whereas high FTPV
and low social support would be associated with less than ideal patterns in diurnal
cortisol over the semester, multinomial logistic regressions with interaction terms of
the main variables were performed to predict group status of DS (n = 30) and CAR (n
= 40), and FIML was used to adjust for missing data.
Interaction effect predicting DS groups. No significant interaction effect was
found between FTP Value and Academic Social Support in predicting DS group
status. In a model with main variables only (FTPV, Academic Social Support, and
their interaction term [formed by mean-centering and multiplying the two main
variables]), results showed non-significance in the interaction term coefficient for
Chronic-high vs. Chronic-low (B = 2.72, SE = 2.64, p = .34), Recovery vs. Chronic-
low (B = .88, SE = 1.81, p = .63), and Flattening vs. Chronic-low (B = .29, SE = 1.80,
p = .87). After adjusting for covariates Gender and FTP Connectedness, results again
showed non-significance in the interaction term coefficient for Chronic-high vs.
Chronic-low (B = .069, SE = 2.17, p = .98), Recovery vs. Chronic-low (B = -1.32, SE
= 1.79, p = .46), and Flattening vs. Chronic-low (B = -1.92, SE = 1.81, p = .29).
No significant interaction effect was found between FTP Value and Non-
academic Social Support in predicting DS group status. In a model with main
104
variables only (FTPV, Non-academic Social Support, and their interaction term),
results showed non-significance in the interaction term coefficient for Chronic-high
vs. Chronic-low (B = -.91, SE = 3.49, p = .80), Recovery vs. Chronic-low (B = 10.87,
SE = 7.96, p = .17), and Flattening vs. Chronic-low (B = .12, SE = 2.87, p = .97).
After adjusting for covariates Gender and FTP Connectedness, results again showed
non-significance in the interaction term coefficient for Chronic-high vs. Chronic-low
(B = -1.16, SE = 3.50, p = .74), Recovery vs. Chronic-low (B = 11.13, SE = 8.83, p
= .21), and Flattening vs. Chronic-low (B = -.31, SE = 3.14, p = .92).
Interaction effect predicting CAR groups. In a model with main variables
only (FTP Value, Academic Social Support, and their interaction term), results
indicated that there was a marginally significant interaction effect between FTP Value
and Academic Social Support in predicting CAR group status when comparing the
Flattening group and the Chronic-low group in CAR patterns over time. The main
effects for FTP Value (B = -1.87, SE = 1.36, p = .17) and Academic Social Support (B
= -1.33, SE = 1.06, p = .21) were not statistically significant; however, the marginally
positive interaction effect (B = 3.25, SE = 1.82, p = .073) indicated that there was a
trend in those who were high in both FTP Value and Academic Social Support being
25.86 times more likely to be in the Flattening group vs. the Chronic-low group for
CAR patterns over time. After adjusting for covariates Gender, FTP Connectedness,
and Wave 1 Sleep Hours, results showed that the a marginally significant interaction
effect between FTP Value and Academic Social Support in predicting CAR group
status remained. Again, when comparing the Flattening group and the Chronic-low
105
group, the main effects for FTP Value (B = -2.07, SE = 1.59, p = .19) and Academic
Social Support (B = -1.71, SE = 1.31, p = .19) were not statistically significant;
however, the marginally positive interaction effect (B = 3.71, SE = 2.21, p = .094)
indicated that there was a trend in those who were high in both FTP Value and
Academic Social Support being 40.72 times more likely to be in the Flattening group
vs. the Chronic-low group for CAR patterns over time.
No significant interaction effect was found between FTP Value and Non-
academic Social Support in predicting CAR group status (interaction term formed by
mean-centering and multiplying the two variables). Results showed non-significance
in the interaction term coefficient for Chronic-high vs. Chronic-low (B = -.95, SE =
3.85, p = .81), Recovery vs. Chronic-low (B = 3.32, SE = 3.89, p = .39), and
Flattening vs. Chronic-low (B = 1.87, SE = 3.46, p = .59). After adjusting for
covariates Gender, FTP Connectedness, and Wave 1 Sleep Hours, results again
showed non-significance in the interaction term coefficient for Chronic-high vs.
Chronic-low (B = -2.05, SE = 4.66, p = .66), Recovery vs. Chronic-low (B = 3.41, SE
= 4.63, p = .46), and Flattening vs. Chronic-low (B = 1.32, SE = 4.02, p = .74).
Discussion
The overall objective of this study was to better understand changes in
students’ diurnal cortisol pattern over the course of a semester. Specifically, I worked
to explore the roles of socio-emotional regulatory variables, such as emotion-related
self-regulation Effortful Control (Evans & Rothbart, 2007), and social support,
including Academic and Non-academic Social Support (Pierce et al., 1991), in
106
conjunction with the value a student puts in a future goal (Future Time Perspective
Value; Husman & Shell, 2008), in predicting changes in students’ diurnal cortisol
over the course of a semester. According to previous studies (e.g., McGregor,
Murphy, Albano, & Ceballos, 2016) and the hypotheses of this study, diurnal cortisol
slope (DS) and cortisol awakening response (CAR) decreases over time for those who
experience chronic stress. This study tested whether future-oriented motivation and
socio-emotional regulatory factors could jointly predict the status of students’ well-
being represented by a sustained or flattened diurnal cortisol pattern.
Baseline Associations at the Beginning of the Semester
The first aim of this study was to examine whether baseline (Wave 1) socio-
emotional regulatory factors (Effortful Control, Academic Social Support, and Non-
academic Social Support) would be associated with concurrent physiological stress
regulation, represented by diurnal cortisol parameters – DS and CAR, at the beginning
of a semester. The study hypothesis was that baseline DS and CAR would be
positively associated with Effortful Control, Academic Social Support, and Non-
academic Social Support (Ha). Findings indicated that Non-academic Social Support
was marginally associated with baseline CAR, with Non-academic Social Support
negatively associated with CAR at the beginning of the semester. The direction of this
finding was not consistent with the original hypothesis or previous literature that
delineates the positive relation between social support or social connection with
higher CAR (e.gs., Pinto et al., 2016; Sladek & Doane, 2015; Stetler & Miller, 2005).
However, the direction of the finding is consistent with Study 1 findings, as well as
107
previous literature that suggest the day-of anticipatory stress (Fries et al., 2009) and
perceived stress (Pruessner et al., 1999) implications of CAR. In other words,
according to past literature that investigated in normative samples, i.e., samples that
did not have clinical conditions (such as depressive or anxiety disorders, e.g., Stetler
& Miller, 2005) or traumatic life experiences (such as early adversity or inter-partner
violence, e.g., Pinto et al., 2016), CAR can be representative of day-to-day
anticipatory stress, or a more momentary excerpt of one’s well-being.
The current finding thus is implicative that Non-academic Social Support, the
support students obtain from social friends, coworkers, family, or their romantic
partner is helpful in lowering anticipatory academic stress; and those who have lower
Non-academic Social Support may experience higher anticipatory academic stress.
This speculation is supported by a meta-analysis conducted by Chida and Steptoe
(2009), delineating that increased CAR has been associated with general life stress,
which consisted of low social support.
The study, however, did not show support for the positive associations
between baseline diurnal cortisol parameters (DS or CAR) and the proposed socio-
emotional regulatory factors Effortful Control and Academic Social Support. Previous
studies have shown that steeper DS (awakening and evening difference) was related to
concurrent social support, general health, and well-being (Sjögren et al., 2006).
Current findings did not support this line of research.
108
Socio-emotional Regulatory Factors and Diurnal Cortisol Patterns
The second aim of this study was to examine whether socio-emotional
regulation such as Effortful Control (an emotion-related regulatory construct) and
Social Support (academic and non-academic) would predict a healthier or more
adaptive diurnal cortisol pattern over time. It was hypothesized that constructs such as
Effortful Control (EC) and Social Support (SS) would be beneficial in sustaining a
steep DS and large CAR in post-secondary university students over the three waves of
data collection throughout a semester (Hb). Findings indicated that groups of students
with differential diurnal cortisol pattern change over time could be formed, indicating
presence of individual differences in students’ diurnal cortisol profiles over the course
of a semester. Overall, students were placed in Chronic-high, Recovery, Flattening,
and Chronic-low groups. However, both EC and SS did not uniquely predict the
groups that students were in. Given the complexity and costliness of diurnal cortisol
research, past literature has provided scare evidence with regard to multiple-wave
assessments of diurnal cortisol patterns over time.
Predicting Diurnal Cortisol Patterns: FPT Value and Effortful Control
The next aim of the study was to examine whether Future Time Perspective
Value interacted with Effortful Control in predicting diurnal cortisol pattern change
over time. It was hypothesized that if students place high value in a future goal with
regards to the class they are taking, Effortful Control (an emotion-related self-
regulatory construct) may be important for one to continue to strive and maintain
well-being (indicated by DS and CAR) until the end of the semester (Hc). Results
109
showed that FTPV and Effortful Control did not jointly predict diurnal cortisol pattern
change over time. This study is the first to examine FTPV and Effortful Control’s
joint prediction in well-being.
Predicting Diurnal Cortisol Patterns: FTP Value and Social Support
The last aim of the study was to examine whether Future Time Perspective
Value interacted with the socio-emotional regulatory factors in predicting diurnal
cortisol pattern change over time. It was hypothesized that if students place high value
in a future goal with regards to the class they are taking, Social Support (both
Academic and Non-academic) may be important for one to continue to strive and
maintain well-being (indicated by DS and CAR) until the end of the semester (Hd).
Results showed that FTPV and Academic Social Support had a trend in jointly
predicting CAR patterns over a semester. High on both FTPV and Academic Social
Support predicted higher likelihood in having a pattern of switching from high to low
CAR towards the end of the semester, compared to those who had low CAR
throughout the semester. There was no evidence of Non-academic Social Support and
FTPV jointly predicting DS or CAR pattern change over the semester.
The findings are unique in examining the joint effects of FTPV and Academic
Social Support in predicting CAR. Notably, it is important to recognize the
interpretation of CAR of this study, which plausibly represents anticipatory stress of
the day and short-term well-being. Given this understanding, the joint effect of
Academic Social Support and FTPV predicting the higher likelihood of students being
the Chronic-low CAR group, compared to the group that had higher CAR at the end
110
of the semester, indicates that both future-oriented motivation and domain-specific
social support were helpful for students to regulate their daily stress and well-being
over the course of a semester.
Strengths and Implications
This study is consistent with Study 1 in its interpretation of CAR as an
anticipatory (or daily) stress indicator in the post-secondary educational context.
Moreover, the study is an extension of Study 1 by two-folds. First of all, it goes
beyond the scope of Study 1 in terms of time span. The study contributes to the scarce
literature of research on longitudinal assessments of multiple-wave diurnal cortisol
patterns within the educational context.
Secondly, the study emphasizes the role of regulatory resources in predicting
diurnal cortisol pattern change over time, in conjunction with future-oriented
motivation. It provides support for Dodge and colleagues’ (2012) model for well-
being, in that dynamic well-being is balance by psychological, physical and social
resources.
Lastly, this study provides theoretical implications in expansion of Control
Value Theory. In line with Control Value Theory, the current findings suggest that
Future Time Perspective Value could be provide students with the subjective value for
completing academic tasks, whereas regulatory resources such as Academic Social
Support could supply students with more subjective control over their academic tasks,
thus jointly contributing to their emotional experience and physiological well-being.
111
Limitations, and Directions for Future Research
The study was limited in sample size. The lack of a larger sample has
impacted the power and interpretability of the data. Future studies should be
conducted with a larger sample size to better generalize to the university population.
Specifically, to support theory and hypotheses of this study, many of the statistical
models would require a larger sample to include and adjust for all hypothesized
covariates that could potentially influence the cortisol data. Without a sufficient
sample size, the final statistical models were limited to adjusting for only the most
potent covariates. Moreover, a larger sample size would allow for analytic methods
that more fully explore the longitudinal changes in well-being.
It may be helpful to examine other constructs pertaining to emotion regulation
in predicting diurnal cortisol patterns, such as emotion reappraisal and emotion
suppression (Gross & John, 2003). Constructs that directly assess strategies used for
emotion regulation may be more relevant for predicting diurnal cortisol patterns, that
are often indicative of one’s emotional and physiological well-being (Lam, 2012), and
potentially better measures of the emotional-regulatory resource that this study was
designed to examine.
With regard to salivary cortisol data, it would be useful for future studies to
adjust the cortisol windsorizing value from an absolute value of 1.81 µg/dL to a
cutting point of 2.5 or 3 SDs away from the mean (Granger et al., 2007; Marceau et
al., 2013; Miller et al., 2017; Saridjan et al., 2014; Schlotz, 2011), since recent studies
show that there have been many cases of participants having levels of cortisol that are
112
greater than 1.81 µg/dL (e.gs., Harden et al., 2016; Kim et al., 2014). This method
could help retain data points, and increase the accountable variability in cortisol data.
Future studies could also explore relations between socio-emotional factors
and diurnal cortisol area under the curve (AUC, which captures the overall secretion
of cortisol over a day), in addition to the diurnal cortisol parameters DS and CAR. By
including AUC alongside DS and CAR in assessing diurnal cortisol over time,
researchers can have a more comprehensive picture of the properties of each diurnal
cortisol parameter in terms of temporal meaning and better locate relevant socio-
emotional factors in predicting students’ well-being (Granger et al., 2012).
Finally, it would be meaningful for future research to address gender and
minority status differences with regard to the predictions of student well-being. The
current study found that there are differential responses in cortisol levels and diurnal
cortisol patterns, and slightly differential attrition rates in cortisol data for students of
different demographic backgrounds. Future studies (with a sufficient sample size and
reduced attrition rate) that examine the precursors of these differences in well-being
research could be beneficial for post-secondary university students of diverse
backgrounds.
113
GENERAL DISCUSSION
Built upon Control Value Theory, the overarching goals of this dissertation
were to strengthen well-being research in the educational context with the support of
diurnal cortisol parameters, and to provide empirical evidence that could be
informative to current educational theory. Students in the post-secondary educational
context are undergoing crucial stages of their lives. A good portion of literature in
post-secondary education has been focused on learning and cognitive processes. Not
until recent decades has the field begun to acknowledge the importance of university
students’ socio-emotional experience and the important role of well-being in students’
academic journey (Nelson et al., 2015; Swaner, 2007).
Findings from Study 1 suggest that future-oriented motivation (Future Time
Perspective Connectedness) is associated with lower anticipatory stress represented
by the cortisol awakening response (CAR) around university students’ mid-term
examination. Findings from Study 2 suggest that Non-academic Social Support is
associated with lower anticipatory stress (represented by CAR) at the beginning of a
semester; and that Academic Social Support and future-oriented motivation (Future
Time Perspective Value) jointly predict a higher likelihood in having decreased
anticipatory stress (represented by CAR) toward the end of a semester.
Both studies included findings of FTP Connectedness, an operationalization of
student’s tendency of planning for and thinking about the future, in relation to diurnal
cortisol parameters. In Study 1, FTP Connectedness, was helpful in the recovery of
momentary well-being represented by CAR; in Study 2, FTP Connectedness was
114
associated with the non-recovery of the diurnal cortisol slope (DS), which was a
relatively stable construct, arguably indicative of chronic well-being .
The two distinct but complementary studies in this dissertation contribute to
the field in two major ways. First of all, the studies link Future Time Perspective with
the experience of academic stress. Secondly, results suggest that socio-emotional
regulatory factors such as Social Support may be important to help the recovery of
well-being, given high future-oriented motivation within the academic context.
The findings of this dissertation were inconsistent with initially proposed
study hypotheses, with regard to lack of significance in the predictions for diurnal
cortisol slope, and with regard to the directionality of predictions for cortisol
awakening response over time. However, given the scope of the studies, the main
findings jointly contribute to current literature, and are informative of research in the
future, with both theoretical and practical implications.
Theoretical Implications
Future Time Perspective and well-being. So far, few studies have explored
the role Future Time Perspective (FTP) has with regard to well-being in the
educational context. Webster and Ma (2013) found that having a balanced time
perspective, i.e., having positive thoughts and feeling about both the past and future,
was predictive of subjective well-being in adults, assessed by their happiness and
satisfaction with life. Notably, this line of research (Webster & Ma, 2013) focused on
the cognitive components of well-being and did not address affective or physiological
components of well-being.

115
The current dissertation examines the roles future-oriented motivation
subscales, Future Time Perspective Connectedness and Future Time Perspective
Value (Husman & Shell, 2008), play in predicting students’ well-being. The two
studies emphasize the cognitive-motivational features of future time perspective, and
is innovative in associating the anticipatory functions of FTP with anticipatory stress
represented by cortisol awakening responses.
Notably, in Study 1, FTP Connectedness was associated with the recovery of
momentary stress represented by CAR; and in Study 2, findings indicated that FTP
Connectedness was associated with the non-recovery of DS over the course of a
semester, which could be associated with chronic stress. Given these different
temporal implications of the diurnal cortisol parameters, it may be important for
future research to explore the temporal specificity of how FTP constructs are
associated with stress physiology and well-being. It is plausible that DS recovery over
a course of the semester would also require regulatory resources, given high FTP
Connectedness, to sustain one’s well-being over time.
Expansion of Control Value Theory. Drawing from Control Value Theory
(Pekrun, 2006), the two studies in this dissertation examine university students’ well-
being within the academic context, addressing cognitive, affective, motivational, and
physiological components of students’ experiences. The findings from the two studies
explore constructs that have not been addressed in Control Value Theory before. In
particular, the current studies examine students’ future-oriented motivation and
regulatory resources in predicting their academic-related experiences on multiple
116
facets, including all four components suggested by Control Value Theory that are
related to students’ academic-related emotional experience.
Specifically, reduced CAR predicted by future-oriented motivational
constructs and social-regulatory constructs imply that these predictors are useful in
regulating students’ academic stress and their HPA axis for them to continue pursuing
their academic goals. Particularly, the anticipatory nature of future time perspective
could drive students’ emotional experiences that are also anticipatory in nature
(Pekrun et al., 2014), in turn affecting students’ physiological responses. It is
plausible that 1) Future Time Perspective Value is important in contributing to
students’ subjective value in academic-related tasks, motivating students to regard
future goals as meaningful and valuable, and to strive for these goals; 2) Future Time
Perspective Connectedness helps students stay connected to their future goals,
contributing to their subjective control over academic-related tasks; and 3) Social
Support is helpful in contributing to students’ subjective control over stressful
academic tasks by increasing students’ sense of social resourcefulness. These findings
have important theoretical implications in that it calls for incorporation of future-
oriented motivational constructs and social-regulatory constructs as appraisal
antecedents into the Control Value Theory.
Notably, the studies in this dissertation have been proposed to examine
students’ chronic well-being, thus the hypothesis with regard to Learning-related
Hopelessness, which was arguably associated with a more chronic academic
experience. Findings, however, showed that momentary well-being could be assessed
117
by diurnal cortisol parameter CAR. Given the importance of temporal specificity and
the non-significance with Learning-related Hopelessness, it would be worthy to bring
the attention of researchers to other discrete academic-related emotions that are
anticipatory in nature as well (which could also be associated with future-oriented
motivation and diurnal cortisol parameters, such as Learning-related Hope); also, it
would be important to explore different academic domains, such as test-related
academic emotions and classroom-related academic emotions, in addition to learning-
related academic emotions, for future research.
Practical Implications
The dissertation informs educators and policy makers in two main ways. First
of all, the importance of students’ future-oriented motivation cannot be overlooked.
Specifically, it may be helpful to develop interventions or built-in classroom curricula
that enhance post-secondary students’ FTP, for example, curriculum that emphasizes
students’ future goal and plans to achieve that future goal, which could have an
influence on students’ well-being and academic experience.
Secondly, it may be useful to give attention to students’ social support.
Specifically, non-academic and academic social support may both be important for
university students’ well-being (especially for Engineering students, who are the
participants of the dissertation studies). To enhance students’ well-being and
academic experience in the university, it may be beneficial for academic programs (in
particular Engineering programs) to build infrastructures for social support within the
academic environment. It may be equally important for university counselors or
118
academic advisors to attend to students’ non-academic social network as well. Special
attention should be given to non-traditional students, for example, female students or
students of minority status in the engineering departments, as they may experience
less scaffolding in the academic environment or have less practical support from their
home environments (Martin, Simmons, & Yu, 2013), which could have negative
implications on their well-being.
Strengths, Limitations, and Directions for Future Research
The main strengths of this dissertation include the combination of self-
reported survey data with objective salivary biomarker data, the assessment of
educational data in ecological academic settings (e.g., in real life academic stress
periods), and the examination of longitudinal assessments of diurnal cortisol. These
strengths are particularly significant in the field of educational research. For example,
the survey and salivary data students provide prior to or during a stressful academic
period could be more authentic compared to data collected via experimentally
manipulated laboratory stress, such as implementing the Trier Social Stress Task
(Kirschbaum, Pirke, & Hellhammer, 1993), or via experimental simulations of
academic stress.
Both studies presented here, however, have significant limitations. The
primary limitation is sample size. Salivary studies in the educational context typically
have smaller samples (N = 20-60) (e.gs., Hewig et al., 2008; McGregor et al., 2016;
Spangler et al., 2002) compared to the typical large sample size of educational
research studies which focus on survey methods (e.g., Pekrun et al., 2011). This set of
119
studies sought to combine survey and salivary methods. The trends found within both
studies provide are interesting, however, to interpret these findings larger samples are
required.
Limitation in sample size posed restrictions in adjusting for critical covariates
that are associated with diurnal cortisol fluctuation due to lack of model identification.
In addition, larger samples could provide greater statistical power, and allow for
advanced statistical analyses to be conducted (such as multivariate modeling or
growth mixture modeling), which could account for more variance in the diurnal
cortisol pattern change over time, to make reliable and valid statistical inferences.
Further, to bridge the implications of the two studies, future research that include key
variables from both studies tested under the specific time spans of each study may be
helpful to integrate the research questions.
Consequently, future collaboration between salivary bioscience researchers
and educational researchers are required to 1) consider the most effective methods for
retaining participants in interdisciplinary ecological longitudinal studies and 2) reduce
the fiscal limitations of the studies.
Future research that examines diurnal cortisol patterns (diurnal cortisol slope,
cortisol awakening response, as well as area under the curve [AUC]; Granger et al.,
2012) in relation with discrete academic-related emotions, such as enjoyment, anger,
anxiety, and shame (Pekrun et al., 2011; Pekrun et al., 2014) would provide additive
meaning to this line of research. Lastly, it would also be beneficial to assess
situational motivational, emotional, and regulatory constructs associated with the
120
different diurnal cortisol parameters, as well as address the potential bidirectional
influences in diurnal cortisol patterns and students’ well-being.
Conclusion
In sum, this dissertation provides an integral outlook of post-secondary
students’ well-being represented by diurnal cortisol patterns with regard to their
future-oriented motivation, academic-related emotion, and socio-emotional
regulation. Study interpretations are limited by the sample sizes of both studies.
However, findings provide innovative implications for educational theories,
specifically, for Future Time Perspective Theory (Lens et al., 2012) and Control
Value Theory (Pekrun, 2006; Pekrun et al., 2009). Future research that resolves
current limitations are required. Findings also have practical implications, such as
informing educators and policy makers to attend to interventions and curriculum-
building that address the importance of students’ future time perspective and social
support, which could enhance students’ well-being and academic experience. Notably,
the current studies add to diurnal cortisol research with its ecological assessments
within the educational context. The explorations of current studies are important in
weaving past and future interdisciplinary research that aim to address and enhance
university students’ well-being.
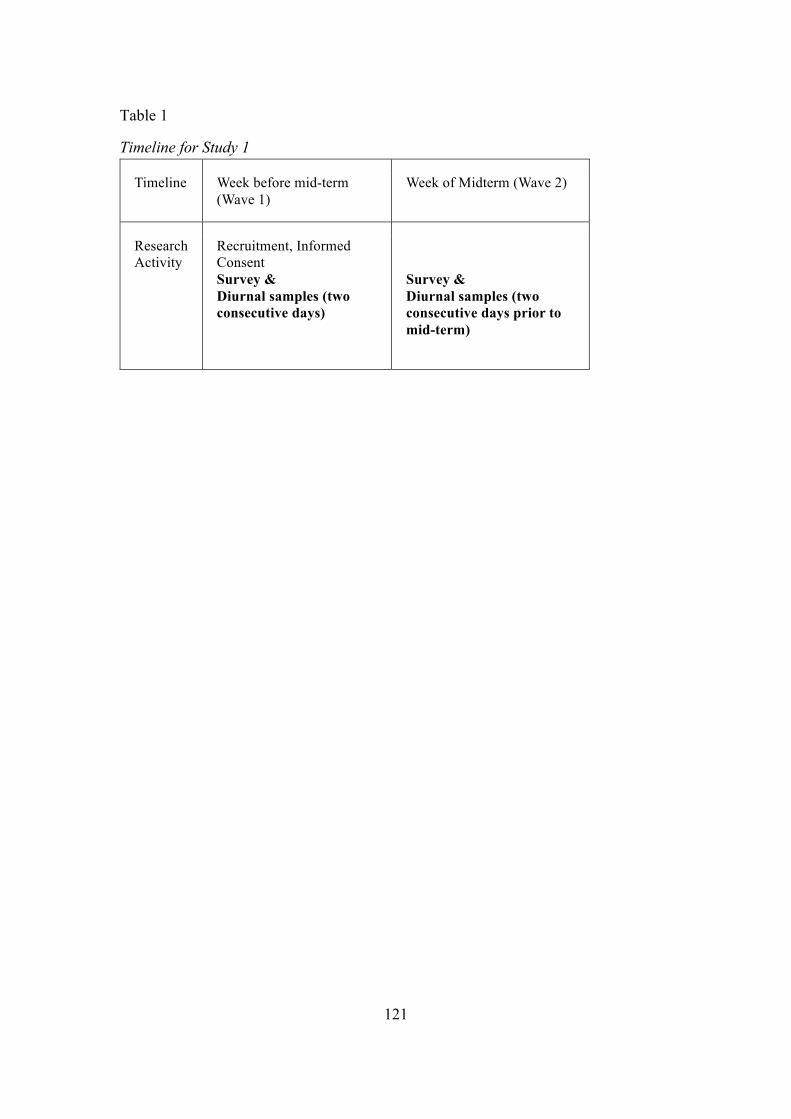
121
Table 1
Timeline for Study 1
Timeline Week before mid-term (Wave 1)
Week of Midterm (Wave 2)
Research Activity
Recruitment, Informed Consent Survey & Diurnal samples (two consecutive days)
Survey & Diurnal samples (two consecutive days prior to mid-term)
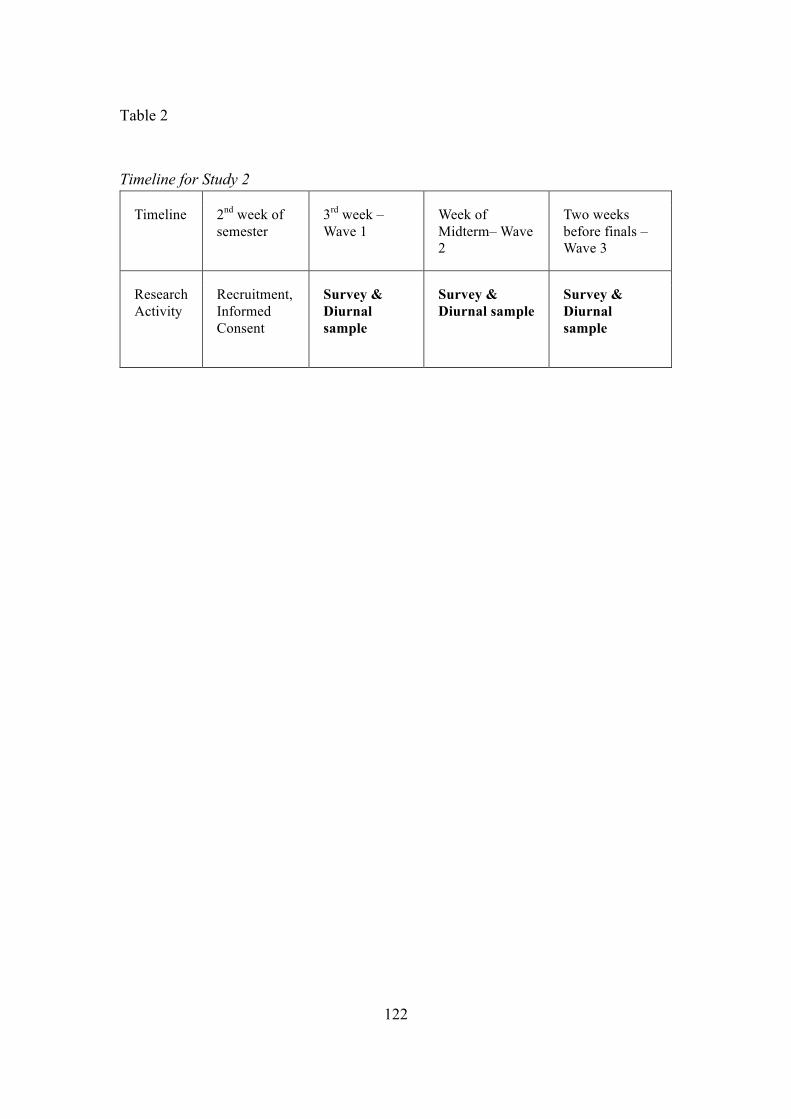
122
Table 2
Timeline for Study 2
Timeline 2nd week of semester
3rd week –Wave 1
Week of Midterm– Wave 2
Two weeks before finals – Wave 3
Research Activity
Recruitment, Informed Consent
Survey & Diurnal sample
Survey & Diurnal sample
Survey & Diurnal sample
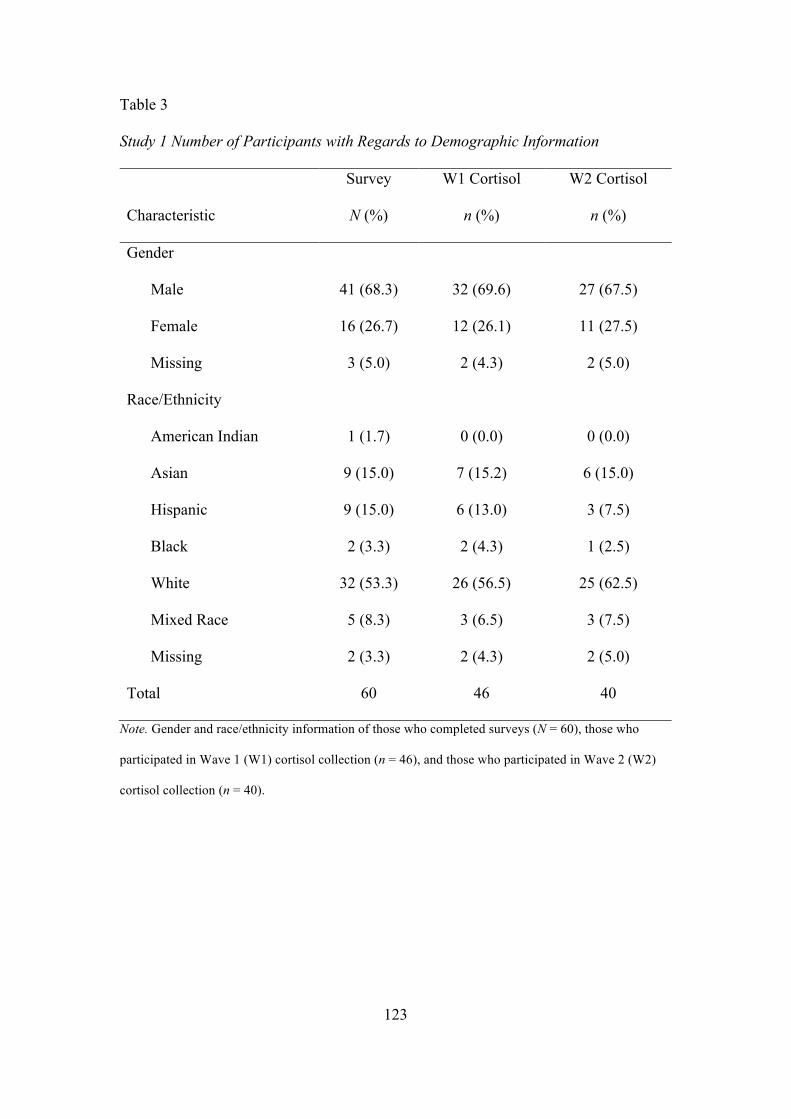
123
Table 3
Study 1 Number of Participants with Regards to Demographic Information
Characteristic
Survey
N (%)
W1 Cortisol
n (%)
W2 Cortisol
n (%)
Gender
Male 41 (68.3) 32 (69.6) 27 (67.5)
Female 16 (26.7) 12 (26.1) 11 (27.5)
Missing 3 (5.0) 2 (4.3) 2 (5.0)
Race/Ethnicity
American Indian 1 (1.7) 0 (0.0) 0 (0.0)
Asian 9 (15.0) 7 (15.2) 6 (15.0)
Hispanic 9 (15.0) 6 (13.0) 3 (7.5)
Black 2 (3.3) 2 (4.3) 1 (2.5)
White 32 (53.3) 26 (56.5) 25 (62.5)
Mixed Race 5 (8.3) 3 (6.5) 3 (7.5)
Missing 2 (3.3) 2 (4.3) 2 (5.0)
Total 60 46 40
Note. Gender and race/ethnicity information of those who completed surveys (N = 60), those who
participated in Wave 1 (W1) cortisol collection (n = 46), and those who participated in Wave 2 (W2)
cortisol collection (n = 40).
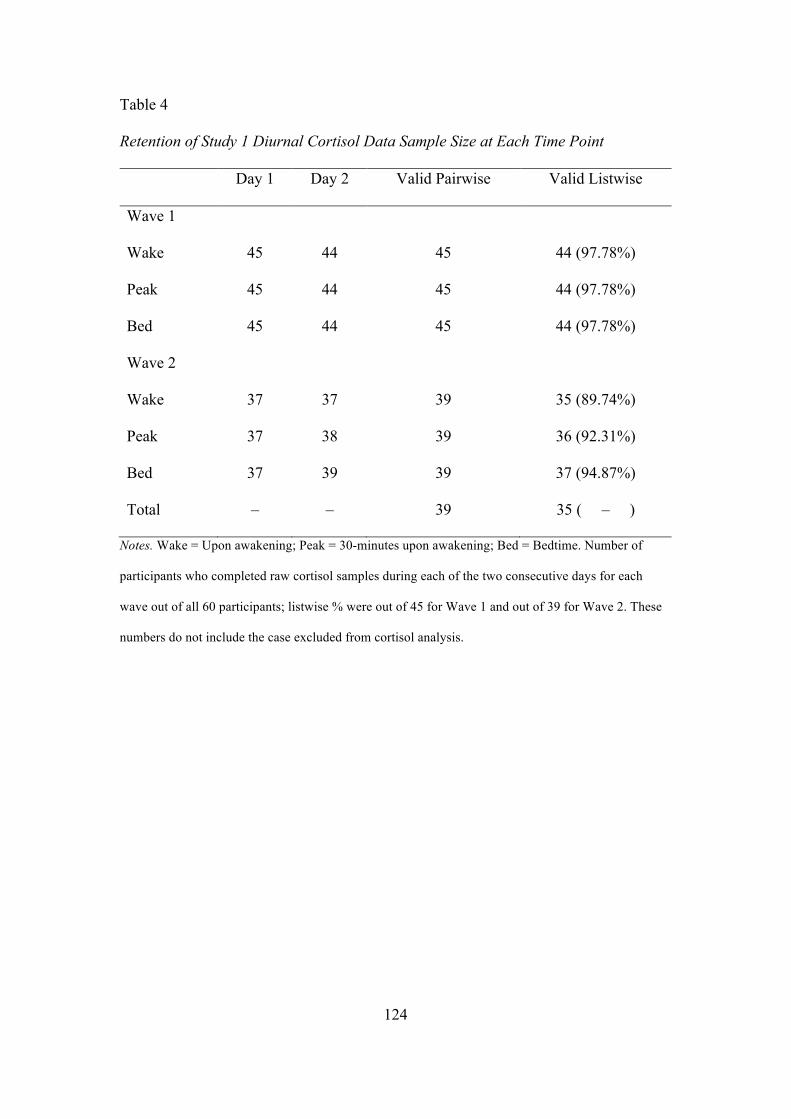
124
Table 4
Retention of Study 1 Diurnal Cortisol Data Sample Size at Each Time Point
Day 1 Day 2 Valid Pairwise Valid Listwise
Wave 1
Wake 45 44 45 44 (97.78%)
Peak 45 44 45 44 (97.78%)
Bed 45 44 45 44 (97.78%)
Wave 2
Wake 37 37 39 35 (89.74%)
Peak 37 38 39 36 (92.31%)
Bed 37 39 39 37 (94.87%)
Total – – 39 35 ( – )
Notes. Wake = Upon awakening; Peak = 30-minutes upon awakening; Bed = Bedtime. Number of
participants who completed raw cortisol samples during each of the two consecutive days for each
wave out of all 60 participants; listwise % were out of 45 for Wave 1 and out of 39 for Wave 2. These
numbers do not include the case excluded from cortisol analysis.
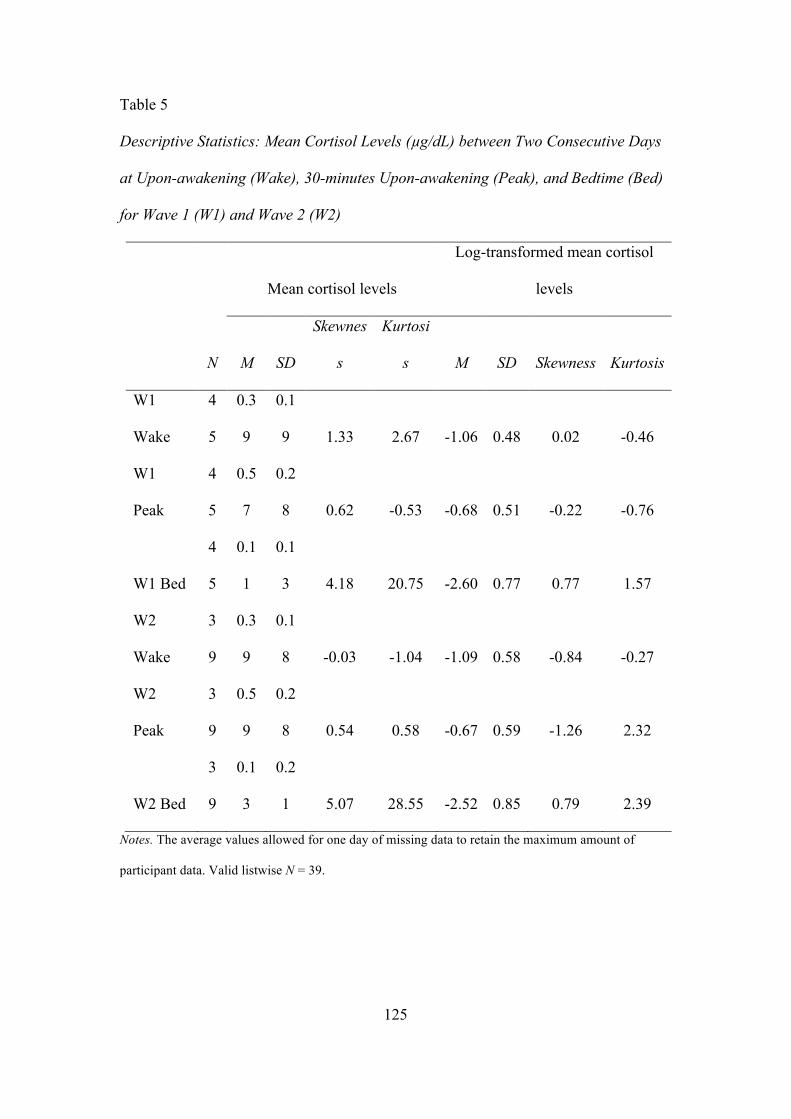
125
Table 5
Descriptive Statistics: Mean Cortisol Levels (µg/dL) between Two Consecutive Days
at Upon-awakening (Wake), 30-minutes Upon-awakening (Peak), and Bedtime (Bed)
for Wave 1 (W1) and Wave 2 (W2)
Mean cortisol levels
Log-transformed mean cortisol
levels
N M SD
Skewnes
s
Kurtosi
s M SD Skewness Kurtosis
W1
Wake
4
5
0.3
9
0.1
9 1.33 2.67 -1.06 0.48 0.02 -0.46
W1
Peak
4
5
0.5
7
0.2
8 0.62 -0.53 -0.68 0.51 -0.22 -0.76
W1 Bed
4
5
0.1
1
0.1
3 4.18 20.75 -2.60 0.77 0.77 1.57
W2
Wake
3
9
0.3
9
0.1
8 -0.03 -1.04 -1.09 0.58 -0.84 -0.27
W2
Peak
3
9
0.5
9
0.2
8 0.54 0.58 -0.67 0.59 -1.26 2.32
W2 Bed
3
9
0.1
3
0.2
1 5.07 28.55 -2.52 0.85 0.79 2.39
Notes. The average values allowed for one day of missing data to retain the maximum amount of
participant data. Valid listwise N = 39.
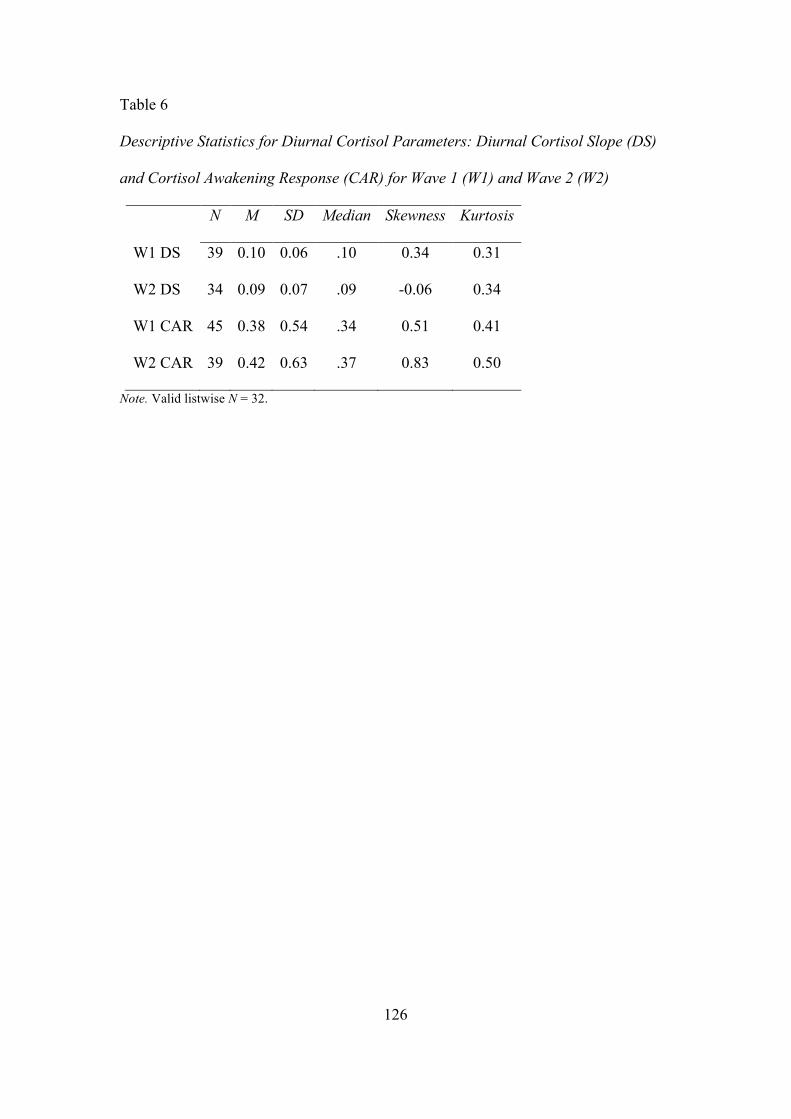
126
Table 6
Descriptive Statistics for Diurnal Cortisol Parameters: Diurnal Cortisol Slope (DS)
and Cortisol Awakening Response (CAR) for Wave 1 (W1) and Wave 2 (W2)
N M SD Median Skewness Kurtosis
W1 DS 39 0.10 0.06 .10 0.34 0.31
W2 DS 34 0.09 0.07 .09 -0.06 0.34
W1 CAR 45 0.38 0.54 .34 0.51 0.41
W2 CAR 39 0.42 0.63 .37 0.83 0.50
Note. Valid listwise N = 32.
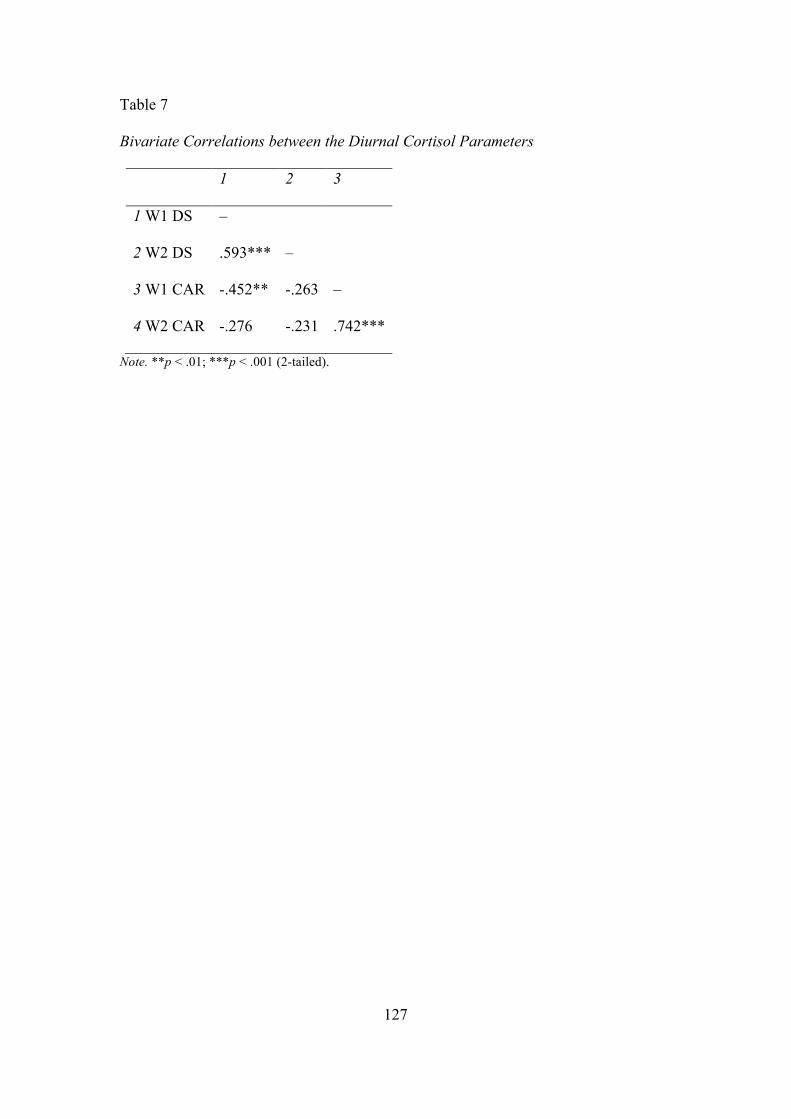
127
Table 7
Bivariate Correlations between the Diurnal Cortisol Parameters
1 2 3
1 W1 DS –
2 W2 DS .593*** –
3 W1 CAR -.452** -.263 –
4 W2 CAR -.276 -.231 .742***
Note. **p < .01; ***p < .001 (2-tailed).
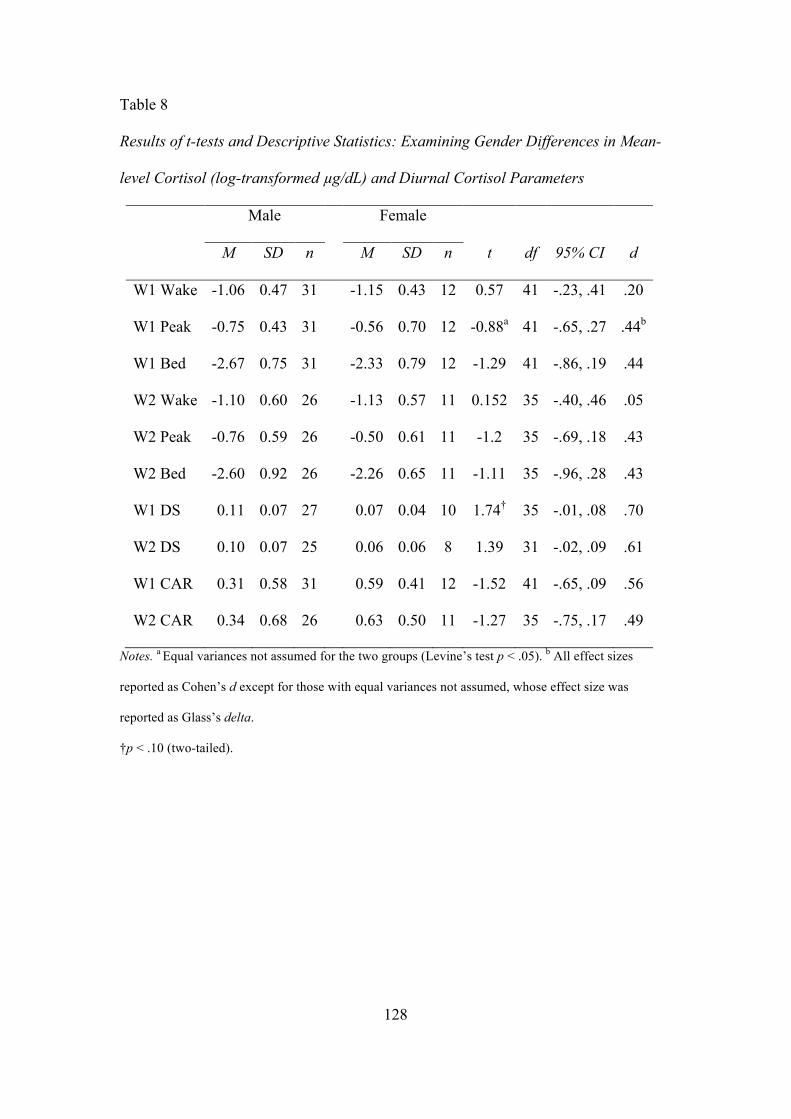
128
Table 8
Results of t-tests and Descriptive Statistics: Examining Gender Differences in Mean-
level Cortisol (log-transformed µg/dL) and Diurnal Cortisol Parameters
Male Female
M SD n M SD n t df 95% CI d
W1 Wake -1.06 0.47 31 -1.15 0.43 12 0.57 41 -.23, .41 .20
W1 Peak -0.75 0.43 31 -0.56 0.70 12 -0.88a 41 -.65, .27 .44b
W1 Bed -2.67 0.75 31 -2.33 0.79 12 -1.29 41 -.86, .19 .44
W2 Wake -1.10 0.60 26 -1.13 0.57 11 0.152 35 -.40, .46 .05
W2 Peak -0.76 0.59 26 -0.50 0.61 11 -1.2 35 -.69, .18 .43
W2 Bed -2.60 0.92 26 -2.26 0.65 11 -1.11 35 -.96, .28 .43
W1 DS 0.11 0.07 27 0.07 0.04 10 1.74† 35 -.01, .08 .70
W2 DS 0.10 0.07 25 0.06 0.06 8 1.39 31 -.02, .09 .61
W1 CAR 0.31 0.58 31 0.59 0.41 12 -1.52 41 -.65, .09 .56
W2 CAR 0.34 0.68 26 0.63 0.50 11 -1.27 35 -.75, .17 .49
Notes. a Equal variances not assumed for the two groups (Levine’s test p < .05). b All effect sizes
reported as Cohen’s d except for those with equal variances not assumed, whose effect size was
reported as Glass’s delta.
†p < .10 (two-tailed).
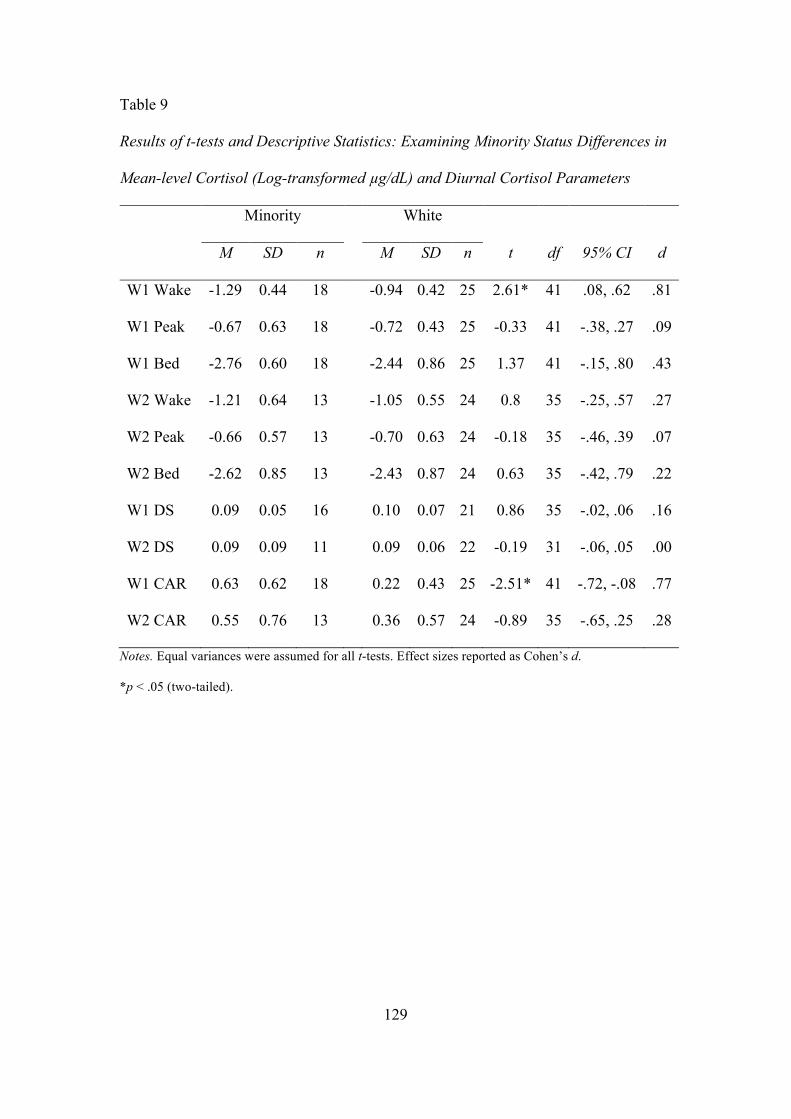
129
Table 9
Results of t-tests and Descriptive Statistics: Examining Minority Status Differences in
Mean-level Cortisol (Log-transformed µg/dL) and Diurnal Cortisol Parameters
Minority White
M SD n M SD n t df 95% CI d
W1 Wake -1.29 0.44 18 -0.94 0.42 25 2.61* 41 .08, .62 .81
W1 Peak -0.67 0.63 18 -0.72 0.43 25 -0.33 41 -.38, .27 .09
W1 Bed -2.76 0.60 18 -2.44 0.86 25 1.37 41 -.15, .80 .43
W2 Wake -1.21 0.64 13 -1.05 0.55 24 0.8 35 -.25, .57 .27
W2 Peak -0.66 0.57 13 -0.70 0.63 24 -0.18 35 -.46, .39 .07
W2 Bed -2.62 0.85 13 -2.43 0.87 24 0.63 35 -.42, .79 .22
W1 DS 0.09 0.05 16 0.10 0.07 21 0.86 35 -.02, .06 .16
W2 DS 0.09 0.09 11 0.09 0.06 22 -0.19 31 -.06, .05 .00
W1 CAR 0.63 0.62 18 0.22 0.43 25 -2.51* 41 -.72, -.08 .77
W2 CAR 0.55 0.76 13 0.36 0.57 24 -0.89 35 -.65, .25 .28
Notes. Equal variances were assumed for all t-tests. Effect sizes reported as Cohen’s d.
*p < .05 (two-tailed).
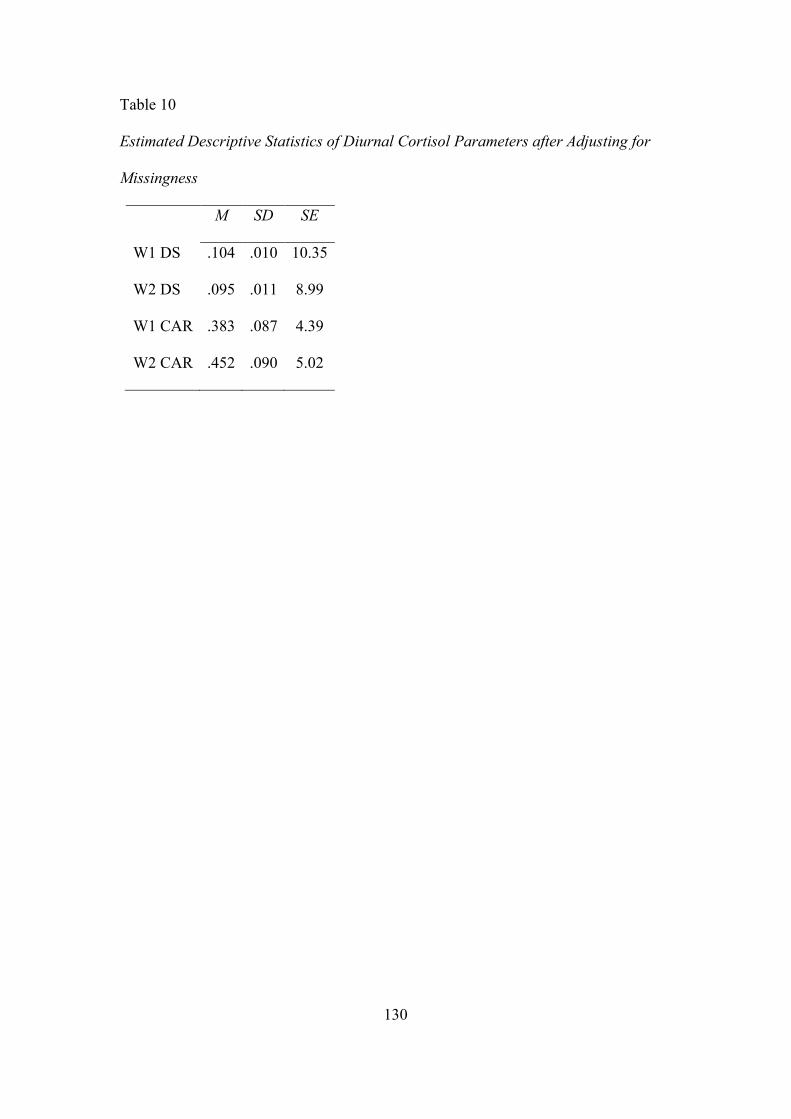
130
Table 10
Estimated Descriptive Statistics of Diurnal Cortisol Parameters after Adjusting for
Missingness
M SD SE
W1 DS .104 .010 10.35
W2 DS .095 .011 8.99
W1 CAR .383 .087 4.39
W2 CAR .452 .090 5.02
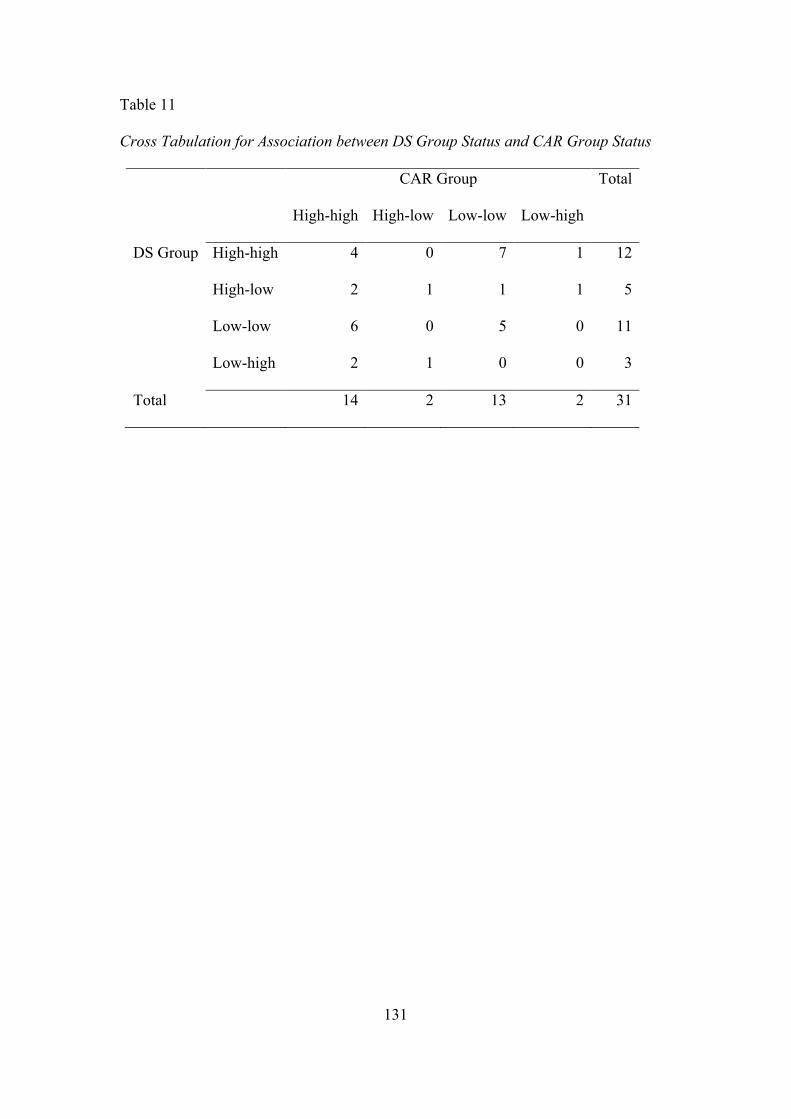
131
Table 11
Cross Tabulation for Association between DS Group Status and CAR Group Status
CAR Group Total
High-high High-low Low-low Low-high
DS Group High-high 4 0 7 1 12
High-low 2 1 1 1 5
Low-low 6 0 5 0 11
Low-high 2 1 0 0 3
Total 14 2 13 2 31
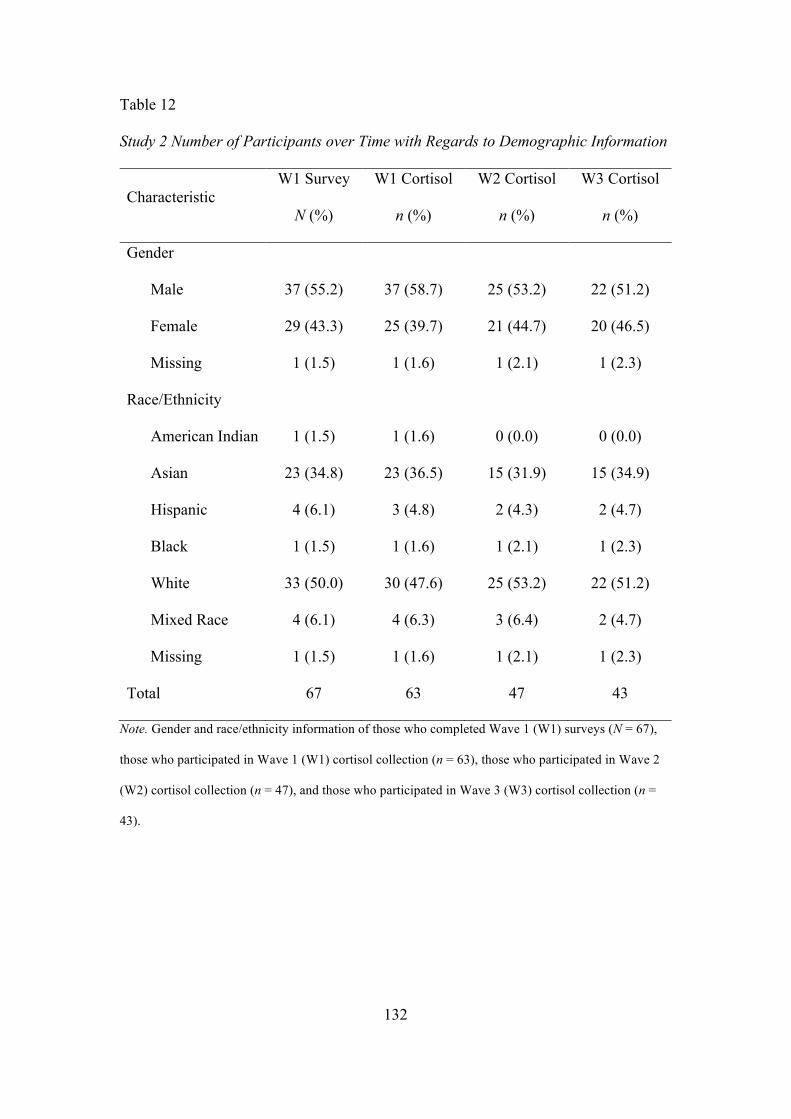
132
Table 12 Study 2 Number of Participants over Time with Regards to Demographic Information
Characteristic W1 Survey
N (%)
W1 Cortisol
n (%)
W2 Cortisol
n (%)
W3 Cortisol
n (%)
Gender
Male 37 (55.2) 37 (58.7) 25 (53.2) 22 (51.2)
Female 29 (43.3) 25 (39.7) 21 (44.7) 20 (46.5)
Missing 1 (1.5) 1 (1.6) 1 (2.1) 1 (2.3)
Race/Ethnicity
American Indian 1 (1.5) 1 (1.6) 0 (0.0) 0 (0.0)
Asian 23 (34.8) 23 (36.5) 15 (31.9) 15 (34.9)
Hispanic 4 (6.1) 3 (4.8) 2 (4.3) 2 (4.7)
Black 1 (1.5) 1 (1.6) 1 (2.1) 1 (2.3)
White 33 (50.0) 30 (47.6) 25 (53.2) 22 (51.2)
Mixed Race 4 (6.1) 4 (6.3) 3 (6.4) 2 (4.7)
Missing 1 (1.5) 1 (1.6) 1 (2.1) 1 (2.3)
Total 67 63 47 43
Note. Gender and race/ethnicity information of those who completed Wave 1 (W1) surveys (N = 67),
those who participated in Wave 1 (W1) cortisol collection (n = 63), those who participated in Wave 2
(W2) cortisol collection (n = 47), and those who participated in Wave 3 (W3) cortisol collection (n =
43).
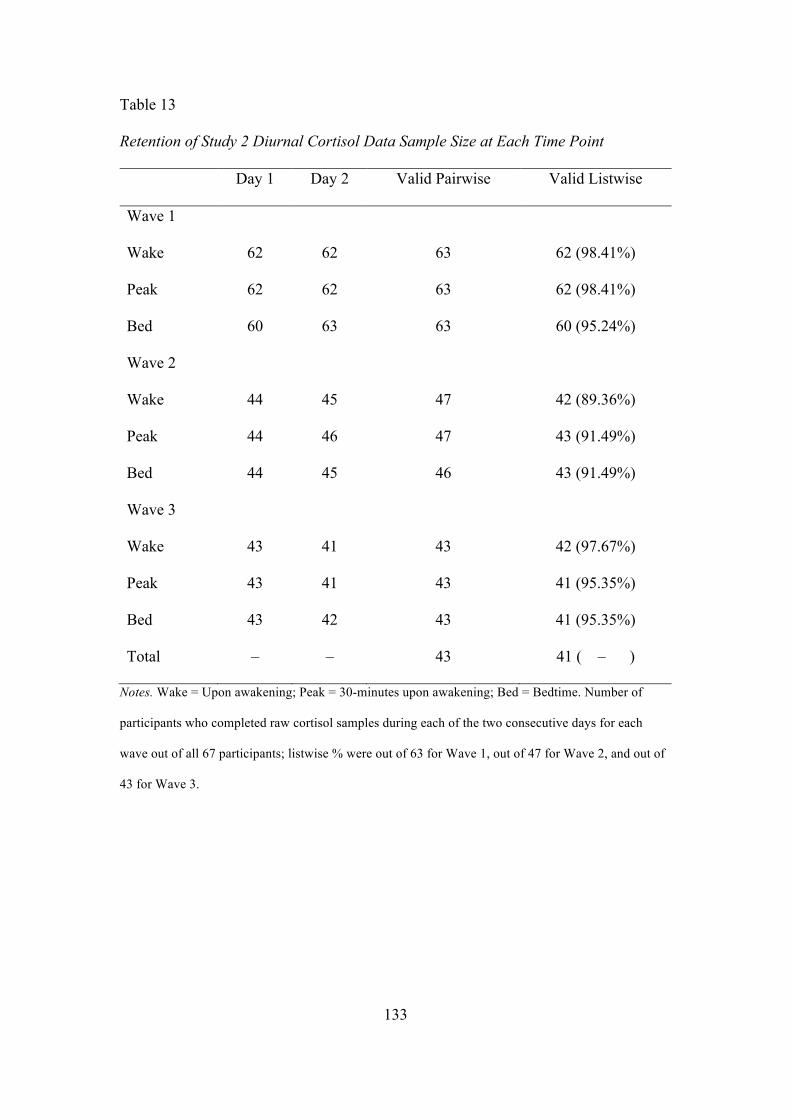
133
Table 13
Retention of Study 2 Diurnal Cortisol Data Sample Size at Each Time Point
Day 1 Day 2 Valid Pairwise Valid Listwise
Wave 1
Wake 62 62 63 62 (98.41%)
Peak 62 62 63 62 (98.41%)
Bed 60 63 63 60 (95.24%)
Wave 2
Wake 44 45 47 42 (89.36%)
Peak 44 46 47 43 (91.49%)
Bed 44 45 46 43 (91.49%)
Wave 3
Wake 43 41 43 42 (97.67%)
Peak 43 41 43 41 (95.35%)
Bed 43 42 43 41 (95.35%)
Total – – 43 41 ( – )
Notes. Wake = Upon awakening; Peak = 30-minutes upon awakening; Bed = Bedtime. Number of
participants who completed raw cortisol samples during each of the two consecutive days for each
wave out of all 67 participants; listwise % were out of 63 for Wave 1, out of 47 for Wave 2, and out of
43 for Wave 3.
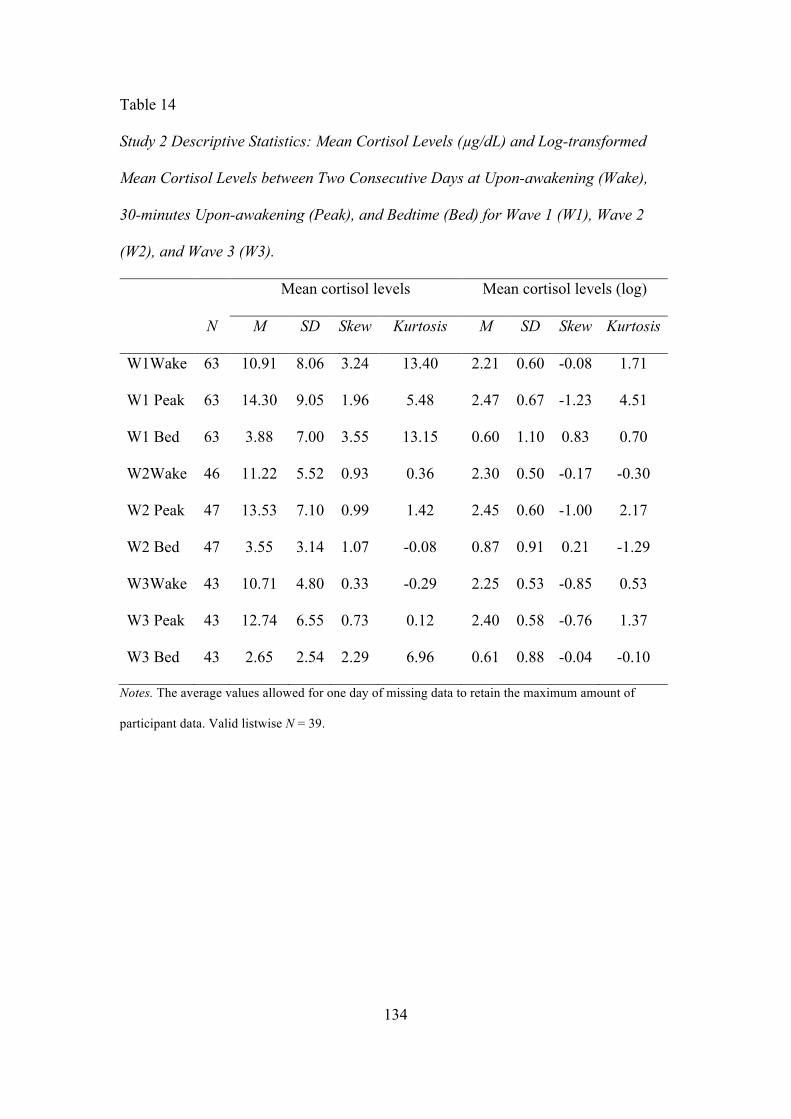
134
Table 14
Study 2 Descriptive Statistics: Mean Cortisol Levels (µg/dL) and Log-transformed
Mean Cortisol Levels between Two Consecutive Days at Upon-awakening (Wake),
30-minutes Upon-awakening (Peak), and Bedtime (Bed) for Wave 1 (W1), Wave 2
(W2), and Wave 3 (W3).
Mean cortisol levels Mean cortisol levels (log)
N M SD Skew Kurtosis M SD Skew Kurtosis
W1Wake 63 10.91 8.06 3.24 13.40 2.21 0.60 -0.08 1.71
W1 Peak 63 14.30 9.05 1.96 5.48 2.47 0.67 -1.23 4.51
W1 Bed 63 3.88 7.00 3.55 13.15 0.60 1.10 0.83 0.70
W2Wake 46 11.22 5.52 0.93 0.36 2.30 0.50 -0.17 -0.30
W2 Peak 47 13.53 7.10 0.99 1.42 2.45 0.60 -1.00 2.17
W2 Bed 47 3.55 3.14 1.07 -0.08 0.87 0.91 0.21 -1.29
W3Wake 43 10.71 4.80 0.33 -0.29 2.25 0.53 -0.85 0.53
W3 Peak 43 12.74 6.55 0.73 0.12 2.40 0.58 -0.76 1.37
W3 Bed 43 2.65 2.54 2.29 6.96 0.61 0.88 -0.04 -0.10
Notes. The average values allowed for one day of missing data to retain the maximum amount of
participant data. Valid listwise N = 39.
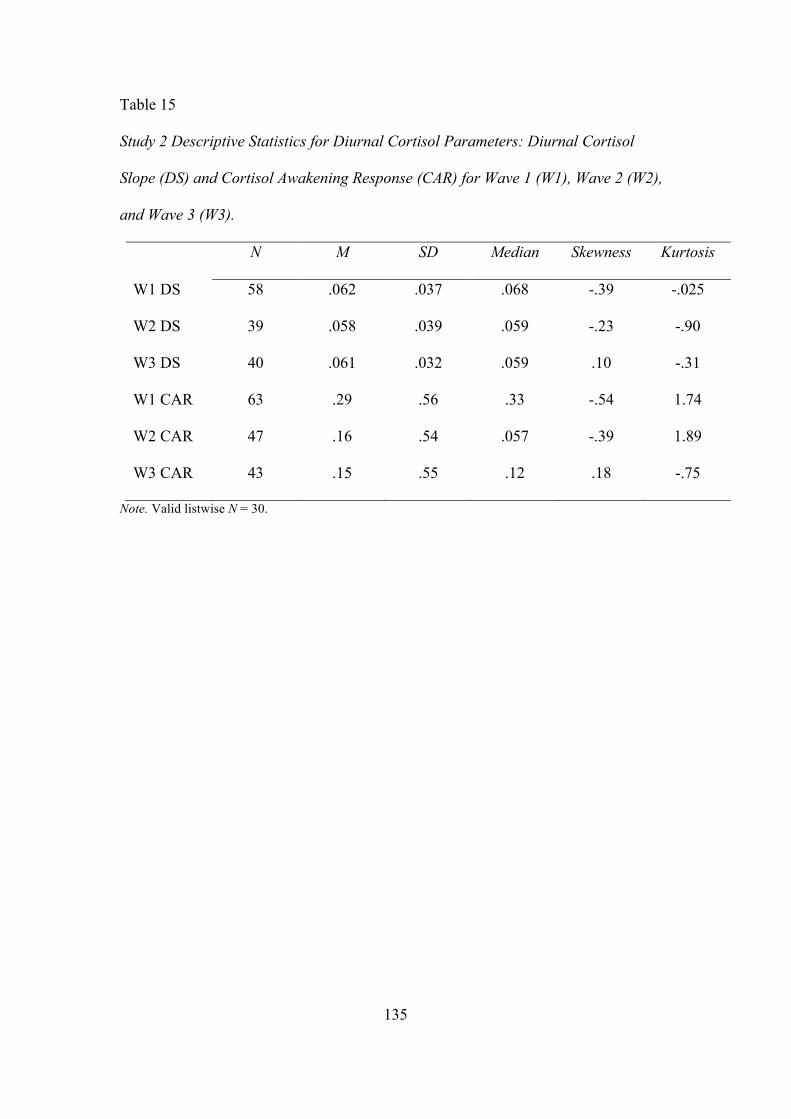
135
Table 15
Study 2 Descriptive Statistics for Diurnal Cortisol Parameters: Diurnal Cortisol
Slope (DS) and Cortisol Awakening Response (CAR) for Wave 1 (W1), Wave 2 (W2),
and Wave 3 (W3).
N M SD Median Skewness Kurtosis
W1 DS 58 .062 .037 .068 -.39 -.025
W2 DS 39 .058 .039 .059 -.23 -.90
W3 DS 40 .061 .032 .059 .10 -.31
W1 CAR 63 .29 .56 .33 -.54 1.74
W2 CAR 47 .16 .54 .057 -.39 1.89
W3 CAR 43 .15 .55 .12 .18 -.75
Note. Valid listwise N = 30.
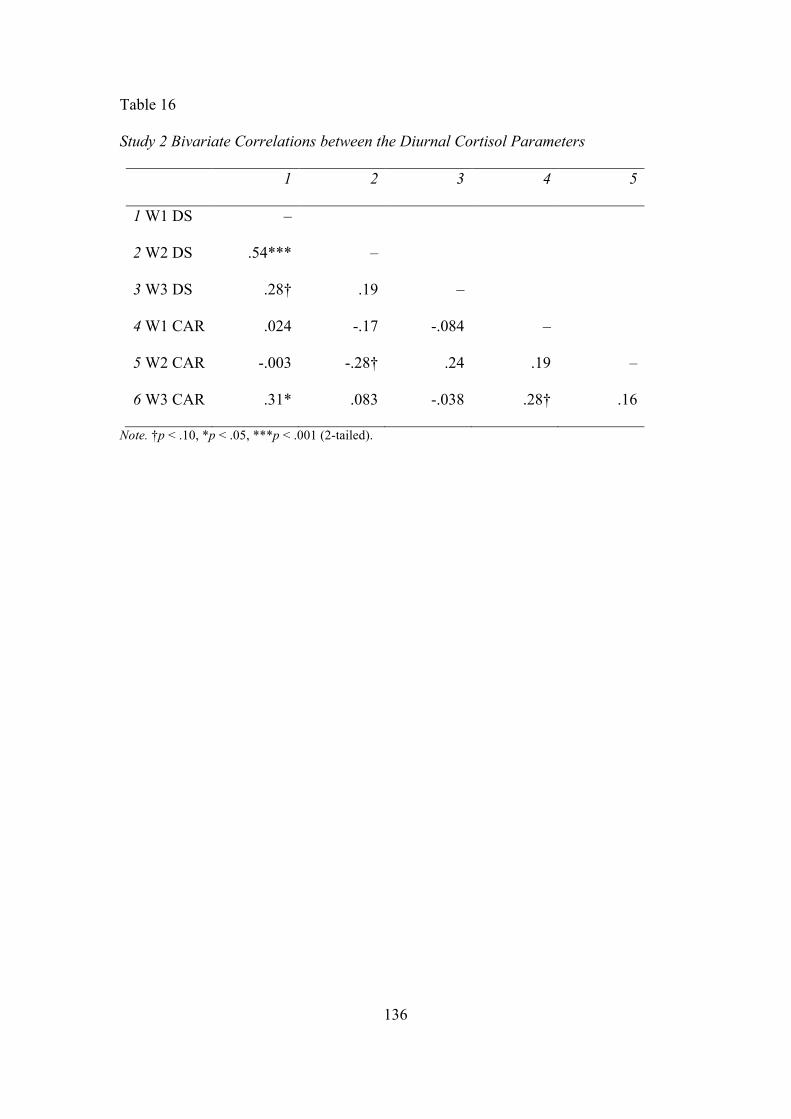
136
Table 16
Study 2 Bivariate Correlations between the Diurnal Cortisol Parameters
1 2 3 4 5
1 W1 DS –
2 W2 DS .54*** –
3 W3 DS .28† .19 –
4 W1 CAR .024 -.17 -.084 –
5 W2 CAR -.003 -.28† .24 .19 –
6 W3 CAR .31* .083 -.038 .28† .16
Note. †p < .10, *p < .05, ***p < .001 (2-tailed).
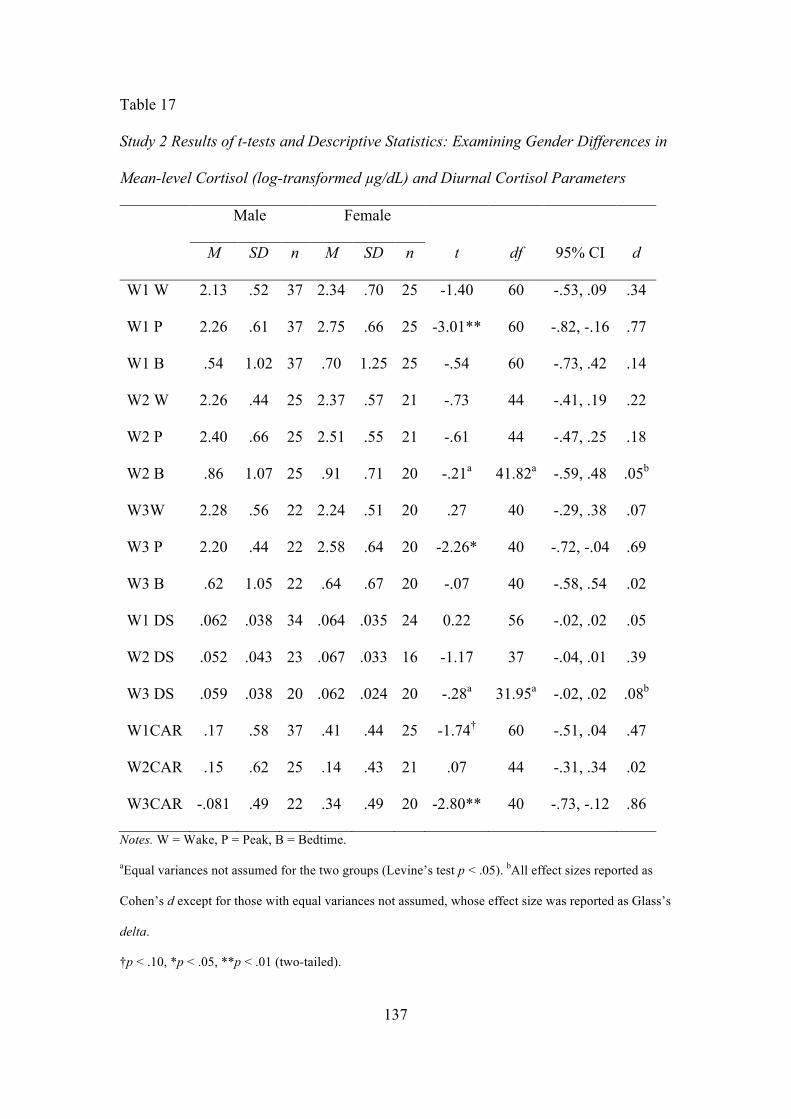
137
Table 17
Study 2 Results of t-tests and Descriptive Statistics: Examining Gender Differences in
Mean-level Cortisol (log-transformed µg/dL) and Diurnal Cortisol Parameters
Male Female
M SD n M SD n t df 95% CI d
W1 W 2.13 .52 37 2.34 .70 25 -1.40 60 -.53, .09 .34
W1 P 2.26 .61 37 2.75 .66 25 -3.01** 60 -.82, -.16 .77
W1 B .54 1.02 37 .70 1.25 25 -.54 60 -.73, .42 .14
W2 W 2.26 .44 25 2.37 .57 21 -.73 44 -.41, .19 .22
W2 P 2.40 .66 25 2.51 .55 21 -.61 44 -.47, .25 .18
W2 B .86 1.07 25 .91 .71 20 -.21a 41.82a -.59, .48 .05b
W3W 2.28 .56 22 2.24 .51 20 .27 40 -.29, .38 .07
W3 P 2.20 .44 22 2.58 .64 20 -2.26* 40 -.72, -.04 .69
W3 B .62 1.05 22 .64 .67 20 -.07 40 -.58, .54 .02
W1 DS .062 .038 34 .064 .035 24 0.22 56 -.02, .02 .05
W2 DS .052 .043 23 .067 .033 16 -1.17 37 -.04, .01 .39
W3 DS .059 .038 20 .062 .024 20 -.28a 31.95a -.02, .02 .08b
W1CAR .17 .58 37 .41 .44 25 -1.74† 60 -.51, .04 .47
W2CAR .15 .62 25 .14 .43 21 .07 44 -.31, .34 .02
W3CAR -.081 .49 22 .34 .49 20 -2.80** 40 -.73, -.12 .86
Notes. W = Wake, P = Peak, B = Bedtime.
aEqual variances not assumed for the two groups (Levine’s test p < .05). bAll effect sizes reported as
Cohen’s d except for those with equal variances not assumed, whose effect size was reported as Glass’s
delta.
†p < .10, *p < .05, **p < .01 (two-tailed).
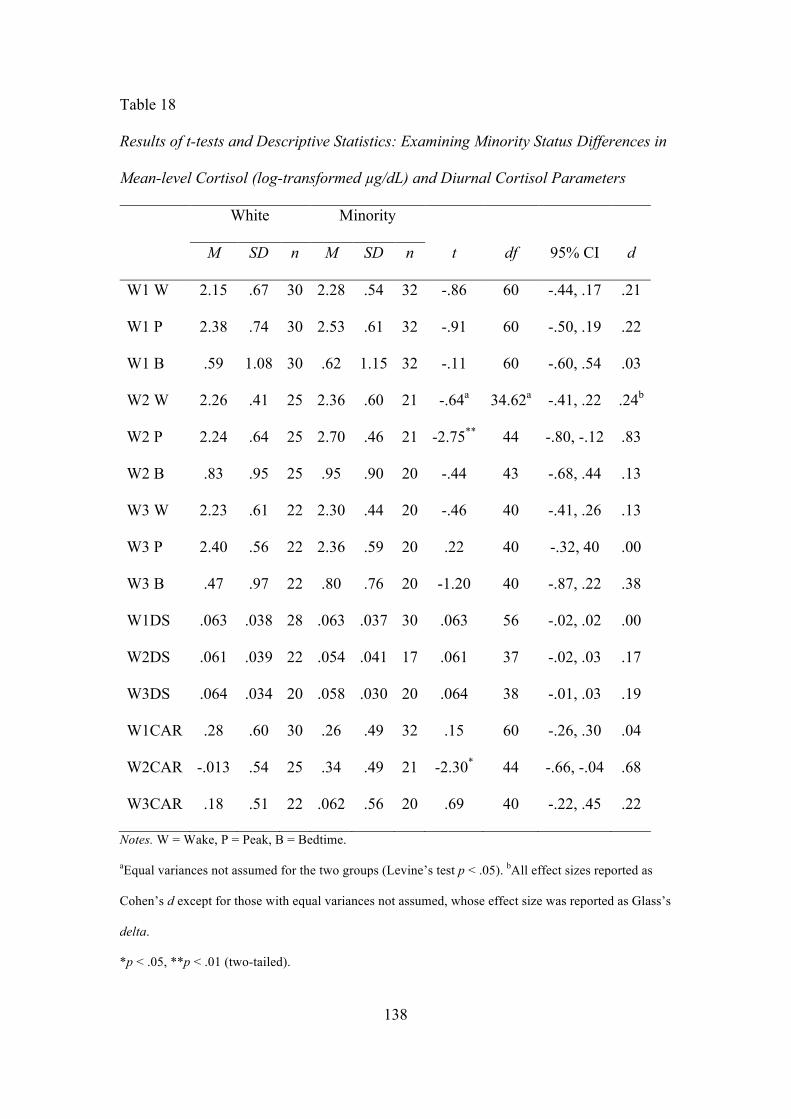
138
Table 18
Results of t-tests and Descriptive Statistics: Examining Minority Status Differences in
Mean-level Cortisol (log-transformed µg/dL) and Diurnal Cortisol Parameters
White Minority
M SD n M SD n t df 95% CI d
W1 W 2.15 .67 30 2.28 .54 32 -.86 60 -.44, .17 .21
W1 P 2.38 .74 30 2.53 .61 32 -.91 60 -.50, .19 .22
W1 B .59 1.08 30 .62 1.15 32 -.11 60 -.60, .54 .03
W2 W 2.26 .41 25 2.36 .60 21 -.64a 34.62a -.41, .22 .24b
W2 P 2.24 .64 25 2.70 .46 21 -2.75** 44 -.80, -.12 .83
W2 B .83 .95 25 .95 .90 20 -.44 43 -.68, .44 .13
W3 W 2.23 .61 22 2.30 .44 20 -.46 40 -.41, .26 .13
W3 P 2.40 .56 22 2.36 .59 20 .22 40 -.32, 40 .00
W3 B .47 .97 22 .80 .76 20 -1.20 40 -.87, .22 .38
W1DS .063 .038 28 .063 .037 30 .063 56 -.02, .02 .00
W2DS .061 .039 22 .054 .041 17 .061 37 -.02, .03 .17
W3DS .064 .034 20 .058 .030 20 .064 38 -.01, .03 .19
W1CAR .28 .60 30 .26 .49 32 .15 60 -.26, .30 .04
W2CAR -.013 .54 25 .34 .49 21 -2.30* 44 -.66, -.04 .68
W3CAR .18 .51 22 .062 .56 20 .69 40 -.22, .45 .22
Notes. W = Wake, P = Peak, B = Bedtime.
aEqual variances not assumed for the two groups (Levine’s test p < .05). bAll effect sizes reported as
Cohen’s d except for those with equal variances not assumed, whose effect size was reported as Glass’s
delta.
*p < .05, **p < .01 (two-tailed).
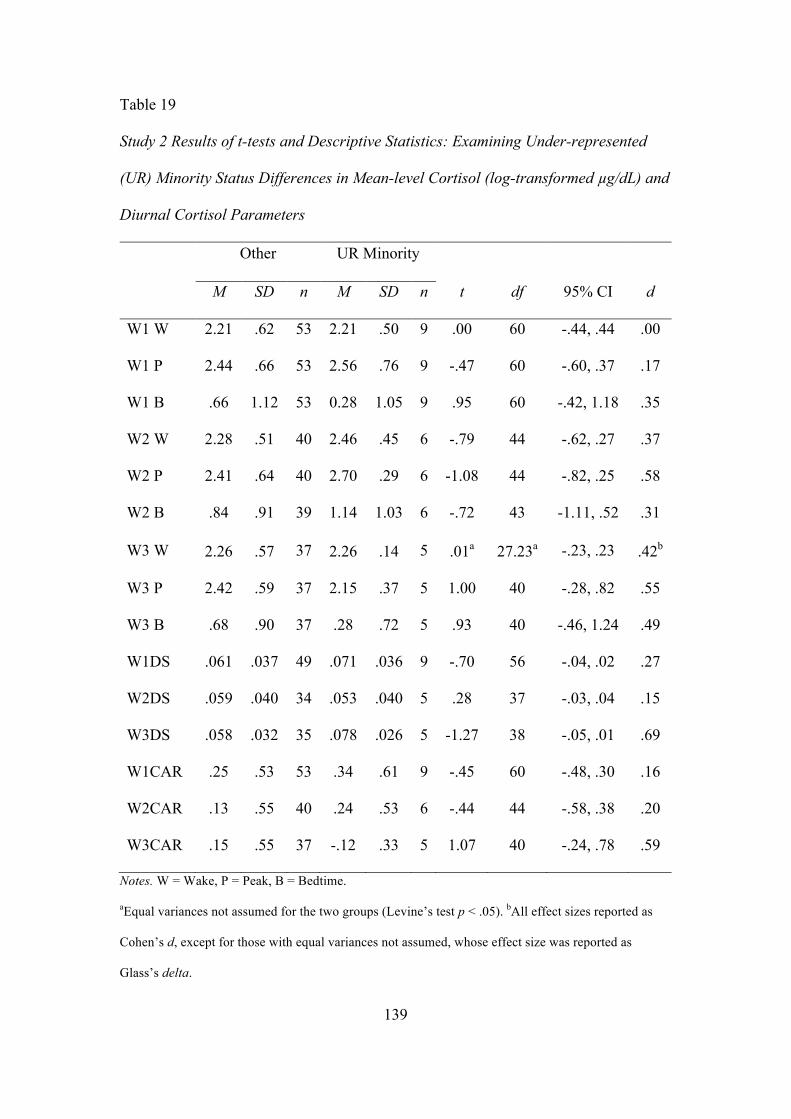
139
Table 19
Study 2 Results of t-tests and Descriptive Statistics: Examining Under-represented
(UR) Minority Status Differences in Mean-level Cortisol (log-transformed µg/dL) and
Diurnal Cortisol Parameters
Other UR Minority
M SD n M SD n t df 95% CI d
W1 W 2.21 .62 53 2.21 .50 9 .00 60 -.44, .44 .00
W1 P 2.44 .66 53 2.56 .76 9 -.47 60 -.60, .37 .17
W1 B .66 1.12 53 0.28 1.05 9 .95 60 -.42, 1.18 .35
W2 W 2.28 .51 40 2.46 .45 6 -.79 44 -.62, .27 .37
W2 P 2.41 .64 40 2.70 .29 6 -1.08 44 -.82, .25 .58
W2 B .84 .91 39 1.14 1.03 6 -.72 43 -1.11, .52 .31
W3 W 2.26 .57 37 2.26 .14 5 .01a 27.23a -.23, .23 .42b
W3 P 2.42 .59 37 2.15 .37 5 1.00 40 -.28, .82 .55
W3 B .68 .90 37 .28 .72 5 .93 40 -.46, 1.24 .49
W1DS .061 .037 49 .071 .036 9 -.70 56 -.04, .02 .27
W2DS .059 .040 34 .053 .040 5 .28 37 -.03, .04 .15
W3DS .058 .032 35 .078 .026 5 -1.27 38 -.05, .01 .69
W1CAR .25 .53 53 .34 .61 9 -.45 60 -.48, .30 .16
W2CAR .13 .55 40 .24 .53 6 -.44 44 -.58, .38 .20
W3CAR .15 .55 37 -.12 .33 5 1.07 40 -.24, .78 .59
Notes. W = Wake, P = Peak, B = Bedtime.
aEqual variances not assumed for the two groups (Levine’s test p < .05). bAll effect sizes reported as
Cohen’s d, except for those with equal variances not assumed, whose effect size was reported as
Glass’s delta.
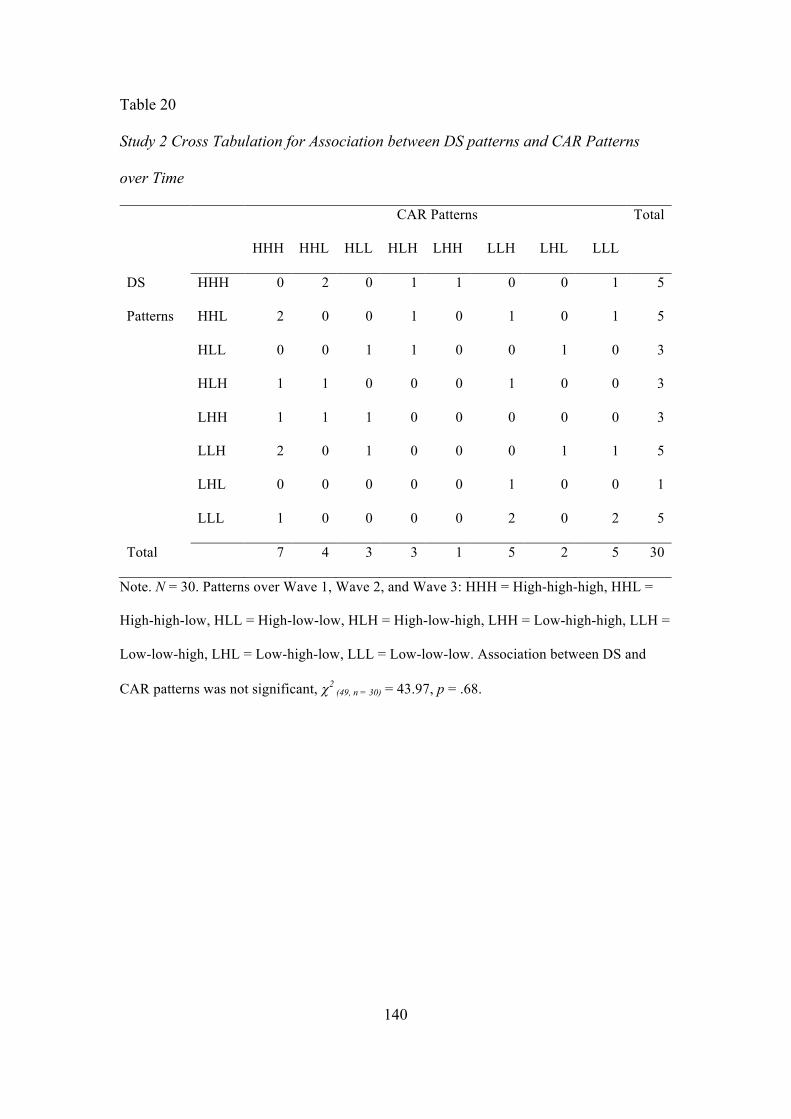
140
Table 20
Study 2 Cross Tabulation for Association between DS patterns and CAR Patterns
over Time
CAR Patterns Total
HHH HHL HLL HLH LHH LLH LHL LLL
DS HHH 0 2 0 1 1 0 0 1 5
Patterns HHL 2 0 0 1 0 1 0 1 5
HLL 0 0 1 1 0 0 1 0 3
HLH 1 1 0 0 0 1 0 0 3
LHH 1 1 1 0 0 0 0 0 3
LLH 2 0 1 0 0 0 1 1 5
LHL 0 0 0 0 0 1 0 0 1
LLL 1 0 0 0 0 2 0 2 5
Total 7 4 3 3 1 5 2 5 30
Note. N = 30. Patterns over Wave 1, Wave 2, and Wave 3: HHH = High-high-high, HHL =
High-high-low, HLL = High-low-low, HLH = High-low-high, LHH = Low-high-high, LLH =
Low-low-high, LHL = Low-high-low, LLL = Low-low-low. Association between DS and
CAR patterns was not significant, c2 (49, n = 30) = 43.97, p = .68.
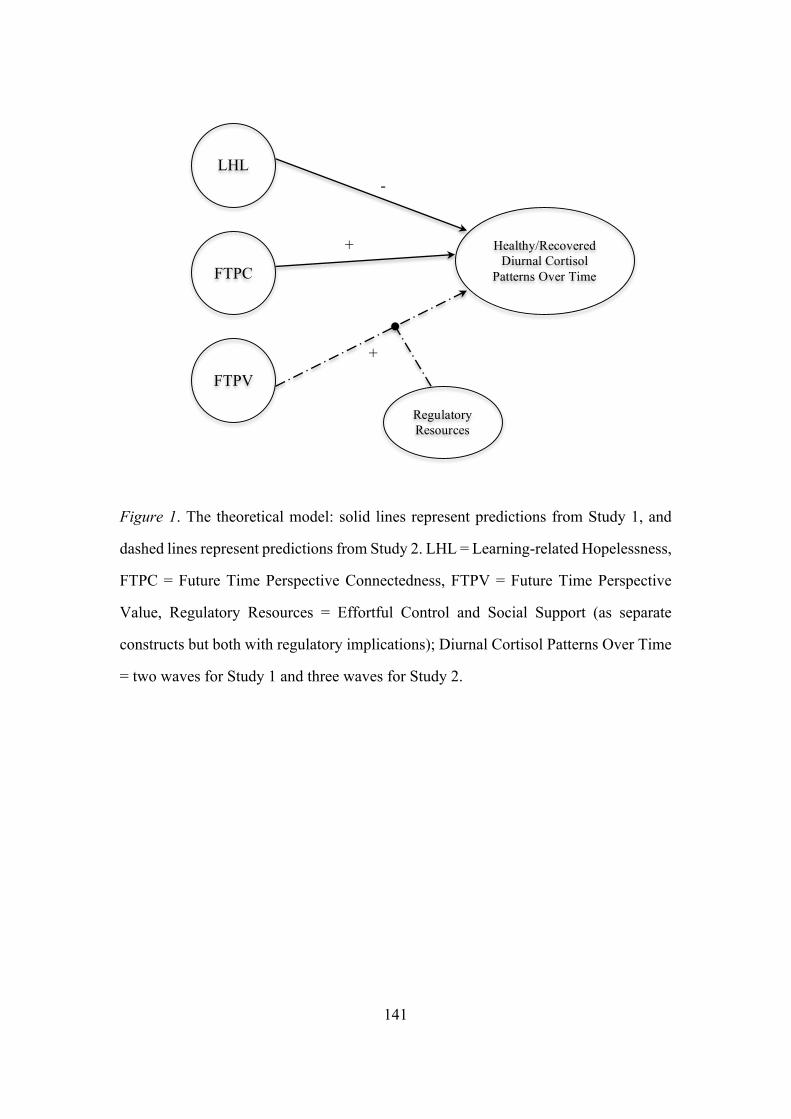
141
Figure 1. The theoretical model: solid lines represent predictions from Study 1, and
dashed lines represent predictions from Study 2. LHL = Learning-related Hopelessness,
FTPC = Future Time Perspective Connectedness, FTPV = Future Time Perspective
Value, Regulatory Resources = Effortful Control and Social Support (as separate
constructs but both with regulatory implications); Diurnal Cortisol Patterns Over Time
= two waves for Study 1 and three waves for Study 2.
FTPC
Healthy/Recovered Diurnal Cortisol
Patterns Over Time
FTPV
LHL
Regulatory Resources
-
+
+
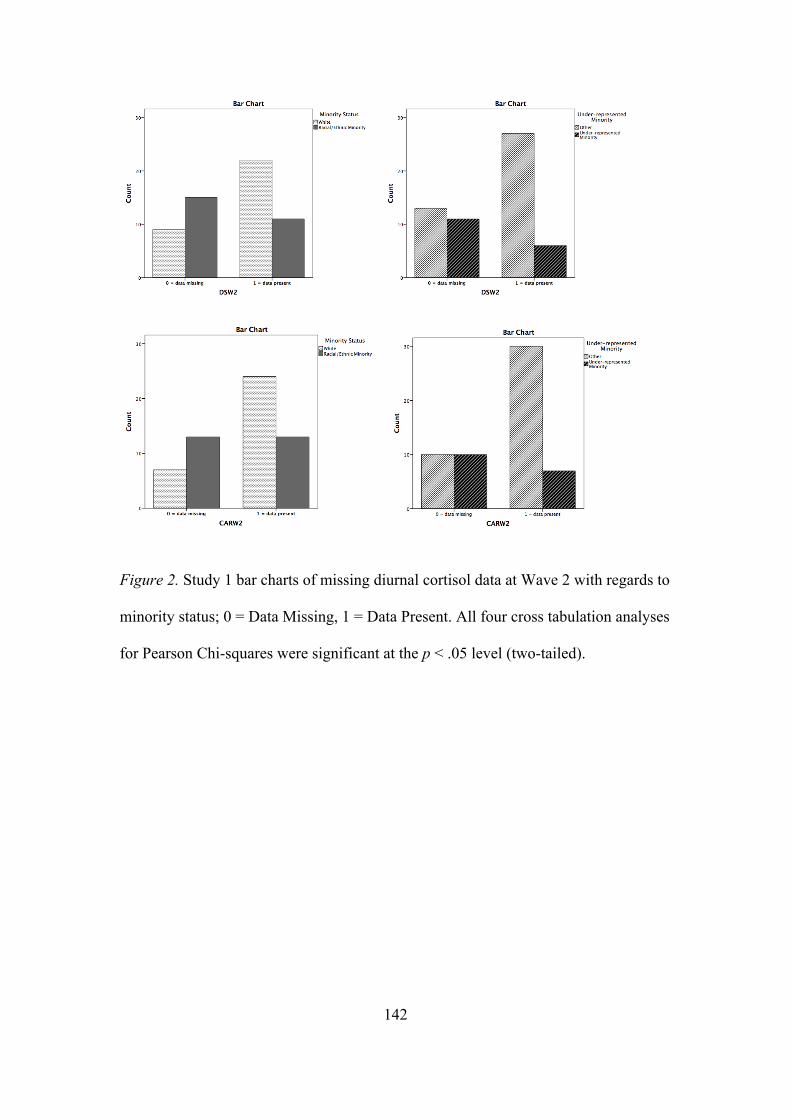
142
Figure 2. Study 1 bar charts of missing diurnal cortisol data at Wave 2 with regards to
minority status; 0 = Data Missing, 1 = Data Present. All four cross tabulation analyses
for Pearson Chi-squares were significant at the p < .05 level (two-tailed).
143
REFERENCES
Adam, E. K., Vrshek-Schallhorn, S., Kendall, A. D., Mineka, S., Zinbarg, R. E., & Craske, M. G. (2014). Prospective associations between the cortisol awakening response and first onsets of anxiety disorders over a six-year follow-up--2013 curt richter award winner. Psychoneuroendocrinology, 44, 47-59.
Almeida, D. M., Piazza, J. R., & Stawski, R. S. (2009). Interindividual differences and intraindividual variability in the cortisol awakening response: An examination of age and gender. Psychology and Aging, 24(4), 819-827.
Alverson, J. R. (2014). A model of hopelessness, belongingness, engagement, and academic achievement (Order No. 3620050). Available from ProQuest Dissertations & Theses Global.
Au, R., Watkins, D., & Hattie, J. (2010). Academic risk factors and deficits of learned hopelessness: A longitudinal study of Hong Kong secondary school students. Educational Psychology, 30(2), 125-138.
Beck, A. T., Weissman, A., Lester, D., & Trexler, L. (1974). The measurement of pessimism: The hopelessness scale. Journal of Consulting and Clinical Psychology, 42(6), 861-865.
Blair, C. (2002). School readiness: Integrating cognition and emotion in a neurobiological conceptualization of children's functioning at school entry. American Psychologist, 57(2), 111.
Blair, C., & Razza, R. P. (2007). Relating effortful control, executive function, and false belief understanding to emerging math and literacy ability in kindergarten. Child Development, 78(2), 647-663.
Bland, H. W., Melton, B. F., Welle, P., & Bigham, L. (2012). Stress tolerance: New challenges for millennial college students. College Student Journal, 46(2), 362.
Burić, I., & Sorić, I. (2012). The role of test hope and hopelessness in self-regulated learning: Relations between volitional strategies, cognitive appraisals and academic achievement. Learning and Individual Differences, 22(4), 523-529.
Chang, M. J., Cerna, O., Han, J., & Sa´enz, V. (2008). The contradictory roles of institutional status in retaining underrepresented minorities in biomedical and behavioral science majors. The Review of Higher Education, 31(4), 433–464.
Chida, Y., & Steptoe, A. (2009). Cortisol awakening response and psychosocial factors: A systematic review and meta-analysis. Biological Psychology, 80(3), 265-278.
Cohen, S., & Wills, T. A. (1985). Stress, social support, and the buffering hypothesis. Psychological Bulletin, 98(2), 310.
144
Cole, P. M., Martin, S. E., & Dennis, T. A. (2004). Emotion regulation as a scientific construct: Methodological challenges and directions for child development research. Child Development, 317-333.
Deci, E. L., & Ryan, R. M. (1985). Intrinsic motivation and self-determination in human behavior. Springer Science & Business Media.
Diener, E., & Suh, E. (1997). Measuring quality of life: Economic, social, and subjective indicators. Social Indicators Research, 40 (1–2), 189–216.
Denson, T. F., Spanovic, M., & Miller, N. (2009). Cognitive appraisals and emotions predict cortisol and immune responses: a meta-analysis of acute laboratory social stressors and emotion inductions. Psychological Bulletin, 135(6), 823.
DeSantis, A. S., Adam, E. K., Hawkley, L. C., Kudielka, B. M., & Cacioppo, J. T. (2015). Racial and ethnic differences in diurnal cortisol rhythms: Are they consistent over time? Psychosomatic Medicine, 77(1), 6-15.
Dickerson, S. S., & Kemeny, M. E. (2004). Acute stressors and cortisol responses: A theoretical integration and synthesis of laboratory research. Psychological Bullentin, 130(3), 355-391.
Dmitrieva, N. O., Almeida, D. M., Dmitrieva, J., Loken, E., & Pieper, C. F. (2013). A day-centered approach to modeling cortisol: Diurnal cortisol profiles and their associations among U.S. adults. Psychoneuroendocrinology, 38(10), 2354-2365.
Doane, L. D., & Adam, E. K. (2010). Loneliness and cortisol: Momentary, day-to-day, and trait associations. Psychoneuroendocrinology, 35(3), 430-441.
Doane, L. D., Franz, C. E., Prom-Wormley, E., Eaves, L. J., Mendoza, S. P., Hellhammer, D. H., ... & Jacobson, K. C. (2011). Negative emotionality, depressive symptoms and cortisol diurnal rhythms: Analysis of a community sample of middle-aged males. Hormones and Behavior, 60(2), 202-209.
Doane, L. D., Mineka, S., Zinbarg, R. E., Craske, M., Griffith, J. W., & Adam, E. K. (2013). Are flatter diurnal cortisol rhythms associated with major depression and anxiety disorders in late adolescence? the role of life stress and daily negative emotion. Development and Psychopathology, 25(3), 629.
Doane, L. D., Chen, F. R., Sladek, M. R., Van Lenten, S. A., & Granger, D. A. (2015). Latent trait cortisol (LTC) levels: Reliability, validity, and stability. Psychoneuroendocrinology, 55, 21-35.
Dodge, R., Daly, A. P., Huyton, J., & Sanders, L. D. (2012). The challenge of defining wellbeing. International Journal of Wellbeing, 2(3).
Eisenberg, N., Champion, C., & Ma, Y. (2004). Emotion-related regulation: An emerging construct. Merrill-Palmer Quarterly (1982-), 50(3), 236-259.
145
Eisenberg, N., & Spinrad, T. L. (2004). Emotion-related regulation: Sharpening the definition. Child Development, 75(2), 334-339.
Evans, D. E., & Rothbart, M. K. (2007). Developing a model for adult temperament. Journal of Research in Personality, 41(4), 868-888.
Faul, F., Erdfelder, E., Lang, A.-G., & Buchner, A. (2007). G*Power 3: A flexible statistical power analysis program for the social, behavioral, and biomedical sciences. Behavior Research Methods, 39, 175-191.
Faul, F., Erdfelder, E., Buchner, A., & Lang, A.-G. (2009). Statistical power analyses using G*Power 3.1: Tests for correlation and regression analyses. Behavior Research Methods, 41, 1149-1160.
Fellner-Rosenberg, R. (1989). A social learning theory analysis of hopelessness and depression in college students. University of Connecticut, ProQuest, UMI Dissertations Publishing, 1989. 9000795.
French, B. F., Immekus, J. C., & Oakes, W. C. (2005). An examination of indicators of engineering students’ success and persistence. Journal of Engineering Education, 94, 419-425.
Fries, E., Dettenborn, L., & Kirschbaum, C. (2009). The cortisol awakening response (CAR): facts and future directions. International journal of Psychophysiology, 72(1), 67-73.
Goetz, T., Frenzel, A. C., Pekrun, R., & Hall, N. C. (2006). The domain specificity of academic emotional experiences. The Journal of Experimental Education, 75(1), 5-29. doi:10.3200/JEXE.75.1.5-29
Granger, D. A., Cicchetti, D., Rogosch, F. A., Hibel, L. C., Teisl, M., & Flores, E. (2007). Blood contamination in children's saliva: Prevalence, stability, and impact on the measurement of salivary cortisol, testosterone, and dehydroepiandrosterone. Psychoneuroendocrinology, 32(6), 724-733.
Granger, D. A., Hibel, L. C., Fortunato, C. K., & Kapelewski, C. H. (2009). Medication effects on salivary cortisol: Tactics and strategy to minimize impact in behavioral and developmental science. Psychoneuroendocrinology, 34(10), 1437-1448.
Granger, D. A., Fortunato, C. K., Beltzer, E. K., Virag, M., Bright, M. A., & Out, D. (2012). Focus on methodology: Salivary bioscience and research on adolescence: An integrated perspective. Journal of Adolescence, 35(4), 1081. doi:10.1016/j.adolescence.2012.01.005
Gross, James J. (2007). Handbook of emotion regulation. New York: Guilford Press.
Gross, J. J., & John, O. P. (2003). Individual differences in two emotion regulation processes: implications for affect, relationships, and well-being. Journal of Personality and Social Psychology, 85(2), 348.
146
Gross, J. J., Richards, J. M., & John, O. P. (2006). Emotion regulation in everyday life. Emotion regulation in families: Pathways to dysfunction and health, 13-35.
Gunnar, M. R., & Vazquez, D. M. (2001). Low cortisol and a flattening of expected daytime rhythm: Potential indices of risk in human development. Development and Psychopathology, 13(3), 515-538.
Hankin, B. L., Badanes, L. S., Abela, J. R., & Watamura, S. E. (2010). Hypothalamic–pituitary–adrenal axis dysregulation in dysphoric children and adolescents: Cortisol reactivity to psychosocial stress from preschool through middle adolescence. Biological Psychiatry, 68(5), 484-490.
Harden, K. P., Wrzus, C., Luong, G., Grotzinger, A., Bajbouj, M., Rauers, A., ... & Riediger, M. (2016). Diurnal coupling between testosterone and cortisol from adolescence to older adulthood. Psychoneuroendocrinology, 73, 79-90.
Headey, B. W. (2006). Happiness: Revising set point theory and dynamic equilibrium theory to account for long term change. Berlin: DIW German Institute for Economic Research.
Heim, C., Ehlert, U., & Hellhammer, D. H. (2000). The potential role of hypocortisolism in the pathophysiology of stress-related bodily disorders. Psychoneuroendocrinology, 25(1), 1-35.
Herzlich, C. (1973). Health and illness – A social psychological analysis. London: Academic Press.
Hewig, J., Schlotz, W., Gerhards, F., Breitenstein, C., Lürken, A., & Naumann, E. (2008). Associations of the cortisol awakening response (CAR) with cortical activation asymmetry during the course of an exam stress period. Psychoneuroendocrinology, 33(1), 83-91.
Hilpert, J. C., Husman, J., Stump, G. S., Kim, W., Chung, W. T., & Duggan, M. A. (2012). Examining students' future time perspective: Pathways to knowledge building1. Japanese Psychological Research, 54(3), 229-240.
Hoyt, L. T., Craske, M. G., Mineka, S., & Adam, E. K. (2015). Positive and Negative Affect and Arousal: Cross-Sectional and Longitudinal Associations With Adolescent Cortisol Diurnal Rhythms. Psychosomatic Medicine, 77(4), 392-401.
Hsieh, P-H., Sullivan, J.R., Sass, D.A., & Guerra, N.S. (2012). Undergraduate Engineering Students' Beliefs, Coping Strategies, and Academic Performance: An Evaluation of Theoretical Models. The Journal of Experimental Education, 80(2), 196-218.
Husman, J., Derryberry, W. P., Crowson, H. M., & Lomax, R. (2004). Instrumentality, task value, and intrinsic motivation: Making sense of their independent interdependence. Contemporary Educational Psychology, 29(1), 63-76.
147
Husman, J., & Lens, W. (1999). The role of the future in student motivation. Educational Psychologist, 34(2), 113-125.
Husman, J., & Shell, D. F. (2008). Beliefs and perceptions about the future: A measurement of future time perspective. Learning and Individual Differences, 18(2), 166-175.
Husman, J., Cheng, K. C., Puruhito, K., & Fishman, E. J. (2015). Understanding engineering students’ stress and emotions during an introductory engineering course. In 2015 ASEE Annual Conference & Exposition. American Society for Engineering Education. doi:10.18260/p.24958
Jones, B. D., Paretti, M. C., Hein, S. F., Knott, T. W. (2010). An analysis on motivation constructs with first-year engineering students: Relationships among expectancies, values, achievement, and career plans. Journal of Engineering Education, 99, 319-336.
Karb, R. A., Elliott, M. R., Dowd, J. B., & Morenoff, J. D. (2012). Neighborhood-level stressors, social support, and diurnal patterns of cortisol: The Chicago community adult health study. Social Science & Medicine, 75(6), 1038-1047.
Kauffman, D. F., & Husman, J. (2004). Effects of Time Perspective on Student Motivation: Introduction to a Special Issue. Educational Psychology Review, 16(1), 1–7.
Kemeny, M. E. (2009). Psychobiological responses to social threat: evolution of a psychological model in psychoneuroimmunology. Brain, Behavior, and Immunity, 23(1), 1-9.
Kim, H. K., Tiberio, S. S., Capaldi, D. M., Shortt, J. W., Squires, E. C., & Snodgrass, J. J. (2015). Intimate partner violence and diurnal cortisol patterns in couples. Psychoneuroendocrinology, 51, 35-46.
King, R. B., & Gaerlan, M. J. M. (2014). How you perceive time matters for how you feel in school: Investigating the link between time perspectives and academic emotions. Current Psychology, 33(3), 282-300.
Kirschbaum, C., Pirke, K. M., & Hellhammer, D. H. (1993). The ‘Trier Social Stress Test’–a tool for investigating psychobiological stress responses in a laboratory setting. Neuropsychobiology, 28(1-2), 76-81.
Lam, S. (2012). Chronic stress and emotion regulation: Effects on emotion and the cortisol awakening response (Order No. 3547144). Available from ProQuest Dissertations & Theses Global. (1267152199).
Lens, W., Paixao, M. P., Herrera, D., & Grobler, A. (2012). Future time perspective as a motivational variable: Content and extension of future goals affect the quantity and quality of motivation. Japanese Psychological Research, 54(3), 321-333.
148
Liew, J. (2012). Effortful control, executive functions, and education: Bringing self-‐regulatory and social-‐emotional competencies to the table. Child Development Perspectives, 6(2), 105-111.
Liew, J., McTigue, E. M., Barrois, L., & Hughes, J. N. (2008). Adaptive and effortful control and academic self-efficacy beliefs on achievement: A longitudinal study of 1st through 3rd graders. Early Childhood Research Quarterly, 23(4), 515-526.
Lonnqvist, J., & Deters, F. G. (2016). Facebook friends, subjective well-being, social support, and personality. Computers in Human Behavior, 55, 113.
Lovell, B., Moss, M., & Wetherell, M. A. (2011). Perceived stress, common health complaints and diurnal patterns of cortisol secretion in young, otherwise healthy individuals. Hormones and Behavior, 60(3), 301-305.
Marceau, K., Ruttle, P. L., Shirtcliff, E. A., Hastings, P. D., Klimes-‐Dougan, B., & Zahn-‐Waxler, C. (2015). Within-‐person coupling of changes in cortisol, testosterone, and DHEA across the day in adolescents. Developmental Psychobiology, 57(6), 654-669.
Martin, J., Simmons, D., & Yu, S. (2013). The Role of Social Capital in the Experiences of Hispanic Women Engineering Majors. Journal of Engineering Education, 102(2), 227-243.
McCarthy, M. (1992). The relationship of hopelessness and health locus of control to perimenstrual and stress symptoms. The Chicago School of Professional Psychology, ProQuest, UMI Dissertations Publishing, 1992. DP20876.
McEwen, B. S. (1998). Stress, adaptation, and disease: Allostasis and allostatic load. Annals of the New York Academy of Sciences, 840(1), 33-44.
McGregor, B. A., Murphy, K. M., Albano, D. L., & Ceballos, R. M. (2016). Stress, cortisol, and B lymphocytes: A novel approach to understanding academic stress and immune function. Stress (Amsterdam, Netherlands), 19(2), 185-191.
Miller, G. E., Chen, E., & Zhou, E. S. (2007). If it goes up, must it come down? Chronic stress and the hypothalamic-pituitary-adrenocortical axis in humans. Psychological Bulletin, 133(1), 25.
Miller, K. F., Margolin, G., Shapiro, L. S., & Timmons, A. C. (2017). Adolescent life stress and the cortisol awakening response: The moderating roles of attachment and sex. Journal of Research on Adolescence, 27(1), 34-48.
Moore, M., Höfer, S., McGee, H., & Ring, L. (2005). Can the concepts of depression and quality of life be integrated using a time perspective? Health and Quality of Life Outcomes, 3(1), 1.
149
Mrug, S., Tyson, A., Turan, B., & Granger, D. (2015). Sleep problems predict cortisol reactivity to stress in urban adolescents. Physiology & Behavior, 155(1), 95-101.
Muthén and Muthén. (2002). How to use a Monte Carlo study to decide on sample size and determine power. Los Angeles, CA: Muthén & Muthén.
Nelemans, S. A., Hale III, W. W., Branje, S. T. J., van Lier, P. A. C., Jansen, L. M. C., Platje, E., . . . Meeus, W. H. J. (2014;2013;). Persistent heightened cortisol awakening response and adolescent internalizing symptoms: A 3-year longitudinal community study. Journal of Abnormal Child Psychology, 42(5), 767-777.
Nelson, R. J. (2011). An introduction to behavioral endocrinology (4th ed.). Sunderland, MA: Sinauer Associates.
Nelson, K. G., Husman, J., Brem, S. K., Honsberg, C., & Bowden, S. (2011). Optimizing educational approaches for university photovoltaics education. Paper presented and published at the 37th Institute of Electrical and Electronic Engineers, Photovoltaic Specialists Conference. Seattle, WA.
Nicolson, N. A. (2008). Measurement of cortisol. In L. J. Luecken & L. G. Gallo (Eds.), Handbook of physiological research methods in health psychology (pp. 37-74). Thousand Oaks, CA: SAGE Publications Ltd.
Nuttin, J. & Lens, W. (1985). Future time perspective and motivation: Theory and research method. Leuven & Hillsdale, NJ: Leuven University Press & Erlbaum.
Peetsma, T. D., (2000). Future time perspective as a predictor of school investment. Scandinavian Journal of Educational Research, 44(2), 177-192.
Pekrun, R. (2006). The Control-Value Theory of Achievement Emotions: Assumptions, Corollaries, and Implications for Educational Research and Practice. Educational Psychology Review, 18(4), 315–341.
Pekrun, R., Frenzel, A. C., Goetz, T., & Perry, R. P. (2007). The control-value theory of achievement emotions-chapter 2: An integrative approach to emotions in education. (pp. 13-36) Elsevier Inc.
Pekrun, R., Goetz, T., Frenzel, A. C., Barchfeld, P., & Perry, R. P. (2011). Measuring emotions in students’ learning and performance: The Achievement Emotions Questionnaire (AEQ). Contemporary Educational Psychology, 36(1), 36–48.
Pekrun, R., Cusack, A., Murayama, K., Elliot, A. J., & Thomas, K. (2014). The power of anticipated feedback: Effects on students' achievement goals and achievement emotions. Learning and Instruction, 29, 115-124.
Pekrun, R., & Perry, R. (2014). Control-value theory of achievement emotions. International Handbook of Emotions in Education, 120-141.
150
Perry, R. P., Hall, N. C., & Ruthig, J. C., (2005). Perceived (academic) control and scholastic attainment in higher education. In J. Smart (Ed.), Higher Education: Handbook of Theory and Research, 20, (pp. 363-436). Berlin Heidelberg New York: Springer.
Piehler, T. F., Véronneau, M., & Dishion, T. J. (2012). Substance use progression from adolescence to early adulthood: Effortful control in the context of friendship influence and early-onset use. Journal of Abnormal Child Psychology, 40(7), 1045-1058.
Pierce, G., R., Sarason, I. G., & Sarason, B. R. (1991). General and relationship-based perceptions of social support: Are two constructs better than one? Journal of Personality & Social Psychology, 61, 1028-1039.
Pinto, R. J., Correia-Santos, P., Costa-Leite, J., Levendosky, A. A., & Jongenelen, I. (2016). Cortisol awakening response among women exposed to intimate partner violence. Psychoneuroendocrinology, 74, 57-64.
Pössel, Patrick; Mitchell, Amanda M; Sjögren, Elaine; Kristenson, Margareta. (2015). Do depressive symptoms mediate the relationship between hopelessness and diurnal cortisol rhythm? International Journal of Behavioral Medicine, 22(2), 251-257.
Pompili, M., Innamorati, M., Gonda, X., Serafini, G., Sarno, S., Erbuto, D., ... & Girardi, P. (2013). Affective temperaments and hopelessness as predictors of health and social functioning in mood disorder patients: a prospective follow-up study. Journal of Affective Disorders, 150(2), 216-222.
O'Connor, R. C., & O'Connor, D. B. (2003). Predicting hopelessness and psychological distress: The role of perfectionism and coping. Journal of Counseling Psychology, 50(3), 362.
Oldehinkel, A. J., Hartman, C. A., Nederhof, E., Riese, H., & Ormel, J. (2011). Effortful control as predictor of adolescents' psychological and physiological responses to a social stress test: The Tracking Adolescents' Individual Lives Survey. Development and psychopathology, 23(02), 679-688.
Rachlin, H. (1995). The value of temporal patterns in behavior. Current Directions in Psychological Science, 4, 188-192.
Range, L. M., & Penton, S. R. (1994). Hope, hopelessness, and suicidality in college students. Psychological Reports, 75(1 Pt 2), 456-458.
Rice, L., Barth, J. M., Guadagno, R. E., Smith, G. P. A., McCallum, D. M., & ASERT. (2013). The role of social support in students’ perceived abilities and attitudes toward math and science. Journal of Youth and Adolescence, 42(7), 1028-1040.
Rice, K. G., Leever, B. A., Christopher, J., & Porter, J. D. (2006). Perfectionism, stress, and social (dis)connection: A short-term study of hopelessness,
151
depression, and academic adjustment among honors students. Journal of Counseling Psychology, 53(4), 524-534.
Rogers, C. (1961). On becoming a person. Boston: Houghton Mifflin.
Rothbart, M. K., & Bates, J. E. (2006). Temperament. In W. Damon (Series Ed.) & N. Eisenberg (Vol. Ed.), Handbook of child psychology: Vol. 3, Social, emotional, and personality development (6th Ed., pp. 99-166). New York: Wiley.
Ryff, C. D. (1989a). Happiness is everything, or is it? Explorations on the meaning of psychological well-being. Journal of Personality and Social Psychology, 57, 1069–1081.
Sakiz, G. (2012). Perceived instructor affective support in relation to academic emotions and motivation in college. Educational Psychology, 32(1), 63-79.
Salmela-Aro, K., & Nurmi, J. E. (1997). Goal contents, well-being, and life context during transition to university: A longitudinal study. International Journal of Behavioral Development, 20(3), 471-491.
Salmena-Aro, K., Kiuru, N., Nurmi, J. E., & Eerola, M. (2014). Antecedents and consequences of transitional pathways to adulthood among university students: 18-year longitunidal study. Journal of Adult Development, 21, 48-58.
Saridjan, N. S., Velders, F. P., Jaddoe, V. W., Hofman, A., Verhulst, F. C., & Tiemeier, H. (2014). The longitudinal association of the diurnal cortisol rhythm with internalizing and externalizing problems in pre-schoolers. The Generation R Study. Psychoneuroendocrinology, 50, 118-129.
Saxbe, D. E., Repetti, R. L., & Nishina, A. (2008). Marital satisfaction, recovery from work, and diurnal cortisol among men and women. Health Psychology, 27(1), 15.
Schlotz, W. (2011). Ambulatory psychoneuroendocrinology: assessing salivary cortisol and other hormones in daily life. In Handbook of research methods for studying daily life (pp. 193-209). Guilford.
Sephton, S. E., Lush, E., Dedert, E. A., Floyd, A. R., Rebholz, W. N., Dhabhar, F. S., ... & Salmon, P. (2013). Diurnal cortisol rhythm as a predictor of lung cancer survival. Brain, Behavior, and Immunity, 30, S163-S170.
Sephton, S. E., Sapolsky, R. M., Kraemer, H. C., & Spiegel, D. (2000). Diurnal cortisol rhythm as a predictor of breast cancer survival. Journal of the National Cancer Institute, 92(12), 994-1000.
Shell, D. F., & Husman, J. (2001). The Multivariate Dimensionality of Personal Control and Future Time Perspective Beliefs in Achievement and Self-Regulation. Contemporary Educational Psychology, 26(4), 481–506.
152
Simons, J., Vansteenkiste, M., Lens, W., & Lacante, M. (2004). Placing motivation and future time perspective theory in a temporal perspective. Educational Psychology Review, 16(2), 121-139.
Singh-Manoux, A., Dugravot, A., Elbaz, A., Shipley, M., Kivimaki, M., & Kumari, M. (2014). No evidence of a longitudinal association between diurnal cortisol patterns and cognition. Neurobiology of Aging, 35(10), 2239-2245.
Sladek, M. R., & Doane, L. D. (2015). Daily diary reports of social connection, objective sleep, and the cortisol awakening response during adolescents’ first year of college. Journal of Youth and Adolescence, 44(2), 298-316.
Slatcher, R. B., & Robles, T. F. (2012). Preschoolers' everyday conflict at home and diurnal cortisol patterns. Health Psychology, 31(6), 834.
Slatcher, R. B., Selcuk, E., & Ong, A. D. (2015). Perceived partner responsiveness predicts diurnal cortisol profiles 10 years later. Psychological Science, 26(7), 972-982.
Sjögren, E., Leanderson, P., & Kristenson, M. (2006). Diurnal saliva cortisol levels and relations to psychosocial factors in a population sample of middle-aged Swedish men and women. International Journal of Behavioral Medicine, 13(3), 193-200.
Spangler, G., Pekrun, R., Kramer, K., & Hofmann, H. (2002). Students' emotions, physiological reactions, and coping in academic exams. Anxiety, Stress & Coping, 15(4), 413-432.
Stetler, C., & Miller, G. E. (2005). Blunted cortisol response to awakening in mild to moderate depression: Regulatory influences of sleep patterns and social contacts. Journal of Abnormal Psychology, 114(4), 697-705.
Stouthard, M. E., & Peetsma, T. T. (1999). Future-time perspective: Analysis of a facet-designed questionnaire. European Journal of Psychological Assessment, 15(2), 99.
Suresh, R. (2007). The relationship between barrier courses and persistence in engineering. Journal of College Student Retention: Research, Theory & Practice, 8, 215–239.
Susman, E. J. (2006). Psychobiology of persistent antisocial behavior: Stress, early vulnerabilities and the attenuation hypothesis. Neuroscience & Biobehavioral Reviews, 30(3), 376-389.
Swaner, L. E. (2007). Linking Engaged Learning, Student Mental Health and Well-Being, and Civic Development: A Review of the Literature. Liberal Education, 93(1), 16-25.
Swanson, J., Valiente, C., & Lemery-Chalfant, K. (2012). Predicting academic achievement from cumulative home risk: The mediating roles of effortful
153
control, academic relationships, and school avoidance. Merrill-Palmer Quarterly, 58(3), 375-408.
Turner, J., E., & Schallert, D. L. (2001). Expectancy-value relationship of shame reactions and shame resiliency. Journal of Educational Psychology, 93, 320-329.
Turner, J. E., & Husman, J. (2008). Emotional and cognitive self-regulation following academic shame. Journal of Advanced Academics, 20(1), 138-173.
Ulrike, S., Reinhold, L., & Dirk, H. (2013). Major depression in young girls is related to altered cortisol awakening response. European Child & Adolescent Psychiatry, 22(6), 379-384.
Valiente, C., Lemery-‐Chalfant, K., & Swanson, J. (2009). Children’s responses to daily social stressors: Relations with parenting, children’s effortful control, and adjustment. Journal of Child Psychology and Psychiatry, 50(6), 707-717.
Valiente, C., Eisenberg, N., Haugen, R. G., Spinrad, T. L., Hofer, C., Liew, J., et al. (2011). Children's effortful control and academic achievement: Mediation through social functioning. Early Education and Development, 22, 411-433.
Valiente, C., Eisenberg, N., Spinrad, T. L., Haugen, R. G., Thompson, M. S., & Kupfer, A. (2013). Effortful control and impulsivity as concurrent and longitudinal predictors of academic achievement. The Journal of Early Adolescence, 33(7), 946-972.
van Santen, A., Vreeburg, S. A., Van der Does, A. W., Spinhoven, P., Zitman, F. G., & Penninx, B. W. (2011). Psychological traits and the cortisol awakening response: results from the Netherlands Study of Depression and Anxiety. Psychoneuroendocrinology, 36(2), 240-248.
Vansteenkiste, M., Simons, J., Lens, W., Sheldon, K. M., & Deci, E. L. (2004). Motivating learning, performance, and persistence: the synergistic effects of intrinsic goal contents and autonomy-supportive contexts. Journal of Personality and Social Psychology, 87(2), 246.
Vatan, S., Lester, D., & Gunn III, J. F. (2014). Emotion dysregulation, problem-solving, and hopelessness. Psychological Reports, 114(2), 647-651.
Verstraeten, K., Vasey, M. W., Raes, F., & Bijttebier, P. (2009). Temperament and risk for depressive symptoms in adolescence: Mediation by rumination and moderation by effortful control. Journal of Abnormal Child Psychology, 37(3), 349-361.
Vroom, V. H. (1964). Work and motivation. New York, Wiley.
Vrshek-Schallhorn, S., Doane, L. D., Mineka, S., Zinbarg, R. E., Craske, M. G., & Adam, E. K. (2013). The cortisol awakening response predicts major depression: predictive stability over a 4-year follow-up and effect of depression history. Psychological medicine, 43(3), 483-493.
154
Ware Jr, J. E., Kosinski, M., & Keller, S. D. (1996). A 12-Item Short-Form Health Survey: construction of scales and preliminary tests of reliability and validity. Medical Care, 34(3), 220-233.
Waterman, A. S. (1993). Two conceptions of happiness: Contrasts of personal expressiveness (eudaimonia) and hedonic enjoyment. Journal of Personality and Social Psychology, 64(4), 678–691.
Weekes, N., Lewis, R., Patel, F., Garrison-Jakel, J., Berger, D. E., & Lupien, S. J. (2006). Examination stress as an ecological inducer of cortisol and psychological responses to stress in undergraduate students. Stress: The International Journal on the Biology of Stress, 9(4), 199-206.
Weiner, B. (1985). An attributional theory of achievement motivation and emotion. Psychological Review, 92, 548-573.
Wigfield, A., & Eccles, J. S. (2000). Expectancy–Value theory of achievement motivation. Contemporary Educational Psychology, 25(1), 68-81.

155
APPENDIX A
STUDY 1 BIVARIATE CORRELATION MATRIX OF RAW DATA
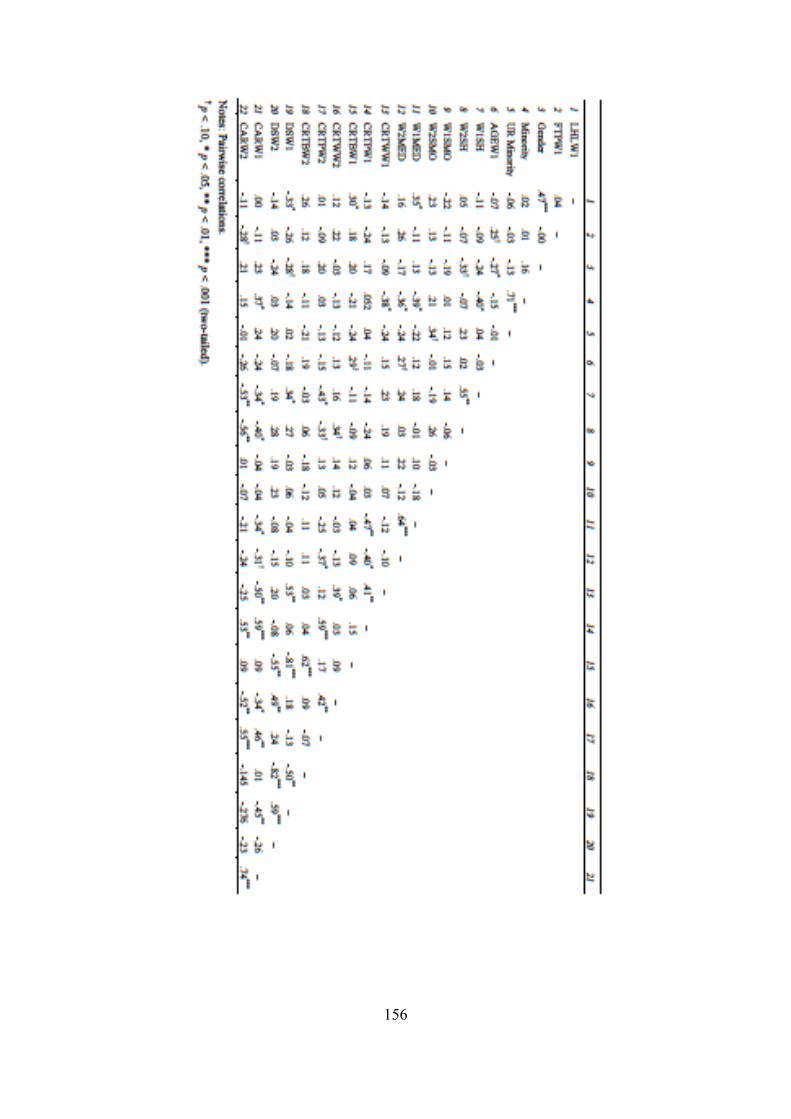
156

157
APPENDIX B
STUDY 2 BIVARIATE CORRELATION MATRIX OF RAW DATA
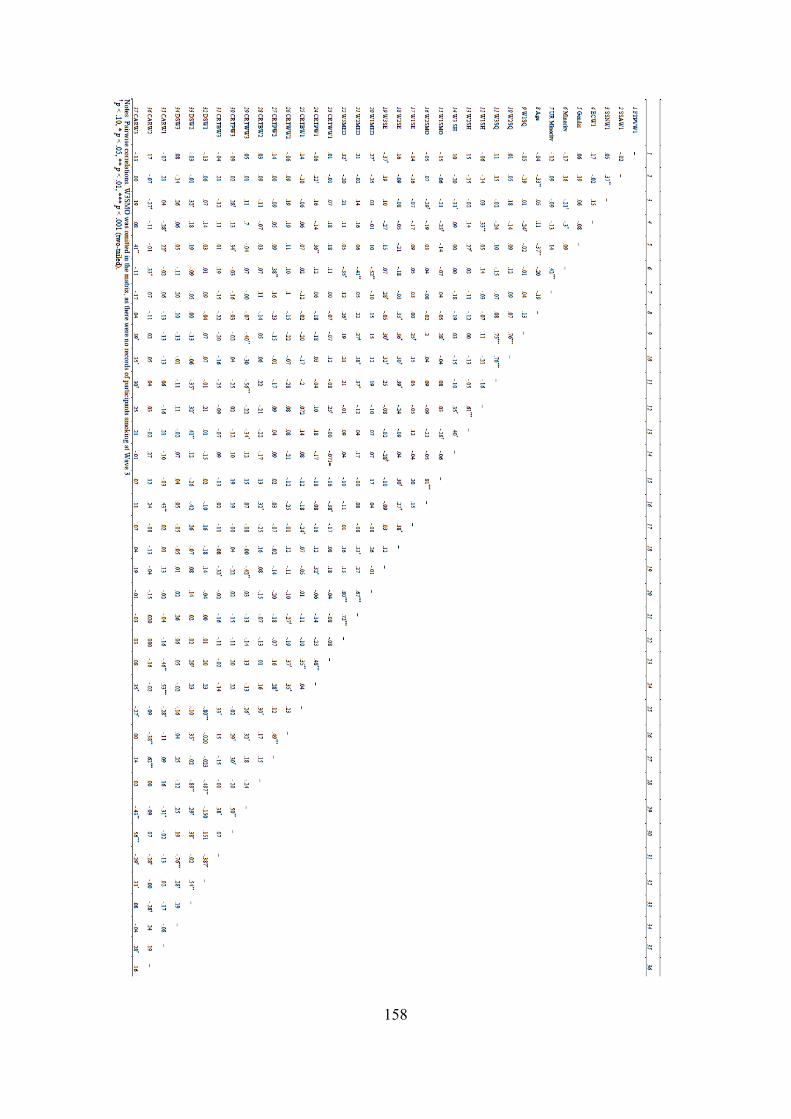
158