Embed Size (px)
Citation preview
Future perspectives of international bioenergy trade
Lukas Kranzl, Vassilis Daioglou, Martin Junginger, Kimon Keramidas,
Julian Matzenberger, Erik Tromborg
IEA Bioenergy Conference 2012, Vienna, November 2012

2
Global bioenergy scenarios
Implication of scenarios on future international bioenergy trade?
Source: IPCC SRREN, 2011
3
Provide insight into “possible futures” of bioenergy trade and discuss drivers, implications and challenges
Objective

4
• Investigate to which extent various global energy models and scenarios take into account bioenergy trade
• Compare selected scenario results
• Identify the drivers and implications of different global bioenergy scenarios on bioenergy trade
• Derive conclusions
Methodological approach
5
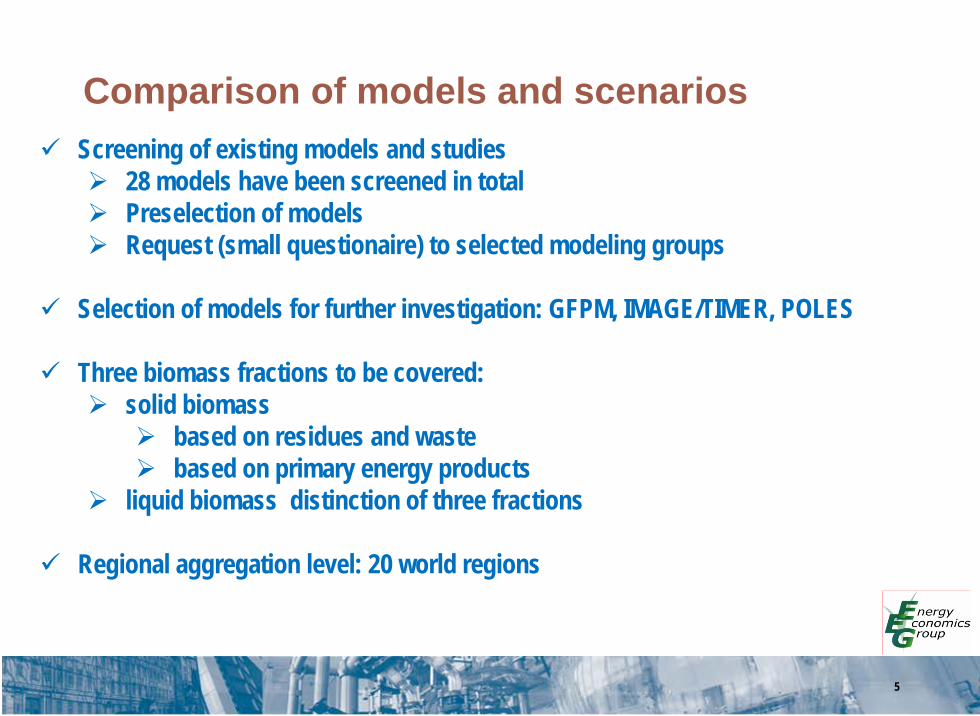
Comparison of models and scenarios Screening of existing models and studies
28 models have been screened in total Preselection of models Request (small questionaire) to selected modeling groups
Selection of models for further investigation: GFPM, IMAGE/TIMER, POLES
Three biomass fractions to be covered:
solid biomass based on residues and waste based on primary energy products
liquid biomass distinction of three fractions
Regional aggregation level: 20 world regions
6
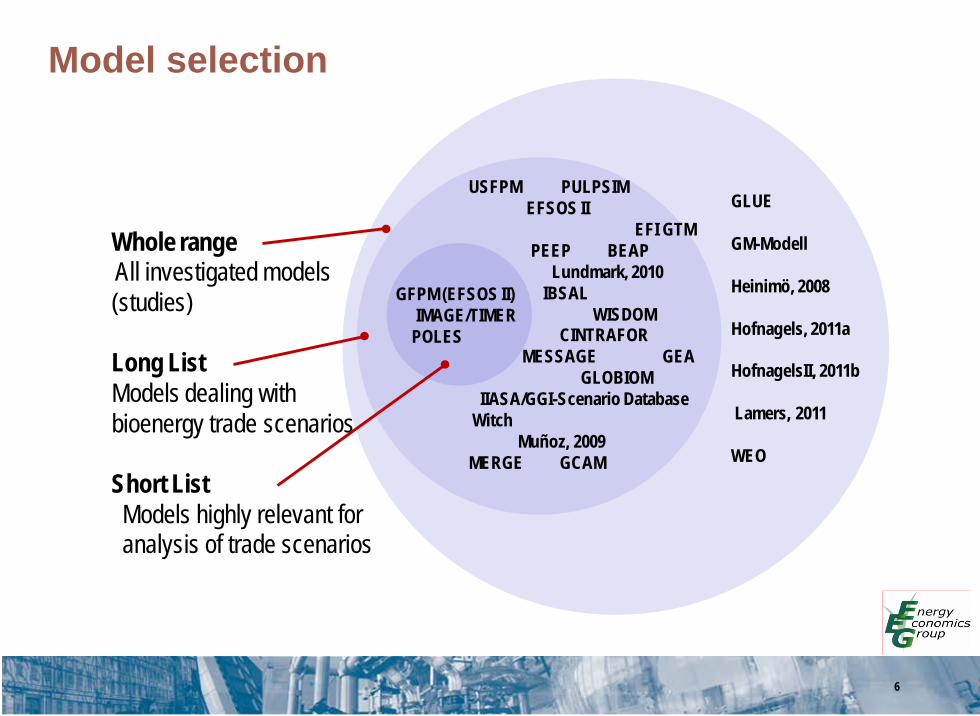
Model selection
Whole rangeAll investigated models(studies)
Long ListModels dealing withbioenergy trade scenarios
Short ListModels highly relevant foranalysis of trade scenarios
GLUE
GM-Modell
Heinimö, 2008
Hofnagels, 2011a
HofnagelsII, 2011b
Lamers, 2011
WEO
GFPM (EFSOS II)IMAGE/TIMER
POLES
USFPM PULPSIMEFSOS II
EFI GTM PEEP BEAP
Lundmark, 2010 IBSAL
WISDOM CINTRAFOR
MESSAGE GEA GLOBIOM
IIASA/GGI-Scenario Database Witch
Muñoz, 2009MERGE GCAM
7
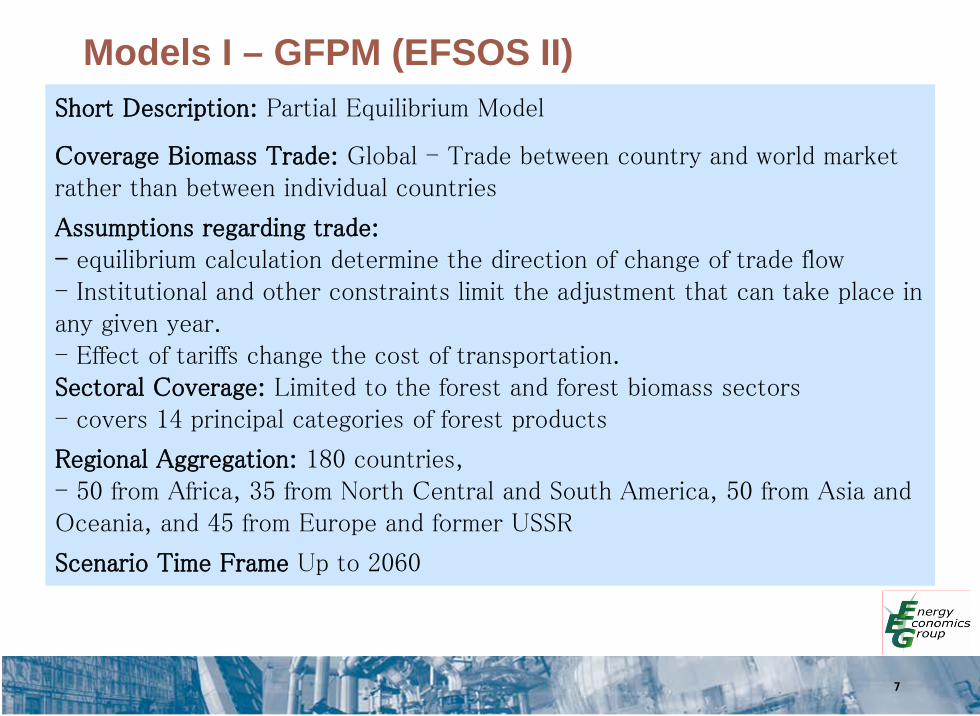
Models I – GFPM (EFSOS II) Short Description: Partial Equilibrium Model
Coverage Biomass Trade: Global - Trade between country and world market rather than between individual countries
Assumptions regarding trade: - equilibrium calculation determine the direction of change of trade flow - Institutional and other constraints limit the adjustment that can take place in any given year. - Effect of tariffs change the cost of transportation. Sectoral Coverage: Limited to the forest and forest biomass sectors - covers 14 principal categories of forest products
Regional Aggregation: 180 countries, - 50 from Africa, 35 from North Central and South America, 50 from Asia and Oceania, and 45 from Europe and former USSR
Scenario Time Frame Up to 2060
8
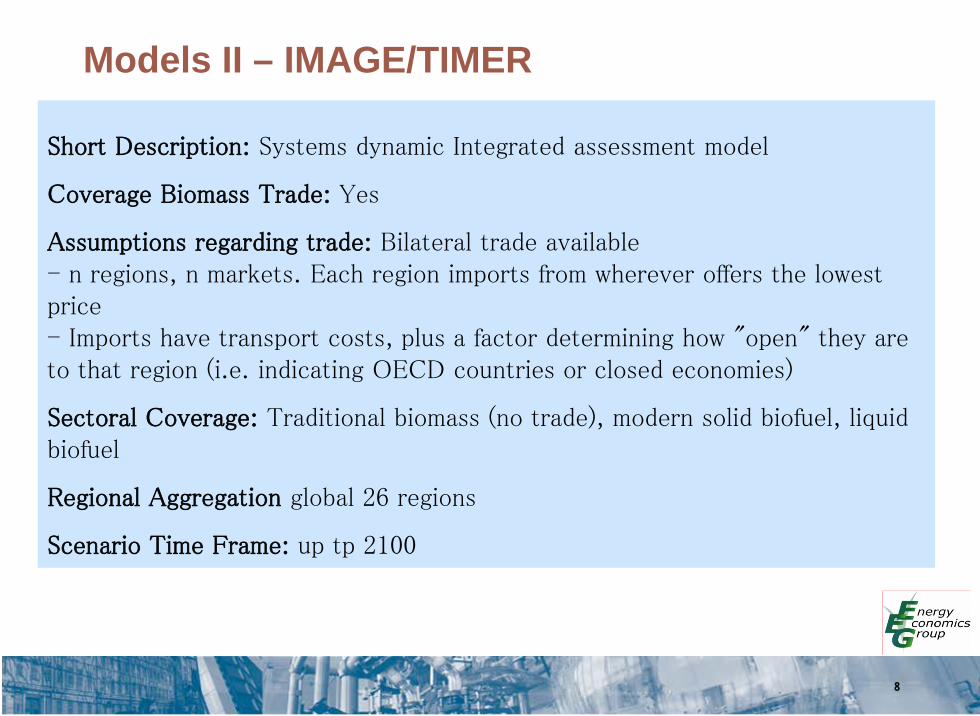
Models II – IMAGE/TIMER Short Description: Systems dynamic Integrated assessment model
Coverage Biomass Trade: Yes
Assumptions regarding trade: Bilateral trade available - n regions, n markets. Each region imports from wherever offers the lowest price - Imports have transport costs, plus a factor determining how "open" they are to that region (i.e. indicating OECD countries or closed economies)
Sectoral Coverage: Traditional biomass (no trade), modern solid biofuel, liquid biofuel
Regional Aggregation global 26 regions
Scenario Time Frame: up tp 2100

9
Models III – POLES Short Description: Partial Equilibrium Model, hybrid, recursive dynamic Coverage Biomass Trade: Yes; global (imports from one single international market) Assumptions regarding trade: Competition between domestic supply and imports from international. Competition occurs over part of the demand each year (infrastructure lifetime, trade inertia). - Internat. solid biomass price: cost curve (biomass use wrt total biomass
potential) - Internat. biofuels price: world avg production costs (explicit technologies) - Transport costs Sectoral Coverage: Traditional biomass (no trade); modern solid biomass (consumed as inputs for biofuels, power sector, industry, buildings); liquid biofuels (transport) Regional Aggregation Global, 57 regions Scenario Time Frame: up to 2100
10
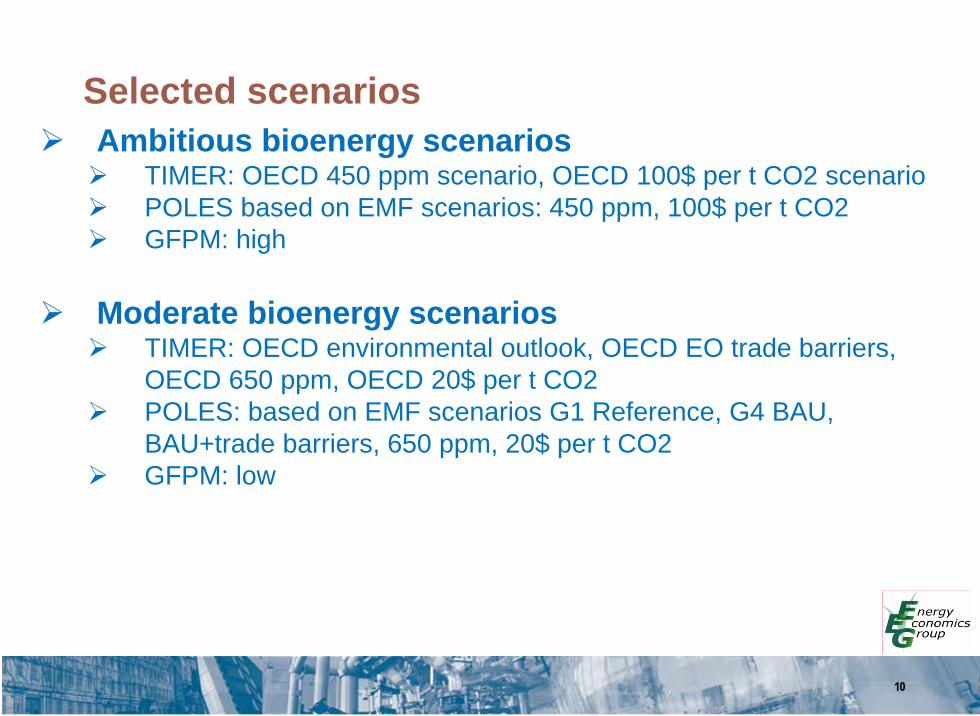
Selected scenarios Ambitious bioenergy scenarios
TIMER: OECD 450 ppm scenario, OECD 100$ per t CO2 scenario POLES based on EMF scenarios: 450 ppm, 100$ per t CO2 GFPM: high
Moderate bioenergy scenarios
TIMER: OECD environmental outlook, OECD EO trade barriers, OECD 650 ppm, OECD 20$ per t CO2
POLES: based on EMF scenarios G1 Reference, G4 BAU, BAU+trade barriers, 650 ppm, 20$ per t CO2
GFPM: low

11
Bioenergy production in selected scenarios
-
50
100
150
200
250
2010
2030
2050
2070
2010
2030
2050
2070
2010
2030
2050
2070
2010
2030
2010
2030
2010
2030
2050
2070
2010
2030
2050
2070
2010
2030
2050
2070
Image /Timer Image /Timer Image /Timer GFPM GFPM POLES POLES POLES
OECD Env. Outlook OECD 100$ pertCO2
OECD 450 High Low BAU 100$/tCO2 450 ppm
EJ Biomass World Biomass Production
Solid biomass residues and waste Solid biomass primary energy products Solid biomass, traditional biomass Liquid Biomass
05
1015202530354045
Ener
gy d
eman
d (E
J)
05
101520253035
Ener
gy d
eman
d (E
J)
12
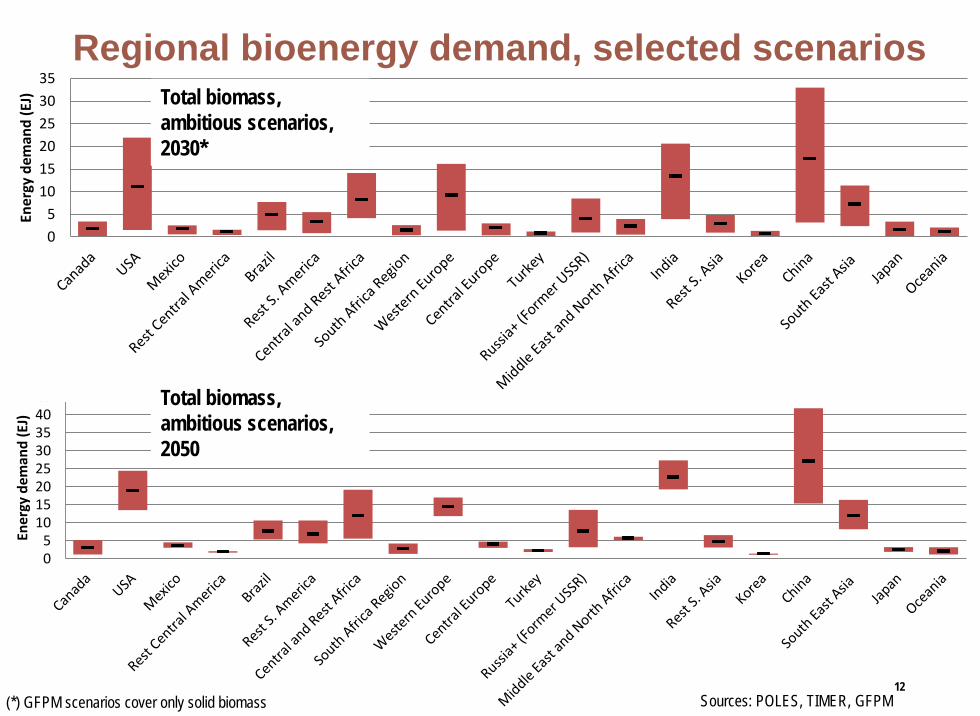
Regional bioenergy demand, selected scenarios Total biomass, ambitious scenarios, 2030*
Sources: POLES, TIMER, GFPM
Total biomass, ambitious scenarios, 2050
(*) GFPM scenarios cover only solid biomass

-20
-15
-10
-5
0
5
10
15
Trad
e ba
lanc
e (E
J)
13
Regional bioenergy trade balances Total biomass, ambitious scenarios, 2030*
Sources: POLES, TIMER, GFPM -20
-15
-10
-5
0
5
10
15
20
25
30
Trad
e ba
lanc
e (E
J)
Total biomass, ambitious scenarios, 2050
14-26% (10-45 EJ) of global bioenergy demand is traded between regions
14-30% (15-70 EJ) of global bioenergy demand is traded between regions
(*) GFPM scenarios cover only solid biomass
14
Selected drivers Regional balancing of supply and demand
Barriers and drivers of bioenergy demand (in current supply and demand regions): oil price, policies, technological learning, GDP …
Barriers and drivers of bioenergy supply Regional development of bio-based industry
Barriers and drivers of bioenergy trade Logistics Trade policies Sustainability requirements …
Technological change Traditional biomass => modern biomass Change in resource base
15
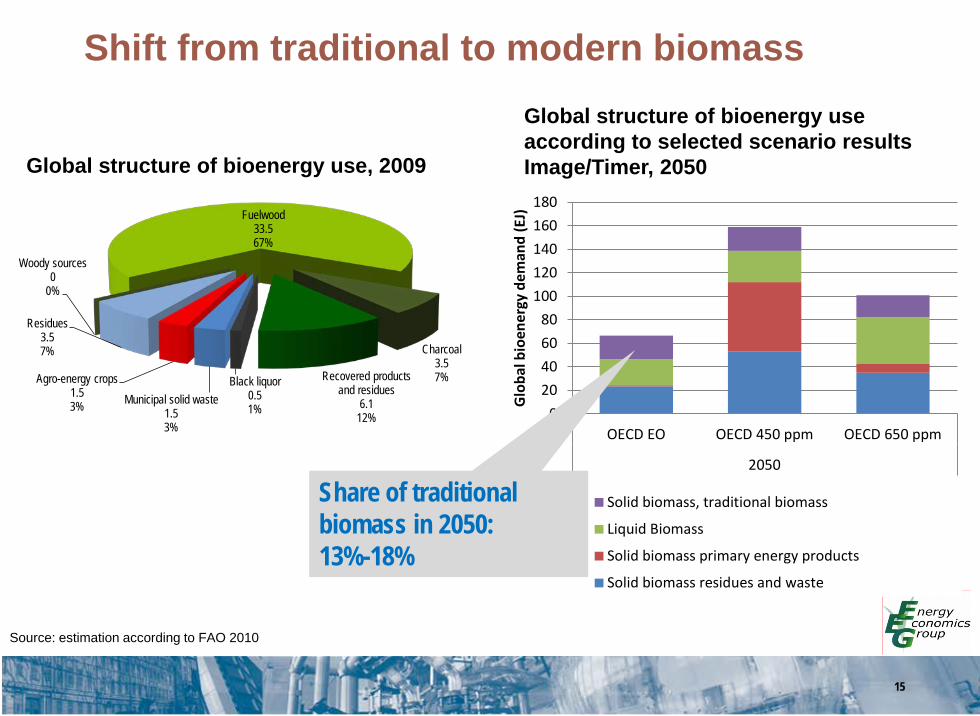
Shift from traditional to modern biomass
Agro-energy crops1.53%
Residues3.57%
Woody sources0
0%
Fuelwood33.567%
Charcoal3.57%Recovered products
and residues6.1
12%
Black liquor0.51%
Municipal solid waste1.53%
Source: estimation according to FAO 2010
Global structure of bioenergy use, 2009
Global structure of bioenergy use according to selected scenario results Image/Timer, 2050
020406080
100120140160180
OECD EO OECD 450 ppm OECD 650 ppm
2050
Glo
bal b
ioen
ergy
dem
and
(EJ)
Solid biomass, traditional biomass
Liquid Biomass
Solid biomass primary energy products
Solid biomass residues and waste
Share of traditional biomass in 2050: 13%-18%
16
Conclusions (1) Quantities of produced biomass are rising in all
investigated scenarios. All investigated scenarios show a strong increase in total
internationally traded biomass (in a range of 20-90 fold increase from 2010 to 2050).
The development of international bioenergy trade will be driven strongly by Climate policies Regional differences of policies, GDP Supply of biomass resources Technological change and thus shift in the biomass resource base Sustainability requirements Overall global energy demand, GDP, population, …
17
Conclusions (2): robust results in most scenarios
Key potential future bioenergy export regions according to model scenarios in 2050: Russia + former USSSR (40% of trade, 10% of global demand)*, Canada, South-America, Central and Rest Africa, Oceania (40% of
trade, 10% of global demand)*
Key future bioenergy import regions in 2050: India (33% of trade, 8% of global demand)* Western Europe, China (39% of trade, 9% of global demand)*
USA: relevant importer of liquid biofuels, small exporter (or balanced) for
solid biomass China: high difference between ambitious and non-ambitious scenarios
(*) values refer to 2050, average of ambitious bioenergy scenarios
18
Conclusions (3) Open questions:
Impact of different supply and demand functions in the models Impact of other energy technologies in the scenarios Consideration of bioenergy trade barriers in the models? Impact of trade patterns on future bioenergy scenarios? …
Only a few number of global energy models explicitely simulate international bioenergy trade.
Nevertheless, all global energy scenarios need to make an assumption on the future development of bioenergy trade.
A further investigation and integration of international bioenergy trade, barriers and drivers into existing modeling frameworks is highly needed.