Embed Size (px)
Citation preview
Future of the Qatari Defense Industry –
Market Attractiveness, Competitive
Landscape and Forecasts to 2020
Future of the Qatari Defense Industry – Market Attractiveness, Competitive Landscape and Forecasts to 2020
2
TABLE OF CONTENTS
1 Introduction ........................................................................................................................... 7
1.1 What is this Report About? ........................................................................................................... 7
1.2 Definitions ...................................................................................................................................... 7
1.3 Summary Methodology .................................................................................................................. 9
1.4 SDI Terrorism Index ......................................................................................................................10
1.5 About Strategic Defence Intelligence ..........................................................................................10
2 Executive Summary ............................................................................................................ 11
3 Market Attractiveness and Emerging Opportunities ........................................................ 13
3.1 Defense Market Size Historical and Forecast..............................................................................14
3.1.1 Qatari defense budget to grow at a CAGR of XX% during 2011–2015 ................................................... 14
3.1.2 Arms race in the Middle East and strong cash reserves are the main factors driving Qatari defense
expenditure ........................................................................................................................................................... 18
3.2 Analysis of Defense Budget Allocation .......................................................................................19
3.2.1 Procurement of advanced equipment to drive capital expenditure allocation during the forecast period 19
3.2.2 Defense expenditure as a percentage of GDP to increase during the forecast period ............................ 21
3.3 Homeland Security Market Size and Forecast ............................................................................23
3.3.1 Homeland security expenditure (HLS) in Qatar is mainly driven by Maritime Security, the Soccer World
Cup 2022, and Cyber-security .............................................................................................................................. 23
3.3.2 Qatar considered a some risk country for terror activities ........................................................................ 24
3.3.3 Qatar faces minimal threat from terrorists ................................................................................................ 25
3.4 Benchmarking with Key Global Markets .....................................................................................26
3.4.1 Qatari defense budget expected to register rapid growth over the period 2016–2020 ............................ 26
3.4.2 Qatari defense expenditure is small compared to the leading spenders ................................................. 28
3.4.3 Qatar spent over XX% of its GDP on defense in 2015 ............................................................................. 29
3.4.4 Qatar faces “some risk” by acts of terrorism ............................................................................................. 30
3.5 Market Opportunities: Key Trends and Drivers ..........................................................................32
3.5.1 Missile Defense Systems.......................................................................................................................... 32
3.5.2 Land based C4ISR ................................................................................................................................... 33
3.5.3 Fighters &Multi-Role Aircraft ..................................................................................................................... 34
3.5.4 Multi-Mission Helicopters .......................................................................................................................... 35
3.5.5 Attack Helicopters ..................................................................................................................................... 36
4 Defense Procurement Market Dynamics ........................................................................... 37
4.1 Import Market Dynamics ...............................................................................................................38
4.1.1 Defense imports are expected to increase during the forecast period ..................................................... 38
4.1.2 US to continue to be major arms suppliers to Qatar ................................................................................ 39
Future of the Qatari Defense Industry – Market Attractiveness, Competitive Landscape and Forecasts to 2020
3
4.1.3 Aircraft and missiles constitute the majority of Qatari arms imports ........................................................ 40
4.2 Export Market Dynamics ..............................................................................................................41
4.2.1 Qatari defense exports market is negligible ............................................................................................. 41
5 Industry Dynamics .............................................................................................................. 42
5.1.1 Bargaining power of supplier: medium to high ......................................................................................... 43
5.1.2 Bargaining power of buyer: medium to high ............................................................................................. 43
5.1.3 Barrier to entry: medium ........................................................................................................................... 43
5.1.4 Intensity of rivalry: low to medium ............................................................................................................ 43
5.1.5 Threat of substitution: medium to high ..................................................................................................... 43
6 Market Entry Strategy ......................................................................................................... 44
6.1 Market Regulation .........................................................................................................................44
6.1.1 Undisclosed FDI policy relating to defense .............................................................................................. 44
6.1.2 Qatar has undisclosed offset policy .......................................................................................................... 44
6.2 Market Entry Route .......................................................................................................................45
6.2.1 Historical evidence points to Foreign Military Sale (FMS) being the preferred entry route ...................... 45
6.2.2 Gulf Cooperation Council (GCC) to form joint Military Command which could be an alternative entry
route for foreign OEMs .......................................................................................................................................... 45
6.2.3 Cooperative agreement and military collaborations an easier way to access the Qatari defense market45
6.3 Key Challenges .............................................................................................................................46
6.3.1 US domination of the Qatari defense market reduces opportunities for other foreign manufacturers ..... 46
6.3.2 Scarcity of skilled labor ............................................................................................................................. 46
7 Competitive Landscape and Strategic Insights ................................................................ 47
7.1 Competitive Landscape Overview ...............................................................................................47
7.2 Key Foreign Companies ...............................................................................................................47
7.2.1 Lockheed Martin: overview ....................................................................................................................... 47
7.2.2 Lockheed Martin: products and services .................................................................................................. 47
7.2.3 Lockheed Martin: recent announcements and strategic initiatives ........................................................... 47
7.2.4 Lockheed Martin: alliances ....................................................................................................................... 48
7.2.5 Lockheed Martin: recent contract wins ..................................................................................................... 49
7.2.6 Sikorsky: overview .................................................................................................................................... 49
7.2.7 Sikorsky: products and services ............................................................................................................... 49
7.2.8 Sikorsky: recent announcements and strategic initiatives ........................................................................ 50
7.2.9 Sikorsky: alliances .................................................................................................................................... 51
7.2.10 Sikorsky: recent contract wins .................................................................................................................. 53
7.2.11 Raytheon: overview .................................................................................................................................. 53
7.2.12 Raytheon: products and services ............................................................................................................. 53
7.2.13 Raytheon: recent announcements and strategic initiatives ...................................................................... 54
Future of the Qatari Defense Industry – Market Attractiveness, Competitive Landscape and Forecasts to 2020
4
7.2.14 Raytheon: alliances .................................................................................................................................. 55
7.2.15 Raytheon: recent contract wins ................................................................................................................ 56
7.2.16 Pilatus Aircraft Limited: Overview ............................................................................................................. 57
7.2.17 Pilatus Aircraft Limited: Products and services ........................................................................................ 57
7.2.18 Pilatus Aircraft Limited: Recent announcements and strategic initiatives ................................................ 57
7.2.19 Pilatus Aircraft Limited: Alliances ............................................................................................................. 58
7.2.20 Pilatus Aircraft Limited: Recent contract wins .......................................................................................... 58
8 Business Environment and Country Risk ......................................................................... 59
8.1 Demographics ...............................................................................................................................59
8.1.1 Total Rural population ............................................................................................................................... 59
8.1.2 Total urban population .............................................................................................................................. 60
8.2 Economic Performance ................................................................................................................61
8.2.1 GDP per capita at constant prices ............................................................................................................ 61
8.2.2 GDP at current prices (US$ Billion) .......................................................................................................... 62
8.2.3 Exports of goods and services (current US$ bn) ...................................................................................... 63
8.2.4 Imports of goods and services (current US$ bn) ...................................................................................... 64
8.2.5 Gross national disposable income (US$ billion) ....................................................................................... 65
8.2.6 Manufacturing output (US$ bn) ................................................................................................................ 66
8.2.7 Consumer price index ............................................................................................................................... 67
8.2.8 Market capitalization of listed companies (US$ bn) ................................................................................. 68
8.2.9 Market capitalization of listed companies (% of GDP) ............................................................................. 69
8.2.10 International reserves, including gold (US$ billion) .................................................................................. 70
8.3 Energy and utilities .......................................................................................................................71
8.3.1 Total Conventional Thermal Electricity Net Generation (Billion kWh) ...................................................... 71
8.3.2 Total Conventional Thermal Electricity Installed Capacity (Million kW) ................................................... 72
8.3.3 Total Petroleum Consumption (Thousand Barrels Per Day) .................................................................... 73
8.3.4 Total Proven Reserves of Natural Gas ..................................................................................................... 74
8.4 Infrastructure Quality and Availability .........................................................................................75
8.4.1 Air transport, freight (million ton-km) ........................................................................................................ 75
8.5 Mineral ...........................................................................................................................................76
8.5.1 Mining, Manufacturing, Utilities Output (US$ billion) ................................................................................ 76
8.6 Technology ....................................................................................................................................77
8.6.1 Research and development expenditure (LCU thousands) ..................................................................... 77
8.7 Telecommunication ......................................................................................................................78
8.7.1 Telephone lines (in mn) ............................................................................................................................ 78
8.7.2 Telephone lines Penetration Rate (per 100 people) ................................................................................. 79
9 Appendix .............................................................................................................................. 80

Future of the Qatari Defense Industry – Market Attractiveness, Competitive Landscape and Forecasts to 2020
5
9.1 About SDI .......................................................................................................................................80
9.2 Disclaimer ......................................................................................................................................80
Future of the Qatari Defense Industry – Market Attractiveness, Competitive Landscape and Forecasts to 2020
6
LIST OF FIGURES
Figure 1: Qatari Defense Expenditure, 2011–2015 ............................................................................................................................................. 14 Figure 2: Qatari Defense Expenditure, 2016–2020 ............................................................................................................................................. 15 Figure 3: Qatari Defense Expenditure (in QAR Billion), 2011–2015 .................................................................................................................... 16 Figure 4: Qatari Defense Expenditure (in QAR Billion),2016–2020 ..................................................................................................................... 17 Figure 5: Qatari Defense Budget Split Between Capital and Revenue Expenditure (%), 2011–2015 .................................................................. 19 Figure 6: Qatari Defense Budget Split Between Capital and Revenue Expenditure (%), 2016–2020 .................................................................. 20 Figure 7: Qatari GDP Growth vs. Defense Expenditure Growth and Defense Expenditure as Percentage of GDP, 2011–2015 .......................... 21 Figure 8: Qatari GDP Growth vs. Defense Expenditure Growth and Defense Expenditure as Percentage of GDP, 2016–2020 .......................... 22 Figure 9: SDI Terrorism Heat Map, 2015 ............................................................................................................................................................ 24 Figure 10: SDI Terrorism Index, 2015 ................................................................................................................................................................. 25 Figure 11: Benchmarking with Key Markets,2011–2015 vs. 2016–2020 ............................................................................................................. 27 Figure 12: Benchmarking with World’s Largest Defense Spenders (US$ Billion), 2015 and 2020 ....................................................................... 28 Figure 13: Benchmarking with Large Defense Spenders as % of GDP – 2015 ................................................................................................... 29 Figure 14: Missile Defense Systems Market Size (US$ Million), 2015–2025 ....................................................................................................... 32 Figure 15: Land based C4ISR Market Size (US$ Million), 2015–2025 ................................................................................................................ 33 Figure 16: Multi-role Aircraft (US$ Million), 2015–2025 ....................................................................................................................................... 34 Figure 17: Multi-mission Helicopter(US$ Million), 2015–2025 ............................................................................................................................. 35 Figure 18: Attack Helicopters (US$ Million), 2015–2025 ..................................................................................................................................... 36 Figure 19: Qatari Defense Imports (US$ million), 2009–2013 ............................................................................................................................. 38 Figure 20: Qatari Defense Imports by Country (%), 2009–2013 .......................................................................................................................... 39 Figure 21: Qatari Defense Imports by Category, 2009–2013 .............................................................................................................................. 40 Figure 22: Industry Dynamics - Porter’s Five Forces Analysis............................................................................................................................. 42 Figure 23: Qatari Rural population (In million), 2016–2025 ................................................................................................................................. 59 Figure 24: Qatari Urban population (In million), 2016–2025 ................................................................................................................................ 60 Figure 25: Qatari GDP Per Capita at Constant Prices (US$), 2011–2020 ........................................................................................................... 61 Figure 26: Qatari GDP at Current Prices (US$ Billion), 2011–2020..................................................................................................................... 62 Figure 27: Qatari Exports of goods and services (US$), 2002–2011 ................................................................................................................... 63 Figure 28: Qatari Imports of goods and services (US$), 2002–2011 ................................................................................................................... 64 Figure 29: Qatari Gross national disposable income (US$ billion), 2002–2011 ................................................................................................... 65 Figure 30: Qatari Manufacturing output (US$ Billion), 2002–2011 ...................................................................................................................... 66 Figure 31: Qatari Consumer price index, 2009–2018 .......................................................................................................................................... 67 Figure 32: Qatari market capitalization of listed companies (US$ billion), 2003–2012 ......................................................................................... 68 Figure 33: Qatari market capitalization of listed companies (% of GDP), 2002–2011 .......................................................................................... 69 Figure 34: Qatari International reserves, including gold (US$ billion), 2002-2011 ............................................................................................... 70 Figure 35: Qatari Total Conventional Thermal Electricity Net Generation (Billion Kilowatt hours), 2002–2011 .................................................... 71 Figure 36: Qatari Total Conventional Thermal Electricity Installed Capacity (Million Kilowatts), 2001–2010 ........................................................ 72 Figure 37: Qatari Total Petroleum Consumption (Thousand Barrels Per Day), 2003–2012 ................................................................................. 73 Figure 38: Total Proved Reserves of Natural Gas(Trillion Cubic Feet), 2004–2013............................................................................................. 74 Figure 39: Qatari Air transport, freight (million ton-km), 2002–2011 .................................................................................................................... 75 Figure 40: Qatari Mining, Manufacturing, Utilities Output (US$ billion), 2002–2011............................................................................................. 76 Figure 41: Qatari R&D expenditure (LCU thousands), 2000–2008 ...................................................................................................................... 77 Figure 42: Qatari Telephone lines, 2003–2012 ................................................................................................................................................... 78 Figure 43: Qatari Telephone lines Penetration Rate (per 100 people), 2003–2012 ............................................................................................. 79
Future of the Qatari Defense Industry – Market Attractiveness, Competitive Landscape and Forecasts to 2020
7
LIST OF TABLES
Table 1: Qatari Defense Expenditure (US$ Billion), 2011–2015 .......................................................................................................................... 14 Table 2: Qatari Defense Expenditure, 2016–2020 .............................................................................................................................................. 15 Table 3: Qatari Defense Expenditure (in QAR Billion), 2011–2015 ..................................................................................................................... 16 Table 4: Qatari Defense Expenditure (in QAR Billion), 2016–2020 ..................................................................................................................... 17 Table 5: Qatari Defense Budget Split Between Capital and Revenue Expenditure (%), 2011–2015.................................................................... 19 Table 6: Qatari Defense Budget Split Between Capital and Revenue Expenditure (%), 2016–2020.................................................................... 20 Table 7: Qatari GDP Growth vs. Defense Expenditure Growth and Defense Expenditure as Percentage of GDP, 2011–2015 ........................... 21 Table 8: Qatari GDP Growth vs. Defense Expenditure Growth and Defense Expenditure as Percentage of GDP, 2016–2020 ........................... 22 Table 9: Benchmarking with Key Markets, 2011–2015 vs. 2016–2020 ............................................................................................................... 26 Table10: SDI Terrorism Index ............................................................................................................................................................................. 30 Table 11: Lockheed Martin – product focus ........................................................................................................................................................ 47 Table 12: Lockheed Martin – Alliances ............................................................................................................................................................... 48 Table 13: Lockheed Martin – Recent Contract Wins ........................................................................................................................................... 49 Table 14: Sikorsky: Alliances .............................................................................................................................................................................. 51 Table 15: Sikorsky: Recent Contract Wins .......................................................................................................................................................... 53 Table 16: Raytheon – Product Focus .................................................................................................................................................................. 53 Table 17: Raytheon – Alliances .......................................................................................................................................................................... 55 Table 18: Raytheon – Recent Contract Wins ...................................................................................................................................................... 56 Table 19: Pilatus Aircraft Limited – Alliances ...................................................................................................................................................... 58 Table 20: Pilatus Aircraft Limited – Recent Contract Wins .................................................................................................................................. 58
Future of the Qatari Defense Industry – Market Attractiveness, Competitive Landscape and Forecasts to 2019
8
1. Executive Summary
Qatar’s defense expenditure is expected to post strong growth during the forecast period
Qatar is a small peninsular country with a geographical area under 12,000 sq.km and a native population of
under a quarter of a million. However, it is the third largest country in terms of natural gas reserves in the
world and has the highest GDP per capita, and for that reason, Qataris gaining attention for its increasing
military expenditure. Wealthy countries like Qatar need a strong military to reinforce its economic influence
and protect its interests. The country is currently in a phase of military modernization, with an aim to keep
pace with its neighbors such as the UAE, Bahrain, and Oman. The main factors driving procurement in the
region is the arms race in the Middle East region, modernization initiatives, and a perceived security threat
from Iran.With a lack of indigenous defense capabilities and trained manpower, the country is seeking
advanced defense equipment from foreign OEMs in order to provide effective protection to its strategic
assets and critical infrastructure. With natural gas prices increasing, the cash rich government is focused
on increasing its military expenditure, which stood at US$XX billion in 2015. The budget is expected to
grow at an estimated CAGR of XX% over the forecast period, to reach US$XX billion in 2020.
The country’s capital expenditure is expected to increase from US$XX billion in 2016 to US$XX billion in
2020, growing at a strong CAGR of XX% during the forecast period. The Qatari Defense Ministry is
expected to procure attack and multi-utility helicopters, missile defense systems, fighter aircraft, main battle
tanks, and early warning radar systems. Additionally, opportunities in security systems and platforms are
expected to arise as a result of the country hosting the soccer World Cup 2022. With a need for enhanced
security and surveillance systems, Qatar is expected to spend on cameras, wireless systems, airport
security, biometric systems, video-surveillance systems, training, and cyber security software during the
forecast period.
Future of the Qatari Defense Industry – Market Attractiveness, Competitive Landscape and Forecasts to 2019
9
2. Market Attractiveness and Emerging Opportunities
Being one of the most attractive markets in the Middle East due to its robust financial position and
aggressive procurement strategies, Qatar is closing its gap with historical regional strongholds such as
Saudi Arabia and UAE. For the moment, the country’s procurements are focused on missile defense
systems and associated radars, a trend that is being witnessed throughout the Middle East. With a
collective expenditure of over US$XX billion, the primary reason for such expenditure is the need to build
up defense against Iranian ballistic missiles and long-range rockets. Qatari defense expenditure stands
at US$XX billion in 2015 and is estimated to increase at a strong CAGR of XX% to reach US$XX billion
by 2020. Qatari defense expenditure is primarily driven by participating in peacekeeping initiatives, the
upgrade of military equipment such as Terminal High Altitude Area Defense Systems (THAADS) and
PAC missile defense systems, multi-mission and attack helicopters, fighter aircraft main battle tanks and
the procurement of advanced technology equipment. The country’s cumulative expenditure on the
procurement of advanced military hardware is projected to be US$XX billion over the next five years.
With an underdeveloped domestic defense sector, the country is reliant on foreign manufacturers and
this will provide numerous opportunities for suppliers and OEMs to access the Qatari market. The
country’s defense industry is expected to focus its expenditure on Main Battle Tanks (MBTs), artillery
systems, missile defense systems, radar systems, utility helicopters, training and fighter aircraft, and
night-vision goggles.
.
Future of the Qatari Defense Industry – Market Attractiveness, Competitive Landscape and Forecasts to 2019
10
2.1. Defense Market Size Historical and Forecast
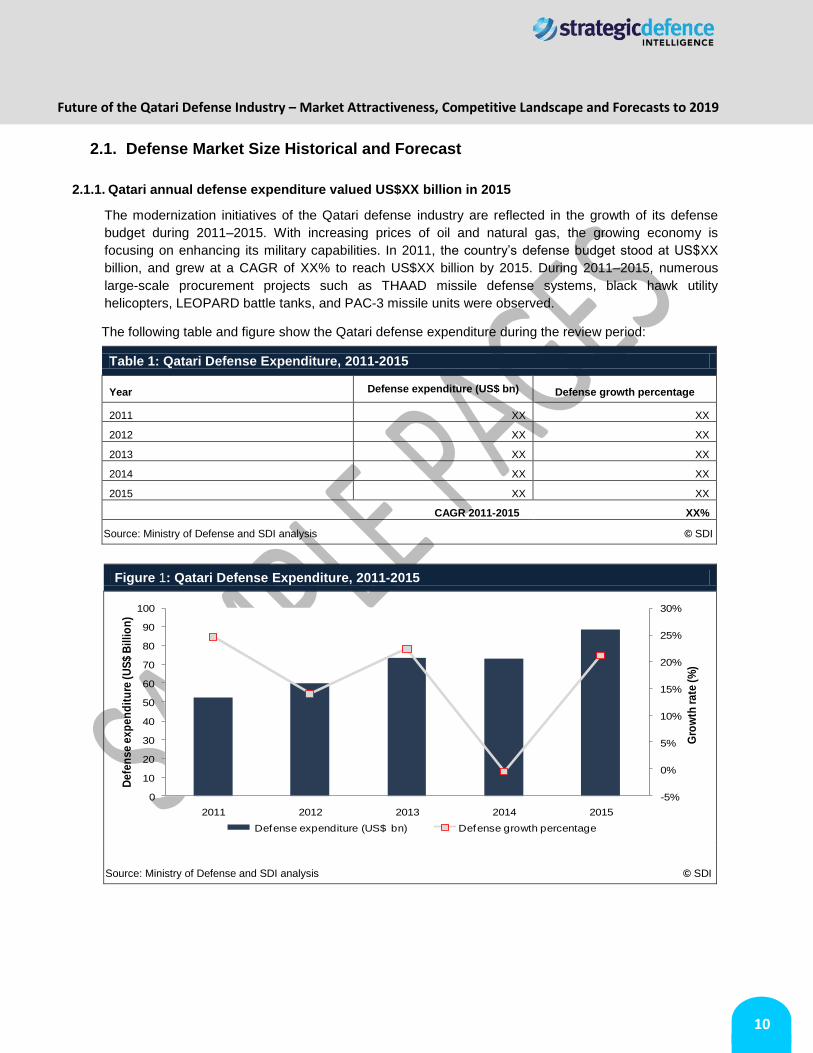
2.1.1. Qatari annual defense expenditure valued US$XX billion in 2015
The modernization initiatives of the Qatari defense industry are reflected in the growth of its defense
budget during 2011–2015. With increasing prices of oil and natural gas, the growing economy is
focusing on enhancing its military capabilities. In 2011, the country’s defense budget stood at US$XX
billion, and grew at a CAGR of XX% to reach US$XX billion by 2015. During 2011–2015, numerous
large-scale procurement projects such as THAAD missile defense systems, black hawk utility
helicopters, LEOPARD battle tanks, and PAC-3 missile units were observed.
The following table and figure show the Qatari defense expenditure during the review period:
Table 1: Qatari Defense Expenditure, 2011-2015
Year Defense expenditure (US$ bn)
Defense growth percentage
2011 XX XX
2012 XX XX
2013 XX XX
2014 XX XX
2015 XX XX
CAGR 2011-2015 XX%
Source: Ministry of Defense and SDI analysis © SDI
Figure 1: Qatari Defense Expenditure, 2011-2015
Source: Ministry of Defense and SDI analysis © SDI
-5%
0%
5%
10%
15%
20%
25%
30%
0
10
20
30
40
50
60
70
80
90
100
2011 2012 2013 2014 2015
Gro
wth
ra
te (
%)
De
fen
se
ex
pe
nd
itu
re (
US
$ B
illi
on
)
Defense expenditure (US$ bn) Defense growth percentage
Future of the Qatari Defense Industry – Market Attractiveness, Competitive Landscape and Forecasts to 2019
11
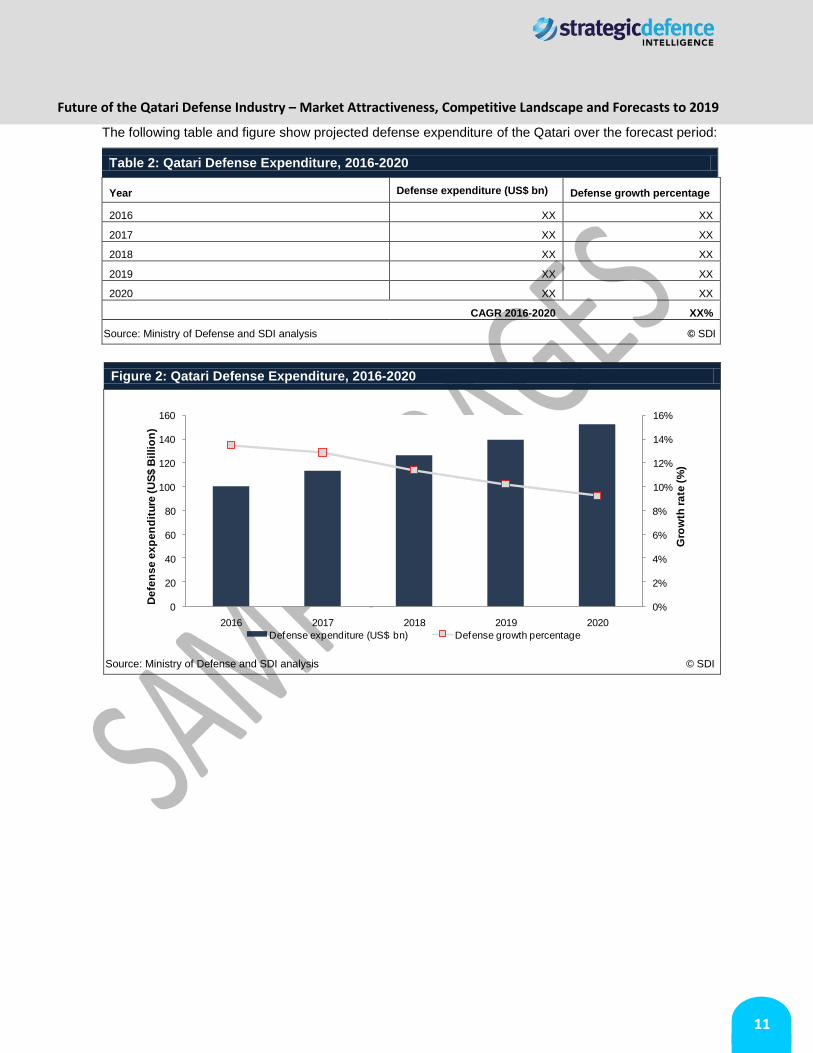
The following table and figure show projected defense expenditure of the Qatari over the forecast period:
Table 2: Qatari Defense Expenditure, 2016-2020
Year Defense expenditure (US$ bn)
Defense growth percentage
2016 XX XX
2017 XX XX
2018 XX XX
2019 XX XX
2020 XX XX
CAGR 2016-2020 XX%
Source: Ministry of Defense and SDI analysis © SDI
Figure 2: Qatari Defense Expenditure, 2016-2020
Source: Ministry of Defense and SDI analysis © SDI
0%
2%
4%
6%
8%
10%
12%
14%
16%
0
20
40
60
80
100
120
140
160
2016 2017 2018 2019 2020
Gro
wth
ra
te (
%)
De
fen
se
ex
pe
nd
itu
re (
US
$ B
illi
on
)
Defense expenditure (US$ bn) Defense growth percentage
Future of the Qatari Defense Industry – Market Attractiveness, Competitive Landscape and Forecasts to 2019
12
2.2. Analysis of Defense Budget Allocation
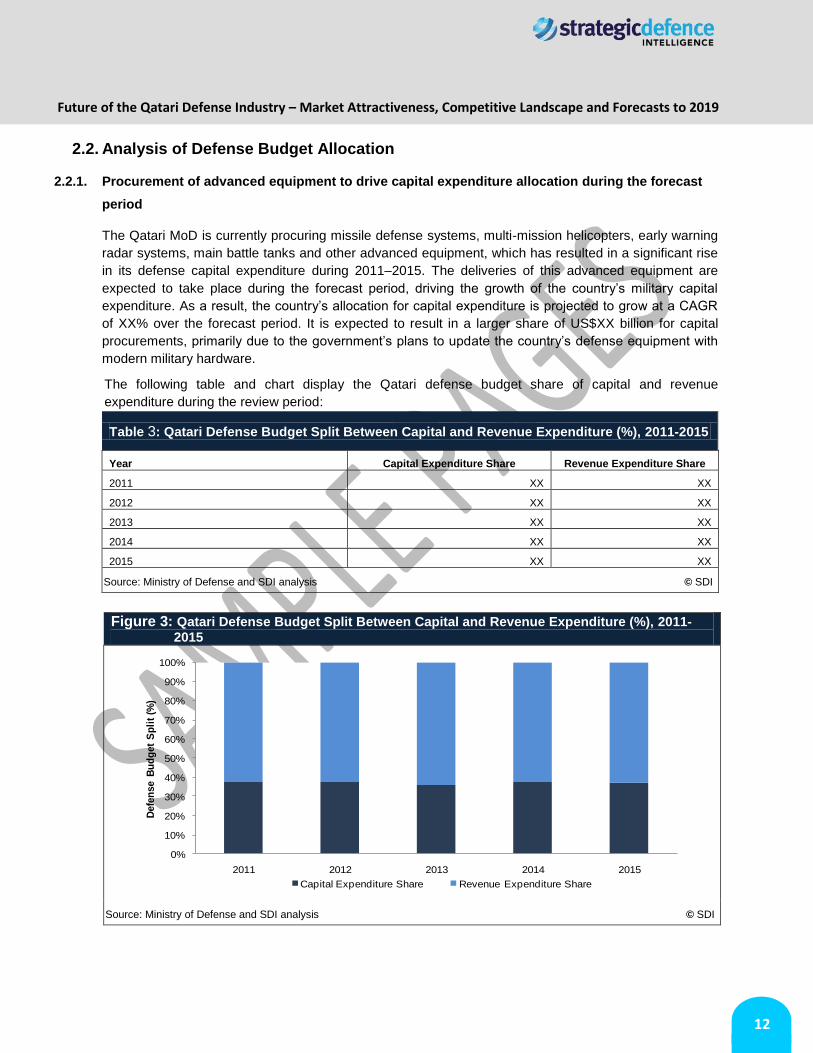
2.2.1. Procurement of advanced equipment to drive capital expenditure allocation during the forecast
period
The Qatari MoD is currently procuring missile defense systems, multi-mission helicopters, early warning
radar systems, main battle tanks and other advanced equipment, which has resulted in a significant rise
in its defense capital expenditure during 2011–2015. The deliveries of this advanced equipment are
expected to take place during the forecast period, driving the growth of the country’s military capital
expenditure. As a result, the country’s allocation for capital expenditure is projected to grow at a CAGR
of XX% over the forecast period. It is expected to result in a larger share of US$XX billion for capital
procurements, primarily due to the government’s plans to update the country’s defense equipment with
modern military hardware.
The following table and chart display the Qatari defense budget share of capital and revenue
expenditure during the review period:
Table 3: Qatari Defense Budget Split Between Capital and Revenue Expenditure (%), 2011-2015
Year Capital Expenditure Share Revenue Expenditure Share
2011 XX XX
2012 XX XX
2013 XX XX
2014 XX XX
2015 XX XX
Source: Ministry of Defense and SDI analysis © SDI
Figure 3: Qatari Defense Budget Split Between Capital and Revenue Expenditure (%), 2011-2015
Source: Ministry of Defense and SDI analysis © SDI
0%
10%
20%
30%
40%
50%
60%
70%
80%
90%
100%
2011 2012 2013 2014 2015
Defe
nse B
ud
get
Sp
lit
(%)
Capital Expenditure Share Revenue Expenditure Share
Future of the Qatari Defense Industry – Market Attractiveness, Competitive Landscape and Forecasts to 2019
13
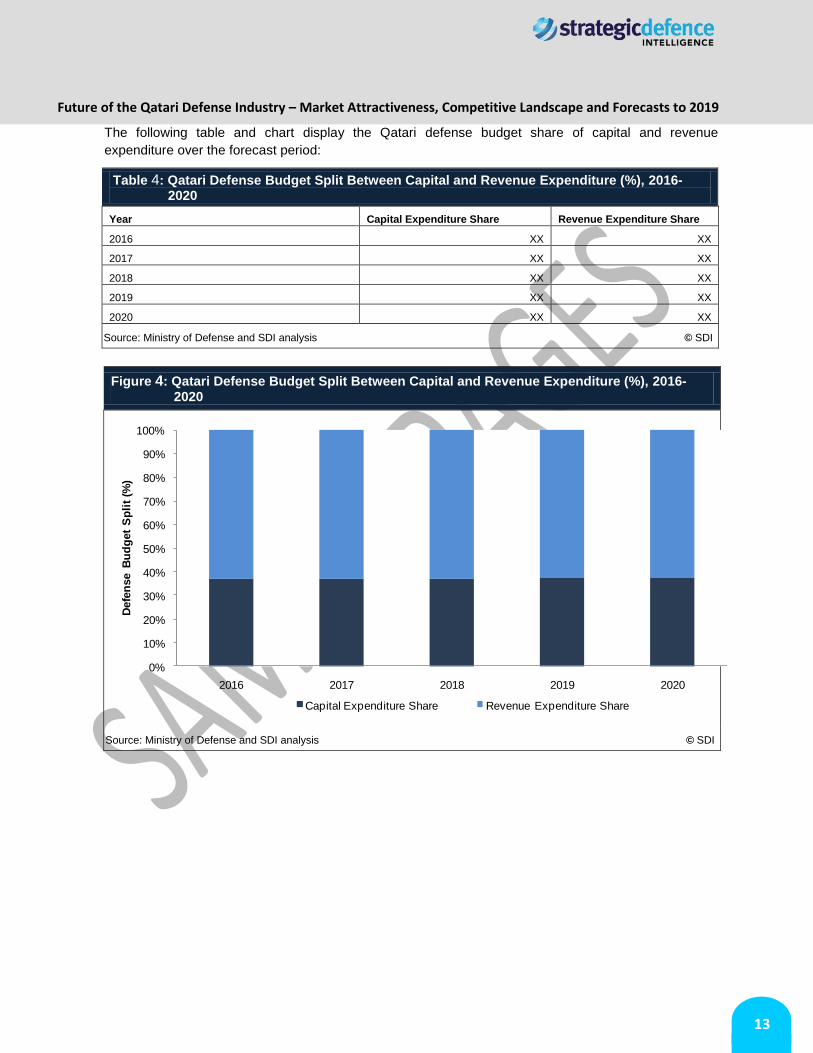
The following table and chart display the Qatari defense budget share of capital and revenue
expenditure over the forecast period:
Table 4: Qatari Defense Budget Split Between Capital and Revenue Expenditure (%), 2016-2020
Year Capital Expenditure Share Revenue Expenditure Share
2016 XX XX
2017 XX XX
2018 XX XX
2019 XX XX
2020 XX XX
Source: Ministry of Defense and SDI analysis © SDI
Figure 4: Qatari Defense Budget Split Between Capital and Revenue Expenditure (%), 2016-2020
Source: Ministry of Defense and SDI analysis © SDI
0%
10%
20%
30%
40%
50%
60%
70%
80%
90%
100%
2016 2017 2018 2019 2020
Defe
nse B
ud
get
Sp
lit
(%)
Capital Expenditure Share Revenue Expenditure Share
Future of the Qatari Defense Industry – Market Attractiveness, Competitive Landscape and Forecasts to 2019
14
2.3. Homeland Security Market Size and Forecast
2.3.1. Homeland security expenditure in Qatar is mainly driven by Maritime Security, Soccer World Cup
2022, and Cyber-security
Maritime Security: The Qatari Ministry of Interior has overall responsibility for public security and law
and order. The country has the world’s third largest natural gas reserve, which is the primary contributor
to its economy; therefore it plans to enhance its maritime security to protect its infrastructure.
Furthermore, the government plans to set up a new port facility outside the capital city of Doha for its
maritime security providing landing to its naval vessels and it will also be used for commercial purposes.
The Gulf countries have also enhanced efforts to protect territorial waters due to the tensions with Iran
and threats from Al-Qaeda. Qatar’s offshore oil exploration infrastructure is threatened by various
militant groups and therefore it has increased its surveillance and procured radars systems to detect
insurgents and drug peddlers. The country is expected to create market opportunities for access control,
surveillance, information technology security, and command, control, communications and intelligence
(C3I) markets during the forecast period.
Soccer World Cup 2022: Qatar’s ambitious international sporting event, World Cup 2022, is anticipated
to boost the country’s expenditure on HLS during the forecast period. The country is planning to invest
significantly in security surveillance systems, training, cameras, wireless systems, airport security, radio
communications, video-monitoring, and cyber-security software. The Qatar 2022 Committee has also
signed an agreement for US$XX million with Interpol, which will support the safety and security of
sporting events over the next 10 years.