Embed Size (px)
Citation preview
Future of Healthcare
By Natalie Sterner, Dan Wandsnider, Jack Travis, and Reed Wuttke
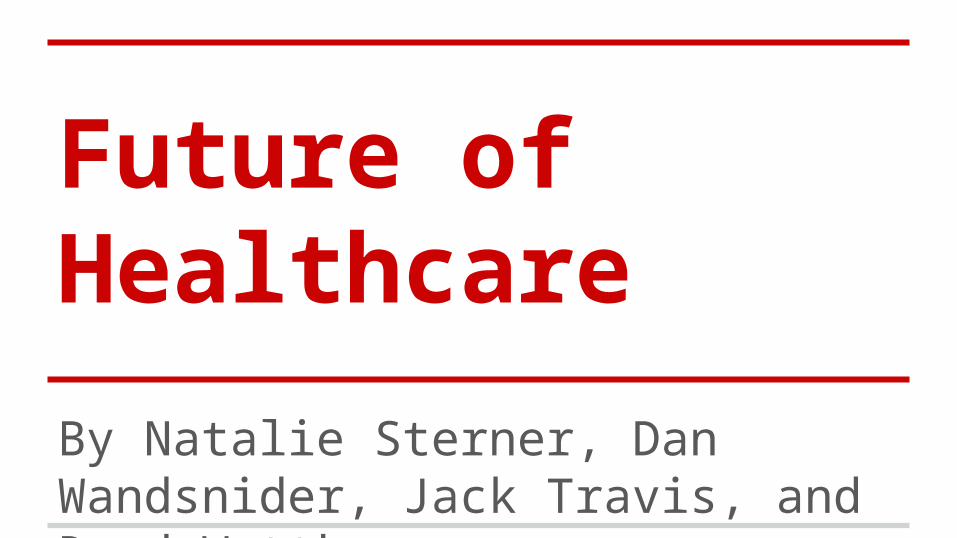
Agenda
● Healthcare Costso Obesityo Medical Technology
● Affordable Care Act & Healthcare Reformo Private Insuranceo Medicareo Medicaid
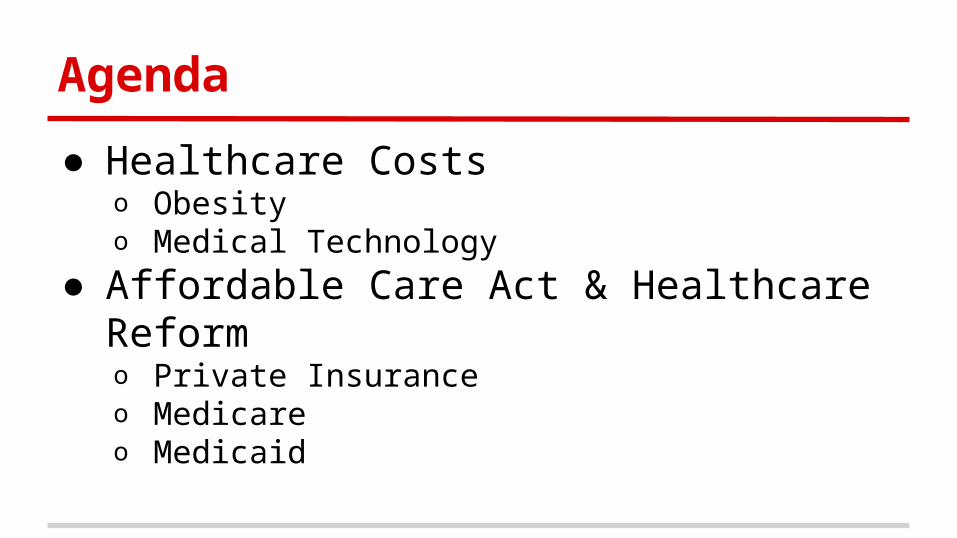
Obesity: The American Epidemic● 66.3% of Americans are overweight or obese (Anderson et al.
2007)
o BMI > 25 kg/m2
o Highest obesity rate of surveyed OECD countries● Obesity in last 50 yrs & more than doubled in last 30
yrs (Cawley et al. 2012, Burkhauser et al. 2009)
● More than ⅓ of children & adolescents overweight or obeseo Obese adolescents aged 12-19 5%-21% from 1980-
2012 (Center for Disease Control and Prevention)
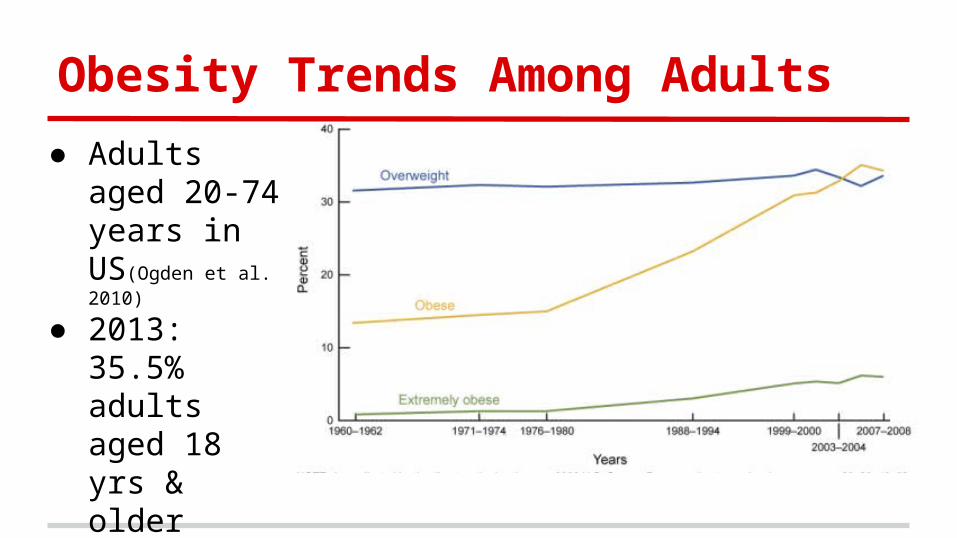
Obesity Trends Among Adults
● Adults aged 20-74 years in US(Ogden et al. 2010)
● 2013: 35.5% adults aged 18 yrs & older overweight; 28.3% obese (Center for Disease Control and Prevention)
Obesity Health Consequences
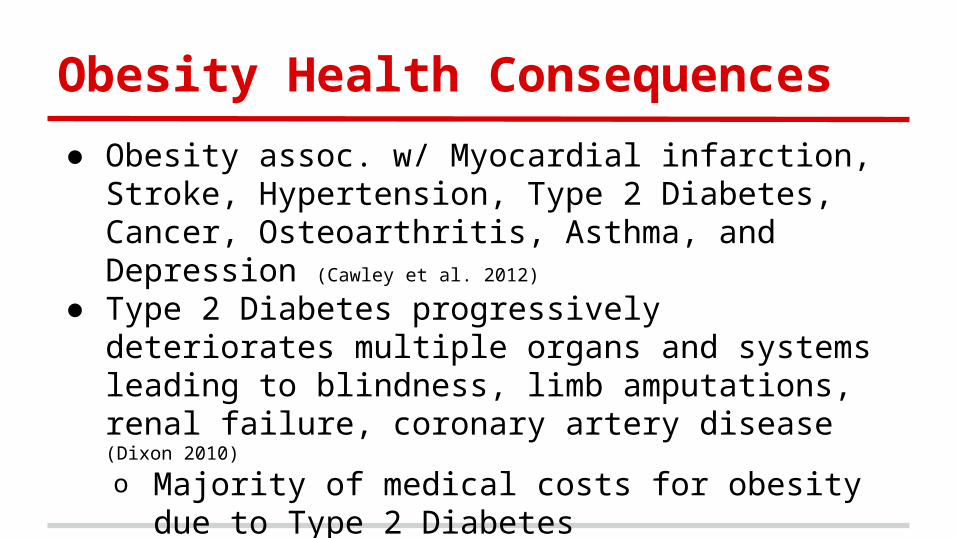
● Obesity assoc. w/ Myocardial infarction, Stroke, Hypertension, Type 2 Diabetes, Cancer, Osteoarthritis, Asthma, and Depression (Cawley et al. 2012)
● Type 2 Diabetes progressively deteriorates multiple organs and systems leading to blindness, limb amputations, renal failure, coronary artery disease (Dixon 2010)
o Majority of medical costs for obesity due to Type 2 Diabetes
● Resulting in more than 300,000 annual deaths (Dixon 2010)
Costs of Obesity
● Per capita medical spending for obese people $1,429 in 2006o 42% larger than spending for normal weight people
(Finkelstein et al. 2009)
● In 2008, est. $147b of medical costs from obesityo Increase from $78.5b in 1998 (Finkelstein et al. 2009)
● Obesity prevalence accounts for 12% of growth in
healthcare spending (Thorpe et al. 2004)
● The Future: no signs of slowing down
Medical Technology: Diagnostic
● U.S. has ~3x as many CTs, MRIs, and mammographs/mil pop as OECD countries average in 2009o >2x MRI exams given/mil pop.; Fees highest: $1,080o >2x CT exams given/mil pop.; Fees highest: $510
(Squires 2012)
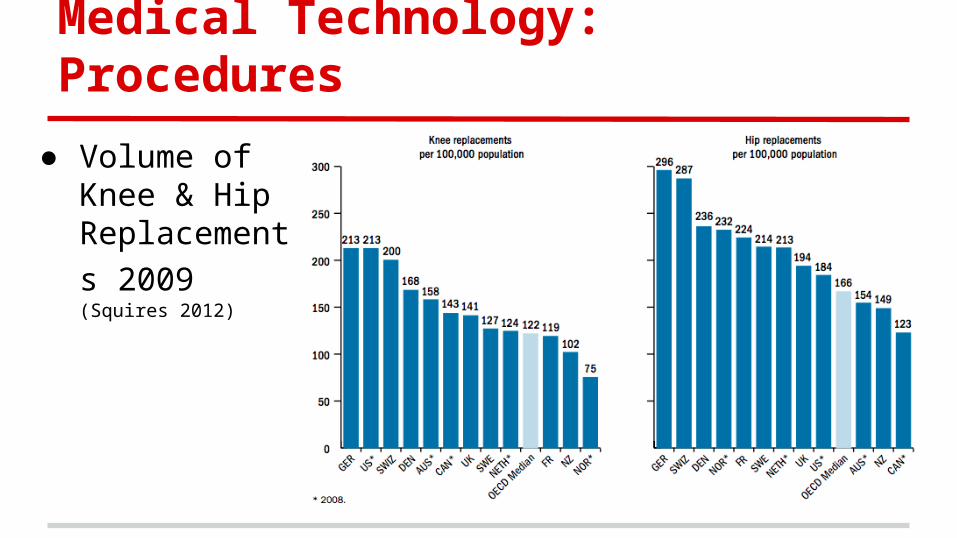
Medical Technology: Procedures
● Volume of Knee & Hip Replacements
2009 (Squires 2012)
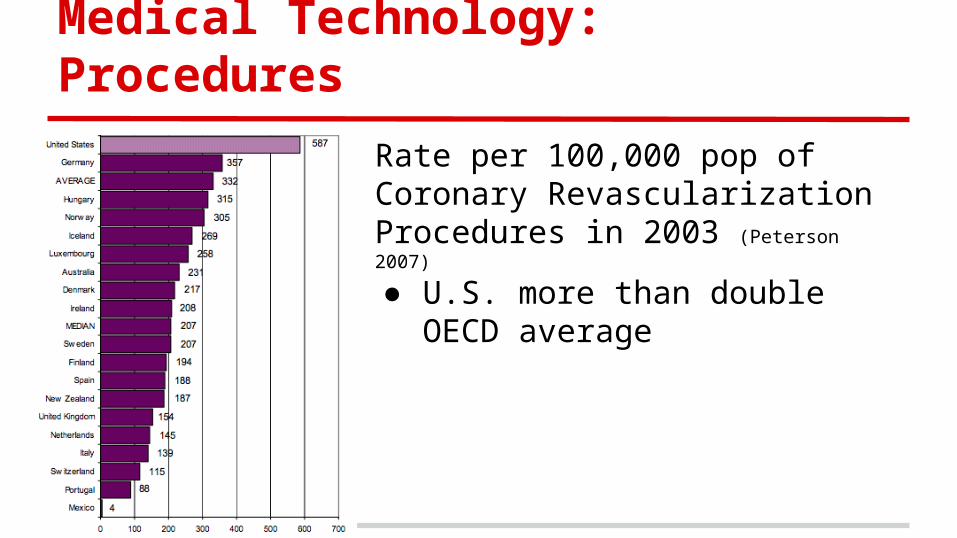
Medical Technology: Procedures
Rate per 100,000 pop of Coronary Revascularization Procedures in 2003 (Peterson 2007)
● U.S. more than double OECD average
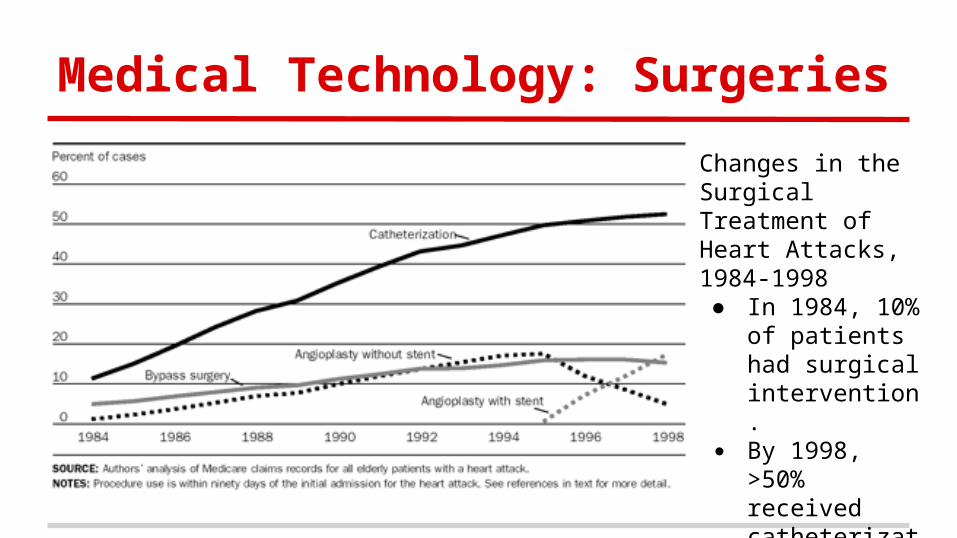
Medical Technology: Surgeries
Changes in the Surgical Treatment of Heart Attacks, 1984-1998● In 1984, 10% of
patients had surgical intervention.
● By 1998, >50% received catheterization (Cutler 2001)
Medical Technology Costs
● $18,000/discharge compared to less than $10,000 in Sweden, Australia, New Zealand, France, & Germanyo U.S. more resource intensive & prices higher (Squires 2012)
● Moral Hazard: w/ generous insurance, patients & physicians overuse treatments regardless of effectivenesso Type 2 Diabetes: less coverage, more incentives to
exercise and diet● New MT costs & estimated to account for more than ½
of LT spending growth (Smith 2009)
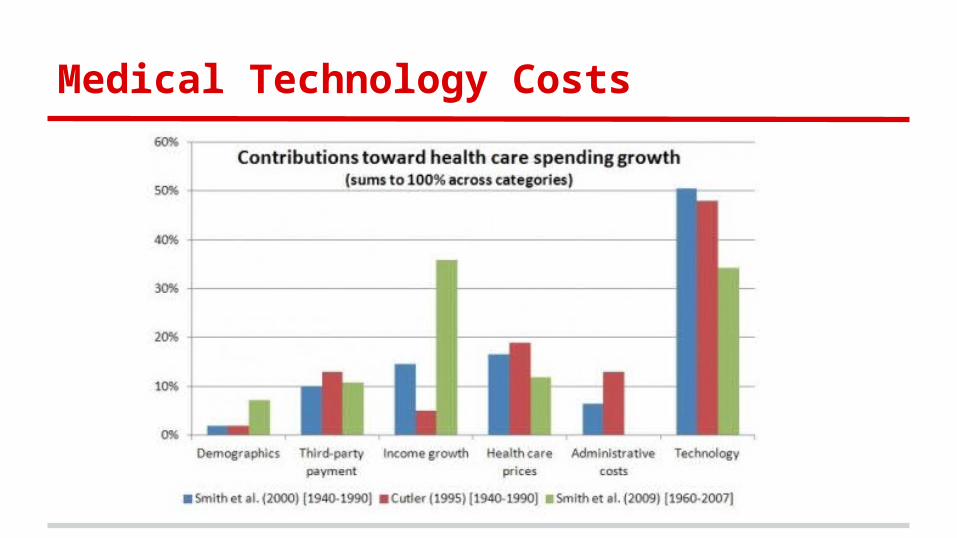
Medical Technology Costs
Private Insurance
● Costs of medical care ● Costs of health insurance● Affordable Care Act
o Large Employer Marketo Individual/Small Group Market
Increased Healthcare Spending
● 1980: $215 B 1998: $1.02 T 2003: $1.7 To 15% of 2003 GDP (Smith et al., 2005)
● 1998: $4,178 per capita (Anderson and Hussey, 2001)
● Most expensive 5% ~50% health spendingo Bottom 50% 3% (Zuvekas and Cohen, 2007)
Increased Insurance Spending
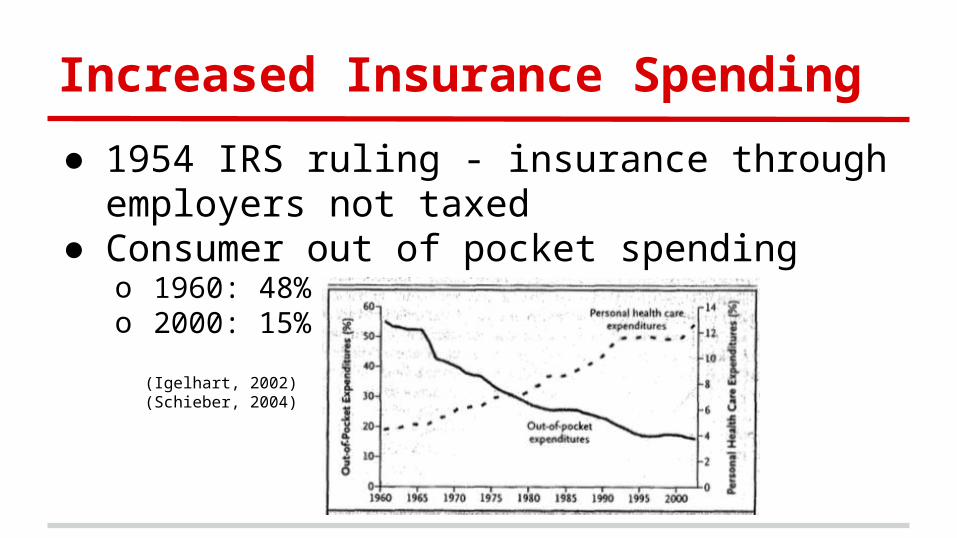
● 1954 IRS ruling - insurance through employers not taxed
● Consumer out of pocket spendingo 1960: 48%o 2000: 15%
(Igelhart, 2002) (Schieber, 2004)
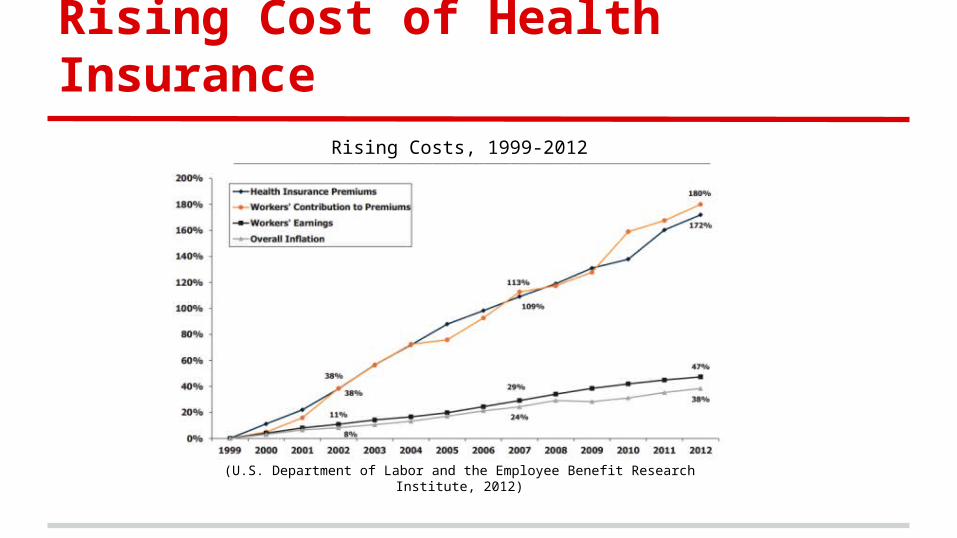
Rising Cost of Health Insurance
(U.S. Department of Labor and the Employee Benefit Research Institute, 2012)
Rising Costs, 1999-2012
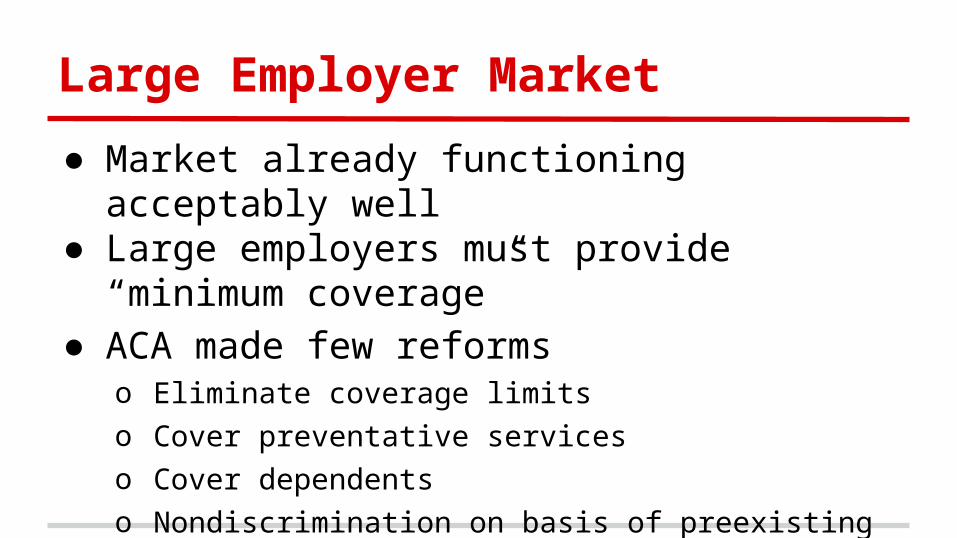
Large Employer Market
● Market already functioning acceptably well● Large employers must provide “minimum
coverage”● ACA made few reforms
o Eliminate coverage limitso Cover preventative serviceso Cover dependentso Nondiscrimination on basis of preexisting conditions
Who is Covered?
● 2004: 62.4% of non-elderly population covered through employers (Fronstin, 2005)
● 2000: 69% employers offered coverageo 2005: 60% 5 million uninsured (Kaiser Family Foundation, 2005)
(Collins, Davis, and Ho, 2005)
● 40% firms with < 10 employees provided insurance (Blumenthal, 2006)
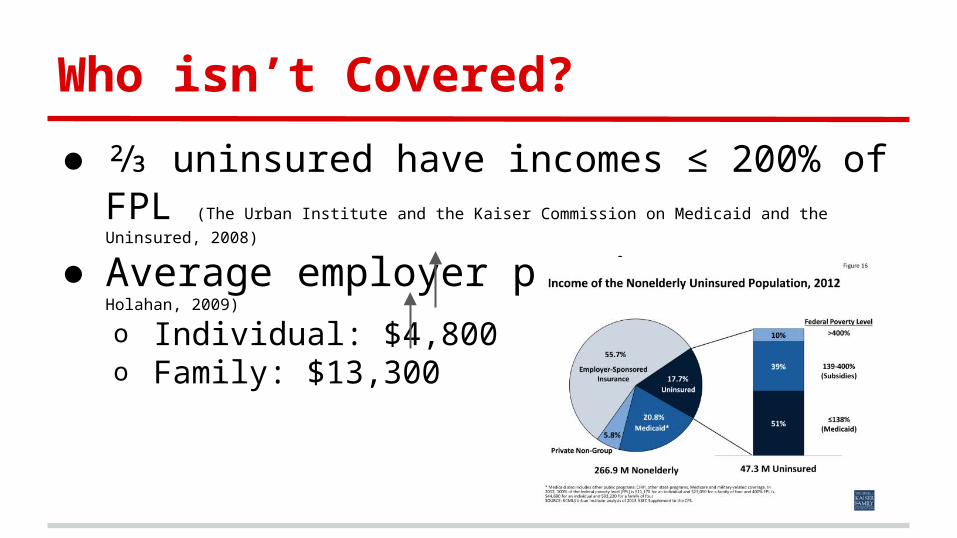
Who isn’t Covered?
● ⅔ uninsured have incomes ≤ 200% of FPL (The Urban
Institute and the Kaiser Commission on Medicaid and the Uninsured, 2008)
● Average employer premium (Blumberg and Holahan, 2009)
o Individual: $4,800 22%o Family: $13,300 30%
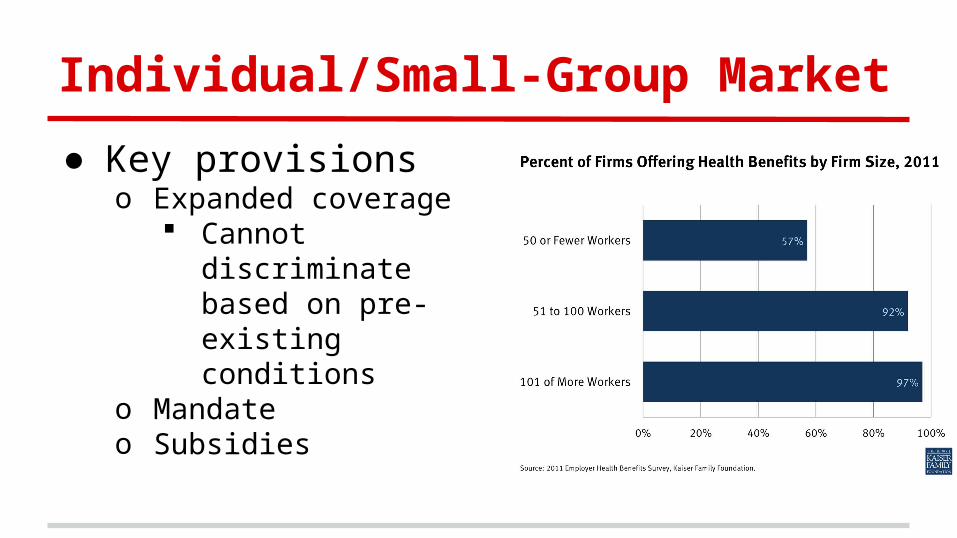
Individual/Small-Group Market
● Key provisionso Expanded coverage
Cannot discriminate based on pre-existing conditions
o Mandateo Subsidies
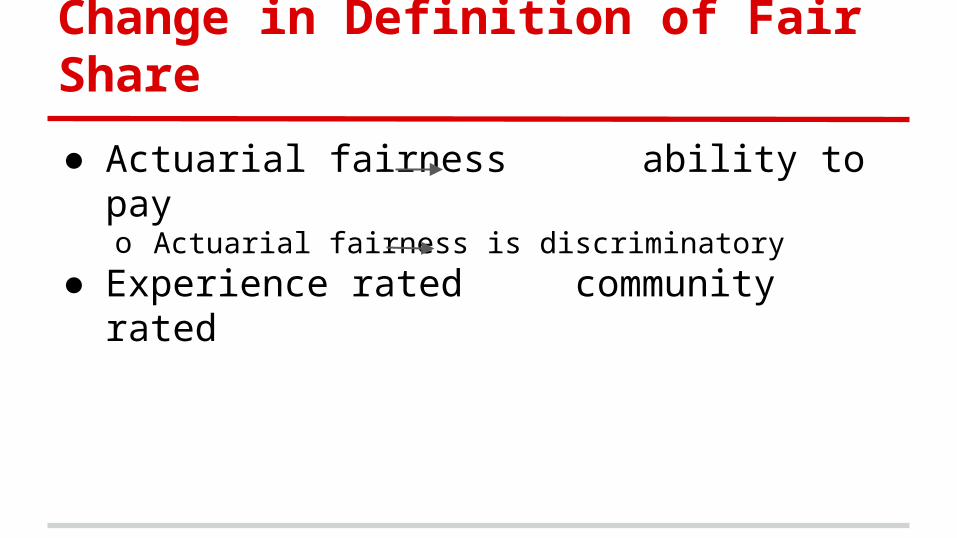
Change in Definition of Fair Share
● Actuarial fairness ability to payo Actuarial fairness is discriminatory
● Experience rated community rated
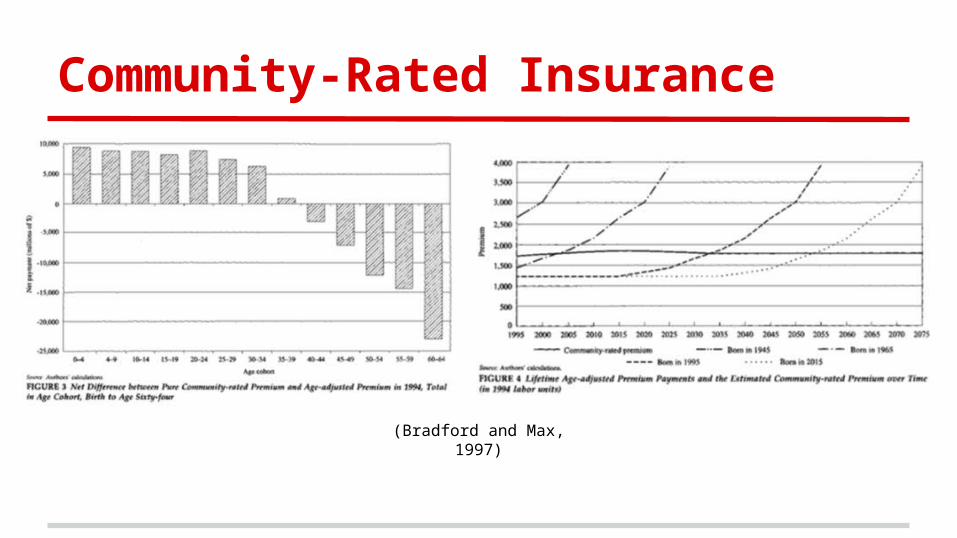
Community-Rated Insurance
(Bradford and Max, 1997)
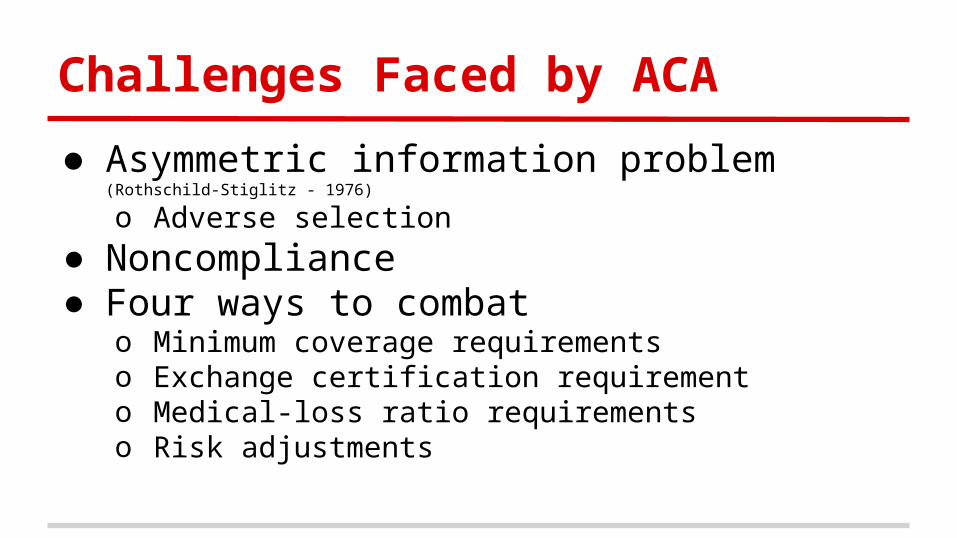
Challenges Faced by ACA
● Asymmetric information problem (Rothschild-Stiglitz - 1976)
o Adverse selection
● Noncompliance● Four ways to combat
o Minimum coverage requirementso Exchange certification requiremento Medical-loss ratio requirementso Risk adjustments
Medicare Overview
● Rising Costs○ Demographics
● Changes Under the ACA○ Financial ○ Cost Effectiveness○ Coverage
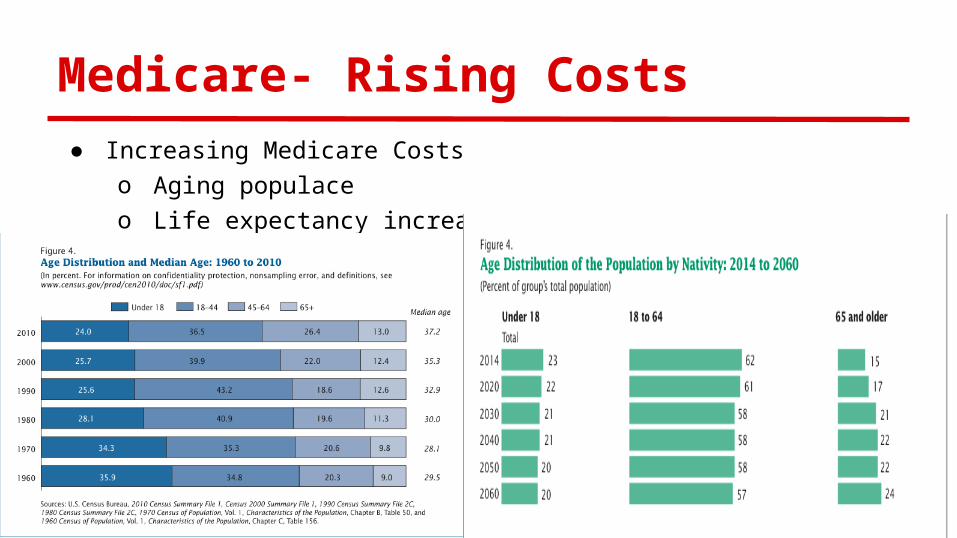
Medicare- Rising Costs● Increasing Medicare Costs
o Aging populaceo Life expectancy increase
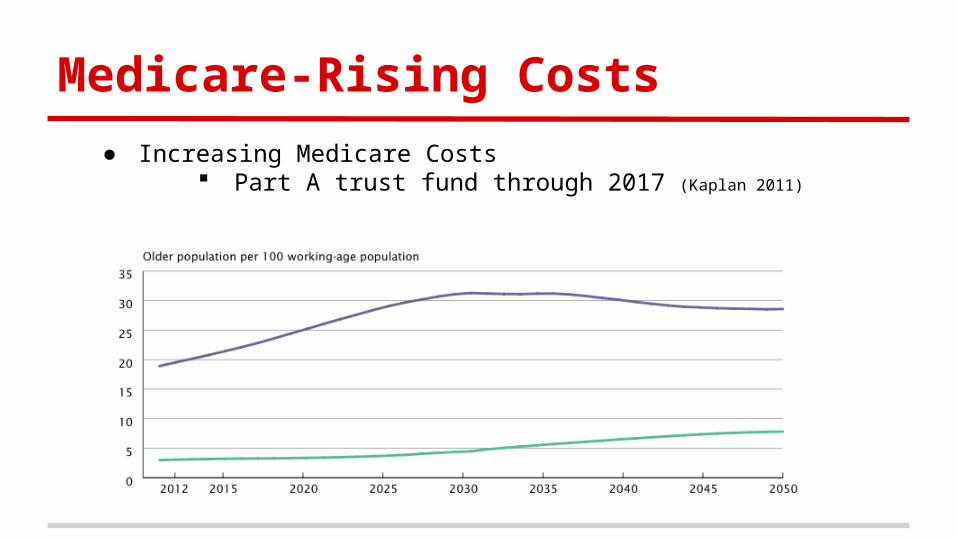
Medicare-Rising Costs
● Increasing Medicare Costs Part A trust fund through 2017 (Kaplan 2011)
Medicare: ACA Overview
● Financial Changes● Part A and B Cost Saving measures
o Evidence/Efficiency Incentiveso Accountable Care Organizations
● Changes in coverageo Part A, B, C, and D
ACA: Financial Changes
● MA plan reduction● $196.3 b cut to providers over 10 years (Davis 2010)
● Increased taxes generates $400 b by 2019 (White 2010)
o Families over $250,000 o Medical Deviceso Insurers
● Medicare costs 2016 projected $20 b (Auerbach 2014)
● Part A trust fund through 2029 (Kaplan 2011)
Part A and B: Evidence/Efficiency ● Coverage with evidence development (CED)
o 46% of trials contradict practices (Prasad 2012)
o Patient-Centered Outcomes Research Institute (PCORI) $3 b through 2019 (Krumholz & Selby 2012)
Utilize Electronic health records (EHR)● $2 b savings and stopped 200 premature deaths (Mohr & Tunis 2010)
● EHR copying (Ryan & Mushlin 2014)
● Value-based purchasing (VBP) and Hospital Readmission Reduction Program (HRRP) Incentives
VBP pool 3% fine in HRRP
● 2012: ⅔ of hospitals (Gilman et al. 2014)
Part A and B: ACO
● Accountable Care Organizationso Provider Groupso Centers for Medicare and Medicaid Services (CMS)
Rewards/Penalizes 4 million enrolled (Gold 2014)
May overstate savings (Douven et al. 2015)
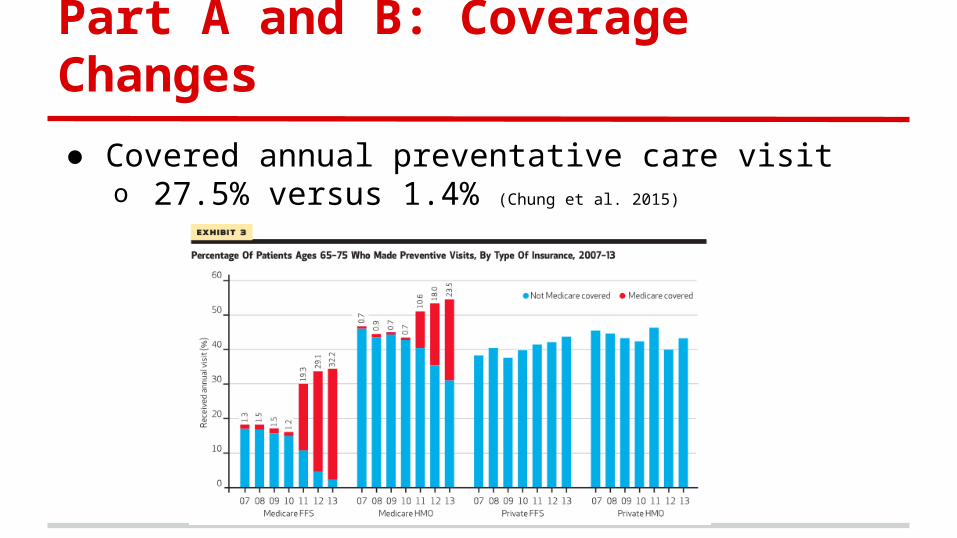
Part A and B: Coverage Changes
● Covered annual preventative care visito 27.5% versus 1.4% (Chung et al. 2015)
Part A and B: Coverage Changes
● Mental health coverage expansiono Preventive Care Screenings o 2008 Medicare Improvements for Patients and
Providers Act: Copayment rate 20%
Part C: Coverage Changes
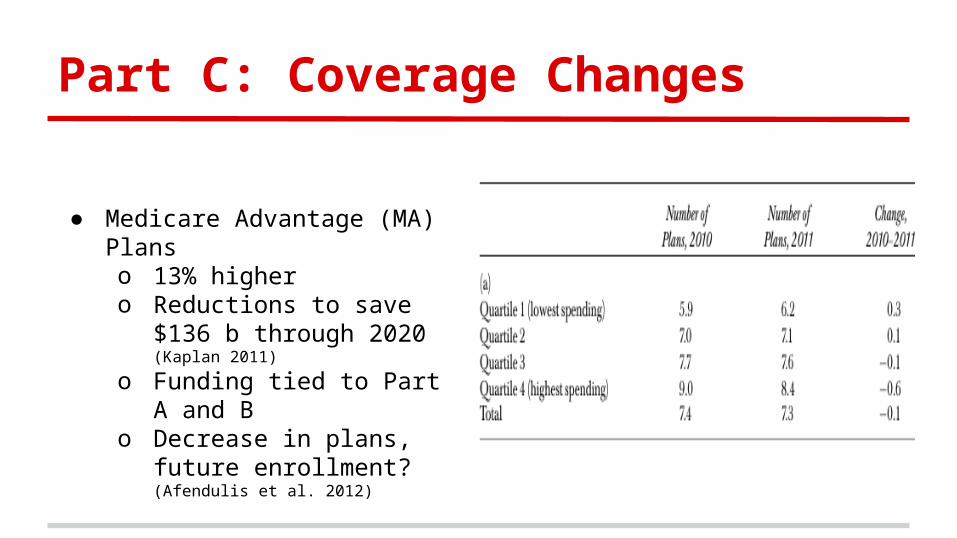
● Medicare Advantage (MA) Planso 13% higher o Reductions to save $136 b
through 2020 (Kaplan 2011)
o Funding tied to Part A and B o Decrease in plans, future
enrollment? (Afendulis et al. 2012)
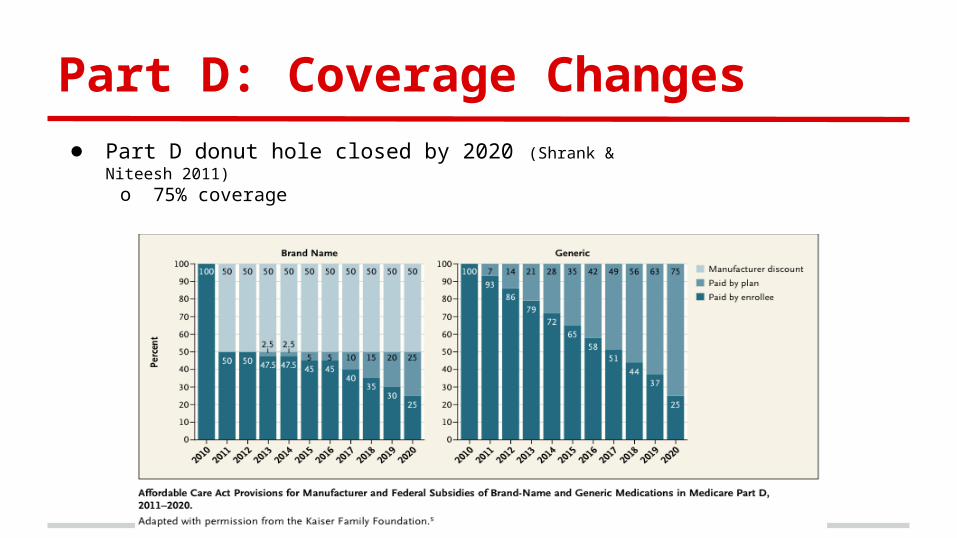
Part D: Coverage Changes● Part D donut hole closed by 2020 (Shrank & Niteesh 2011)
o 75% coverage

Results
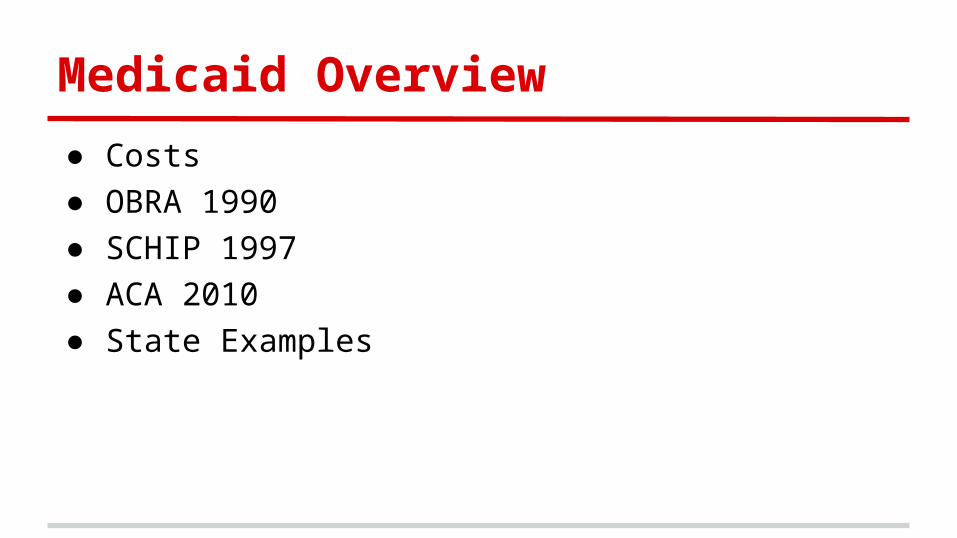
Medicaid Overview
● Costs● OBRA 1990● SCHIP 1997● ACA 2010● State Examples
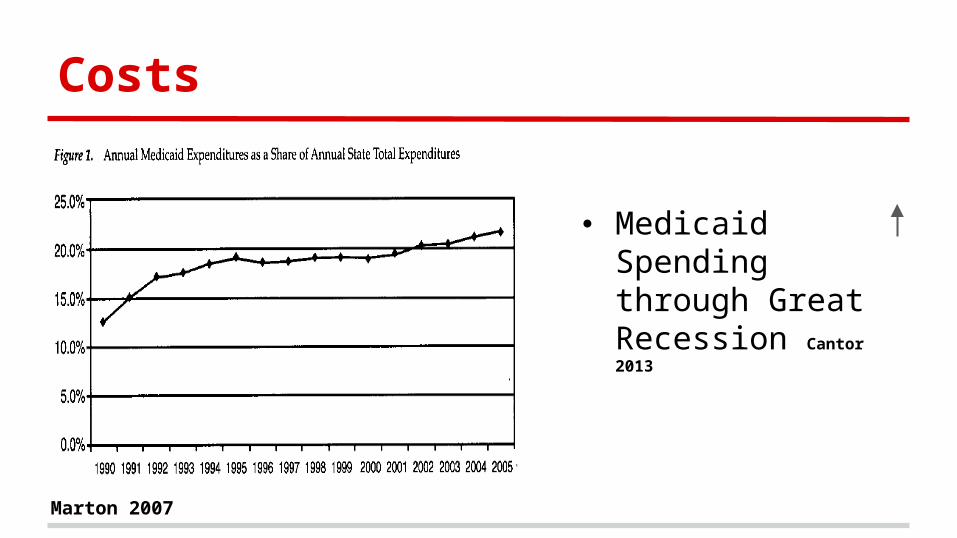
Costs
Marton 2007
● Medicaid Spending through Great Recession Cantor 2013
OBRA 1990
● Coverage Required:o Children born after September 30, 1983o Families below 133% PL Gordon 2003
● Coverage by 8% Card 2004
o Take up was <5% Card 2004
● Pregnant womeno 10-15% decrease in uninsured Winter 2011 o 50-60% crowd out rate Winter 2011
o No significant effect on fertility rate Deleire 2011
OBRA 1990
● Cost Shiftingo Physician Costs, Visits
25% doctors, no new patients Decker 2009
o Uninsured: $1,135 out of pocket Expansion # uninsured
Private picks up slack Clemans-Cope 2013
SCHIP
● 1997, expansion for children● Premium= Exit Rate (GA, KY) Marton 2010
● Physician participation Bronstein 2004
● BadgerCare:o coverage 8%, public insurance 25% Wolfe 2006
● Excellent health 1-5 years eligible De La Mata 2012
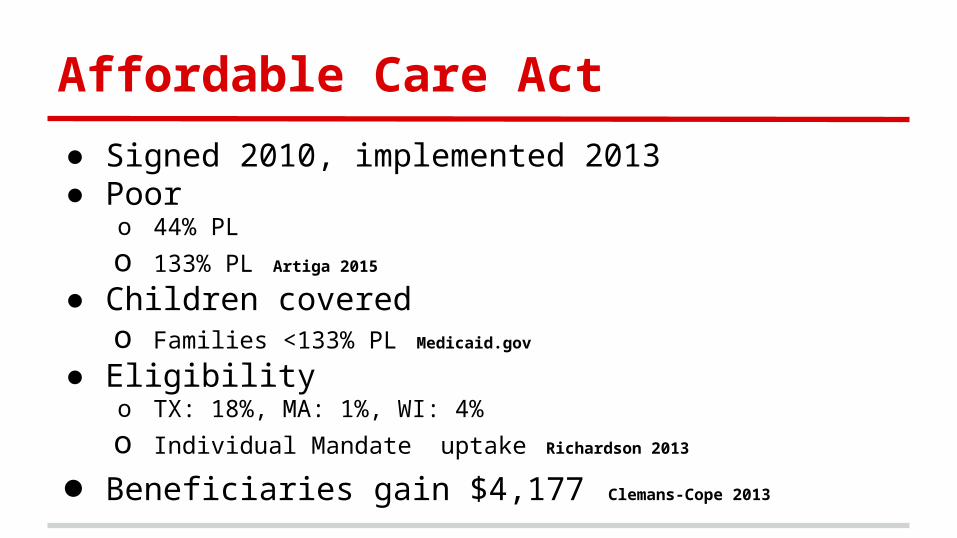
Affordable Care Act
● Signed 2010, implemented 2013● Poor
o 44% PL o 133% PL Artiga 2015
● Children coveredo Families <133% PL Medicaid.gov
● Eligibilityo TX: 18%, MA: 1%, WI: 4%o Individual Mandate uptake Richardson 2013
● Beneficiaries gain $4,177 Clemans-Cope 2013
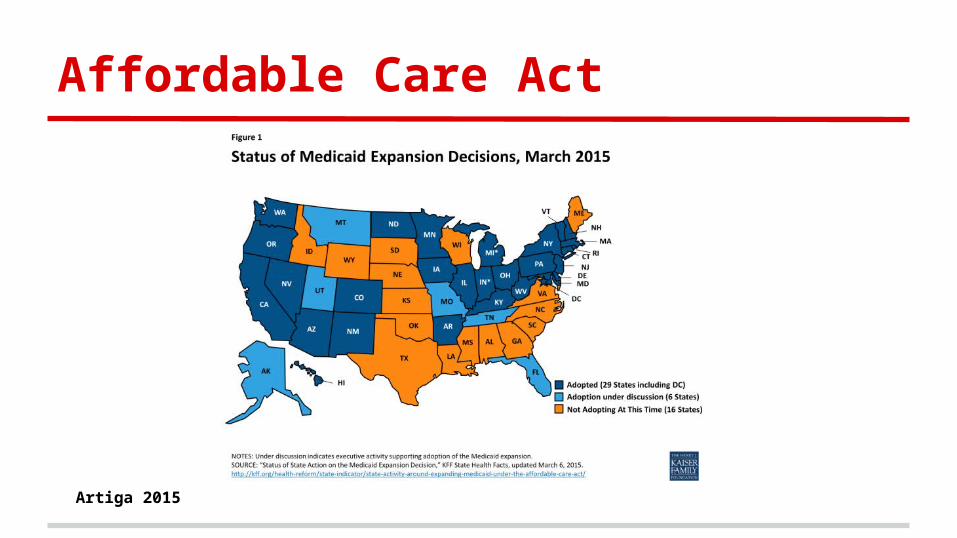
Affordable Care Act
Artiga 2015
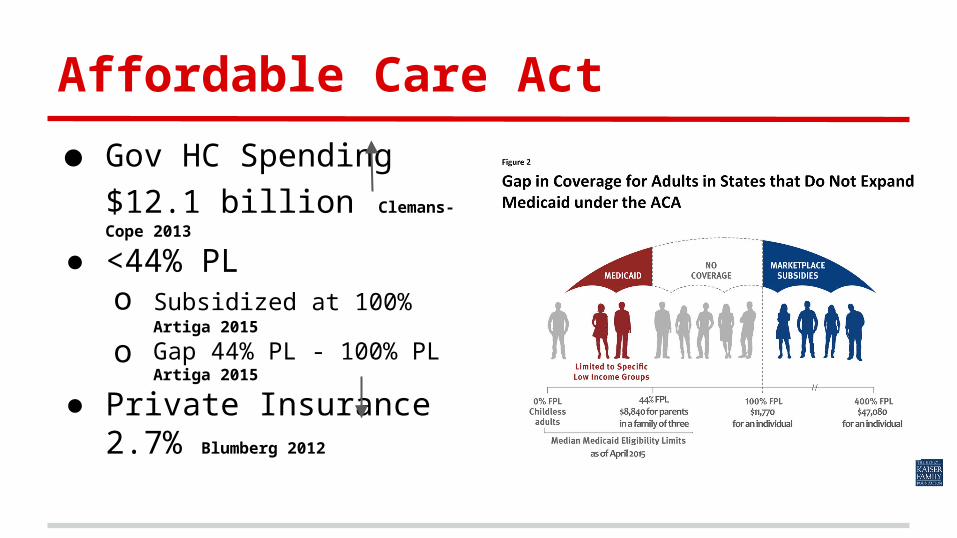
Affordable Care Act
● Gov HC Spending $12.1
billion Clemans-Cope 2013
● <44% PLo Subsidized at 100% Artiga 2015
o Gap 44% PL - 100% PL Artiga 2015
● Private Insurance 2.7% Blumberg 2012
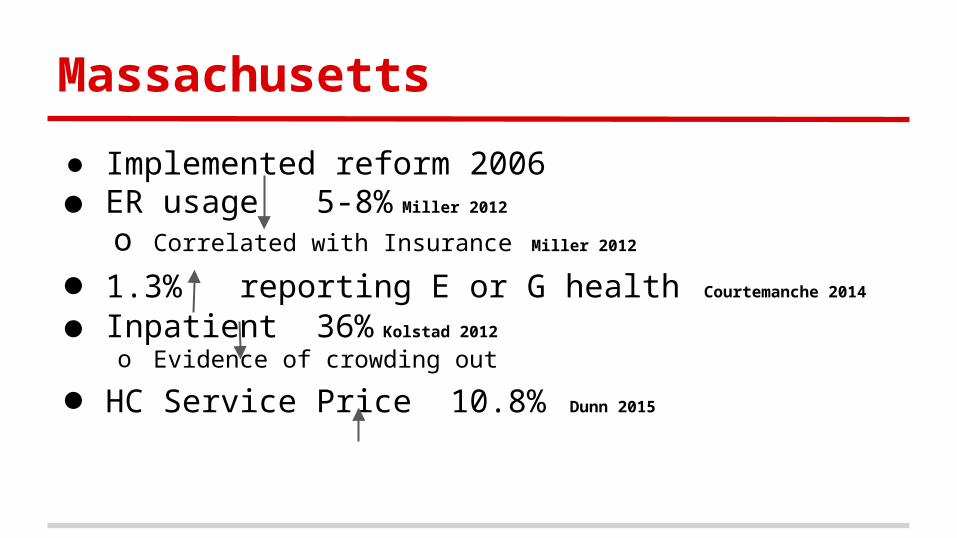
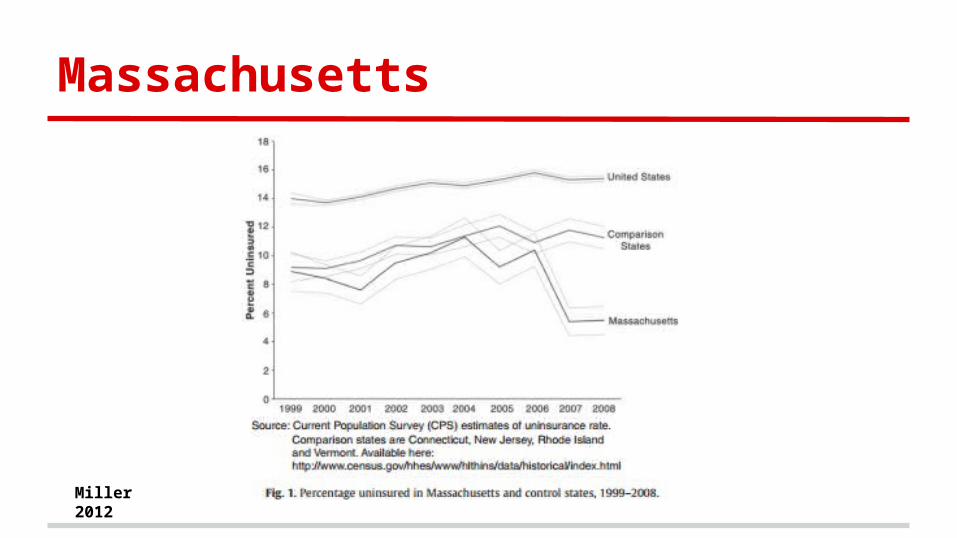
Massachusetts
● Implemented reform 2006● ER usage 5-8% Miller 2012
o Correlated with Insurance Miller 2012
● 1.3% reporting E or G health Courtemanche 2014
● Inpatient 36% Kolstad 2012
o Evidence of crowding out
● HC Service Price 10.8% Dunn 2015
Massachusetts
Miller 2012

Discussion
Questions?
Questions
● What economic incentives could reduce the nation’s obesity prevalence?
● What are the pros and cons of Wisconsin adopting the Medicaid expansion?