Embed Size (px)
Citation preview

Dr. S. Julio Friedmann
Principal Deputy Assistant Secretary (FE) and Deputy Assistant Secretary, Office of Clean Coal
Future of Carbon Storage ResearchNETL Geological Storage Program Review
August 12th, 2014, Pittsburgh, PA

This is a time of fossil energy abundance
Once in a generation opportunity to build
We must harness this age of abundance
2

3
Abundant Coal, Gas, and Oil

CCS/CCUS is the key technology for this era of fossil energy abundance
Policy drivers• President’s Climate Action Plan• EPA: NSPS (draft) and ESPS (draft)• State actions (AB32 etc.)
Global economic context• Investors speak• Global coal increase• US-China dominance
A $6B climate mitigation program at DOE
4

5
IEA CCS Roadmap 2013: Key Technologies for Reducing Global CO2 Emissions
Source: IEA Roadmap 2013. Note: Numbers in brackets are shares in 2050. For example, 14% is the share of CCS in cumulative emission reductions through 2050, and 17% is the share of CCS in emission reductions in 2050, compared with the 6DS.
Most 2050 climate budgets require CCUS from natural gas power and biofuels

6

ThenCCS Program Initiated
(1997)
NowProgress to Date
Future (2030)Broad Commercial
Deployment
CCS
R&D
• Niche commercial efforts
• 1930’s and 1970’s tech for capture
• Little known for storage
• Much knowledge gained
• Major tech development
• Tools being developed and tested
• “Commercialtoolbox” developed
• Dramatic cost reductions
• 1000’s of sites worldwide
Stor
age
Infr
astr
uctu
re/
Fiel
d Te
sts
• Little known outside of oilfield services
• Sleipner project initiated
• Increased visibility; • Knowledge gained
and lessons learned• 12 large projects
world-wide
• Market frameworks in place
• Novel regulatory mechanisms
• Turnkey operation
Brief history and roadmap for CCS
7
8
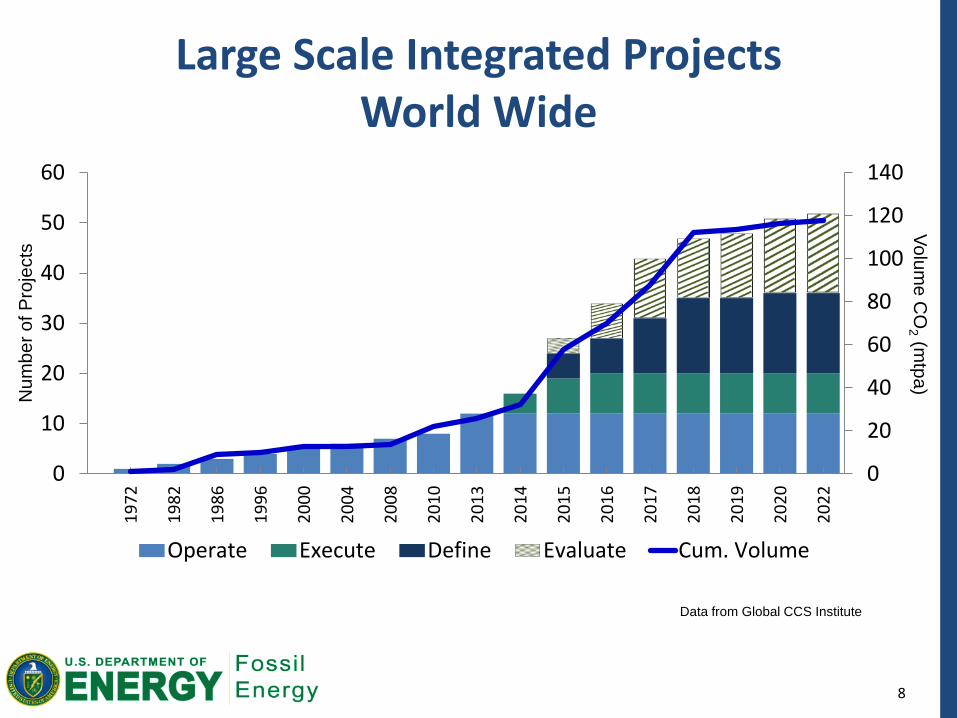
Large Scale Integrated Projects World Wide
0
20
40
60
80
100
120
140
0
10
20
30
40
50
60
1972
1982
1986
1996
2000
2004
2008
2010
2013
2014
2015
2016
2017
2018
2019
2020
2022
Operate Execute Define Evaluate Cum. Volume
Num
ber o
f Pro
ject
sVolum
e CO
2 (mtpa)
Data from Global CCS Institute
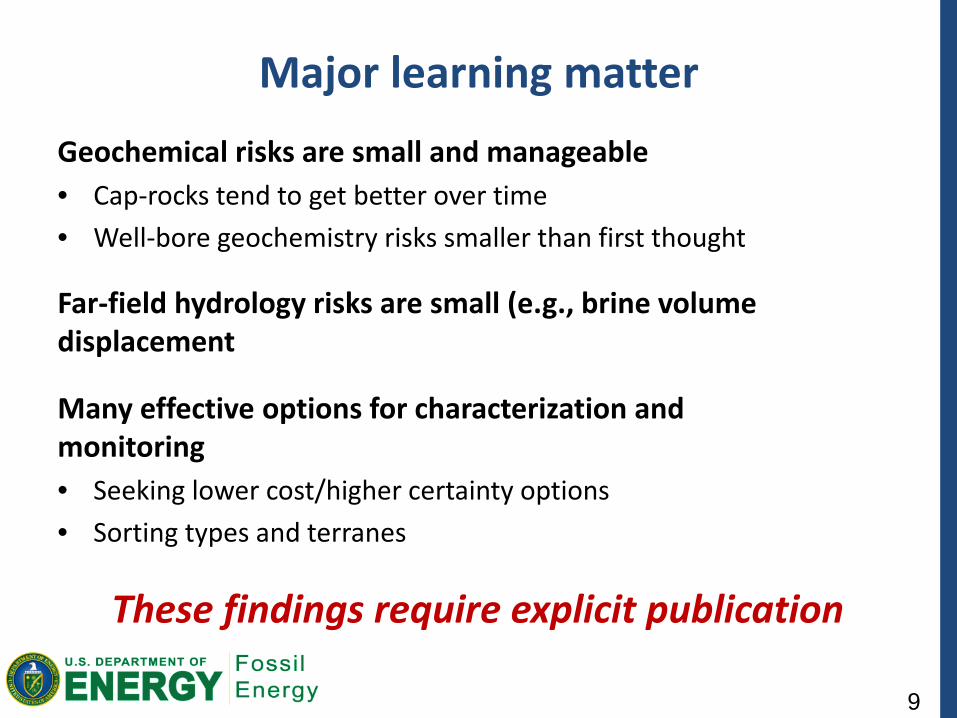
Major learning matterGeochemical risks are small and manageable• Cap-rocks tend to get better over time• Well-bore geochemistry risks smaller than first thought
Far-field hydrology risks are small (e.g., brine volume displacement
Many effective options for characterization and monitoring• Seeking lower cost/higher certainty options• Sorting types and terranes
These findings require explicit publication
9

10
Best Practices Manual Version 1(Phase II)
Version 2(Phase III)
Final Guidelines
(PostInjection)
Monitoring, Verification and Accounting 2009/2012 2016 2020
Public Outreach and Education 2009 2016 2020
Site Characterization 2010 2016 2020
Geologic Storage Formation Classification 2010 2016 2020
**Simulation and Risk Assessment 2010 2016 2020
**Carbon Storage Systems and Well Management
Activities2011 2016 2020
Terrestrial 2010 2016 – Post MVA Phase III
CCS Best Practices Manuals Critical Requirement For Significant Wide Scale Deployment -
Capturing Lessons Learned

Key challenges for GCS deploymentGeomechanics• Induced seismicity (with attendant fluid migration)• Cap-rock and well-bore fracture mechanics
Unconventional EOR• ROZ and negative carbon oil• Low-permeability reservoirs
Tools for the non-experts• Data infrastructure• Mod-sim for regulators and would-be operators• Protocols and tools for PISC
Lead to widespread, turn-key commercial ops
11

12
Geomechanics risks are real, but smaller than often portrayed
This work performed under the auspices of the U.S. Department of Energy by Lawrence Livermore National Laboratory under Contract DE-AC52-07NA27344
M6.8 event near Nagaoka CO2 injectionNo leakage; no large M induced seismicity
Sustained water and CO2 injections at RangelyNo leakage; no large M induced seismicity

13
Regardless, we must treat induced seismicity and flow as a substantial risk
This work performed under the auspices of the U.S. Department of Energy by Lawrence Livermore National Laboratory under Contract DE-AC52-07NA27344
Oklahoma: Now #2• Events over 4.5 in US• Associated with brine
injection
Large number of induced events in populated areas
Geothermal events: Geysers and Basel

14
A few key issues merit deep consideration
This work performed under the auspices of the U.S. Department of Energy by Lawrence Livermore National Laboratory under Contract DE-AC52-07NA27344
• Accurate characterization of faults & fracture networks• Accurate assessment of stress state• Pressure management (strategies and technologies)
We know both more (and less) than we think

15
• Many 10’s of billions producible in US (100’s of billions worldwide)
• Required to finance first set of projects; drive down costs through deployment
• Additional domestic supply, revenues; reduced imports Bi
llion
Barre
ls
88.1
47.4
2.30
20
40
60
80
100
TechnicallyRecoverable
EconomicallyRecoverable*
AlreadyProduced/
Proven
Domestic Oil Resources
ARI, 2008
Millio
n Me
tric T
ons
Total U.S.CO2 Demand
NewLower-48
CO2 Demand
Net Lower-48From CapturedCO2 Emissions
02,000
4,000
6,000
8,000
10,000
12,000
14,00012,500
9,700
7,500
2,800* 2,200**
Market CO2 demand
EOR is a critical bridging step that brings near-term benefits to the US

16
ROZ as a new and emerging endeavor
This work performed under the auspices of the U.S. Department of Energy by Lawrence Livermore National Laboratory under Contract DE-AC52-07NA27344
• 2x-3x recovery potential and storage potential (12-18 Gt in ROZ vs. 6.4 for main pay zones, PB)
• Possibility for carbon-negative HC
Main Pay Zone (MPZ)
Transition Zone (TZ)
Residual Oil Zone (ROZ)
Base of Ultimate OWC
Base of Producing OWC
4900
4950
4800
4850
5000
5050
5400
5350
5300
5250
5200
5150
5100
5450
OWC
100 0Oil Saturation %
“State of the Art” “Next Generation”
(millions) (millions)
CO2 Storage (tonnes) 19 109
Storage Capacity Utilization 13% 76%
Oil Recovery (barrels) 64 180
% Carbon Neutral (“Green Oil”) 80% 160%
ARI, 2008
ARI, 2008
Sources: MIT, 2010; ARI 2007 and 2010; NETL 2008

17
Two kinds of ROZ zones
This work performed under the auspices of the U.S. Department of Energy by Lawrence Livermore National Laboratory under Contract DE-AC52-07NA27344
• Beneath main pay zones in regular oil fields
Main Pay Zone (MPZ)
Transition Zone (TZ)
Residual Oil Zone (ROZ)
Base of Ultimate OWC
Base of Producing OWC
4900
4950
4800
4850
5000
5050
5400
5350
5300
5250
5200
5150
5100
5450
OWC
100 0Oil Saturation % ARI, 2008
• Ancient migration fairways: NOT conventional closures
Oil fieldOil field
Migration fairway
Migration fairway
These are new resources AND new reserves
18
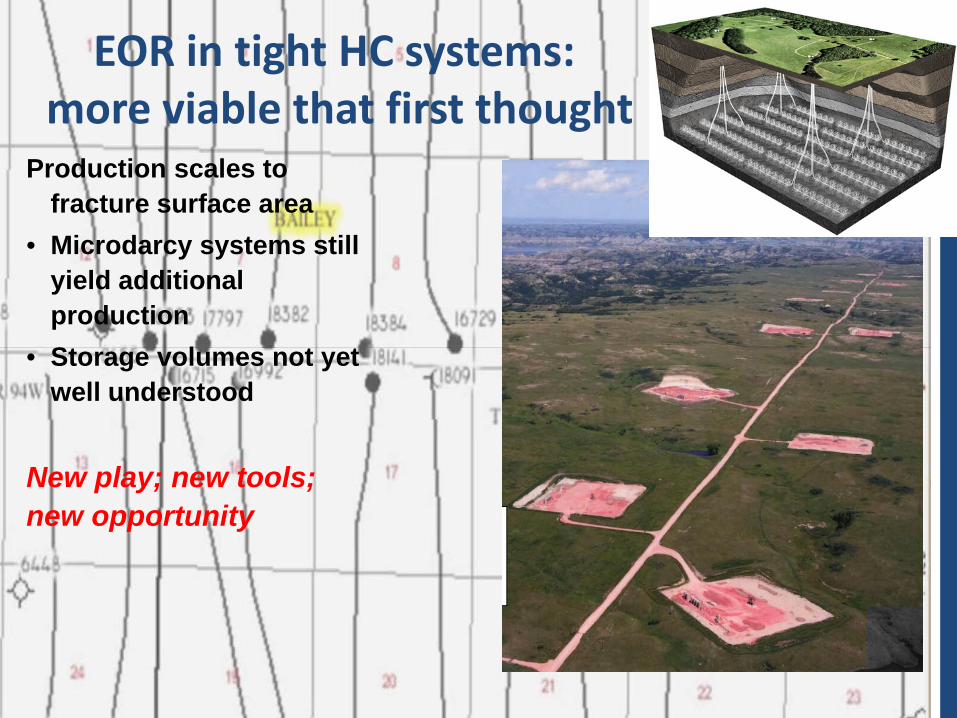
EOR in tight HC systems:more viable that first thought
Production scales to fracture surface area
• Microdarcy systems still yield additional production
• Storage volumes not yet well understood
New play; new tools; new opportunity

19
EOR and ROZ can produce negative carbon oil
Conventional CO2-EOR• Carbon balance = 82-
95% (by mass and energy)
• Must inject more CO2 for many settings
• Tight reservoirs• Moderate-low
saturation zones
Can store more carbon than is produced!!!

20
Offshore: Potential and infrastructure needs
Current actions & issues• East coast exploration• Denbury “green”
pipeline• Aging platforms• Renewed activity in UK

Oil and Gas Reservoirs226 BMT CO2
Storage Resource
Saline Formations2,102 - 20,043 BMT CO2
Storage Resource
Unmineable Coal Seams56 – 114 BMT CO2Storage Resource
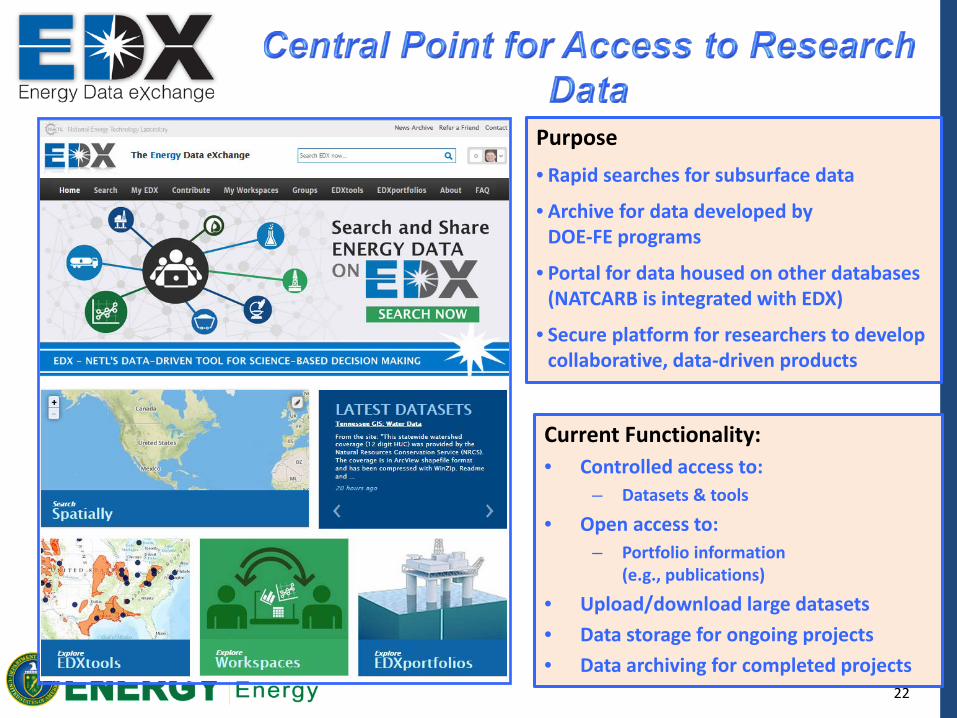
Knowledge SharingNational Carbon Sequestration Database and Geographic
Information System (NATCARB)
22
Purpose• Rapid searches for subsurface data
• Archive for data developed byDOE-FE programs
• Portal for data housed on other databases (NATCARB is integrated with EDX)
• Secure platform for researchers to develop collaborative, data-driven products
Current Functionality:• Controlled access to:
– Datasets & tools
• Open access to:– Portfolio information
(e.g., publications)
• Upload/download large datasets• Data storage for ongoing projects• Data archiving for completed projects

23
New DOE initiative: Subsurface S&T
Discovering, Characterizing, and Predicting subsurface
conditions
Accessing through wells
Engineering and permeability control
Sustained production and a sustainable environment
Monitoring
Energy Storage
GeothermalNuclear Waste
Disposal
Oil and Gas
Subsurface Remediation
CO2 Storage
Primary Energy Use by Source, 2012Quadrillion Btu [Total U.S. = 95.1 Quadrillion
Btu]
Natural Gas, 26.0
Petroleum, 34.7
Coal, 17.4
Other Renewable Energy, 8.8
NuclearPower, 8.1
Geothermal,0.2
First industrial workshop: July 2014Three more planned
23
24S4
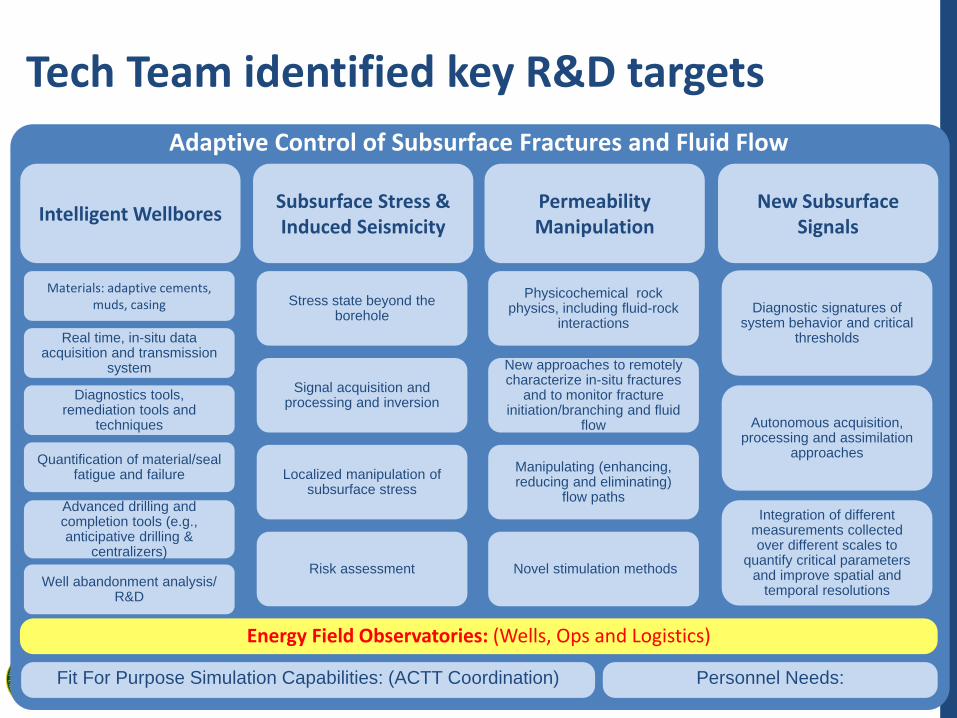
Tech Team identified key R&D targets
Intelligent Wellbores Subsurface Stress & Induced Seismicity
PermeabilityManipulation
New Subsurface Signals
Adaptive Control of Subsurface Fractures and Fluid Flow
Energy Field Observatories: (Wells, Ops and Logistics)
Materials: adaptive cements, muds, casing
Real time, in-situ data acquisition and transmission
system
Diagnostics tools, remediation tools and
techniques
Quantification of material/seal fatigue and failure
Advanced drilling and completion tools (e.g., anticipative drilling &
centralizers)
Well abandonment analysis/ R&D
Stress state beyond the borehole
Signal acquisition and processing and inversion
Localized manipulation of subsurface stress
Risk assessment
Physicochemical rock physics, including fluid-rock
interactions
New approaches to remotely characterize in-situ fractures
and to monitor fracture initiation/branching and fluid
flow
Manipulating (enhancing, reducing and eliminating)
flow paths
Novel stimulation methods
Diagnostic signatures of system behavior and critical
thresholds
Autonomous acquisition, processing and assimilation
approaches
Integration of different measurements collected over different scales to
quantify critical parameters and improve spatial and
temporal resolutions
Fit For Purpose Simulation Capabilities: (ACTT Coordination) Personnel Needs:

Targets of opportunityLarge demonstrations
Regulatory revision and amendment• Class VI update (every 7 years)• Input to class II/class VI discussion• Input into PISC determination
International efforts• China• Emerging projects and actors (e.g., Europe; middle east)
25

26
DOE CCUS Demonstration Projects
CCPI
FutureGen
ICCS (Area I)
Hydrogen Energy CaliforniaIGCC with EOR
$408 Million - DOE$4.0 Billion - Total
Summit Texas Clean EnergyIGCC with EOR
$450 Million - DOE$1.7 Billion - Total
NRG EnergyPost Combustion with CO2
Capture with EOR$167 Million – DOE$339 Million - Total
Air ProductsCO2 Capture from Steam
Methane Reformers with EOR$284 Million - DOE $431 Million - Total
LeucadiaCO2 Capture from Methanol
with EOR$261 Million - DOE $436 Million - Total
Archer Daniels MidlandCO2 Capture from Ethanol w/ saline storage
$141 Million - DOE $208 Million - Total
FutureGen 2.0Oxy-combustion with CO2 capture
and saline storage$1.0 Billion - DOE
$1.3 Billion - Total
Southern Company ServicesIGCC-Transport Gasifier w/CO2 pipeline
$270 Million - DOE$2.67 Billion - Total
Focus – Large-scale commercial demonstration of CCUS integrated with coal power generation and industrial sources.

27
Global challenge global progress: new global solutions still required
Key unit of innovation – global engines of discovery
Uthmaniyah (KSA)
Lula (BRA)
Quest (CAN)
ESI (UAE) Gorgon (AUS)
We just need more projects and more information
White Rose et al.GreenGen (PRC)
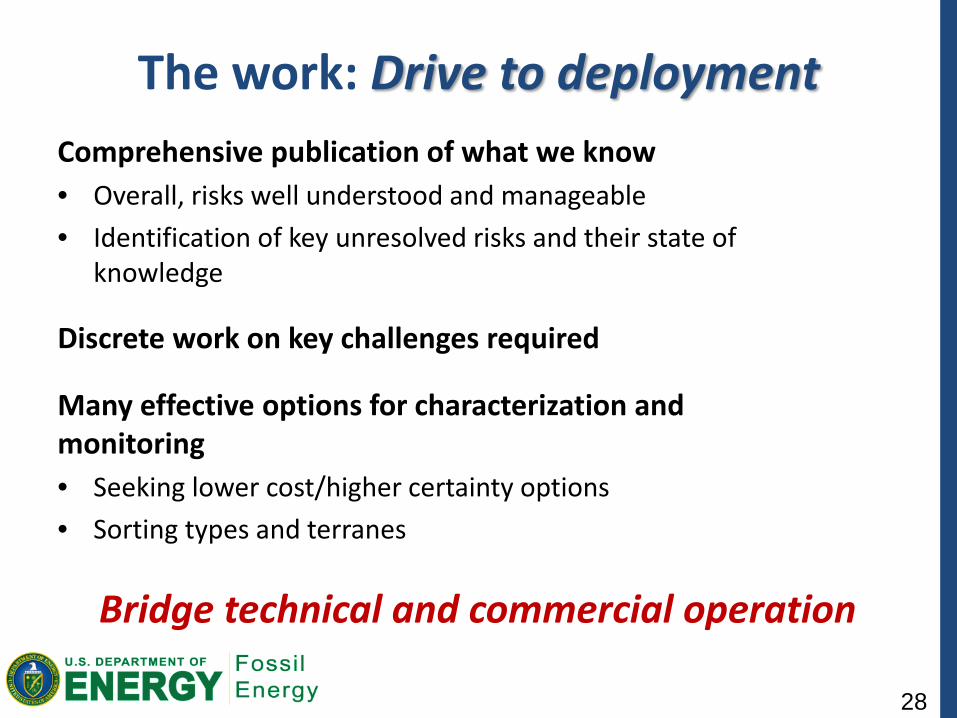
The work: Drive to deploymentComprehensive publication of what we know• Overall, risks well understood and manageable• Identification of key unresolved risks and their state of
knowledge
Discrete work on key challenges required
Many effective options for characterization and monitoring• Seeking lower cost/higher certainty options• Sorting types and terranes
Bridge technical and commercial operation
28


![STOCHASTIC ANTICIPATIVE CALCULUS ON THE PATH SPACE … · The stochastic calculus of order 2 is an useful tool in stochastic differential geometry (see [Em]). The theory of anticipative](https://img.pdfslide.us/doc/110x75/5f3fc121c0160f5f383f6c55/stochastic-anticipative-calculus-on-the-path-space-the-stochastic-calculus-of-order.jpg)


![arXiv:math/0610064v1 [math.DS] 2 Oct 2006 Centralizers of C](https://img.pdfslide.us/doc/110x75/586b7a931a28ab55088b9240/arxivmath0610064v1-mathds-2-oct-2006-centralizers-of-c-.jpg)