Embed Size (px)
Citation preview
Future of CaptivesWhat will be the core businesses for Automotive Captives in 2030?

Future of Captives | What will be the core businesses for Automotive Captives in 2030?
Preface 04
Imminent change in the Captive industry: Why scenario thinking? 10
The future of Captives in 2030: four plausible scenarios 18
Transformation paths towards the future of Captives 54
Conclusion 70
04
05
Future of Captives | What will be the core businesses for Automotive Captives in 2030?
The OEM-related (original equipment manufacturers) auto finance companies – known as Captives – have been a true success story over the last decades. Their traditional roles have been sales support for their OEMs’ vehicles, profit contribution, and risk management as well as customer management and loyalization on behalf of the group. To achieve these goals they successfully leveraged their fairly shielded and indirect sales model via the group’s dealer network. Today, based on their stable, asset-based business model, Captives contribute on average up to one third of their OEM group’s total profits and up to 50 percent of its total assets.
But this traditional business model is being challenged by several disruptive forces simultaneously. Increasing regulation will have further massive effects on capital requirements, operating models, and the IT infrastructure of Captives. Changing customer preferences and their willingness to shift from ownership towards usage of vehicles permits the emergence of new mobility concepts offered by existing and new competitors. In addition, fundamental changes in the automotive sector are on the horizon. The emergence of autono-mous vehicles and the increasing market penetration of alternative powertrains such as fully electric vehicles add further uncertainty and increase the complexity of residual value forecasting. Besides this, dig-italization facilitates market entry for new competitors who are dedicated to catering for increasing customer demands. Digi-talization also enables them to challenge
the Captives’ market segment which up to now has been relatively shielded, since it permits competitors to bypass traditional dealer networks and to approach custom-ers directly.
All these trends add great uncertainty to the future direction of the industry and lead to the question:how can Captives successfully react to all these challenges and what will be the core businesses of Captives in 2030?To answer these questions and to provide a guide with which to navigate through the fog of uncertainty, we have developed four rather extreme yet plausible scenarios of potential business models and the role of Captives in 2030. The scenarios have been derived with expert involvement from nearly all globally leading Captives and are based on our leading-edge scenario think-ing methodology.
In this study we have analyzed both the qualitative and the quantitative implica-tions of each scenario.
In this, we especially thank everyone who supported us in the development of this study by sharing their thoughts on and insights into this fascinating market.
Join us as we embark to take a glimpse into the future!
The successful business model of the Captive industry is on the verge of fundamental change
Preface
06
Interview with Sebastian Pfeifle, Global Auto Finance Lead at Deloitte, on the future of the Captive industry
What was your motivation for this study?I am convinced that we will see more im-minent change within the Captive industry in next 10-15 years than in the past 30 years. We were eager to take a glimpse into the future and to provide our clients with guidance to navigate the uncertainty with confidence.
In your opinion what will the core businesses of an auto Captive be in 2030? The Captive business model in 2030 will be rather bimodal. I expect the relative importance of the traditional asset-busi-ness to decline due to changing customer demand for more flexible usage models. To capture additional profits Captives will have to develop new service-based businesses and the attendant operating models.
What are challenges of the current business model?The current asset finance business is based on a tight relationship with the OEMs’ dealer networks. Dealers are the central sales channel for Captives. However, as customers are looking for more flexible solutions Captives will have to loosen this traditional bond and broaden their offering. In addition, the asset-based business has resulted in the exponential growth of balance sheets, tying up large equity reserves. Some Captives already account for more than 50 percent of the respective OEM group assets. Increasingly volatile residual values, for example due to an increasing share of new powertrains, bear a certain risk for the whole OEM group. Furthermore, such voluminous balance sheets attract the attention of financial regulators.
The industry is changing
07
Future of Captives | What will be the core businesses for Automotive Captives in 2030?
What are some of the required key capabilities for the service-based busi-ness models? Subscription- and usage-based payment models will become increasingly important. Fixed monthly rates of today will be replaced by flexible rates with the possibility of adding additional, on demand options as required, be it more horsepower, seat heating, navigation systems or even addi-tional insurance packages. Consequently, current IT systems and processes will need to be adapted accordingly. One of the key capabilities that Captives need to focus on is to provide a holistic and consistent cus-tomer experience and data management along this journey.
Will blockchain play a role?Blockchain technology is still in its early stages and first tangible use cases are being developed as we speak. Neverthe-less, this technology has the potential to become highly relevant in 2030 as it can enable – among other things – robo-fleets to become autonomous also regarding payment and maintenance.
What role will urbanization play?Most of the new mobility services will be offered in urban areas. We observe a new self-confidence of municipalities within the mobility ecosystem. In particular, as owner-ship and individual driving in urban areas will decline, cities will have an increasingly important role in providing and managing urban mobility solutions. We see a huge potential for partnerships between mobility providers and the megacities in this area. Especially since cities lack the experience and resources to solve these challenges on their own.
What particularly surprised you during the preparation of this study?I was astonished how widespread within the Captive industry the idea is of changing the current sales model drastically towards direct digital platforms, excluding most of today’s intermediaries.
Do you foresee increased financial regulation for the industry?Yes, and increasing financial regulation bears a certain threat for the industry. Whether through increasing capital requirements or through additional risk management and re-porting requirements. To comply with these increasing standards Captives will have to constantly adapt their legacy IT systems, which can become quite costly.
You have mentioned customers demanding more flexible mobility op-tions. What effects on the traditional asset finance business do you see? Many of these new mobility models will be based on large multi-brand and leased fleets. This requires market actors willing to take on the asset financing and respective risk of these fleets. Even today we can observe that platform providers who focus on the end customer management do not want to take this risk. I see large oppor-tunities for Captives to finance, operate, and maintain these fleets, although this will most likely further fuel the growth of their balance sheets. Additionally, the world of Captives will become more complex as var-ious customer segments that are spread across different geographies demand customized solutions. Captives will have to deliver and manage a broader range of products and services in parallel.
How can Captives cope with the in-creasing equity requirements?There are several plausible answers. Captives can form partnerships with com-mercial banks to share the balance sheet and required capital reserves. Another more radical solution might be to transfer the whole balance sheet to third parties – similar to the reinsurance industry.
Sebastian PfeiflePartnerGlobal Auto Finance Lead
08
Interview with Florian Klein, Head of the Center for the Long View (CLV) at Deloitte
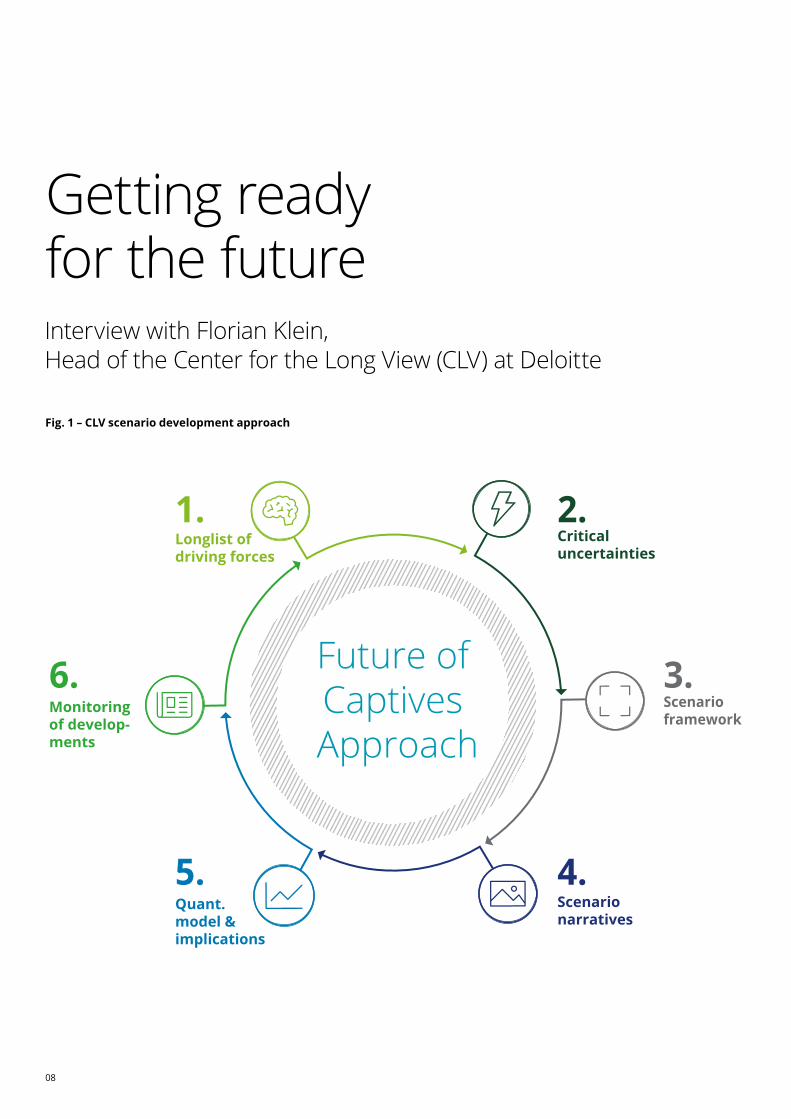
Fig. 1 – CLV scenario development approach
Getting ready for the future
Future of Captives Approach
1.Longlist of driving forces
2.Critical uncertainties
3.Scenario framework
4.Scenario narratives
5.Quant. model & implications
6.Monitoring of develop-ments
09
Future of Captives | What will be the core businesses for Automotive Captives in 2030?
Why is the Captive industry so inter-esting for you as a scenario practitioner and futurist?The Captive industry is facing disruption from many sides: to start with, the Auto-motive business is under pressure due to the rise of new mobility offerings and electrification. The banking sector is torn by shifting regulations and more demanding customers. And finally, digitalization affects all aspects of our economy. New competitors enter, while players who fail to adjust disappear. Uncertainty is all around the Captive industry. It is the perfect storm, and you better think carefully before you put out to sea.
How can scenario planning be a tool to cope with this situation?Unfortunately, we do not have a crystal ball. But we can anticipate how the various drivers will interact to reshape the industry. There are signposts one might observe: the acquisition of mobility start-ups by Captives, the reorganization of an OEM group or increasing regulatory attention. However, not all developments point in the same direction, and sometimes they are contradictory. Hence we need to think in several scenarios. In other words, in times of great uncertainty, scenario planning pro-vides the best possible basis for decision making by evaluating a multitude of driving forces, and by cutting through complexity.
Why is that so important?Executives suffer from cognitive biases: they either believe they know everything there is to know about their sector, or they are paralyzed in view of volatility and ambiguity, and hence take no or late action. Scenario thinking helps avoid those traps. If one understands what is critically uncertain, one can anticipate the corresponding strategic options. We also apply a holistic view on what drives the future, including but not limited to technology. Political and socio-economic trends will equally shape the future.
What was the approach to this study?A team consisting of Deloitte’s global Captive finance team and members of the CLV identified a longlist of driving forces that are expected to shape the Captive market until 2030. From that list, a group of distinguished Captive industry executives identified which drivers are especially rele-vant for their future and drew up scenarios on their industry. Our team then elaborated the detailed narratives and identified the effects of each of the four scenarios on the Captives.
What were the next steps?Based on the detailed scenario narratives, we developed a quantitative model to simulate the financial impact of each scenario on the P&L statement of a proxy Captive between 2016 and 2030.
How can the results benefit Captives?The results of this exercise provide a comprehensive picture of how the market might move over the next decade. This should provide a sound basis for developing robust, future-proof strategies for the Captive industry and its various players.
Are the results obtained valid and robust? Over the years, the CLV has conducted a large variety of scenario exercises across the majority of industries, functions, and regions and we noticed that scenarios need a rich set of views to gain validity. For this study, we relied not only on the experience of our global Deloitte Captive finance experts but also conducted several interviews and interactive sessions. For the analysis of the insights, we combined human intuition with machine objectivity by using advanced instruments, such as our AI-based trend sensing tool. The proven Deloitte network is an additional asset for building an integrated ecosystem around the mission to reduce uncertainty. As a result, traditional strategic thinking is replaced by a faster and more powerful approach, which provides our clients with more robust and effective strategies to survive in a world of uncertainties.
How can you ensure that the devel-oped scenarios remain valid over time?Developing scenarios and considering strategic options that flow from them is hard, creative, strategic work. Once that process step is done, monitoring the scenarios against reality is actually rather straight forward. We have an AI tool that allows clients to identify the context to their strategy in real time and take responsive action in a much more agile way than a few years ago.
Dr. Florian KleinDirectorHead of the Center for the Long View
10
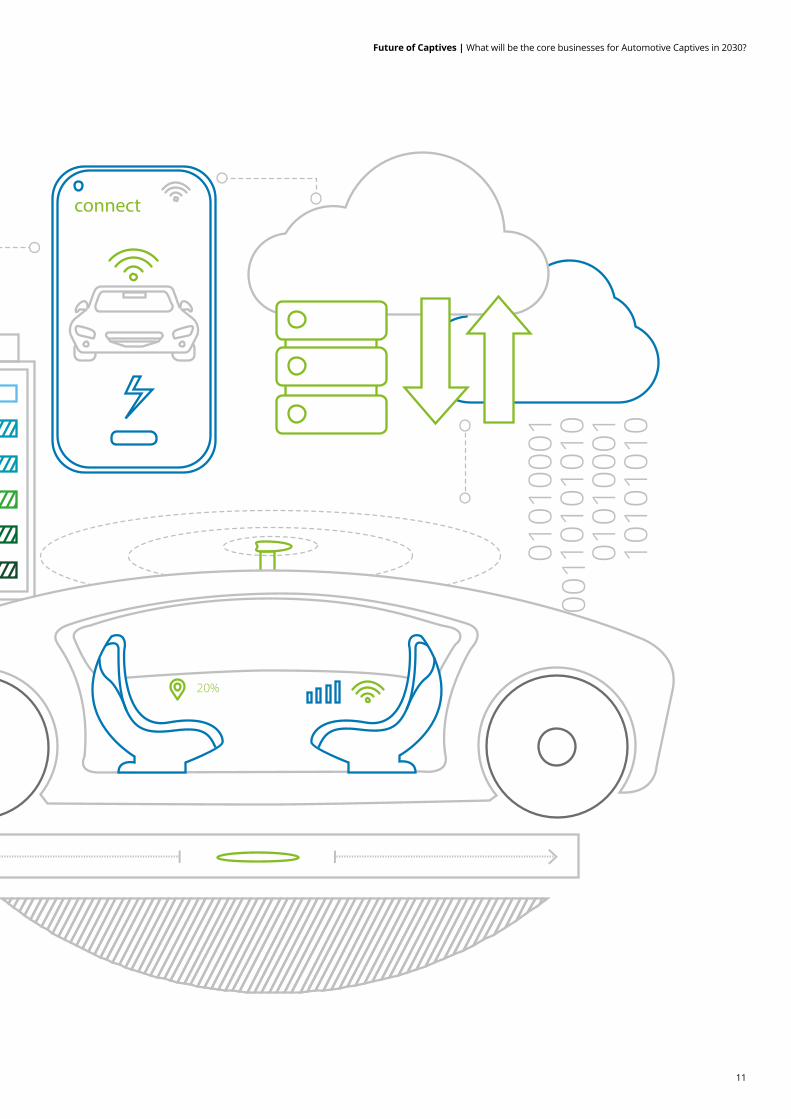
More than ever before, the Captive indus-try today is facing disruptive changes. This provides excellent business opportunities for both Captives and also competitors. The future belongs to those who are prepared and willing to take bold decisions today.
Imminent change in the Captive industry
11
Future of Captives | What will be the core businesses for Automotive Captives in 2030?
12
The unpredictable futureThe Captive industry is on the verge of the most intense change in its history. Several disruptive forces challenge the traditional business model simultaneously:
How to face increasing financial regulation which will have massive effects on capital requirements but will also require changes in operating models and large-scale modi-fications to IT legacy systems?
What effect will changing customer pref-erences, such as the shift from ownership towards usage of vehicles, have on the Captive business model?
How to manage risk and to forecast residual values with increased market penetration of alternative powertrains such as electric and self-driving vehicles?
Which service-based business models have the greatest likelihood of delivering positive business cases?
How to face the threat posed by new market entrants enabled by increased digitalization of the underlying business models?
What to expect?The study at hand will shed light on the possible developments in the Captive industry as it progresses towards 2030. Our goal is to support our readers and facilitate decision-making in times of great uncertainty, to enable Captives not only to survive, but to come out on top of the disruption lying ahead.
To support our audience in making solid decisions and shaping their future business we have moreover developed a financial model for the Captive industry. This allows us to quantify the effects for a proxy Captive organization in order to provide our readers with even more tangible insights.
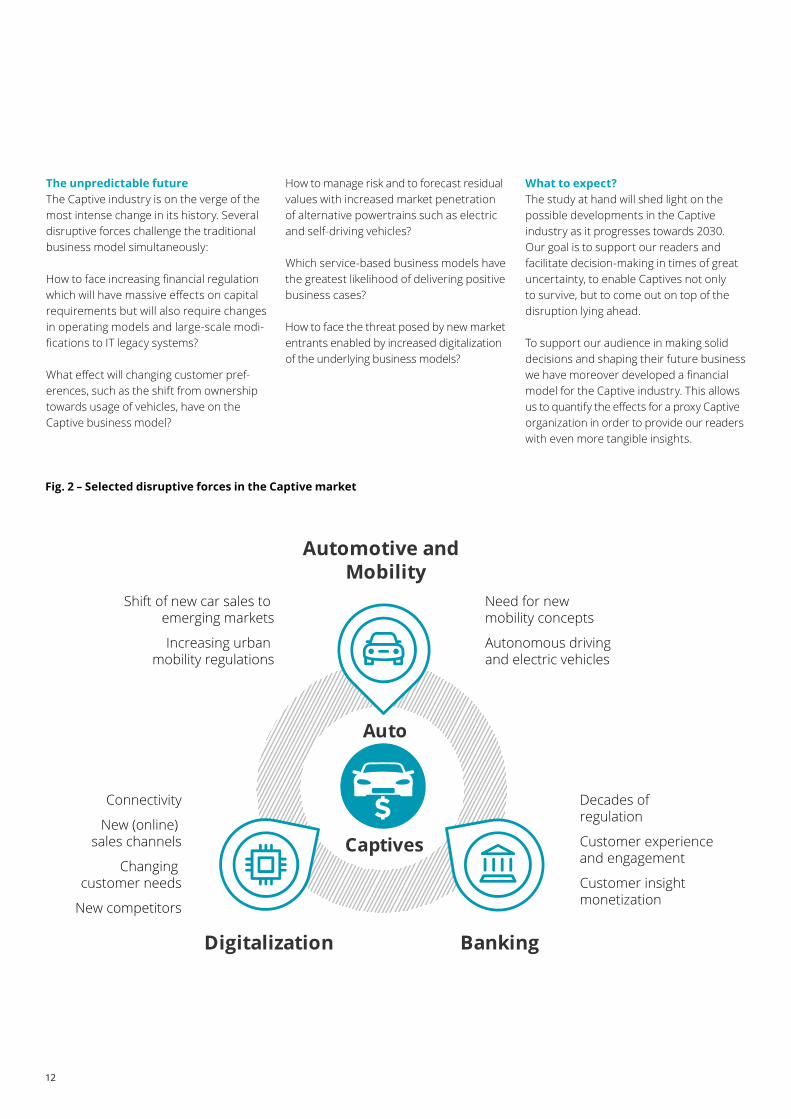
Fig. 2 – Selected disruptive forces in the Captive market
Digitalization
Automotive and Mobility
Banking
Auto
Captives
Shift of new car sales to emerging markets
Increasing urban mobility regulations
Connectivity
New (online) sales channels
Changing customer needs
New competitors
Need for new mobility concepts
Autonomous driving and electric vehicles
Decades of regulation
Customer experience and engagement
Customer insight monetization
13
Future of Captives | What will be the core businesses for Automotive Captives in 2030?
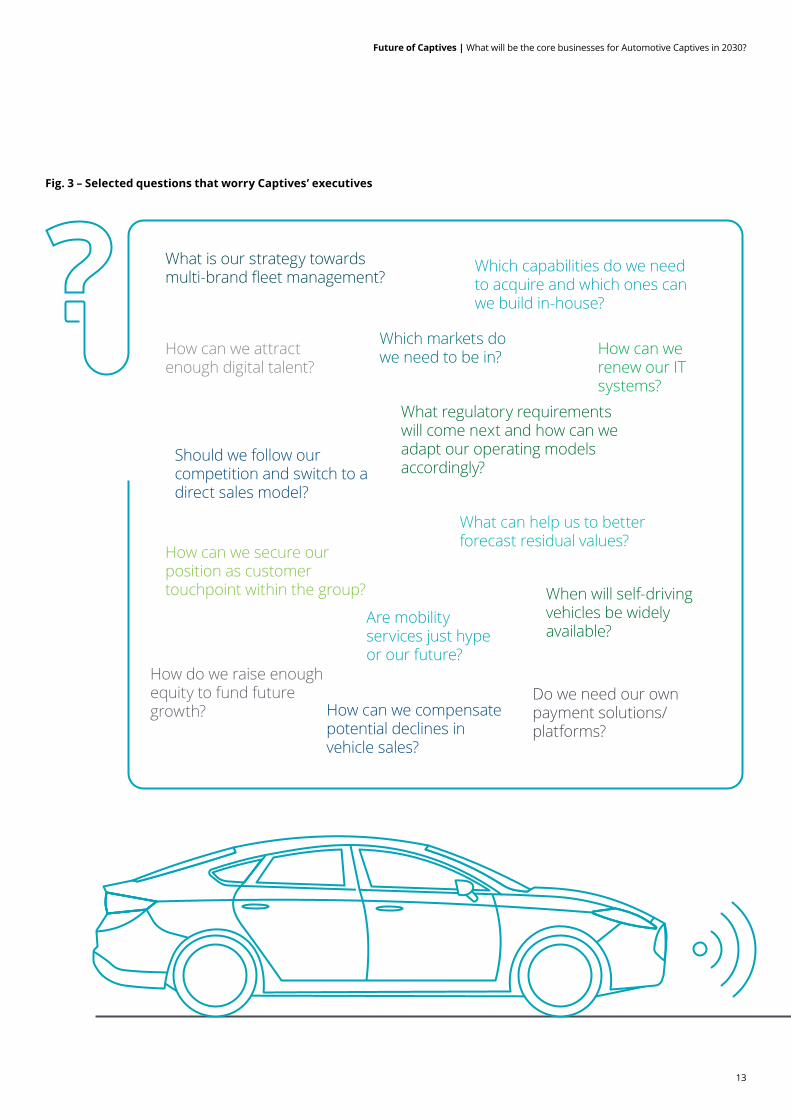
Fig. 3 – Selected questions that worry Captives’ executives
How can we secure our position as customer touchpoint within the group?
How do we raise enough equity to fund future growth?
Which capabilities do we need to acquire and which ones can we build in-house?
What is our strategy towards multi-brand fleet management?
Are mobility services just hype or our future?
How can we renew our IT systems?
Do we need our own payment solutions/platforms?
What regulatory requirements will come next and how can we adapt our operating models accordingly?
Which markets do we need to be in?How can we attract
enough digital talent?
How can we compensate potential declines in vehicle sales?
When will self-driving vehicles be widely available?
Should we follow our competition and switch to a direct sales model?
What can help us to better forecast residual values?
14
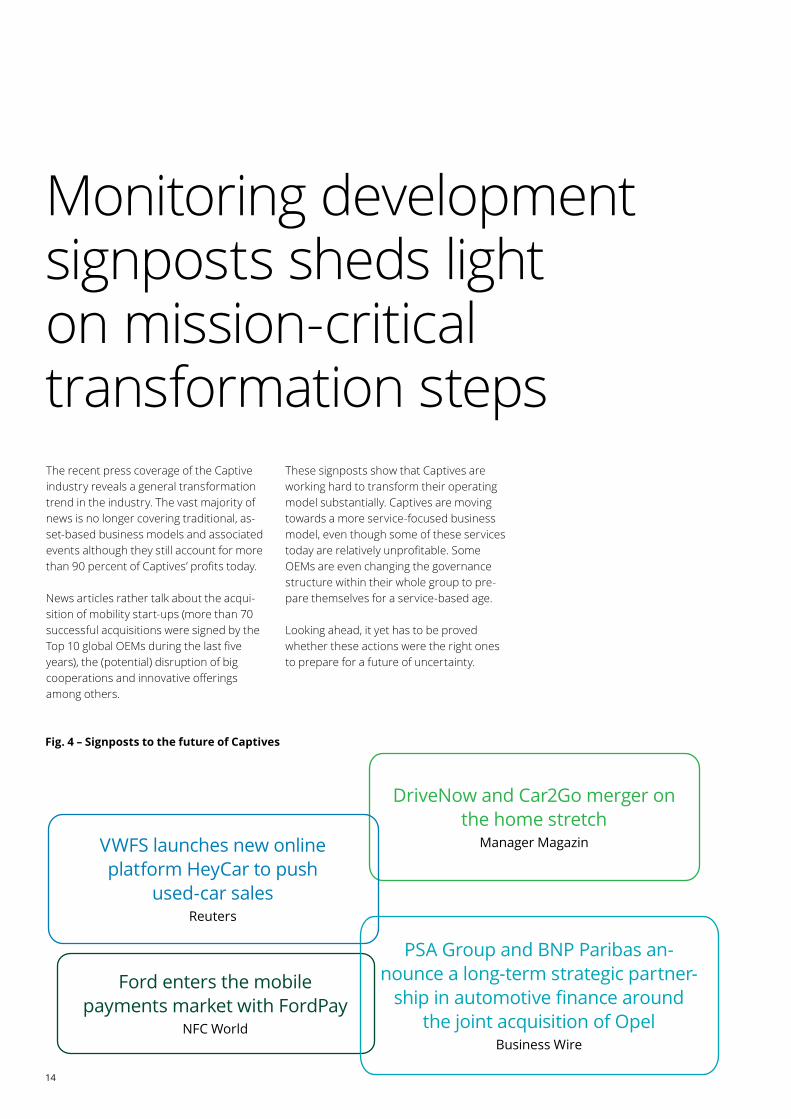
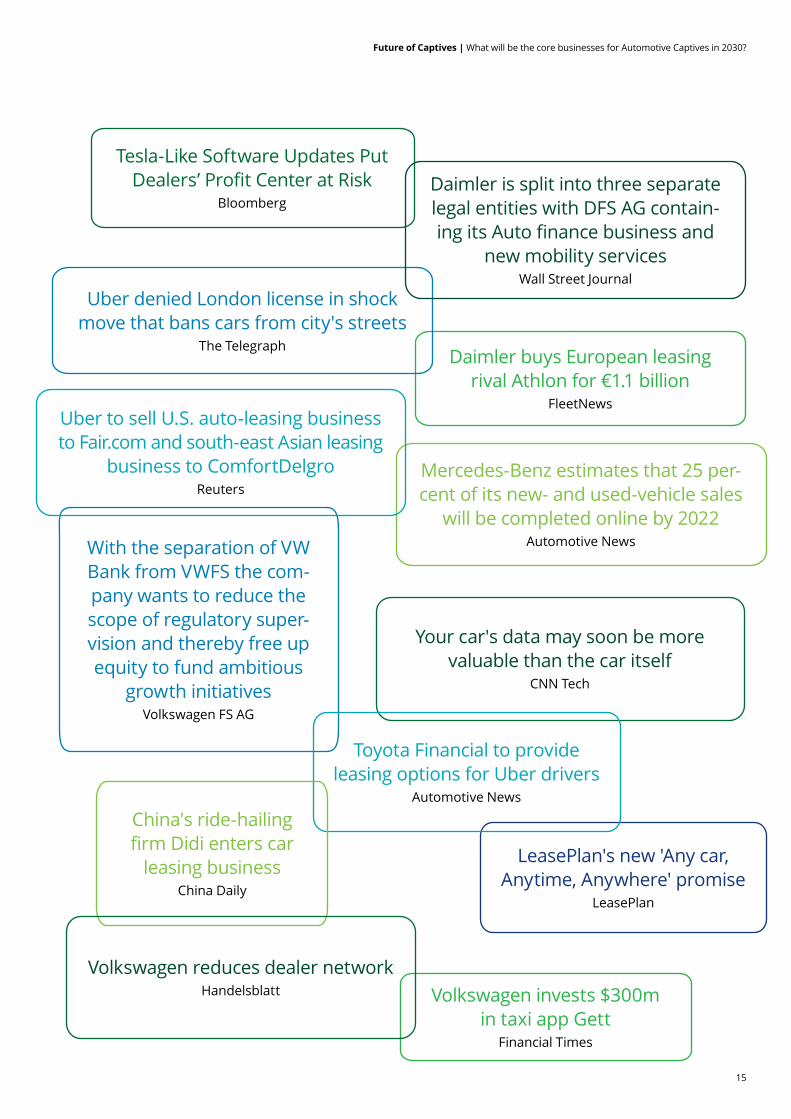
The recent press coverage of the Captive industry reveals a general transformation trend in the industry. The vast majority of news is no longer covering traditional, as-set-based business models and associated events although they still account for more than 90 percent of Captives’ profits today.
News articles rather talk about the acqui-sition of mobility start-ups (more than 70 successful acquisitions were signed by the Top 10 global OEMs during the last five years), the (potential) disruption of big cooperations and innovative offerings among others.
Fig. 4 – Signposts to the future of Captives
These signposts show that Captives are working hard to transform their operating model substantially. Captives are moving towards a more service-focused business model, even though some of these services today are relatively unprofitable. Some OEMs are even changing the governance structure within their whole group to pre-pare themselves for a service-based age.
Looking ahead, it yet has to be proved whether these actions were the right ones to prepare for a future of uncertainty.
Monitoring development signposts sheds light on mission-critical transformation steps
Ford enters the mobile payments market with FordPay
NFC World
DriveNow and Car2Go merger on the home stretch
Manager Magazin VWFS launches new online platform HeyCar to push
used-car salesReuters
PSA Group and BNP Paribas an-nounce a long-term strategic partner-
ship in automotive finance around the joint acquisition of Opel
Business Wire
15
Future of Captives | What will be the core businesses for Automotive Captives in 2030?
Daimler buys European leasing rival Athlon for €1.1 billion
FleetNews
Your car's data may soon be more valuable than the car itself
CNN Tech
Volkswagen invests $300m in taxi app Gett
Financial Times
LeasePlan's new 'Any car, Anytime, Anywhere' promise
LeasePlan
Tesla-Like Software Updates Put Dealers’ Profit Center at Risk
Bloomberg
With the separation of VW Bank from VWFS the com-pany wants to reduce the scope of regulatory super-vision and thereby free up equity to fund ambitious
growth initiativesVolkswagen FS AG
Uber denied London license in shock move that bans cars from city's streets
The Telegraph
Toyota Financial to provide leasing options for Uber drivers
Automotive News
Daimler is split into three separate legal entities with DFS AG contain-ing its Auto finance business and
new mobility servicesWall Street Journal
Mercedes-Benz estimates that 25 per-cent of its new- and used-vehicle sales
will be completed online by 2022Automotive News
China's ride-hailing firm Didi enters car
leasing businessChina Daily
Volkswagen reduces dealer networkHandelsblatt
Uber to sell U.S. auto-leasing business to Fair.com and south-east Asian leasing
business to ComfortDelgroReuters
16
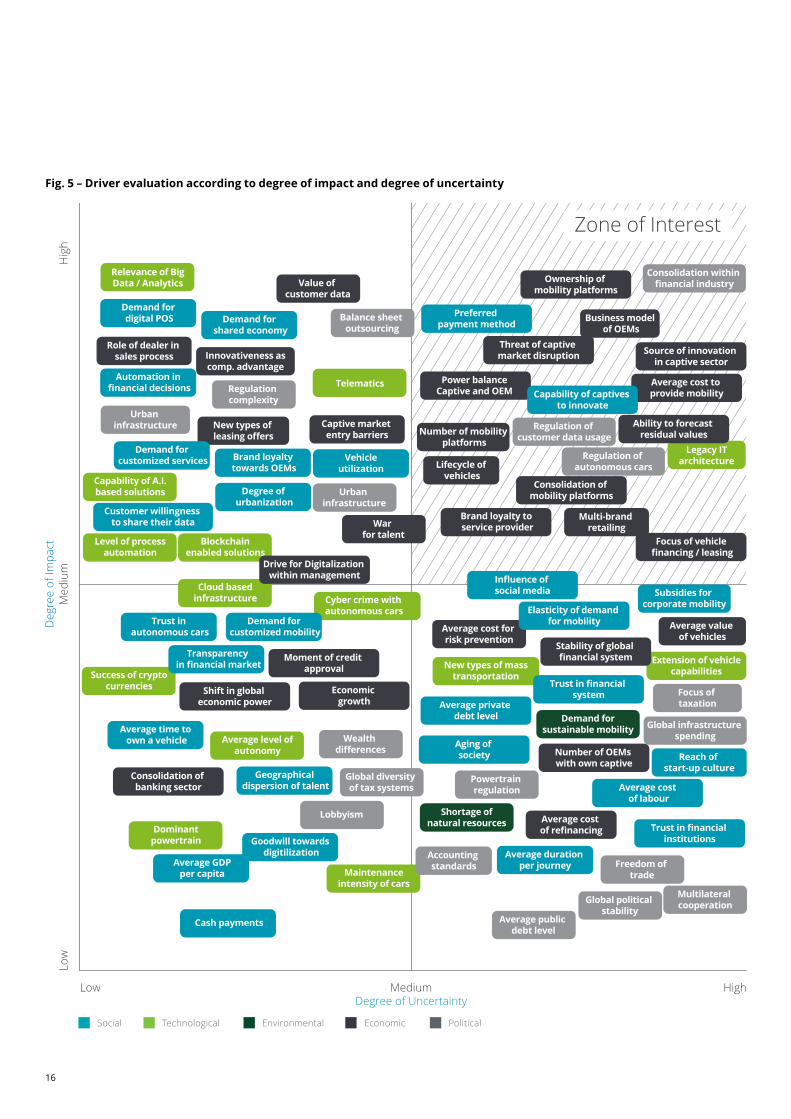
Fig. 5 – Driver evaluation according to degree of impact and degree of uncertainty
High
Hig
h
Degree of UncertaintyLow
Low
Medium
Deg
ree
of Im
pact
Med
ium
Zone of Interest
Relevance of Big Data / Analytics
Legacy IT architecture
Telematics
Blockchain enabled solutions
Cloud based infrastructure
Success of crypto currencies
Average level of autonomy
Dominant powertrain
Maintenance intensity of cars
Shortage of natural resources
Demand for sustainable mobility
Cyber crime with autonomous cars
New types of mass transportation
Extension of vehicle capabilities
Level of process automation
Capability of A.I. based solutions
Demand for digital POS
Automation in financial decisions
Demand for shared economy
Value of customer data
Role of dealer in sales process Innovativeness as
comp. advantage
New types of leasing offers
Captive market entry barriers
War for talent
Drive for Digitalization within management
Moment of credit approval
Shift in global economic power
Economic growth
Average cost for risk prevention Stability of global
financial system
Brand loyalty to service provider
Consolidation of mobility platforms
Average cost to provide mobility
Ability to forecast residual values
Lifecycle of vehicles
Number of mobility platforms
Power balance Captive and OEM
Threat of captive market disruption
Business model of OEMs
Source of innovation in captive sector
Ownership of mobility platforms
Multi-brand retailing
Focus of vehicle financing / leasing
Average value of vehicles
Number of OEMs with own captive
Average cost of refinancing
Consolidation of banking sector
Aging of society
Average private debt level
Influence of social media
Elasticity of demand for mobility
Capability of captives to innovate
Preferred payment method
Trust in financial system
Reach of start-up culture
Subsidies for corporate mobility
Average cost of labour
Trust in financial institutions
Average duration per journey
Urban infrastructure
Urban infrastructure
Wealth differences
Global diversity of tax systems
Accounting standards
Global political stability
Freedom of trade
Global infrastructure spending
Regulation of autonomous cars
Regulation of customer data usage
Consolidation within financial industry
Focus of taxation
Powertrain regulation
Multilateral cooperation
Average public debt level
Lobbyism
Regulation complexity
Balance sheet outsourcing
Demand for customized services
Customer willingness to share their data
Brand loyalty towards OEMs
Degree of urbanization
Demand for customized mobility
Trust in autonomous cars
Transparency in financial market
Geographical dispersion of talent
Average time to own a vehicle
Goodwill towards digitilization
Average GDPper capita
Cash payments
Vehicle utilization
Social Technological Environmental Economic Political
17
Future of Captives | What will be the core businesses for Automotive Captives in 2030?
From drivers to scenariosIn order to gain a comprehensive list of relevant trends and drivers, we applied tra-ditional desk research combined with latest artificial intelligence trend sensing tools. We further conducted a large set of Captive industry expert interviews. Within these, we talked to various top level executives from the majority of the largest global Captives across all functions and geographic regions, independent auto finance experts as well as researchers focusing on the auto finance and mobility industry.
During the course of this we identified more than 140 drivers which will affect the future of the Captive industry. Through our anal-ysis and the market assessment of Captive practitioners, we rated those drivers with regards to impact and uncertainty (see figure 5).
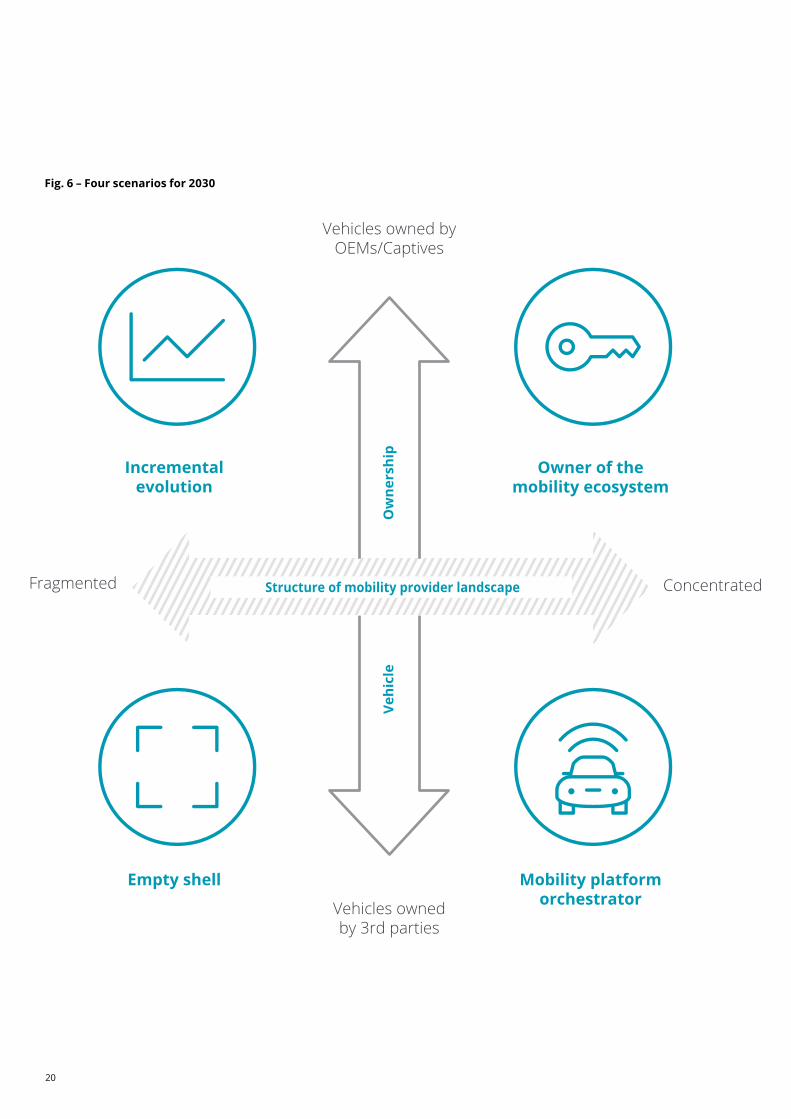
In a subsequent joint workshop with in-dustry representatives of the largest global Captives, we clustered the trends and drivers. We identified the most impactful and uncertain drivers (top right quadrant in figure 5). In the next step, we grouped them into two underlying critical uncertainties that will shape the future of Captives sub-stantially.
According to our analysis the first critical uncertainty is the structure of the mobility provider landscape, such as the degree of fragmentation or concentration of the global mobility market. By 2030, mobility offerings across the globe can, on the one hand, be dominated by a few global players. On the other hand, a diverse set of mobility providers might emerge, including new market entrants, for instance from the tech world. Thus, the heterogeneity of the mo-
bility markets with regards to regulation or region-specific demands plays a key role.
The second critical uncertainty is vehicle ownership, meaning if Captives still own vehicles and their respective risks in the future or shifted - by choice or by necessity - these assets to third parties such as insur-ers. This uncertainty is driven by technologi-cal and regulatory developments. Advances in the field of residual value forecasting ca-pabilities might enable Captives to manage risk more efficiently. In addition, regulators might address the rising relevance of Cap-tives by tightening capital requirements.
The combination of both critical uncer-tainties as two axes of the scenario matrix results in four plausible but highly distinct scenarios which are illustrated on the following pages.
of the largest global Automotive Captives were actively involved in the process of identifying and rating driving forces and developing the scenarios
9 10
18
The future of Captives in 2030 will be deter-mined by a multitude of high-impact drivers. Where developments are most uncertain from today’s point of view, scenario-based thinking can support decision-making. We have devel-oped four extreme yet plausible scenarios to describe the future of Captives.
The future of Captives in 2030: four plausible scenarios
19
Future of Captives | What will be the core businesses for Automotive Captives in 2030?
20
Fig. 6 – Four scenarios for 2030
Owner of the mobility ecosystem
Mobility platform orchestrator
Empty shell
Incremental evolution
Vehi
cle
O
wne
rshi
p
Vehicles owned by OEMs/Captives
ConcentratedFragmented
Vehicles owned by 3rd parties
Structure of mobility provider landscape
Future of Captives | What will be the core businesses for Automotive Captives in 2030?
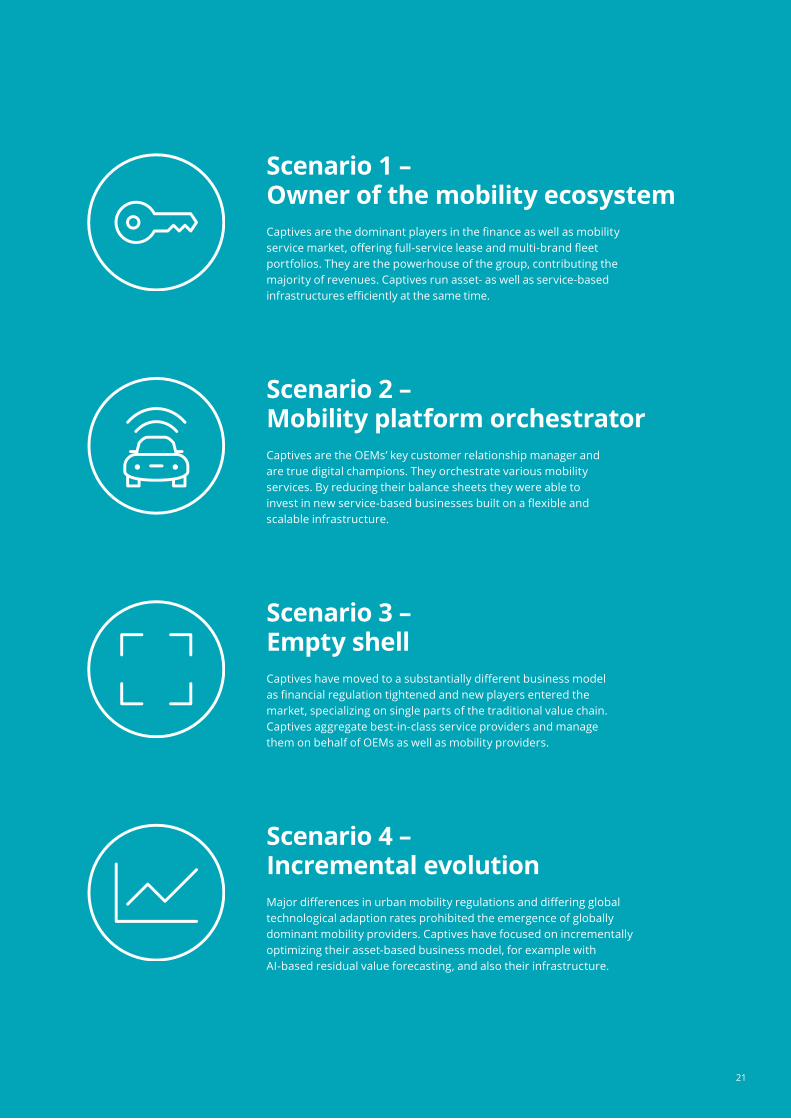
Scenario 3 – Empty shellCaptives have moved to a substantially different business model as financial regulation tightened and new players entered the market, specializing on single parts of the traditional value chain. Captives aggregate best-in-class service providers and manage them on behalf of OEMs as well as mobility providers.
Scenario 4 – Incremental evolutionMajor differences in urban mobility regulations and differing global technological adaption rates prohibited the emergence of globally dominant mobility providers. Captives have focused on incrementally optimizing their asset-based business model, for example with AI-based residual value forecasting, and also their infrastructure.
Scenario 2 – Mobility platform orchestratorCaptives are the OEMs’ key customer relationship manager and are true digital champions. They orchestrate various mobility services. By reducing their balance sheets they were able to invest in new service-based businesses built on a flexible and scalable infrastructure.
Scenario 1 – Owner of the mobility ecosystem Captives are the dominant players in the finance as well as mobility service market, offering full-service lease and multi-brand fleet portfolios. They are the powerhouse of the group, contributing the majority of revenues. Captives run asset- as well as service-based infrastructures efficiently at the same time.
21
22
car share
The Deloitte Future of Captives Industry Model
23
Future of Captives | What will be the core businesses for Automotive Captives in 2030?
Quantitative modelAs the goal of this study is to facilitate decision-making in the face of uncertainty, it is essential to quantify projected shifts and their implications for the Captive industry.
As a foundation for the quantitative model developed, we defined a proxy Captive. This Captive has operations in all relevant regions that are in line with the set up of the majority of existing Captives (EU, NAFTA, China, rest of world [RoW]) and is active in the most relevant business segments, meaning mainly asset-based business models, as well as those relevant in the foreseeable future, meaning service-based business models.
In reality, we often observe the phenome-non that the majority of operating expenses
arise, and staff are employed in the country of incorporation of the relevant Captive resulting in a geographical imbalance of costs. Some Captives accumulate up to 50 percent of their overhead expenses in the country of their headquarters. To avoid this “HQ-bias” we allocated operating expenses and the workforce based on the respective market size of each region.
As the basic data for our calculations we used publicly available information (annual reports, analyst reports and investor pre-sentations, for instance) of all major global Captives. As a baseline, we calculated a profit & loss statement for our proxy Captive for 2016. On this basis, we forecasted and calculated the proxy Captive’s performance until 2030 for each scenario across the various business segments and regions.
To achieve comparable results we kept the development of annual new vehicle sales volumes constant across all scenarios (for details please see the next page). We fur-ther quantified future market potentials by applying various Deloitte tools (e.g., Urban Solution Tool, E-Mobility Model) and lever-aged our internal expert network.
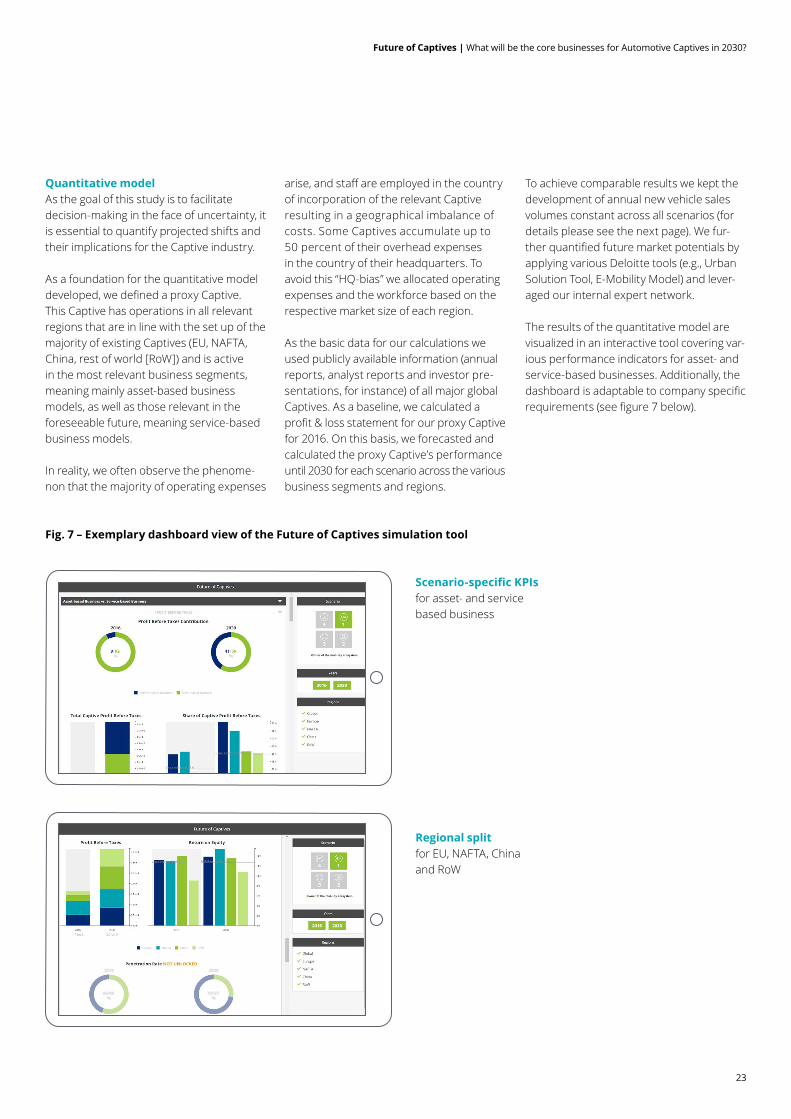
The results of the quantitative model are visualized in an interactive tool covering var-ious performance indicators for asset- and service-based businesses. Additionally, the dashboard is adaptable to company specific requirements (see figure 7 below).
Fig. 7 – Exemplary dashboard view of the Future of Captives simulation tool
Scenario-specific KPIs for asset- and service based business
Regional split for EU, NAFTA, China and RoW
24
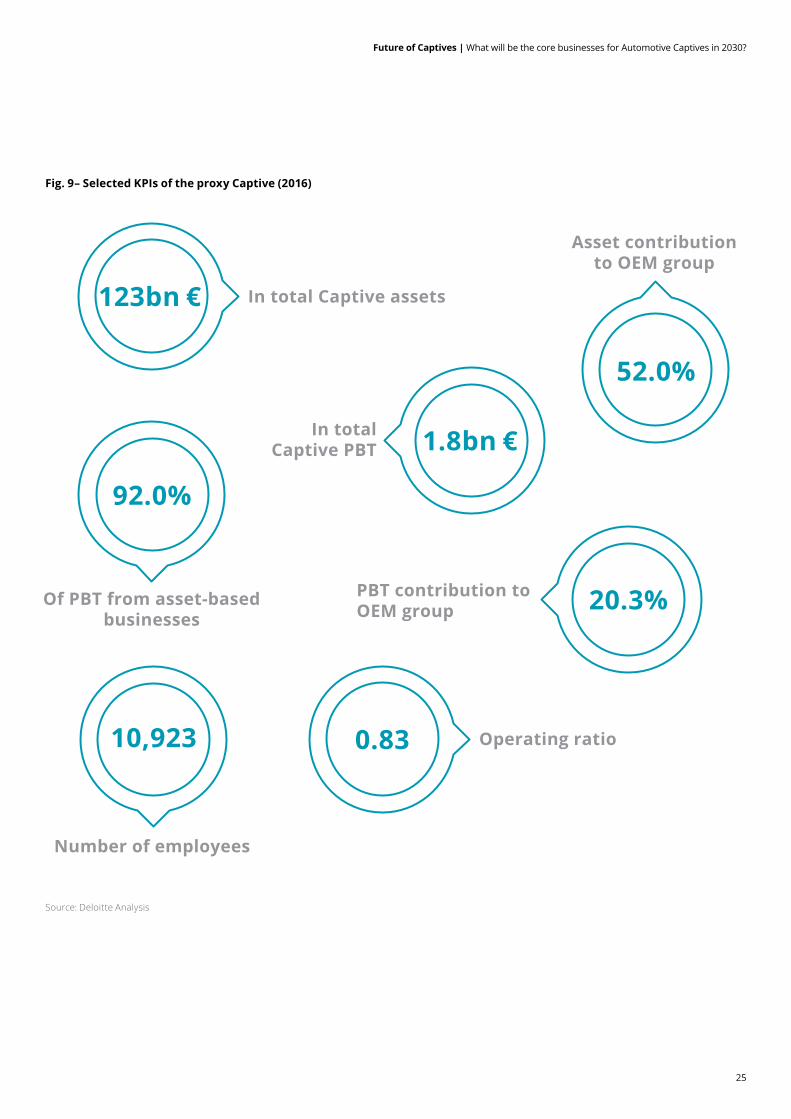
In 2016, the proxy Captive generated 1.8bn € profit before tax (PBT). In line with the industry average, the vast majority of the profit is generated in asset-based busi-ness (92 percent of total PBT). Overall, the Captive contributes more than 20 percent to the total group PBT. The proxy Captive’s asset volume of 123bn € accounts for ~52 percent of total group assets.
The proxy Captive has a global average penetration rate (meaning the share of sold vehicles financed via credit or leasing offerings) of ~31 percent, with a higher rate in mature markets, i.e., Europe and NAFTA, and significant untapped potentials
in China and RoW. Loan financing is more dominant than leasing here.
Initial offerings in service-based business, such as mobility services or insurance, are already established but not yet globally scaled (eight percent PBT contribution). These offerings today do not generate noticeable profits with insurance being the cash cow of the service-based business.
Fleet management services are provided just for own brands and so far concentrat-ed on the European market due to the mar-ket’s strong heritage in fleet management services and corporate vehicles.
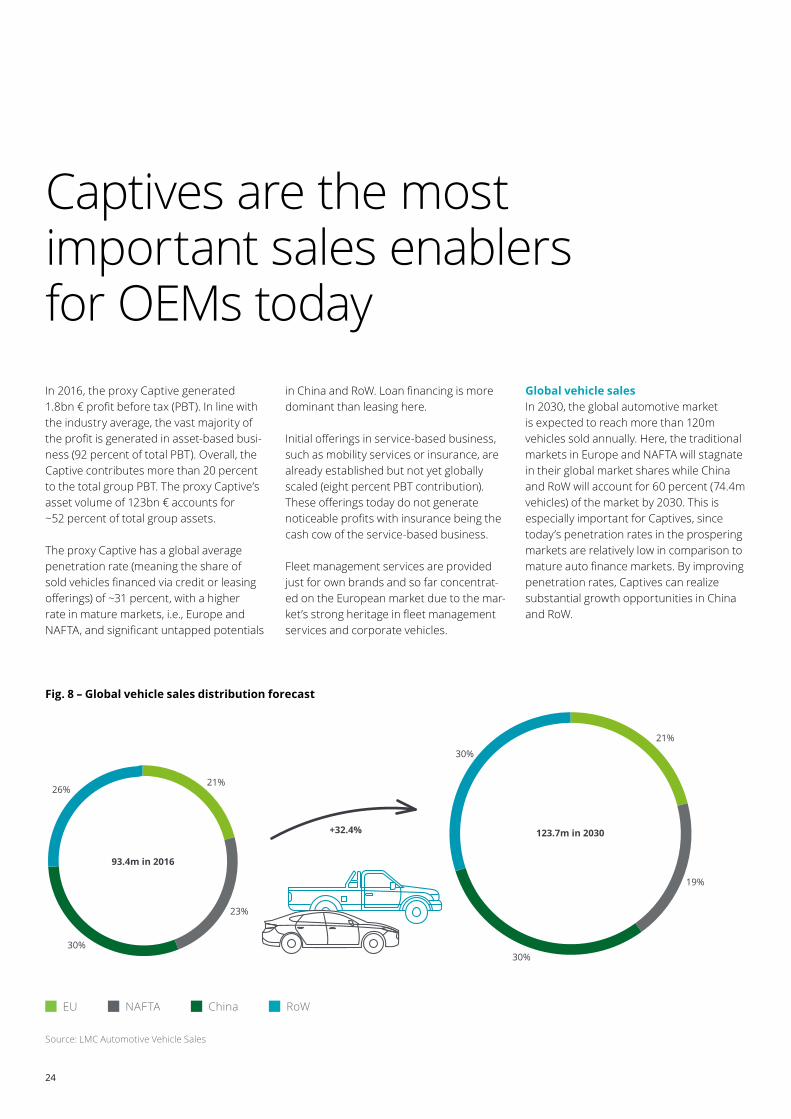
Fig. 8 – Global vehicle sales distribution forecast
Source: LMC Automotive Vehicle Sales
27%
21%
93.4m in 2016
+32.4% 123.7m in 2030
21%
19%
30%
30%
23%
30%
26%
EU NAFTA China RoW
Global vehicle sales In 2030, the global automotive market is expected to reach more than 120m vehicles sold annually. Here, the traditional markets in Europe and NAFTA will stagnate in their global market shares while China and RoW will account for 60 percent (74.4m vehicles) of the market by 2030. This is especially important for Captives, since today’s penetration rates in the prospering markets are relatively low in comparison to mature auto finance markets. By improving penetration rates, Captives can realize substantial growth opportunities in China and RoW.
Captives are the most important sales enablers for OEMs today
25
Future of Captives | What will be the core businesses for Automotive Captives in 2030?
Fig. 9– Selected KPIs of the proxy Captive (2016)
Source: Deloitte Analysis
123bn €
0.83
52.0%
20.3%
1.8bn €
92.0%
10,923
In total Captive assets
In total Captive PBT
Of PBT from asset-based businesses
Number of employees
Operating ratio
PBT contribution to OEM group
Asset contribution to OEM group
26
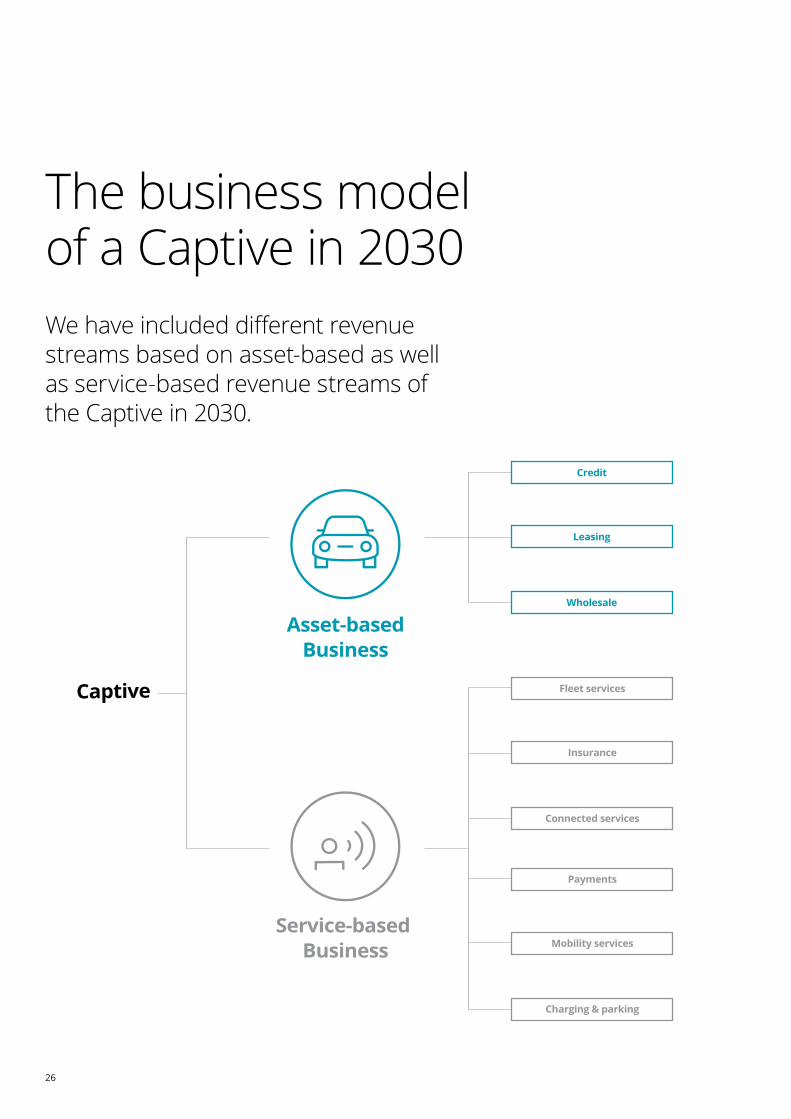
We have included different revenue streams based on asset-based as well as service-based revenue streams of the Captive in 2030.
Captive
Asset-basedBusiness
Service-based Business
Wholesale
Leasing
Credit
Connected services
Insurance
Fleet services
Charging & parking
Mobility services
Payments
The business model of a Captive in 2030
Future of Captives | What will be the core businesses for Automotive Captives in 2030?
27
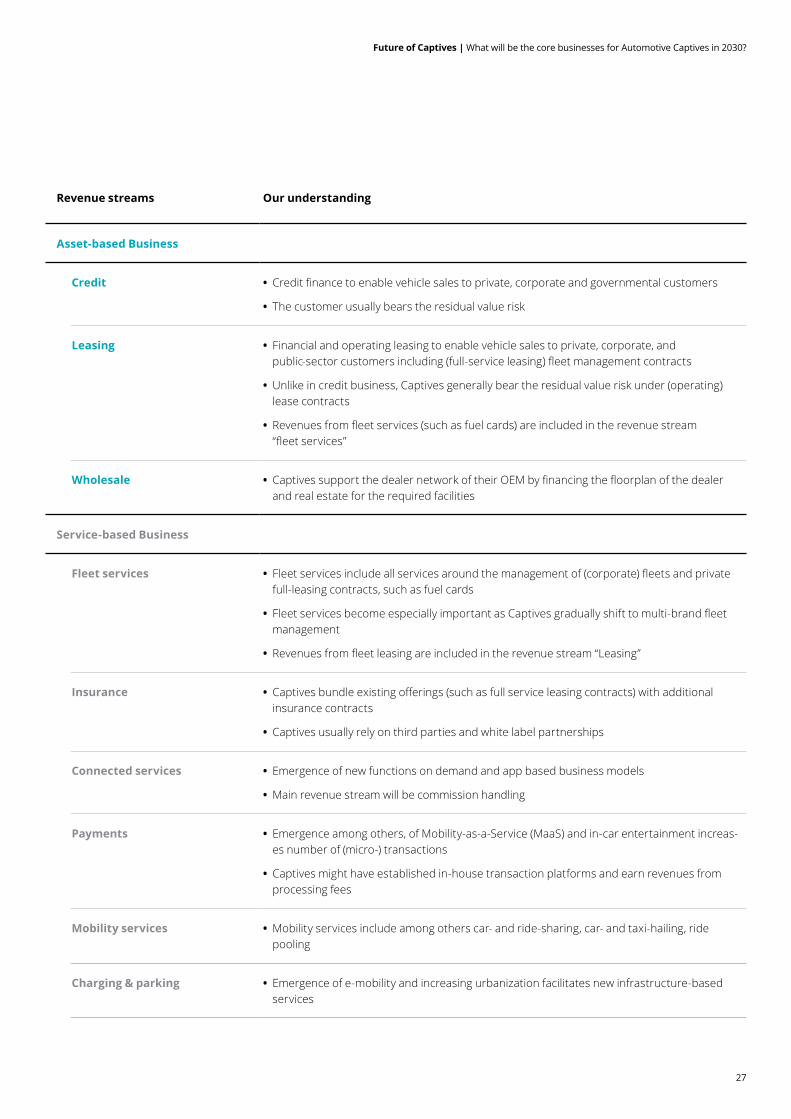
Revenue streams Our understanding
Asset-based Business
Credit • Credit finance to enable vehicle sales to private, corporate and governmental customers
• The customer usually bears the residual value risk
Leasing • Financial and operating leasing to enable vehicle sales to private, corporate, and public-sector customers including (full-service leasing) fleet management contracts
• Unlike in credit business, Captives generally bear the residual value risk under (operating) lease contracts
• Revenues from fleet services (such as fuel cards) are included in the revenue stream “fleet services”
Wholesale • Captives support the dealer network of their OEM by financing the floorplan of the dealer and real estate for the required facilities
Service-based Business
Fleet services • Fleet services include all services around the management of (corporate) fleets and private full-leasing contracts, such as fuel cards
• Fleet services become especially important as Captives gradually shift to multi-brand fleet management
• Revenues from fleet leasing are included in the revenue stream “Leasing”
Insurance • Captives bundle existing offerings (such as full service leasing contracts) with additional insurance contracts
• Captives usually rely on third parties and white label partnerships
Connected services • Emergence of new functions on demand and app based business models
• Main revenue stream will be commission handling
Payments • Emergence among others, of Mobility-as-a-Service (MaaS) and in-car entertainment increas-es number of (micro-) transactions
• Captives might have established in-house transaction platforms and earn revenues from processing fees
Mobility services • Mobility services include among others car- and ride-sharing, car- and taxi-hailing, ride pooling
Charging & parking • Emergence of e-mobility and increasing urbanization facilitates new infrastructure-based services
Scenario 1 – Owner of the mobility ecosystemA beneficial regulatory environment and the established dominance in global mobility services have enabled the Captives to become the new power-house of its OEM group in 2030.
28
Future of Captives | What will be the core businesses for Automotive Captives in 2030?
29
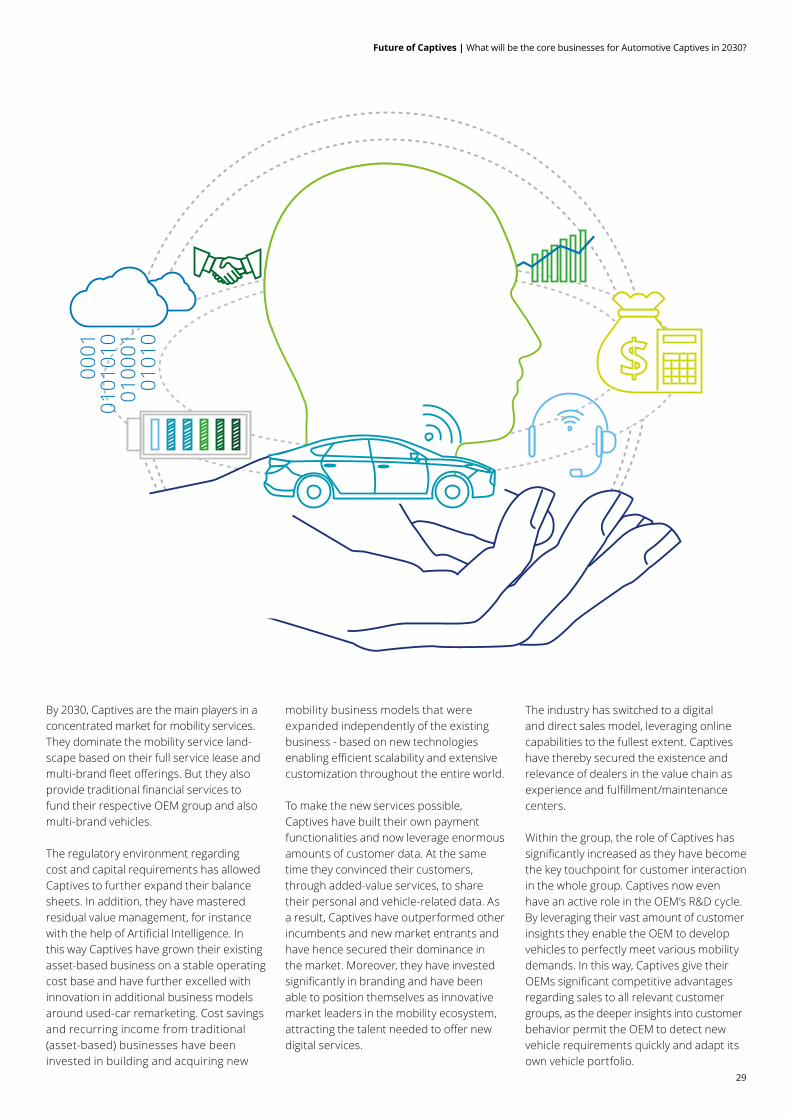
By 2030, Captives are the main players in a concentrated market for mobility services. They dominate the mobility service land-scape based on their full service lease and multi-brand fleet offerings. But they also provide traditional financial services to fund their respective OEM group and also multi-brand vehicles.
The regulatory environment regarding cost and capital requirements has allowed Captives to further expand their balance sheets. In addition, they have mastered residual value management, for instance with the help of Artificial Intelligence. In this way Captives have grown their existing asset-based business on a stable operating cost base and have further excelled with innovation in additional business models around used-car remarketing. Cost savings and recurring income from traditional (asset-based) businesses have been invested in building and acquiring new
mobility business models that were expanded independently of the existing business - based on new technologies enabling efficient scalability and extensive customization throughout the entire world.
To make the new services possible, Captives have built their own payment functionalities and now leverage enormous amounts of customer data. At the same time they convinced their customers, through added-value services, to share their personal and vehicle-related data. As a result, Captives have outperformed other incumbents and new market entrants and have hence secured their dominance in the market. Moreover, they have invested significantly in branding and have been able to position themselves as innovative market leaders in the mobility ecosystem, attracting the talent needed to offer new digital services.
The industry has switched to a digital and direct sales model, leveraging online capabilities to the fullest extent. Captives have thereby secured the existence and relevance of dealers in the value chain as experience and fulfillment/maintenance centers.
Within the group, the role of Captives has significantly increased as they have become the key touchpoint for customer interaction in the whole group. Captives now even have an active role in the OEM’s R&D cycle. By leveraging their vast amount of customer insights they enable the OEM to develop vehicles to perfectly meet various mobility demands. In this way, Captives give their OEMs significant competitive advantages regarding sales to all relevant customer groups, as the deeper insights into customer behavior permit the OEM to detect new vehicle requirements quickly and adapt its own vehicle portfolio.
30
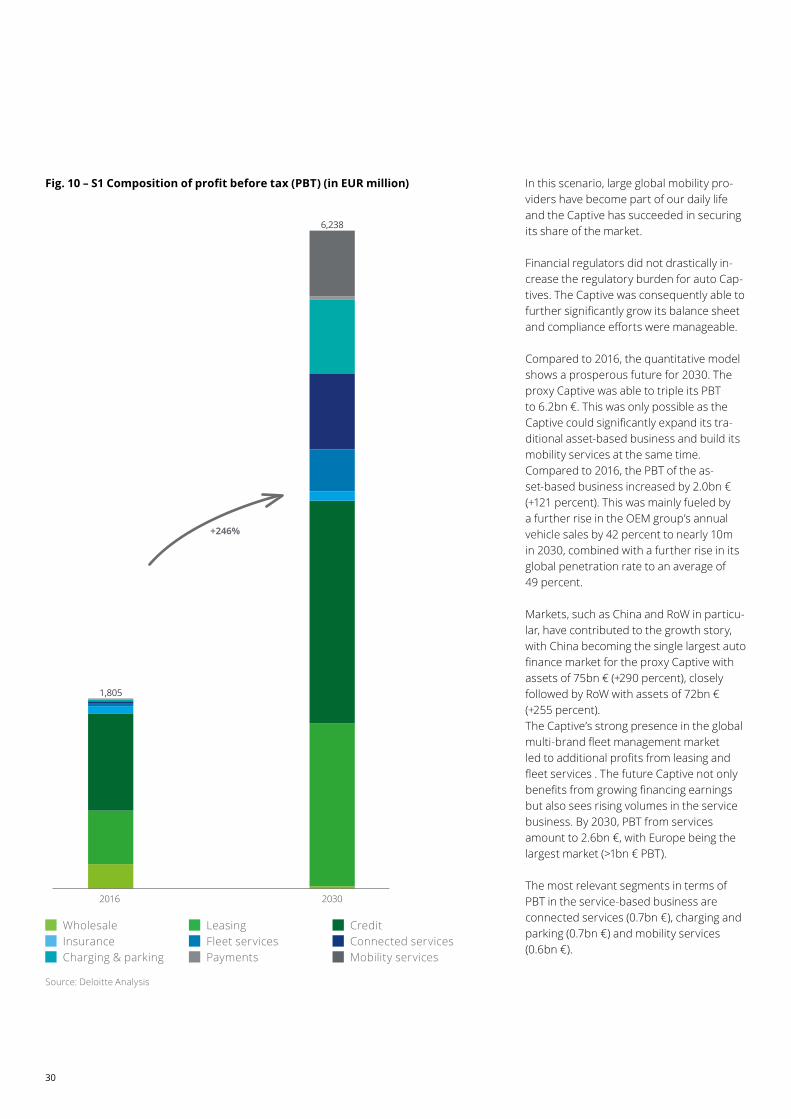
Fig. 10 – S1 Composition of profit before tax (PBT) (in EUR million) In this scenario, large global mobility pro-viders have become part of our daily life and the Captive has succeeded in securing its share of the market.
Financial regulators did not drastically in-crease the regulatory burden for auto Cap-tives. The Captive was consequently able to further significantly grow its balance sheet and compliance efforts were manageable.
Compared to 2016, the quantitative model shows a prosperous future for 2030. The proxy Captive was able to triple its PBT to 6.2bn €. This was only possible as the Captive could significantly expand its tra-ditional asset-based business and build its mobility services at the same time. Compared to 2016, the PBT of the as-set-based business increased by 2.0bn € (+121 percent). This was mainly fueled by a further rise in the OEM group’s annual vehicle sales by 42 percent to nearly 10m in 2030, combined with a further rise in its global penetration rate to an average of 49 percent.
Markets, such as China and RoW in particu-lar, have contributed to the growth story, with China becoming the single largest auto finance market for the proxy Captive with assets of 75bn € (+290 percent), closely followed by RoW with assets of 72bn € (+255 percent). The Captive’s strong presence in the global multi-brand fleet management market led to additional profits from leasing and fleet services . The future Captive not only benefits from growing financing earnings but also sees rising volumes in the service business. By 2030, PBT from services amount to 2.6bn €, with Europe being the largest market (>1bn € PBT).
The most relevant segments in terms of PBT in the service-based business are connected services (0.7bn €), charging and parking (0.7bn €) and mobility services (0.6bn €).
1,805
6,238
2016 2030
+246%
Source: Deloitte Analysis
Wholesale Leasing Credit Insurance Fleet services Connected services Charging & parking Payments Mobility services
31
Future of Captives | What will be the core businesses for Automotive Captives in 2030?
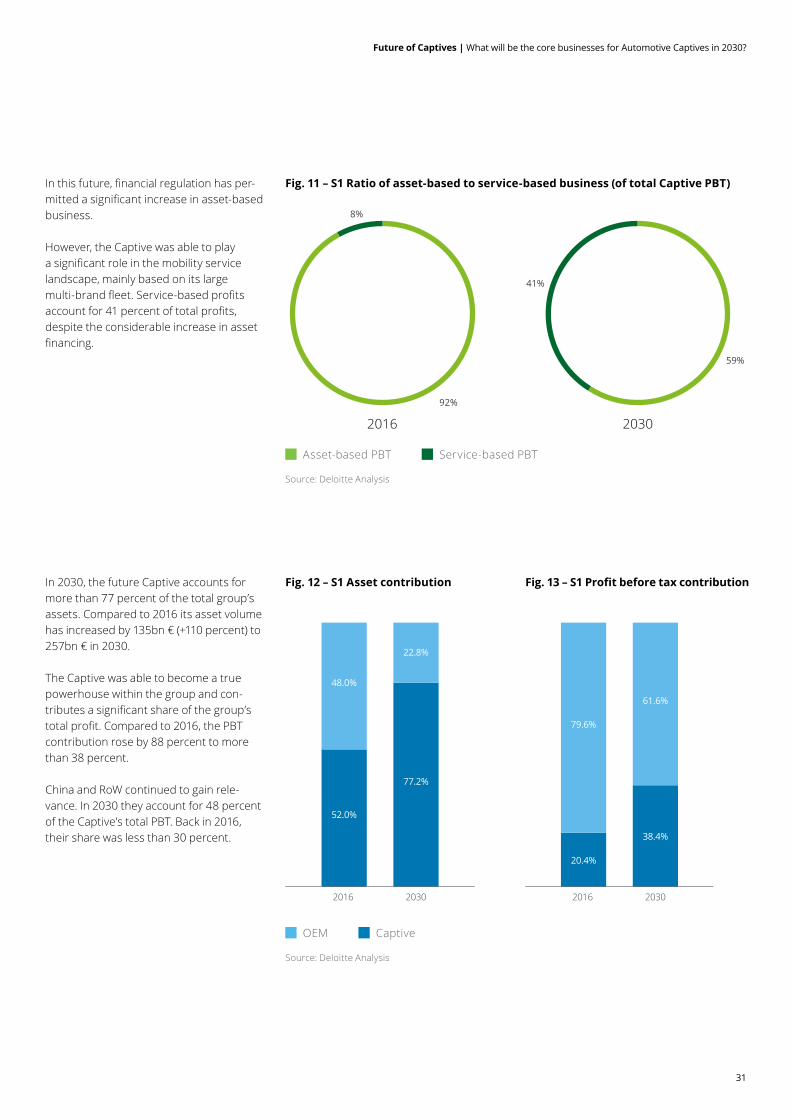
Fig. 11 – S1 Ratio of asset-based to service-based business (of total Captive PBT)
Fig. 12 – S1 Asset contribution Fig. 13 – S1 Profit before tax contributionIn 2030, the future Captive accounts for more than 77 percent of the total group’s assets. Compared to 2016 its asset volume has increased by 135bn € (+110 percent) to 257bn € in 2030.
The Captive was able to become a true powerhouse within the group and con-tributes a significant share of the group’s total profit. Compared to 2016, the PBT contribution rose by 88 percent to more than 38 percent.
China and RoW continued to gain rele-vance. In 2030 they account for 48 percent of the Captive’s total PBT. Back in 2016, their share was less than 30 percent.
In this future, financial regulation has per-mitted a significant increase in asset-based business.
However, the Captive was able to play a significant role in the mobility service landscape, mainly based on its large multi-brand fleet. Service-based profits account for 41 percent of total profits, despite the considerable increase in asset financing.
59%
41%
92%
8%
2016 2030
40%
10%
2016 2030
20%
30%
11%
Nennungen [N (Erfolgreich) =144]; (Weniger erfolgreich) = 68]
0%
0,7
52.0%
48.0%
22.8%
77.2%
40%
10%
20%
30%
11%
Nennungen [N (Erfolgreich) =144]; (Weniger erfolgreich) = 68]
0%
0,7
2016 2030
20.4%
79.6%
61.6%
38.4%
Source: Deloitte Analysis
Source: Deloitte Analysis
Asset-based PBT Service-based PBT
OEM Captive
32
Fig. 15 – S1 Development of operating ratio (asset-based business)
Fig. 14 – S1 Development of required workforce
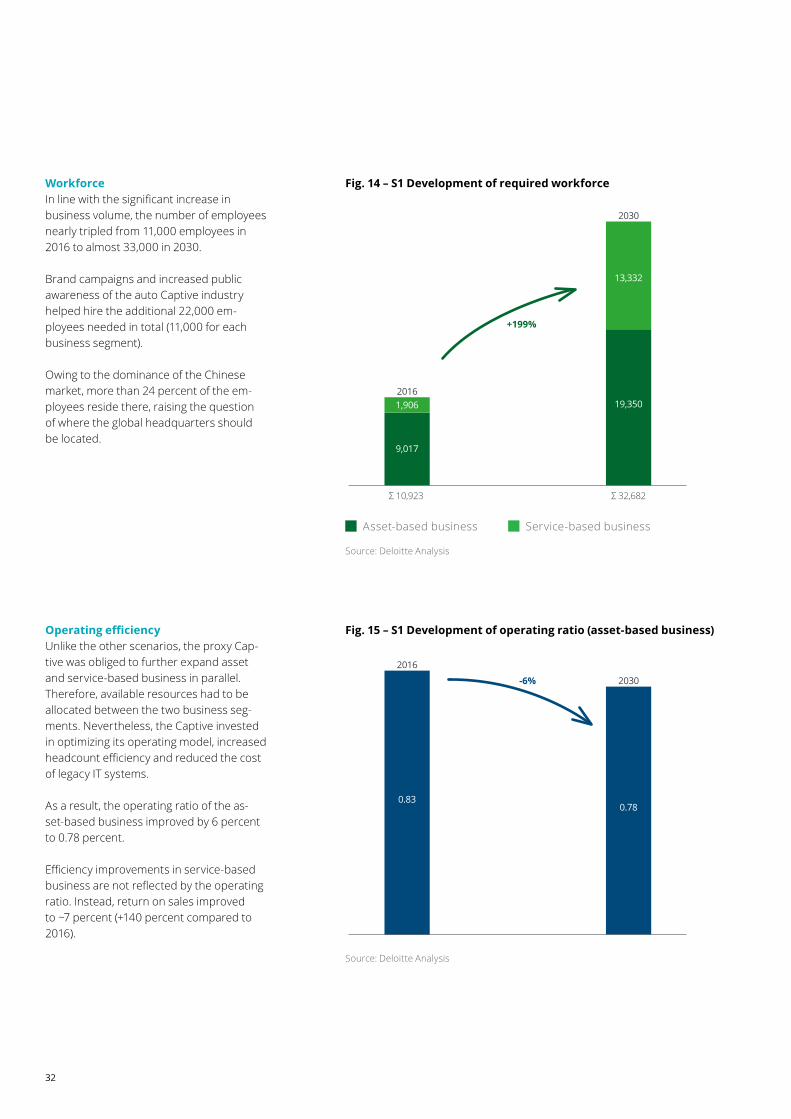
Operating efficiencyUnlike the other scenarios, the proxy Cap-tive was obliged to further expand asset and service-based business in parallel. Therefore, available resources had to be allocated between the two business seg-ments. Nevertheless, the Captive invested in optimizing its operating model, increased headcount efficiency and reduced the cost of legacy IT systems.
As a result, the operating ratio of the as-set-based business improved by 6 percent to 0.78 percent.
Efficiency improvements in service-based business are not reflected by the operating ratio. Instead, return on sales improved to ~7 percent (+140 percent compared to 2016).
WorkforceIn line with the significant increase in business volume, the number of employees nearly tripled from 11,000 employees in 2016 to almost 33,000 in 2030.
Brand campaigns and increased public awareness of the auto Captive industry helped hire the additional 22,000 em-ployees needed in total (11,000 for each business segment).
Owing to the dominance of the Chinese market, more than 24 percent of the em-ployees reside there, raising the question of where the global headquarters should be located.
2016
2030
Σ 10,923 Σ 32,682
9,017
1,906
13,332
19,350
+199%
2016
2030
0.830.78
-6%
Source: Deloitte Analysis
Source: Deloitte Analysis
Asset-based business Service-based business
33
Future of Captives | What will be the core businesses for Automotive Captives in 2030?
Fig. 16 – S1 Development of global penetration rates
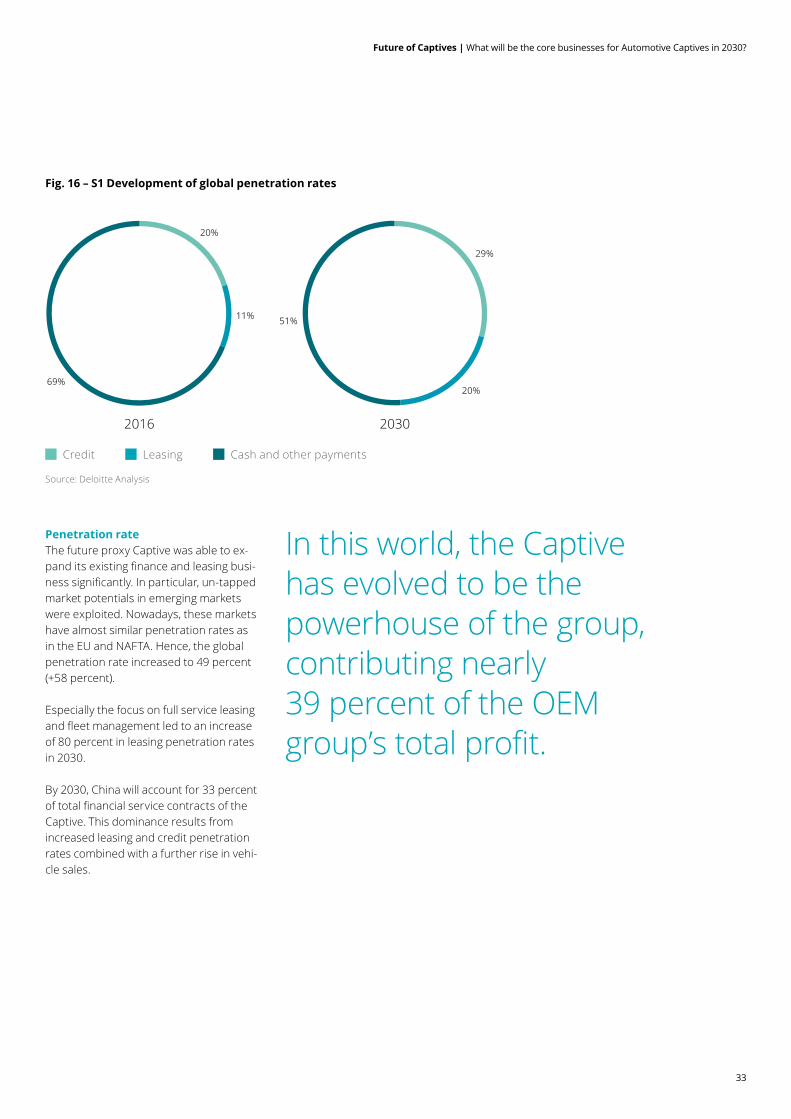
Penetration rateThe future proxy Captive was able to ex-pand its existing finance and leasing busi-ness significantly. In particular, un-tapped market potentials in emerging markets were exploited. Nowadays, these markets have almost similar penetration rates as in the EU and NAFTA. Hence, the global penetration rate increased to 49 percent (+58 percent).
Especially the focus on full service leasing and fleet management led to an increase of 80 percent in leasing penetration rates in 2030.
By 2030, China will account for 33 percent of total financial service contracts of the Captive. This dominance results from increased leasing and credit penetration rates combined with a further rise in vehi-cle sales.
In this world, the Captive has evolved to be the powerhouse of the group, contributing nearly 39 percent of the OEM group’s total profit.
29%
20%
51%
20%
11%
69%
2016 2030
Source: Deloitte Analysis
Credit Leasing Cash and other payments
Scenario 2 – Mobility platform orchestratorsCaptives in 2030 have become true digital and service champions, orchestrating various mobility services for their customers.
34
35
Future of Captives | What will be the core businesses for Automotive Captives in 2030?
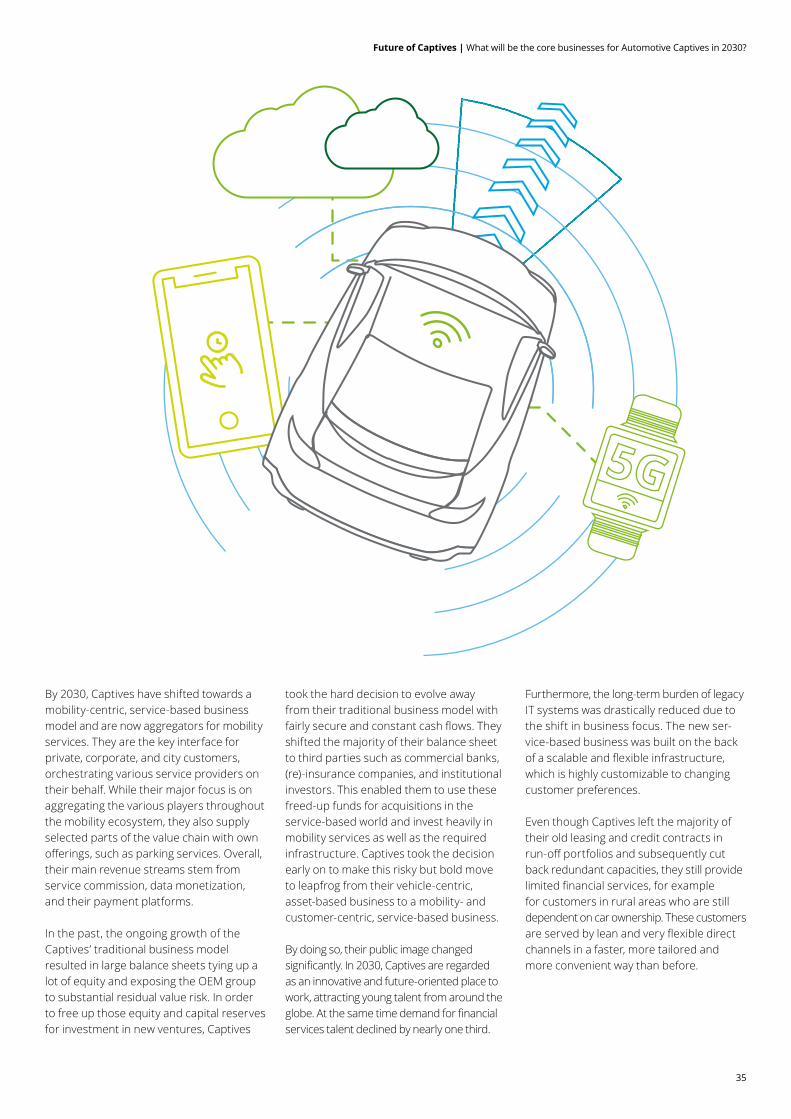
By 2030, Captives have shifted towards a mobility-centric, service-based business model and are now aggregators for mobility services. They are the key interface for private, corporate, and city customers, orchestrating various service providers on their behalf. While their major focus is on aggregating the various players throughout the mobility ecosystem, they also supply selected parts of the value chain with own offerings, such as parking services. Overall, their main revenue streams stem from service commission, data monetization, and their payment platforms.
In the past, the ongoing growth of the Captives’ traditional business model resulted in large balance sheets tying up a lot of equity and exposing the OEM group to substantial residual value risk. In order to free up those equity and capital reserves for investment in new ventures, Captives
took the hard decision to evolve away from their traditional business model with fairly secure and constant cash flows. They shifted the majority of their balance sheet to third parties such as commercial banks, (re)-insurance companies, and institutional investors. This enabled them to use these freed-up funds for acquisitions in the service-based world and invest heavily in mobility services as well as the required infrastructure. Captives took the decision early on to make this risky but bold move to leapfrog from their vehicle-centric, asset-based business to a mobility- and customer-centric, service-based business.
By doing so, their public image changed significantly. In 2030, Captives are regarded as an innovative and future-oriented place to work, attracting young talent from around the globe. At the same time demand for financial services talent declined by nearly one third.
Furthermore, the long-term burden of legacy IT systems was drastically reduced due to the shift in business focus. The new ser-vice-based business was built on the back of a scalable and flexible infrastructure, which is highly customizable to changing customer preferences.
Even though Captives left the majority of their old leasing and credit contracts in run-off portfolios and subsequently cut back redundant capacities, they still provide limited financial services, for example for customers in rural areas who are still dependent on car ownership. These customers are served by lean and very flexible direct channels in a faster, more tailored and more convenient way than before.
5G
36
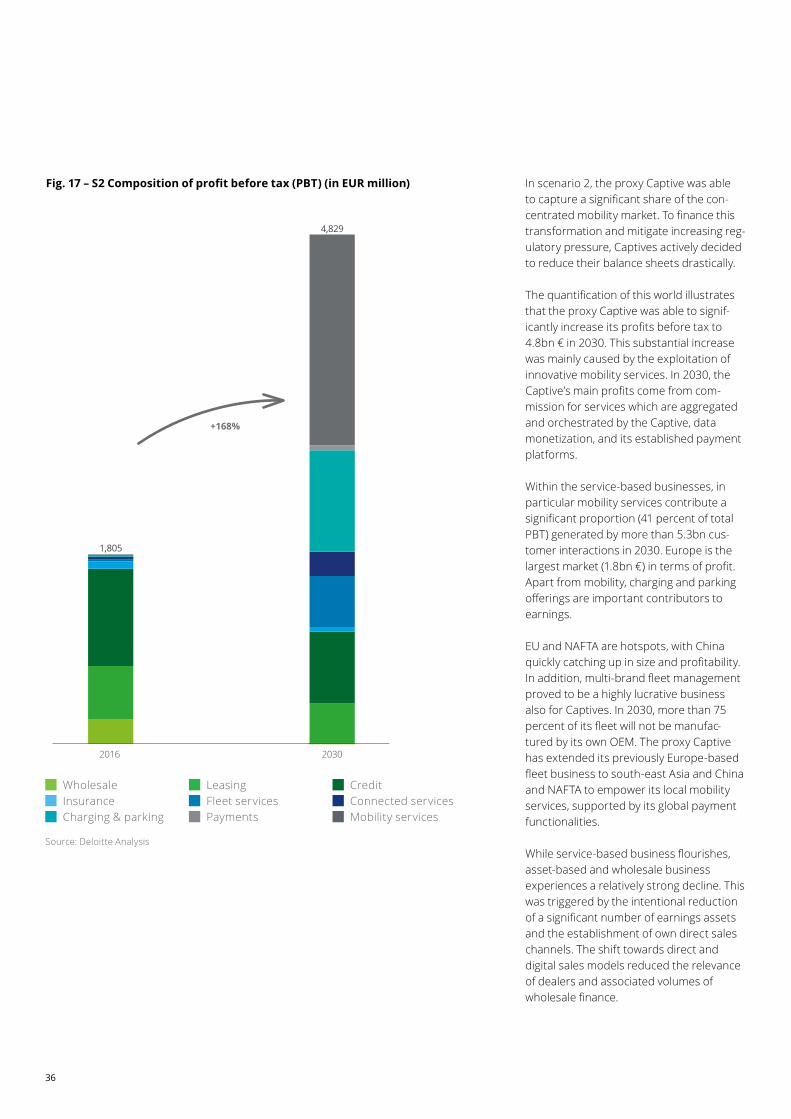
Fig. 17 – S2 Composition of profit before tax (PBT) (in EUR million) In scenario 2, the proxy Captive was able to capture a significant share of the con-centrated mobility market. To finance this transformation and mitigate increasing reg-ulatory pressure, Captives actively decided to reduce their balance sheets drastically.
The quantification of this world illustrates that the proxy Captive was able to signif-icantly increase its profits before tax to 4.8bn € in 2030. This substantial increase was mainly caused by the exploitation of innovative mobility services. In 2030, the Captive’s main profits come from com-mission for services which are aggregated and orchestrated by the Captive, data monetization, and its established payment platforms.
Within the service-based businesses, in particular mobility services contribute a significant proportion (41 percent of total PBT) generated by more than 5.3bn cus-tomer interactions in 2030. Europe is the largest market (1.8bn €) in terms of profit. Apart from mobility, charging and parking offerings are important contributors to earnings.
EU and NAFTA are hotspots, with China quickly catching up in size and profitability.In addition, multi-brand fleet management proved to be a highly lucrative business also for Captives. In 2030, more than 75 percent of its fleet will not be manufac-tured by its own OEM. The proxy Captive has extended its previously Europe-based fleet business to south-east Asia and China and NAFTA to empower its local mobility services, supported by its global payment functionalities.
While service-based business flourishes, asset-based and wholesale business experiences a relatively strong decline. This was triggered by the intentional reduction of a significant number of earnings assets and the establishment of own direct sales channels. The shift towards direct and digital sales models reduced the relevance of dealers and associated volumes of wholesale finance.
1,805
4,829
2016 2030
+168%
Source: Deloitte Analysis
Wholesale Leasing Credit Insurance Fleet services Connected services Charging & parking Payments Mobility services
37
Future of Captives | What will be the core businesses for Automotive Captives in 2030?
Fig. 18 – S2 Ratio of asset-based to service-based business (of total Captive PBT)
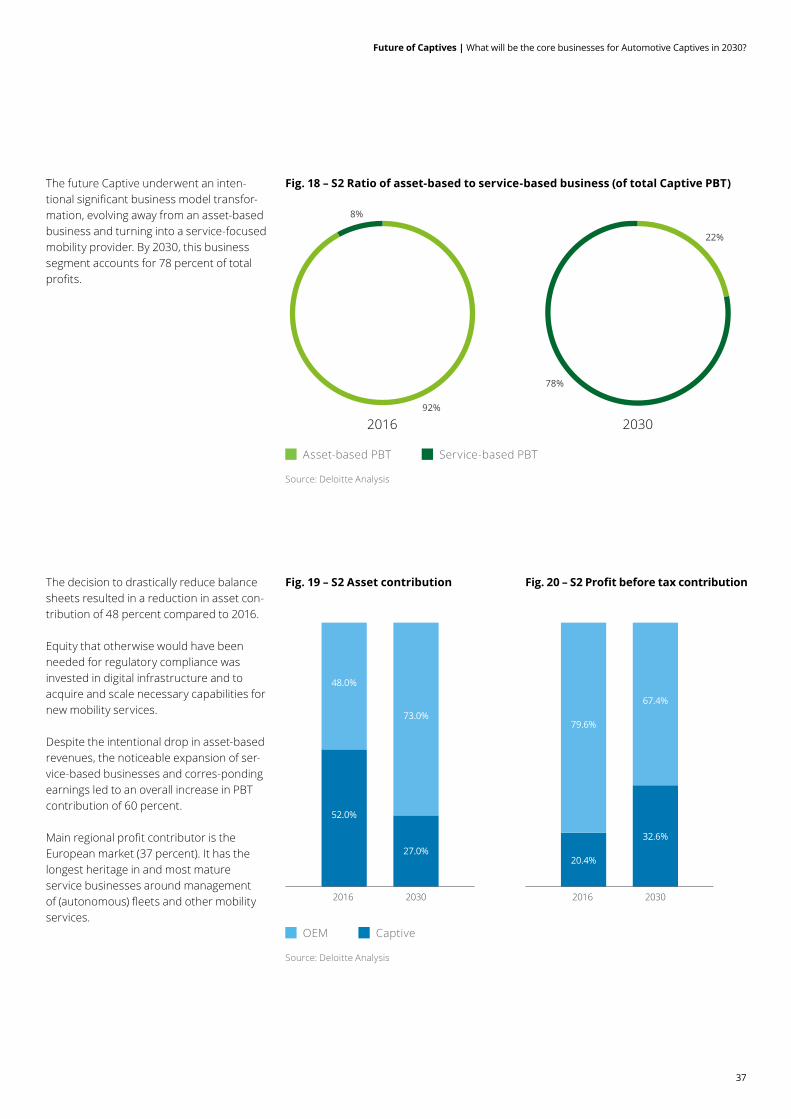
Fig. 19 – S2 Asset contribution Fig. 20 – S2 Profit before tax contributionThe decision to drastically reduce balance sheets resulted in a reduction in asset con-tribution of 48 percent compared to 2016.
Equity that otherwise would have been needed for regulatory compliance was invested in digital infrastructure and to acquire and scale necessary capabilities for new mobility services.
Despite the intentional drop in asset-based revenues, the noticeable expansion of ser-vice-based businesses and corres-ponding earnings led to an overall increase in PBT contribution of 60 percent.
Main regional profit contributor is the European market (37 percent). It has the longest heritage in and most mature service businesses around management of (autonomous) fleets and other mobility services.
The future Captive underwent an inten-tional significant business model transfor-mation, evolving away from an asset-based business and turning into a service-focused mobility provider. By 2030, this business segment accounts for 78 percent of total profits.
22%
78%
92%
8%
2016 2030
Source: Deloitte Analysis
Asset-based PBT Service-based PBT
40%
10%
2016 2030
20%
30%
11%
Nennungen [N (Erfolgreich) =144]; (Weniger erfolgreich) = 68]
0%
0,7
52.0%
48.0%
73.0%
27.0%
40%
10%
20%
30%
11%
Nennungen [N (Erfolgreich) =144]; (Weniger erfolgreich) = 68]
0%
0,7
2016 2030
20.4%
79.6%
67.4%
32.6%
Source: Deloitte Analysis
OEM Captive
38
Fig. 22 – S2 Development of operating ratio (asset-based business)
Fig. 21 – S2 Development of required workforce
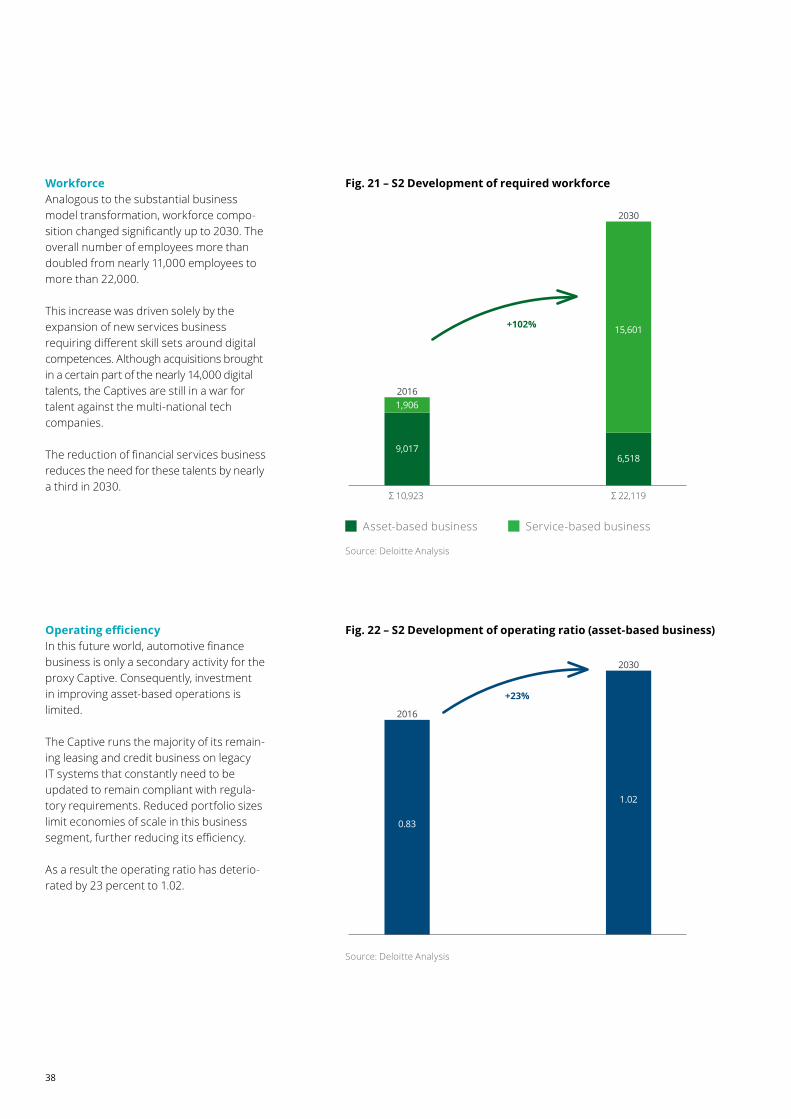
Operating efficiencyIn this future world, automotive finance business is only a secondary activity for the proxy Captive. Consequently, investment in improving asset-based operations is limited.
The Captive runs the majority of its remain-ing leasing and credit business on legacy IT systems that constantly need to be updated to remain compliant with regula-tory requirements. Reduced portfolio sizes limit economies of scale in this business segment, further reducing its efficiency.
As a result the operating ratio has deterio-rated by 23 percent to 1.02.
WorkforceAnalogous to the substantial business model transformation, workforce compo-sition changed significantly up to 2030. The overall number of employees more than doubled from nearly 11,000 employees to more than 22,000.
This increase was driven solely by the expansion of new services business requiring different skill sets around digital competences. Although acquisitions brought in a certain part of the nearly 14,000 digital talents, the Captives are still in a war for talent against the multi-national tech companies.
The reduction of financial services business reduces the need for these talents by nearly a third in 2030.
2016
2030
Σ 10,923 Σ 22,119
9,017
1,906
15,601
6,518
+102%
Source: Deloitte Analysis
Asset-based business Service-based business
2016
2030
2030
0.83
1.02
+23%
Source: Deloitte Analysis
39
Future of Captives | What will be the core businesses for Automotive Captives in 2030?
Fig. 23 – S2 Development of global penetration rates
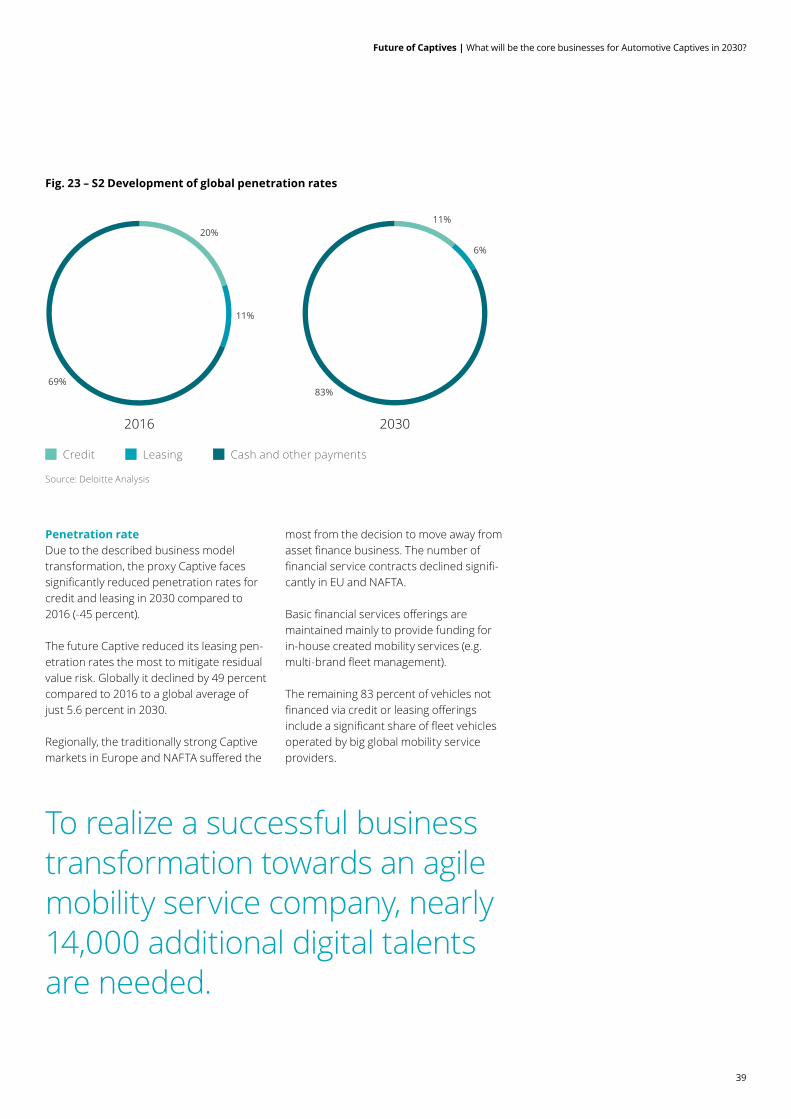
Penetration rateDue to the described business model transformation, the proxy Captive faces significantly reduced penetration rates for credit and leasing in 2030 compared to 2016 (-45 percent).
The future Captive reduced its leasing pen-etration rates the most to mitigate residual value risk. Globally it declined by 49 percent compared to 2016 to a global average of just 5.6 percent in 2030.
Regionally, the traditionally strong Captive markets in Europe and NAFTA suffered the
To realize a successful business transformation towards an agile mobility service company, nearly 14,000 additional digital talents are needed.
11%
6%
83%
20%
11%
69%
2016 2030
Source: Deloitte Analysis
Credit Leasing Cash and other payments
most from the decision to move away from asset finance business. The number of financial service contracts declined signifi-cantly in EU and NAFTA.
Basic financial services offerings are maintained mainly to provide funding for in-house created mobility services (e.g. multi-brand fleet management).
The remaining 83 percent of vehicles not financed via credit or leasing offerings include a significant share of fleet vehicles operated by big global mobility service providers.
Scenario 3 – Empty shellCaptives in 2030 have become extremely efficient service providers, despite having lost most of their direct end-customer touchpoints.
40
41
Future of Captives | What will be the core businesses for Automotive Captives in 2030?
By 2030, Captives act as mere service providers, offering a one-stop solution, aggregating products and services for both their own OEM and external mobility providers. They have managed to build and maintain infrastructure and capabilities that enable them to excel in identifying and orchestrating best-in-class providers for every step of the value chain. Their operations had to become extremely lean and agile thereby. In the past, global regulators made automotive finance the focus of their attention and significantly tightened the relevant regulations and corresponding capital requirements. In 2016, the Captive’s assets made up to 50 percent of the group’s balance sheet. But those times are long gone. OEMs were alerted by the
increasing risk their Captive posed for their own business continuity, mainly fueled by two trends. Firstly, residual value forecasts became increasingly imprecise due to rising uncertainty as well as complexity in the automotive manufacturing world. Secondly, tighter regulatory requirements led to higher capital requirements and increasing operating costs. Hence it became too costly to keep old operating models and IT legacy systems compliant with ever-growing regu-latory burdens. As a result, OEMs decided to reduce the size of Captives’ balance sheets. However, the freed-up capital reserves were not re-invested in the Captives’ business but were used by the OEMs themselves for the development and production of new pow-ertrains and vehicles as well as their global manufacturing transformation.
Furthermore, the fragmented mobility landscape with highly diverse requirements regarding vehicles and related fleet services led to various specialized mobility providers. Most of these providers do not have the scale to maintain an own deep, horizontal value chain and therefore outsourced most of the processes. Consequently, Captives focus on the aggregation of mobility solu-tions, apart from other core competencies such as making fast and precise credit decisions. However, automotive Captives in this world have lost their direct contact with the end-customer as traditional sales channels (through the dealer network) no longer exist and Captives have not been able to establish direct alternatives.
41
42
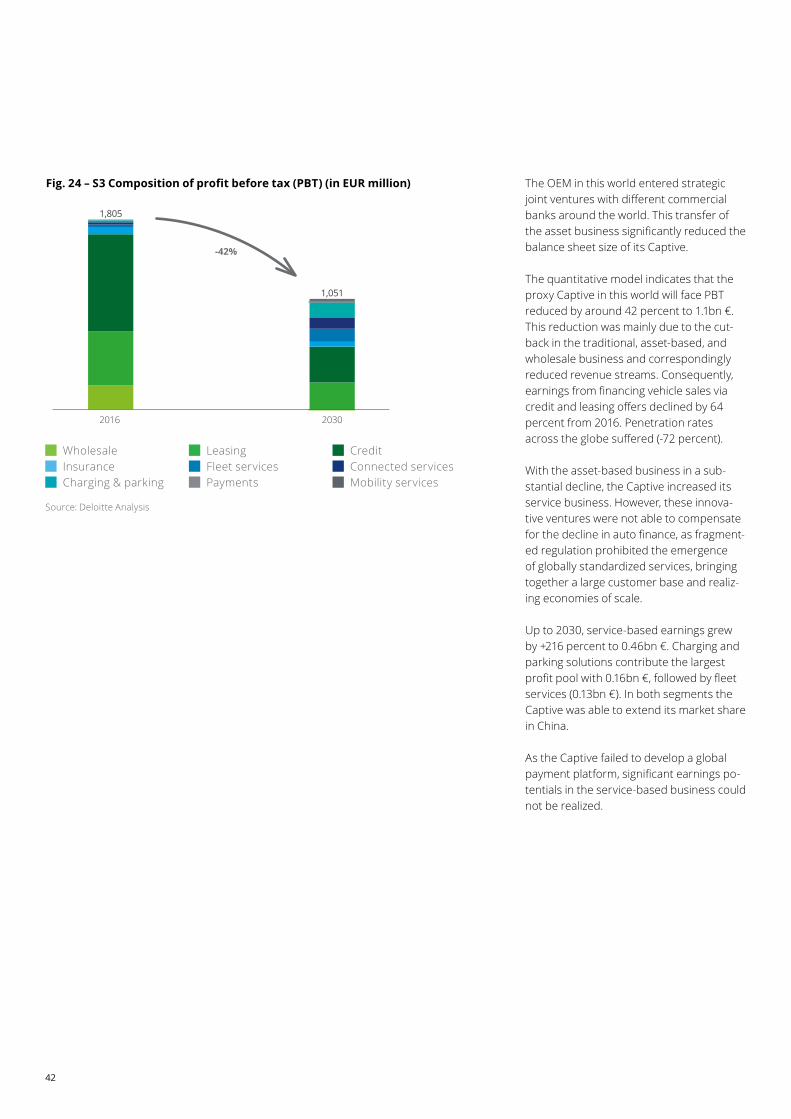
Fig. 24 – S3 Composition of profit before tax (PBT) (in EUR million) The OEM in this world entered strategic joint ventures with different commercial banks around the world. This transfer of the asset business significantly reduced the balance sheet size of its Captive.
The quantitative model indicates that the proxy Captive in this world will face PBT reduced by around 42 percent to 1.1bn €.This reduction was mainly due to the cut-back in the traditional, asset-based, and wholesale business and correspondingly reduced revenue streams. Consequently, earnings from financing vehicle sales via credit and leasing offers declined by 64 percent from 2016. Penetration rates across the globe suffered (-72 percent).
With the asset-based business in a sub-stantial decline, the Captive increased its service business. However, these innova-tive ventures were not able to compensate for the decline in auto finance, as fragment-ed regulation prohibited the emergence of globally standardized services, bringing together a large customer base and realiz-ing economies of scale.
Up to 2030, service-based earnings grew by +216 percent to 0.46bn €. Charging and parking solutions contribute the largest profit pool with 0.16bn €, followed by fleet services (0.13bn €). In both segments the Captive was able to extend its market share in China.
As the Captive failed to develop a global payment platform, significant earnings po-tentials in the service-based business could not be realized.
1,805
1,051
2016 2030
-42%
Source: Deloitte Analysis
Wholesale Leasing Credit Insurance Fleet services Connected services Charging & parking Payments Mobility services
43
Future of Captives | What will be the core businesses for Automotive Captives in 2030?
Fig. 25 – S3 Ratio of asset-based to service-based business (of total Captive PBT)
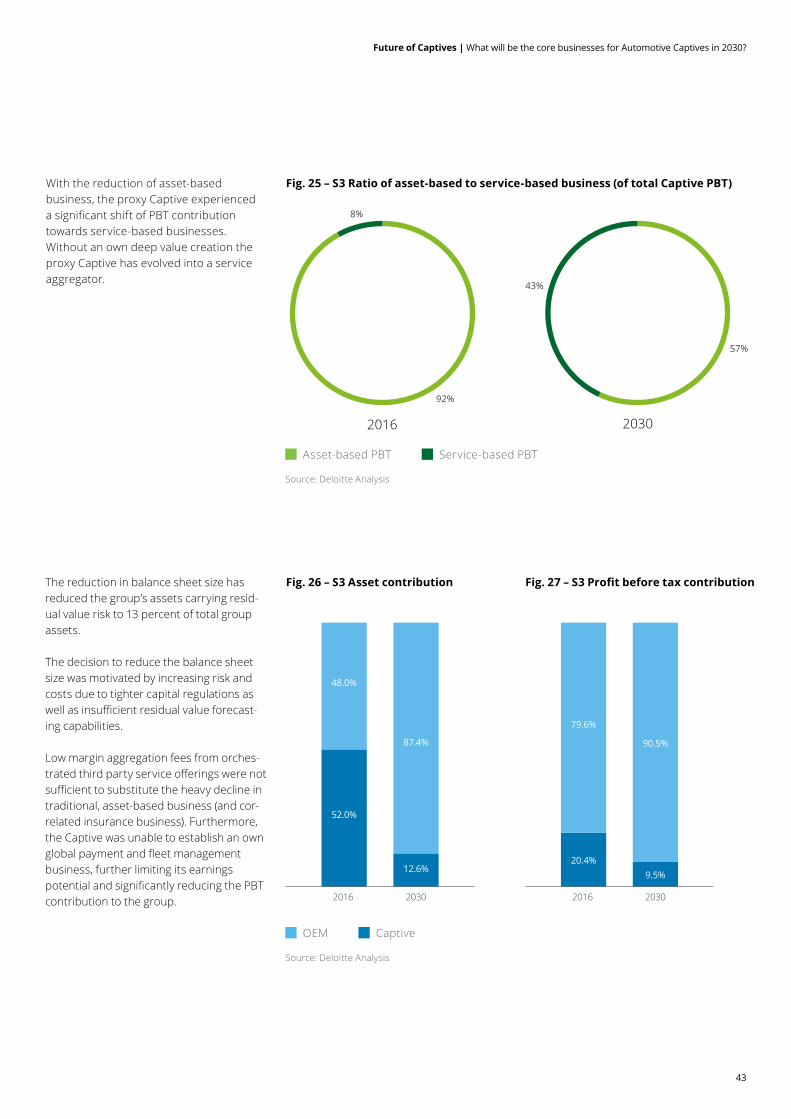
Fig. 26 – S3 Asset contribution Fig. 27 – S3 Profit before tax contributionThe reduction in balance sheet size has reduced the group’s assets carrying resid-ual value risk to 13 percent of total group assets.
The decision to reduce the balance sheet size was motivated by increasing risk and costs due to tighter capital regulations as well as insufficient residual value forecast-ing capabilities.
Low margin aggregation fees from orches-trated third party service offerings were not sufficient to substitute the heavy decline in traditional, asset-based business (and cor-related insurance business). Furthermore, the Captive was unable to establish an own global payment and fleet management business, further limiting its earnings potential and significantly reducing the PBT contribution to the group.
With the reduction of asset-based business, the proxy Captive experienced a significant shift of PBT contribution towards service-based businesses. Without an own deep value creation the proxy Captive has evolved into a service aggregator.
57%
43%
92%
8%
2016 2030
Source: Deloitte Analysis
Asset-based PBT Service-based PBT
40%
10%
2016 2030
20%
30%
11%
Nennungen [N (Erfolgreich) =144]; (Weniger erfolgreich) = 68]
0%
0,7
52.0%
48.0%
87.4%
12.6%
40%
10%
20%
30%
11%
Nennungen [N (Erfolgreich) =144]; (Weniger erfolgreich) = 68]
0%
0,7
2016 2030
20.4%
79.6%
90.5%
9.5%
Source: Deloitte Analysis
OEM Captive
44
Fig. 29 – S3 Development of operating ratio (asset-based business)
Fig. 28 – S3 Development of workforce required
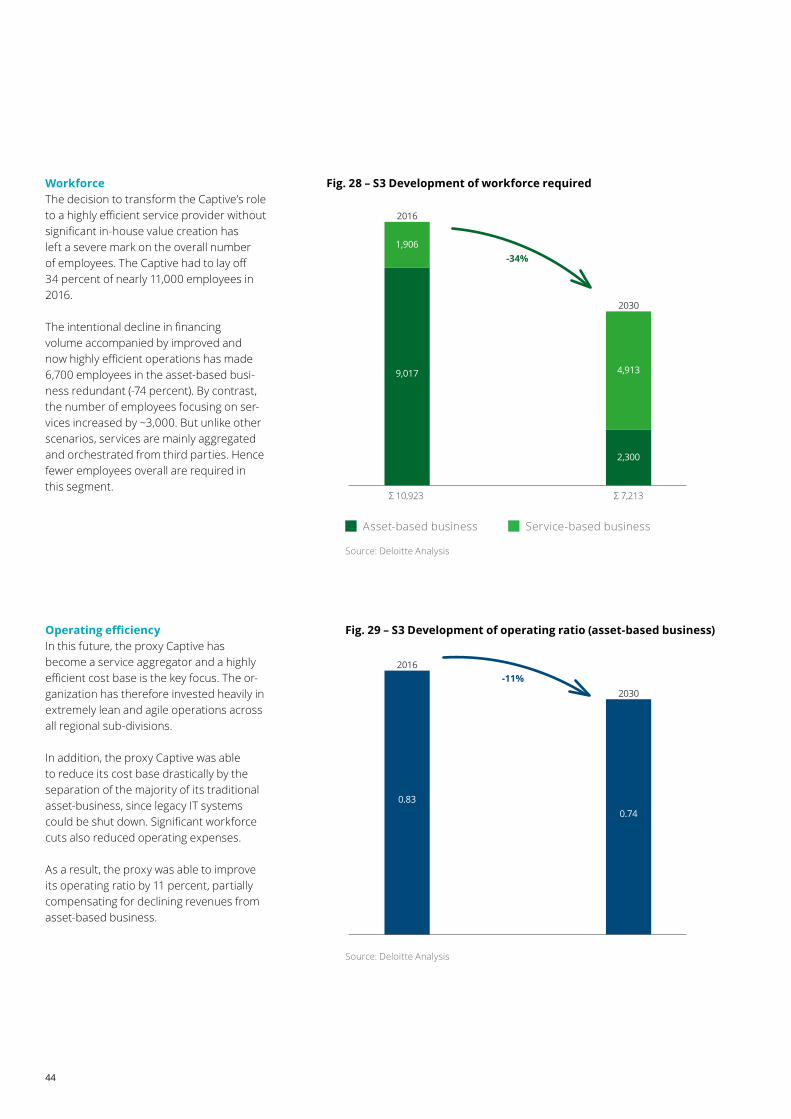
Operating efficiencyIn this future, the proxy Captive has become a service aggregator and a highly efficient cost base is the key focus. The or-ganization has therefore invested heavily in extremely lean and agile operations across all regional sub-divisions.
In addition, the proxy Captive was able to reduce its cost base drastically by the separation of the majority of its traditional asset-business, since legacy IT systems could be shut down. Significant workforce cuts also reduced operating expenses.
As a result, the proxy was able to improve its operating ratio by 11 percent, partially compensating for declining revenues from asset-based business.
WorkforceThe decision to transform the Captive’s role to a highly efficient service provider without significant in-house value creation has left a severe mark on the overall number of employees. The Captive had to lay off 34 percent of nearly 11,000 employees in 2016.
The intentional decline in financing volume accompanied by improved and now highly efficient operations has made 6,700 employees in the asset-based busi-ness redundant (-74 percent). By contrast, the number of employees focusing on ser-vices increased by ~3,000. But unlike other scenarios, services are mainly aggregated and orchestrated from third parties. Hence fewer employees overall are required in this segment.
2016
2030
Σ 10,923 Σ 7,213
9,017
1,906
4,913
2,300
-34%
Source: Deloitte Analysis
Asset-based business Service-based business
2016
2030
0.830.74
-11%
Source: Deloitte Analysis
45
Future of Captives | What will be the core businesses for Automotive Captives in 2030?
Fig. 30 – S3 Development of global penetration rates
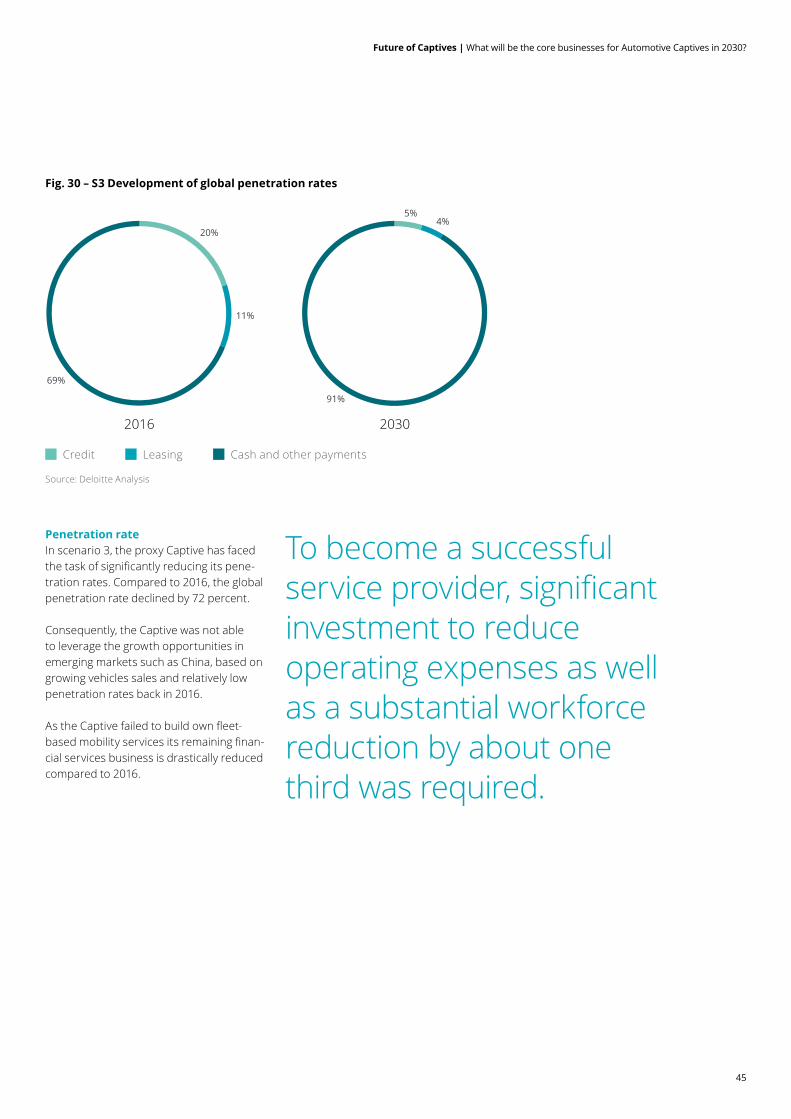
Penetration rateIn scenario 3, the proxy Captive has faced the task of significantly reducing its pene-tration rates. Compared to 2016, the global penetration rate declined by 72 percent.
Consequently, the Captive was not able to leverage the growth opportunities in emerging markets such as China, based on growing vehicles sales and relatively low penetration rates back in 2016.
As the Captive failed to build own fleet-based mobility services its remaining finan-cial services business is drastically reduced compared to 2016.
To become a successful service provider, significant investment to reduce operating expenses as well as a substantial workforce reduction by about one third was required.
5%4%
91%
20%
11%
69%
2016 2030
Source: Deloitte Analysis
Credit Leasing Cash and other payments
Scenario 4 – Incremental evolutionCaptives follow an incrementally improved market approach around asset finance offerings, as global mobility services have remained highly heterogeneous.
46
47
Future of Captives | What will be the core businesses for Automotive Captives in 2030?
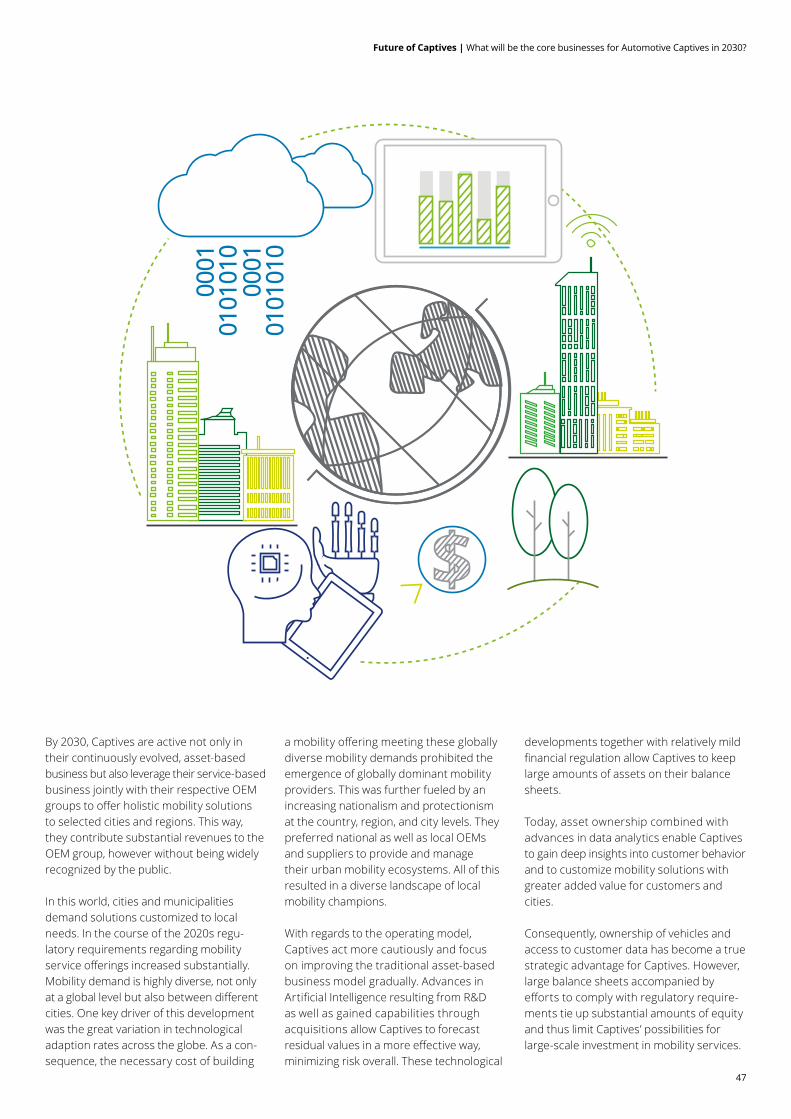
By 2030, Captives are active not only in their continuously evolved, asset-based business but also leverage their service-based business jointly with their respective OEM groups to offer holistic mobility solutions to selected cities and regions. This way, they contribute substantial revenues to the OEM group, however without being widely recognized by the public. In this world, cities and municipalities demand solutions customized to local needs. In the course of the 2020s regu-latory requirements regarding mobility service offerings increased substantially. Mobility demand is highly diverse, not only at a global level but also between different cities. One key driver of this development was the great variation in technological adaption rates across the globe. As a con-sequence, the necessary cost of building
a mobility offering meeting these globally diverse mobility demands prohibited the emergence of globally dominant mobility providers. This was further fueled by an increasing nationalism and protectionism at the country, region, and city levels. They preferred national as well as local OEMs and suppliers to provide and manage their urban mobility ecosystems. All of this resulted in a diverse landscape of local mobility champions.
With regards to the operating model, Captives act more cautiously and focus on improving the traditional asset-based business model gradually. Advances in Artificial Intelligence resulting from R&D as well as gained capabilities through acquisitions allow Captives to forecast residual values in a more effective way, minimizing risk overall. These technological
developments together with relatively mild financial regulation allow Captives to keep large amounts of assets on their balance sheets.
Today, asset ownership combined with advances in data analytics enable Captives to gain deep insights into customer behavior and to customize mobility solutions with greater added value for customers and cities. Consequently, ownership of vehicles and access to customer data has become a true strategic advantage for Captives. However, large balance sheets accompanied by efforts to comply with regulatory require-ments tie up substantial amounts of equity and thus limit Captives’ possibilities for large-scale investment in mobility services.
48
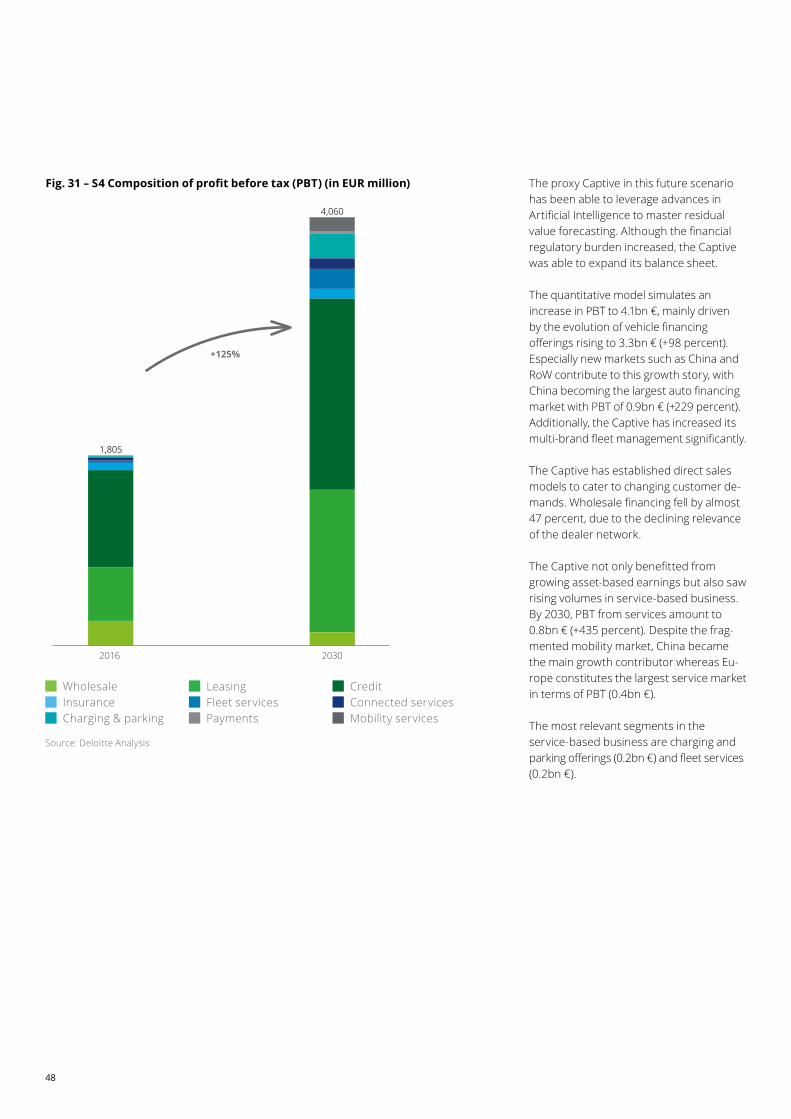
Fig. 31 – S4 Composition of profit before tax (PBT) (in EUR million) The proxy Captive in this future scenario has been able to leverage advances in Artificial Intelligence to master residual value forecasting. Although the financial regulatory burden increased, the Captive was able to expand its balance sheet.
The quantitative model simulates an increase in PBT to 4.1bn €, mainly driven by the evolution of vehicle financing offerings rising to 3.3bn € (+98 percent). Especially new markets such as China and RoW contribute to this growth story, with China becoming the largest auto financing market with PBT of 0.9bn € (+229 percent). Additionally, the Captive has increased its multi-brand fleet management significantly.
The Captive has established direct sales models to cater to changing customer de-mands. Wholesale financing fell by almost 47 percent, due to the declining relevance of the dealer network.
The Captive not only benefitted from growing asset-based earnings but also saw rising volumes in service-based business. By 2030, PBT from services amount to 0.8bn € (+435 percent). Despite the frag-mented mobility market, China became the main growth contributor whereas Eu-rope constitutes the largest service market in terms of PBT (0.4bn €).
The most relevant segments in the service-based business are charging and parking offerings (0.2bn €) and fleet services (0.2bn €).
1,805
4,060
2016 2030
+125%
Source: Deloitte Analysis
Wholesale Leasing Credit Insurance Fleet services Connected services Charging & parking Payments Mobility services
49
Future of Captives | What will be the core businesses for Automotive Captives in 2030?
Fig. 32 – S4 Ratio of asset-based to service-based business (of total Captive PBT)
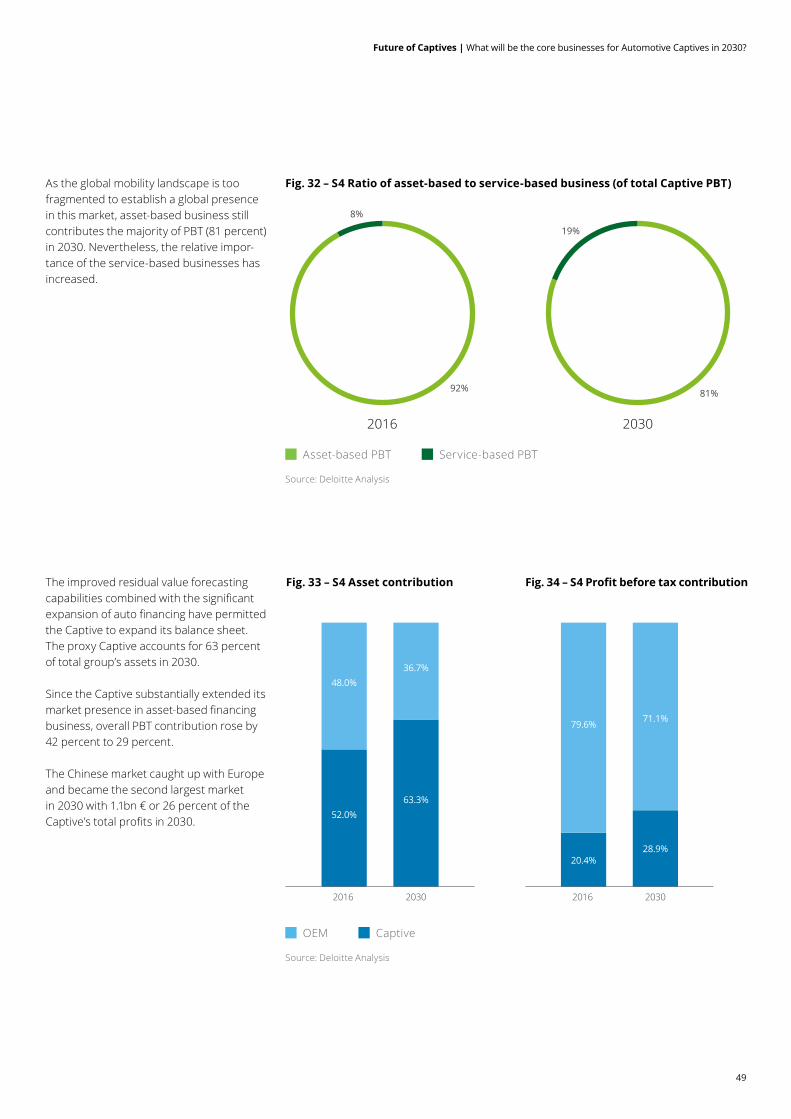
Fig. 33 – S4 Asset contribution Fig. 34 – S4 Profit before tax contributionThe improved residual value forecasting capabilities combined with the significant expansion of auto financing have permitted the Captive to expand its balance sheet. The proxy Captive accounts for 63 percent of total group’s assets in 2030.
Since the Captive substantially extended its market presence in asset-based financing business, overall PBT contribution rose by 42 percent to 29 percent.
The Chinese market caught up with Europe and became the second largest market in 2030 with 1.1bn € or 26 percent of the Captive’s total profits in 2030.
As the global mobility landscape is too fragmented to establish a global presence in this market, asset-based business still contributes the majority of PBT (81 percent) in 2030. Nevertheless, the relative impor-tance of the service-based businesses has increased.
81%
19%
92%
8%
2016 2030
Source: Deloitte Analysis
Asset-based PBT Service-based PBT
40%
10%
2016 2030
20%
30%
11%
Nennungen [N (Erfolgreich) =144]; (Weniger erfolgreich) = 68]
0%
0,7
52.0%
48.0%36.7%
63.3%
40%
10%
20%
30%
11%
Nennungen [N (Erfolgreich) =144]; (Weniger erfolgreich) = 68]
0%
0,7
2016 2030
20.4%
79.6% 71.1%
28.9%
Source: Deloitte Analysis
OEM Captive
50
Fig. 36 – S4 Development of operating ratio (asset-based business)
Fig. 35 – S4 Development of required workforce
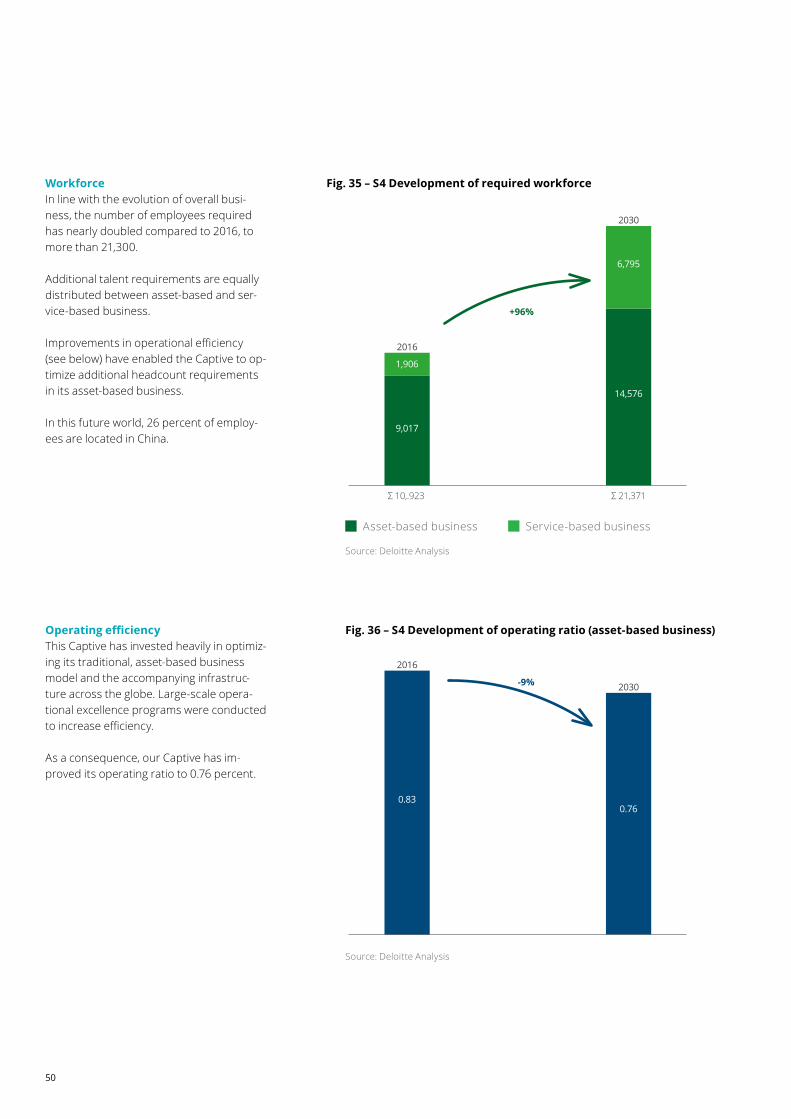
Operating efficiencyThis Captive has invested heavily in optimiz-ing its traditional, asset-based business model and the accompanying infrastruc-ture across the globe. Large-scale opera-tional excellence programs were conducted to increase efficiency.
As a consequence, our Captive has im-proved its operating ratio to 0.76 percent.
WorkforceIn line with the evolution of overall busi-ness, the number of employees required has nearly doubled compared to 2016, to more than 21,300.
Additional talent requirements are equally distributed between asset-based and ser-vice-based business.
Improvements in operational efficiency (see below) have enabled the Captive to op-timize additional headcount requirements in its asset-based business.
In this future world, 26 percent of employ-ees are located in China.
2016
2030
Σ 10,.923 Σ 21,371
9,017
1,906
6,795
14,576
+96%
Source: Deloitte Analysis
Asset-based business Service-based business
2016
2030
0.830.76
-9%
Source: Deloitte Analysis
51
Future of Captives | What will be the core businesses for Automotive Captives in 2030?
Fig. 37 – S4 Development of global penetration rates
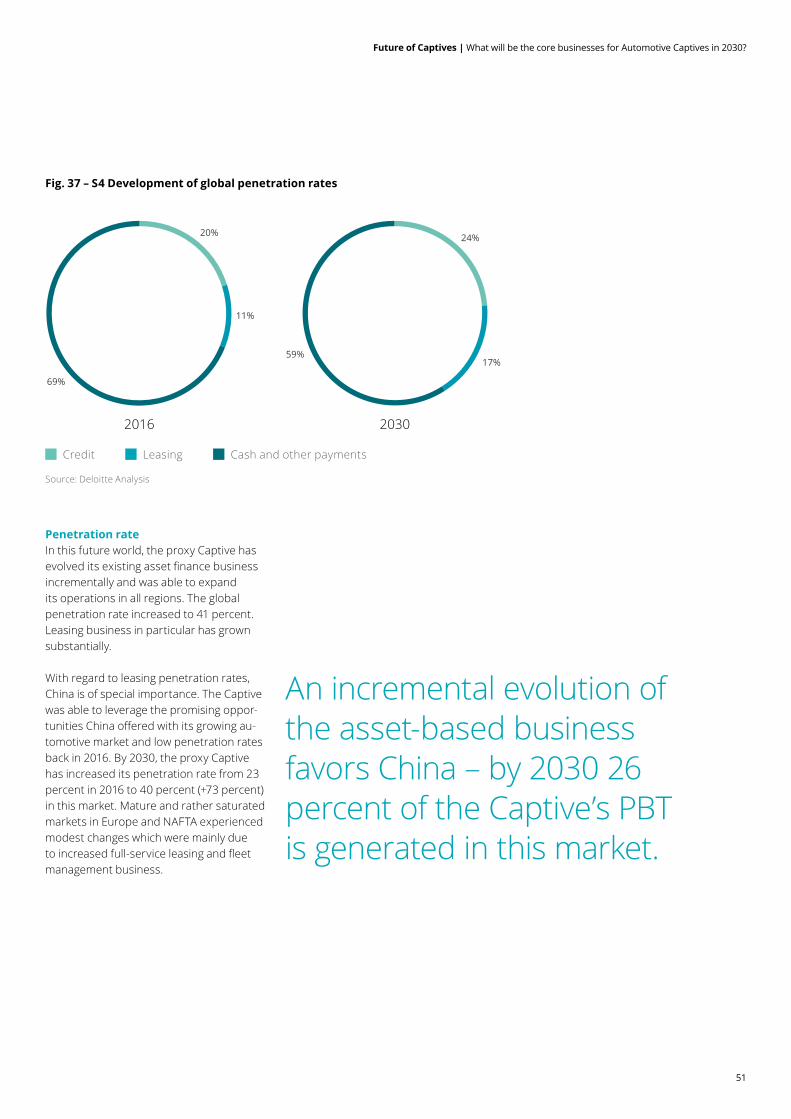
Penetration rateIn this future world, the proxy Captive has evolved its existing asset finance business incrementally and was able to expand its operations in all regions. The global penetration rate increased to 41 percent. Leasing business in particular has grown substantially.
With regard to leasing penetration rates, China is of special importance. The Captive was able to leverage the promising oppor-tunities China offered with its growing au-tomotive market and low penetration rates back in 2016. By 2030, the proxy Captive has increased its penetration rate from 23 percent in 2016 to 40 percent (+73 percent) in this market. Mature and rather saturated markets in Europe and NAFTA experienced modest changes which were mainly due to increased full-service leasing and fleet management business.
An incremental evolution of the asset-based business favors China – by 2030 26 percent of the Captive’s PBT is generated in this market.
24%
17%59%
20%
11%
69%
2016 2030
Source: Deloitte Analysis
Credit Leasing Cash and other payments
52
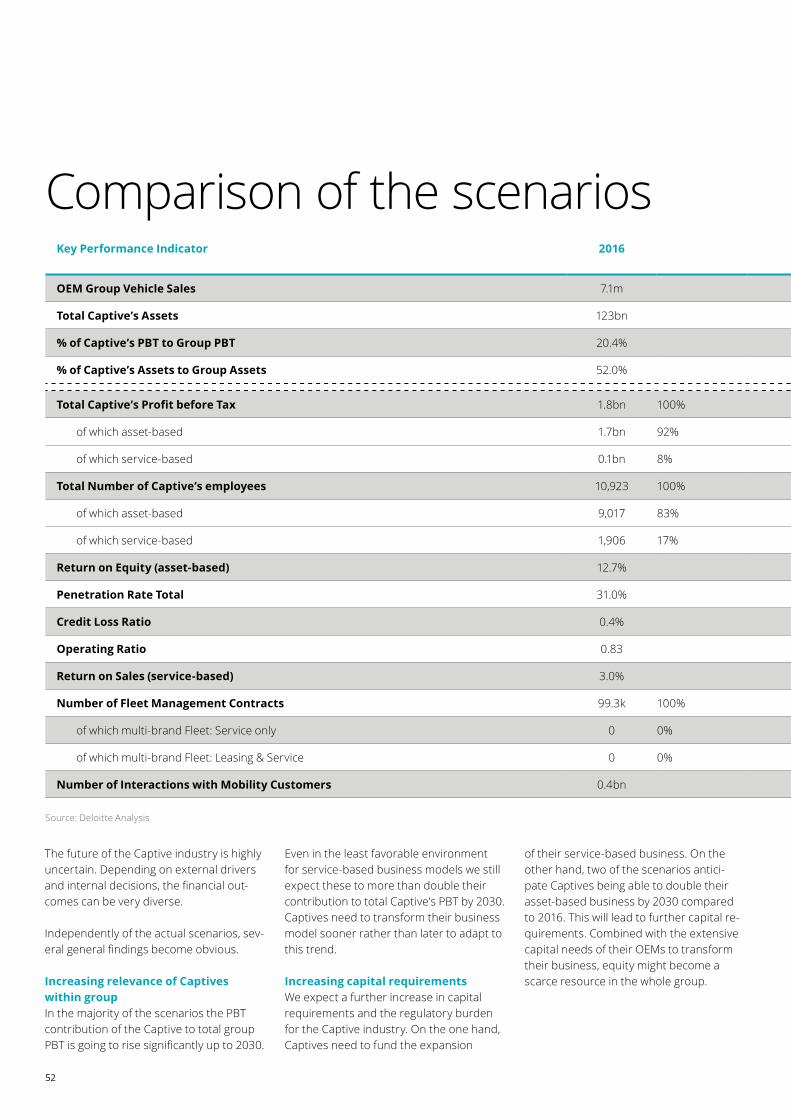
The future of the Captive industry is highly uncertain. Depending on external drivers and internal decisions, the financial out-comes can be very diverse.
Independently of the actual scenarios, sev-eral general findings become obvious.
Increasing relevance of Captives within groupIn the majority of the scenarios the PBT contribution of the Captive to total group PBT is going to rise significantly up to 2030.
Even in the least favorable environment for service-based business models we still expect these to more than double their contribution to total Captive’s PBT by 2030. Captives need to transform their business model sooner rather than later to adapt to this trend.
Increasing capital requirements We expect a further increase in capital requirements and the regulatory burden for the Captive industry. On the one hand, Captives need to fund the expansion
of their service-based business. On the other hand, two of the scenarios antici-pate Captives being able to double their asset-based business by 2030 compared to 2016. This will lead to further capital re-quirements. Combined with the extensive capital needs of their OEMs to transform their business, equity might become a scarce resource in the whole group.
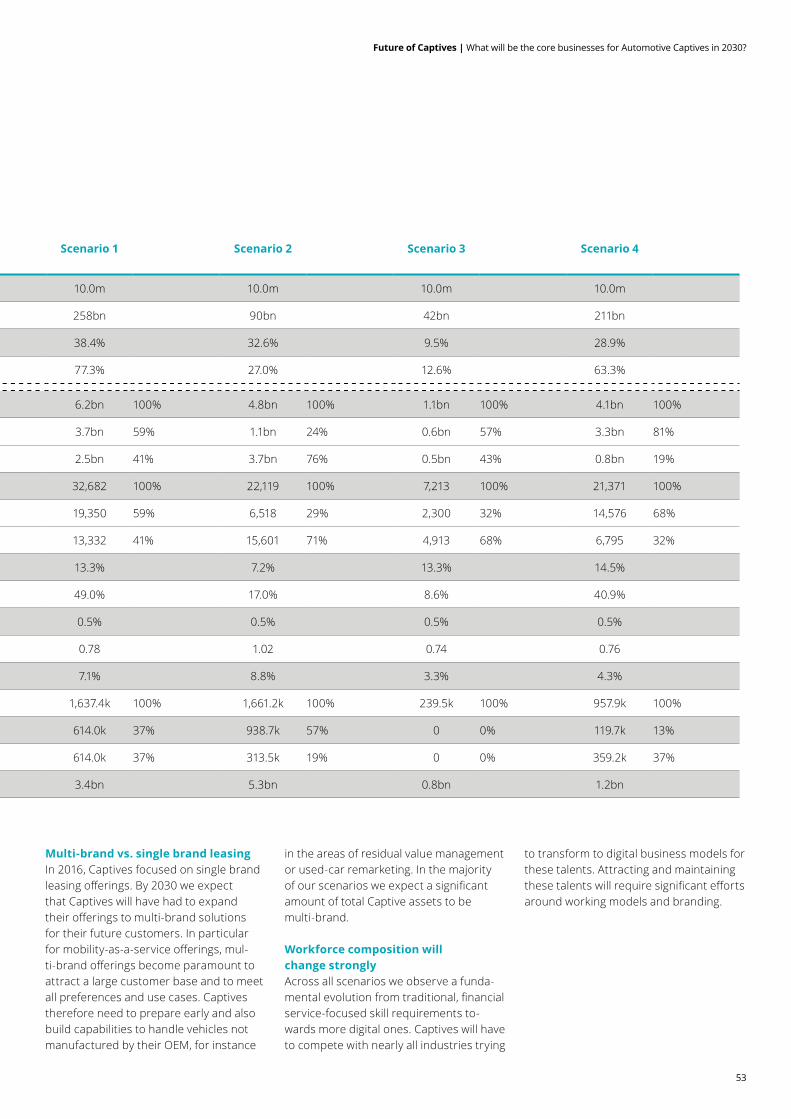
Key Performance Indicator 2016 Scenario 1 Scenario 2 Scenario 3 Scenario 4
OEM Group Vehicle Sales 7.1m 10.0m 10.0m 10.0m 10.0m
Total Captive’s Assets 123bn 258bn 90bn 42bn 211bn
% of Captive’s PBT to Group PBT 20.4% 38.4% 32.6% 9.5% 28.9%
% of Captive’s Assets to Group Assets 52.0% 77.3% 27.0% 12.6% 63.3%
Total Captive’s Profit before Tax 1.8bn 100% 6.2bn 100% 4.8bn 100% 1.1bn 100% 4.1bn 100%
of which asset-based 1.7bn 92% 3.7bn 59% 1.1bn 24% 0.6bn 57% 3.3bn 81%
of which service-based 0.1bn 8% 2.5bn 41% 3.7bn 76% 0.5bn 43% 0.8bn 19%
Total Number of Captive’s employees 10,923 100% 32,682 100% 22,119 100% 7,213 100% 21,371 100%
of which asset-based 9,017 83% 19,350 59% 6,518 29% 2,300 32% 14,576 68%
of which service-based 1,906 17% 13,332 41% 15,601 71% 4,913 68% 6,795 32%
Return on Equity (asset-based) 12.7% 13.3% 7.2% 13.3% 14.5%
Penetration Rate Total 31.0% 49.0% 17.0% 8.6% 40.9%
Credit Loss Ratio 0.4% 0.5% 0.5% 0.5% 0.5%
Operating Ratio 0.83 0.78 1.02 0.74 0.76
Return on Sales (service-based) 3.0% 7.1% 8.8% 3.3% 4.3%
Number of Fleet Management Contracts 99.3k 100% 1,637.4k 100% 1,661.2k 100% 239.5k 100% 957.9k 100%
of which multi-brand Fleet: Service only 0 0% 614.0k 37% 938.7k 57% 0 0% 119.7k 13%
of which multi-brand Fleet: Leasing & Service 0 0% 614.0k 37% 313.5k 19% 0 0% 359.2k 37%
Number of Interactions with Mobility Customers 0.4bn 3.4bn 5.3bn 0.8bn 1.2bn
Comparison of the scenarios
Source: Deloitte Analysis
53
Future of Captives | What will be the core businesses for Automotive Captives in 2030?
Multi-brand vs. single brand leasingIn 2016, Captives focused on single brand leasing offerings. By 2030 we expect that Captives will have had to expand their offerings to multi-brand solutions for their future customers. In particular for mobility-as-a-service offerings, mul-ti-brand offerings become paramount to attract a large customer base and to meet all preferences and use cases. Captives therefore need to prepare early and also build capabilities to handle vehicles not manufactured by their OEM, for instance
in the areas of residual value management or used-car remarketing. In the majority of our scenarios we expect a significant amount of total Captive assets to be multi-brand.
Workforce composition will change stronglyAcross all scenarios we observe a funda-mental evolution from traditional, financial service-focused skill requirements to-wards more digital ones. Captives will have to compete with nearly all industries trying
to transform to digital business models for these talents. Attracting and maintaining these talents will require significant efforts around working models and branding.
Key Performance Indicator 2016 Scenario 1 Scenario 2 Scenario 3 Scenario 4
OEM Group Vehicle Sales 7.1m 10.0m 10.0m 10.0m 10.0m
Total Captive’s Assets 123bn 258bn 90bn 42bn 211bn
% of Captive’s PBT to Group PBT 20.4% 38.4% 32.6% 9.5% 28.9%
% of Captive’s Assets to Group Assets 52.0% 77.3% 27.0% 12.6% 63.3%
Total Captive’s Profit before Tax 1.8bn 100% 6.2bn 100% 4.8bn 100% 1.1bn 100% 4.1bn 100%
of which asset-based 1.7bn 92% 3.7bn 59% 1.1bn 24% 0.6bn 57% 3.3bn 81%
of which service-based 0.1bn 8% 2.5bn 41% 3.7bn 76% 0.5bn 43% 0.8bn 19%
Total Number of Captive’s employees 10,923 100% 32,682 100% 22,119 100% 7,213 100% 21,371 100%
of which asset-based 9,017 83% 19,350 59% 6,518 29% 2,300 32% 14,576 68%
of which service-based 1,906 17% 13,332 41% 15,601 71% 4,913 68% 6,795 32%
Return on Equity (asset-based) 12.7% 13.3% 7.2% 13.3% 14.5%
Penetration Rate Total 31.0% 49.0% 17.0% 8.6% 40.9%
Credit Loss Ratio 0.4% 0.5% 0.5% 0.5% 0.5%
Operating Ratio 0.83 0.78 1.02 0.74 0.76
Return on Sales (service-based) 3.0% 7.1% 8.8% 3.3% 4.3%
Number of Fleet Management Contracts 99.3k 100% 1,637.4k 100% 1,661.2k 100% 239.5k 100% 957.9k 100%
of which multi-brand Fleet: Service only 0 0% 614.0k 37% 938.7k 57% 0 0% 119.7k 13%
of which multi-brand Fleet: Leasing & Service 0 0% 614.0k 37% 313.5k 19% 0 0% 359.2k 37%
Number of Interactions with Mobility Customers 0.4bn 3.4bn 5.3bn 0.8bn 1.2bn
54
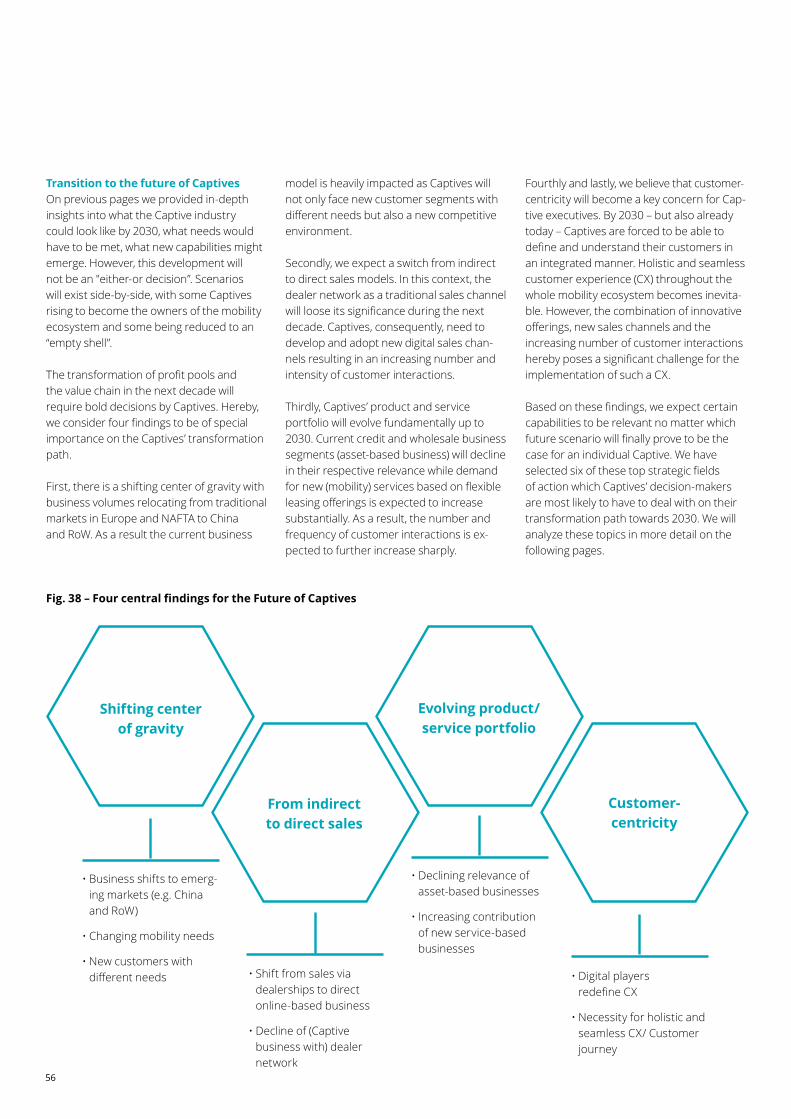
The results of the Deloitte Captive Industry Model shed light on the substantial chang-es the industry is about to face. Modeling results triggers and supports discussions about the product portfolio and market exposure of Captives. We identified six strategic fields of actions that should be assessed by Captives when considering potential transformation initiatives towards 2030.
Transformation paths towards 2030 for the Captive industry
55
Future of Captives | What will be the core businesses for Automotive Captives in 2030?
56
Transition to the future of CaptivesOn previous pages we provided in-depth insights into what the Captive industry could look like by 2030, what needs would have to be met, what new capabilities might emerge. However, this development will not be an "either-or decision”. Scenarios will exist side-by-side, with some Captives rising to become the owners of the mobility ecosystem and some being reduced to an “empty shell”.
The transformation of profit pools and the value chain in the next decade will require bold decisions by Captives. Hereby, we consider four findings to be of special importance on the Captives’ transformation path.
First, there is a shifting center of gravity with business volumes relocating from traditional markets in Europe and NAFTA to China and RoW. As a result the current business
Shifting center of gravity
From indirect to direct sales
Evolving product/ service portfolio
Customer-centricity
• Business shifts to emerg-ing markets (e.g. China and RoW)
• Changing mobility needs
• New customers with different needs
• Declining relevance of asset-based businesses
• Increasing contribution of new service-based businesses
• Shift from sales via dealerships to direct online-based business
• Decline of (Captive business with) dealer network
• Digital players redefine CX
• Necessity for holistic and seamless CX/ Customer journey
model is heavily impacted as Captives will not only face new customer segments with different needs but also a new competitive environment.
Secondly, we expect a switch from indirect to direct sales models. In this context, the dealer network as a traditional sales channel will loose its significance during the next decade. Captives, consequently, need to develop and adopt new digital sales chan-nels resulting in an increasing number and intensity of customer interactions.
Thirdly, Captives’ product and service portfolio will evolve fundamentally up to 2030. Current credit and wholesale business segments (asset-based business) will decline in their respective relevance while demand for new (mobility) services based on flexible leasing offerings is expected to increase substantially. As a result, the number and frequency of customer interactions is ex-pected to further increase sharply.
Fourthly and lastly, we believe that customer-centricity will become a key concern for Cap-tive executives. By 2030 – but also already today – Captives are forced to be able to define and understand their customers in an integrated manner. Holistic and seamless customer experience (CX) throughout the whole mobility ecosystem becomes inevita-ble. However, the combination of innovative offerings, new sales channels and the increasing number of customer interactions hereby poses a significant challenge for the implementation of such a CX.
Based on these findings, we expect certain capabilities to be relevant no matter which future scenario will finally prove to be the case for an individual Captive. We have selected six of these top strategic fields of action which Captives’ decision-makers are most likely to have to deal with on their transformation path towards 2030. We will analyze these topics in more detail on the following pages.
Fig. 38 – Four central findings for the Future of Captives
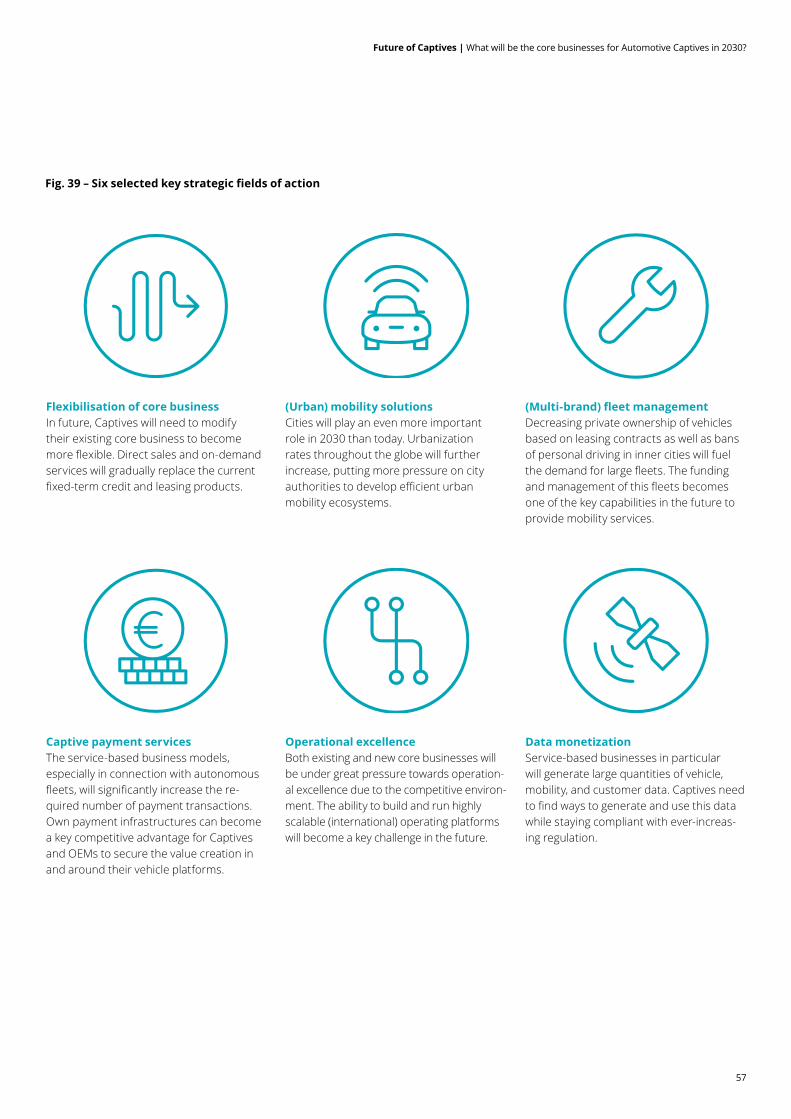
57
Future of Captives | What will be the core businesses for Automotive Captives in 2030?
Flexibilisation of core businessIn future, Captives will need to modify their existing core business to become more flexible. Direct sales and on-demand services will gradually replace the current fixed-term credit and leasing products.
Captive payment servicesThe service-based business models, especially in connection with autonomous fleets, will significantly increase the re-quired number of payment transactions. Own payment infrastructures can become a key competitive advantage for Captives and OEMs to secure the value creation in and around their vehicle platforms.
(Urban) mobility solutionsCities will play an even more important role in 2030 than today. Urbanization rates throughout the globe will further increase, putting more pressure on city authorities to develop efficient urban mobility ecosystems.
Operational excellenceBoth existing and new core businesses will be under great pressure towards operation-al excellence due to the competitive environ-ment. The ability to build and run highly scalable (international) operating platforms will become a key challenge in the future.
(Multi-brand) fleet managementDecreasing private ownership of vehicles based on leasing contracts as well as bans of personal driving in inner cities will fuel the demand for large fleets. The funding and management of this fleets becomes one of the key capabilities in the future to provide mobility services.
Data monetizationService-based businesses in particular will generate large quantities of vehicle, mobility, and customer data. Captives need to find ways to generate and use this data while staying compliant with ever-increas-ing regulation.
Fig. 39 – Six selected key strategic fields of action
58
The asset-based business model of Captives today is relatively stable and predictable. Leasing and credit customers have one fixed monthly payment rate that is usually not adapted during the contract lifetime. Furthermore, the minimum contract duration for most of the current products offered by the Captives is at least one year.
Across all outlined scenarios we expect changing customer preferences (corporate, governmental and private customers) to trigger a shift towards more flexible and customizable offerings. Captives consequently have to adapt their product and service portfolio in order to remain competitive in the future.
In particular increasing demand for pay-per-use models, for example for vehicle insurance or mobility services, and on-demand services such as functions on demand and connected-car applications will result in a significantly increasing number of customer touchpoints. This results in exponential growth of single payment transactions as well as the necessity to offer monthly adaptable leasing rates.
Today’s products, business processes, IT systems and sales channels are still largely focused on fixed monthly rates and in general not yet flexible enough to meet future customers’ demand.
We are convinced that the future business will require the Captives to transform their products, processes and systems towards more agile and flexible ones and to establish direct sales channels to sell their products.
Flexibilization of core business
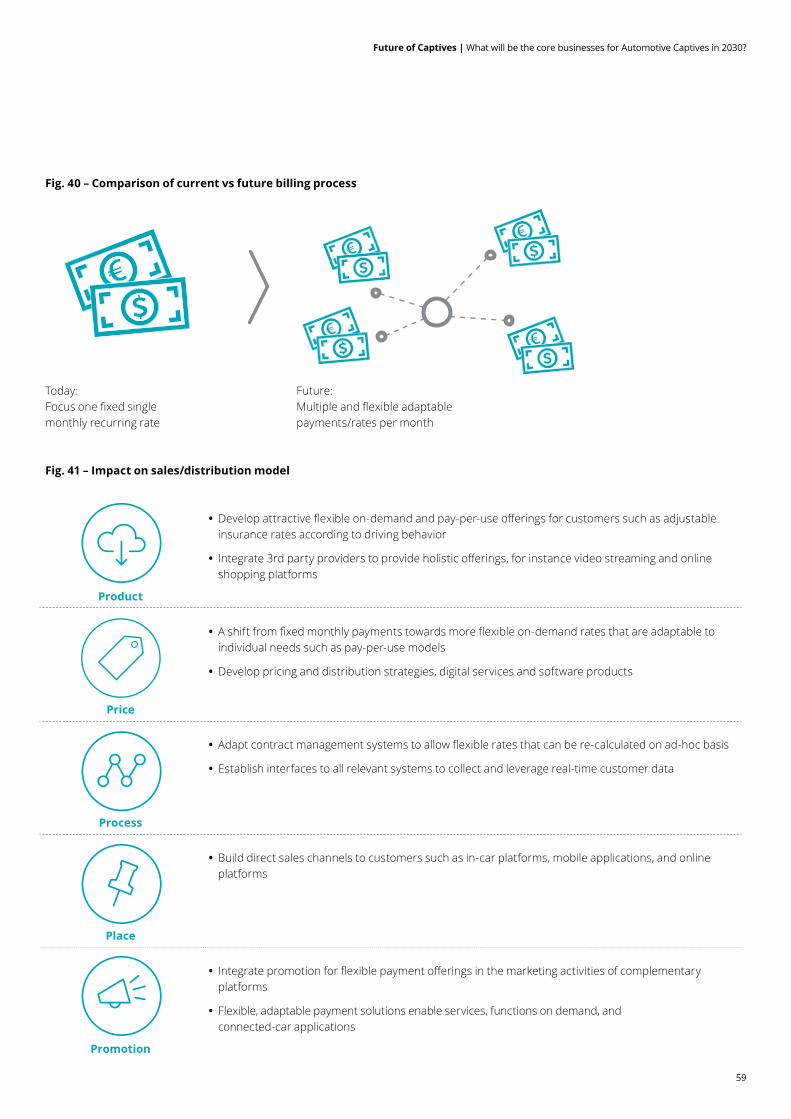
59
Future of Captives | What will be the core businesses for Automotive Captives in 2030?
Fig. 40 – Comparison of current vs future billing process
Fig. 41 – Impact on sales/distribution model
Today: Focus one fixed single monthly recurring rate
Future: Multiple and flexible adaptable payments/rates per month
Product
• Develop attractive flexible on-demand and pay-per-use offerings for customers such as adjustable insurance rates according to driving behavior
• Integrate 3rd party providers to provide holistic offerings, for instance video streaming and online shopping platforms
Price
• A shift from fixed monthly payments towards more flexible on-demand rates that are adaptable to individual needs such as pay-per-use models
• Develop pricing and distribution strategies, digital services and software products
Process
• Adapt contract management systems to allow flexible rates that can be re-calculated on ad-hoc basis
• Establish interfaces to all relevant systems to collect and leverage real-time customer data
Place
• Build direct sales channels to customers such as in-car platforms, mobile applications, and online platforms
Promotion
• Integrate promotion for flexible payment offerings in the marketing activities of complementary platforms
• Flexible, adaptable payment solutions enable services, functions on demand, and connected-car applications
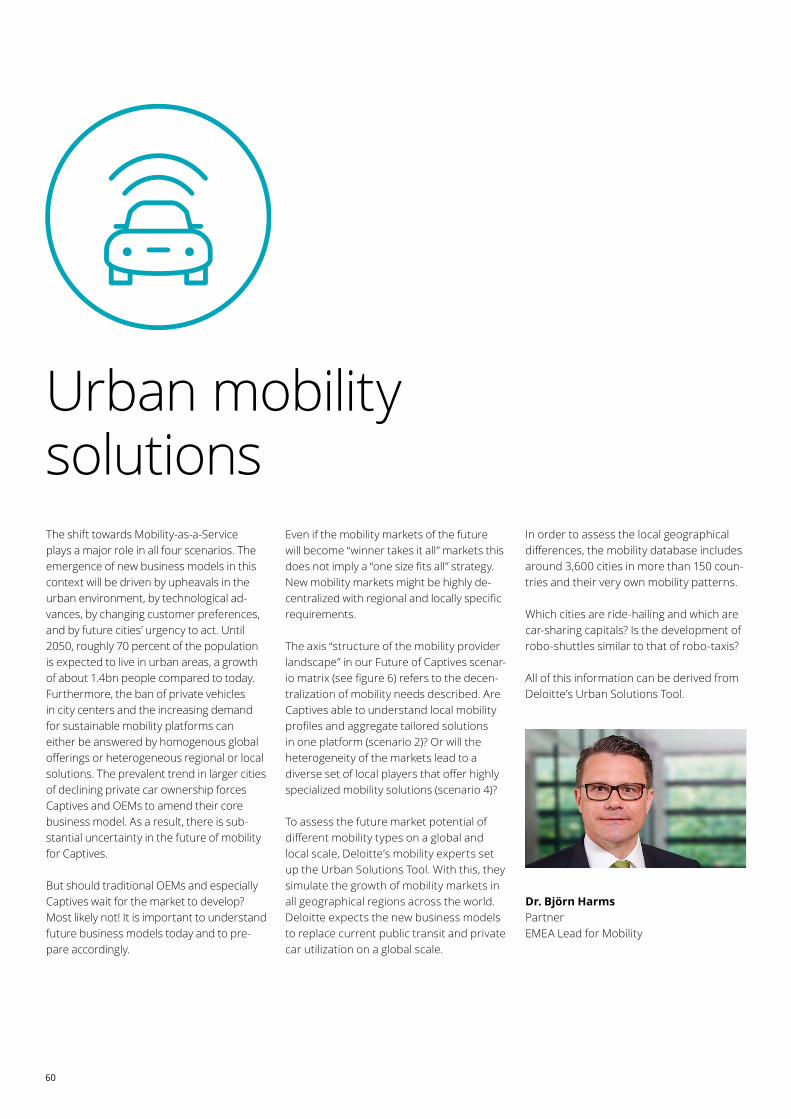
60
The shift towards Mobility-as-a-Service plays a major role in all four scenarios. The emergence of new business models in this context will be driven by upheavals in the urban environment, by technological ad-vances, by changing customer preferences, and by future cities’ urgency to act. Until 2050, roughly 70 percent of the population is expected to live in urban areas, a growth of about 1.4bn people compared to today. Furthermore, the ban of private vehicles in city centers and the increasing demand for sustainable mobility platforms can either be answered by homogenous global offerings or heterogeneous regional or local solutions. The prevalent trend in larger cities of declining private car ownership forces Captives and OEMs to amend their core business model. As a result, there is sub-stantial uncertainty in the future of mobility for Captives.
But should traditional OEMs and especially Captives wait for the market to develop? Most likely not! It is important to understand future business models today and to pre-pare accordingly.
Urban mobility solutions
Even if the mobility markets of the future will become “winner takes it all” markets this does not imply a “one size fits all” strategy. New mobility markets might be highly de-centralized with regional and locally specific requirements.
The axis “structure of the mobility provider landscape” in our Future of Captives scenar-io matrix (see figure 6) refers to the decen-tralization of mobility needs described. Are Captives able to understand local mobility profiles and aggregate tailored solutions in one platform (scenario 2)? Or will the heterogeneity of the markets lead to a diverse set of local players that offer highly specialized mobility solutions (scenario 4)?
To assess the future market potential of different mobility types on a global and local scale, Deloitte’s mobility experts set up the Urban Solutions Tool. With this, they simulate the growth of mobility markets in all geographical regions across the world. Deloitte expects the new business models to replace current public transit and private car utilization on a global scale.
In order to assess the local geographical differences, the mobility database includes around 3,600 cities in more than 150 coun-tries and their very own mobility patterns.
Which cities are ride-hailing and which are car-sharing capitals? Is the development of robo-shuttles similar to that of robo-taxis?
All of this information can be derived from Deloitte’s Urban Solutions Tool.
Dr. Björn HarmsPartner EMEA Lead for Mobility
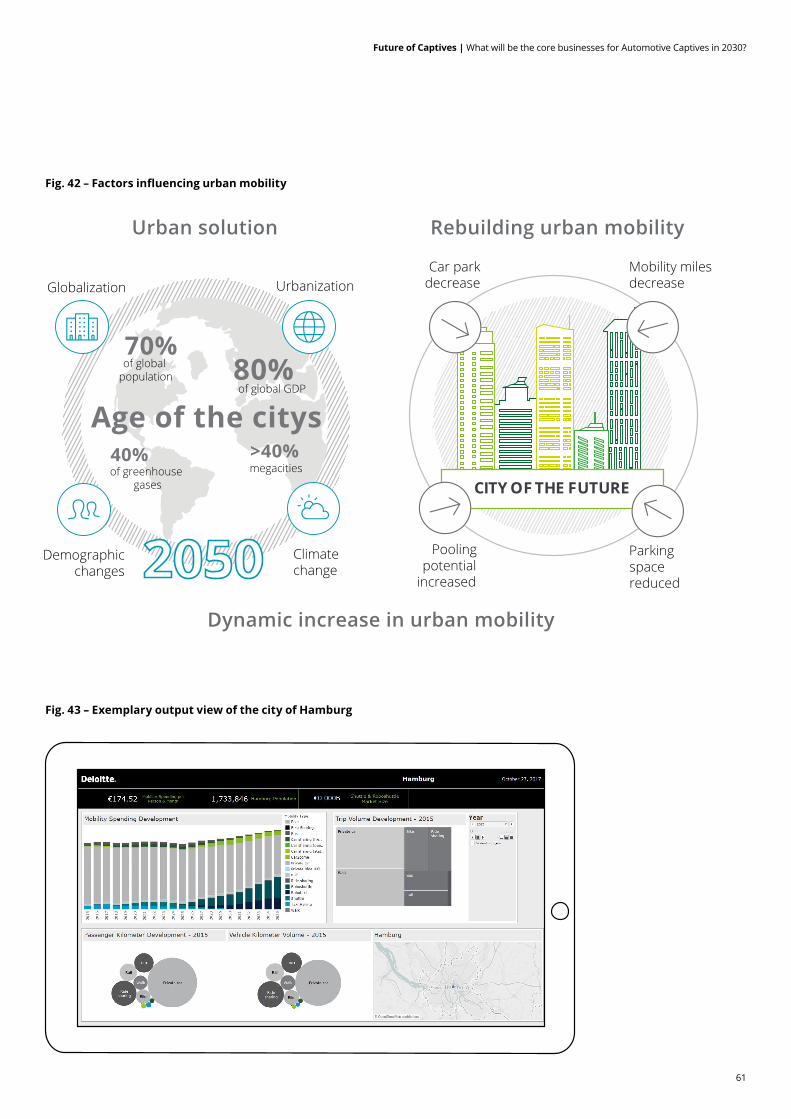
61
Future of Captives | What will be the core businesses for Automotive Captives in 2030?
Fig. 42 – Factors influencing urban mobility
Fig. 43 – Exemplary output view of the city of Hamburg
CITY OF THE FUTURE
Pooling potential
increased
Car parkdecrease
Mobility miles decrease
Parking space reduced
Rebuilding urban mobility
Age of the citys80%
70%
40% >40%
of global population
of greenhouse gases
of global GDP
megacities
Urbanization
Demographicchanges
Globalization
Climate change
Dynamic increase in urban mobility
Urban solution
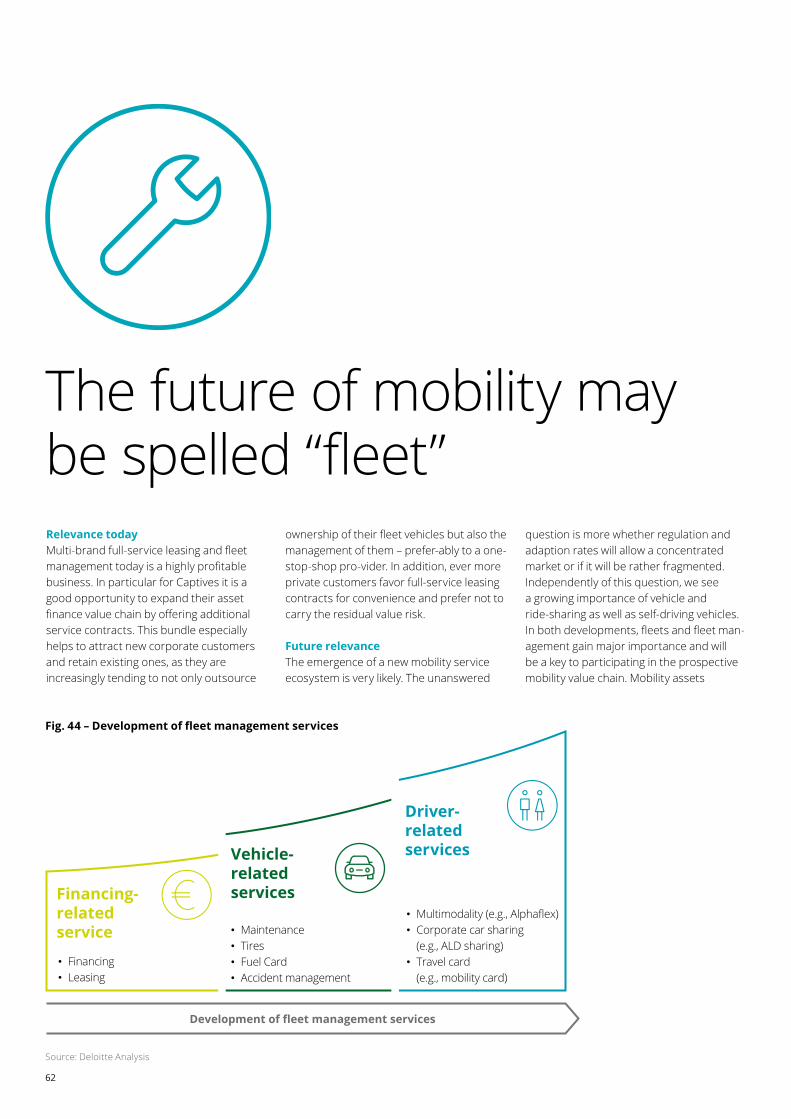
62
Relevance todayMulti-brand full-service leasing and fleet management today is a highly profitable business. In particular for Captives it is a good opportunity to expand their asset finance value chain by offering additional service contracts. This bundle especially helps to attract new corporate customers and retain existing ones, as they are increasingly tending to not only outsource
ownership of their fleet vehicles but also the management of them – prefer-ably to a one-stop-shop pro-vider. In addition, ever more private customers favor full-service leasing contracts for convenience and prefer not to carry the residual value risk.
Future relevanceThe emergence of a new mobility service ecosystem is very likely. The unanswered
question is more whether regulation and adaption rates will allow a concentrated market or if it will be rather fragmented. Independently of this question, we see a growing importance of vehicle and ride-sharing as well as self-driving vehicles. In both developments, fleets and fleet man-agement gain major importance and will be a key to participating in the prospective mobility value chain. Mobility assets
The future of mobility may be spelled “fleet”
Fig. 44 – Development of fleet management services
Financing-related service
• Financing• Leasing
• Maintenance• Tires• Fuel Card• Accident management
• Multimodality (e.g., Alphaflex)• Corporate car sharing (e.g., ALD sharing)• Travel card (e.g., mobility card)
Vehicle-relatedservices
Driver-related services
Development of fleet management services
Source: Deloitte Analysis
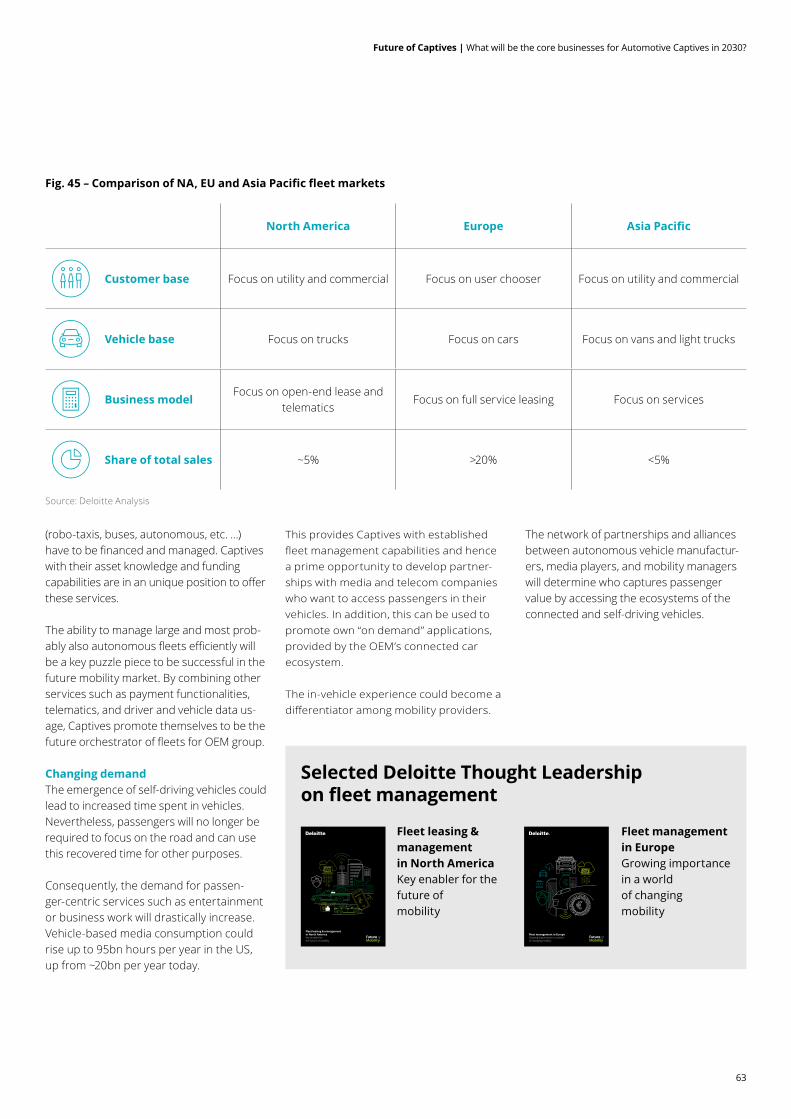
63
Future of Captives | What will be the core businesses for Automotive Captives in 2030?
Fig. 45 – Comparison of NA, EU and Asia Pacific fleet markets
North America Europe Asia Pacific
Customer base Focus on utility and commercial Focus on user chooser Focus on utility and commercial
Vehicle base Focus on trucks Focus on cars Focus on vans and light trucks
Business modelFocus on open-end lease and
telematicsFocus on full service leasing Focus on services
Share of total sales ~5% >20% <5%
(robo-taxis, buses, autonomous, etc. …) have to be financed and managed. Captives with their asset knowledge and funding capabilities are in an unique position to offer these services.
The ability to manage large and most prob-ably also autonomous fleets efficiently will be a key puzzle piece to be successful in the future mobility market. By combining other services such as payment functionalities, telematics, and driver and vehicle data us-age, Captives promote themselves to be the future orchestrator of fleets for OEM group.
Changing demandThe emergence of self-driving vehicles could lead to increased time spent in vehicles. Nevertheless, passengers will no longer be required to focus on the road and can use this recovered time for other purposes.
Consequently, the demand for passen-ger-centric services such as entertainment or business work will drastically increase. Vehicle-based media consumption could rise up to 95bn hours per year in the US, up from ~20bn per year today.
This provides Captives with established fleet management capabilities and hence a prime opportunity to develop partner-ships with media and telecom companies who want to access passengers in their vehicles. In addition, this can be used to promote own “on demand” applications, provided by the OEM’s connected car ecosystem.
The in-vehicle experience could become a differentiator among mobility providers.
Source: Deloitte Analysis
Selected Deloitte Thought Leadership on fleet management
Fleet management in EuropeGrowing importance in a world of changing mobility
car share
Fleet leasing & management in North AmericaKey enabler for the future of mobility
Fleet leasing & managementin North America Key enabler for the future of mobility
Fleet management in Europe Growing importance in a worldof changing mobility
The network of partnerships and alliances between autonomous vehicle manufactur-ers, media players, and mobility managers will determine who captures passenger value by accessing the ecosystems of the connected and self-driving vehicles.
64
In any of our four developed scenarios, payment functionalities that meet ever-changing customer expectations will be paramount. Both asset- and service-based business models shift towards transaction-based and on-demand models increasing the number of payment transactions significantly. By 2030, customers will want to search, pay, and manage offerings on one central plat-form that aggregates various financing, mobility, charging and parking offerings.
Even though these developments are nothing new and are well known in the Captive industry, payment methods and systems are often neglected or treated as a commodity in the debate about business models.
Incumbent players who had no previous con-nection with the e-commerce market-place have a special struggle to grasp the complexity of payments.
Captives have to decide whether to build own payment solutions in-house or partner with established providers. This is a strategic decision with significant consequences for the future of their business models.In particular large firms want to retain ownership, control the customer experience, leverage customer data, realize monetization potential, and integrate payment functional-ities into their ecosystem. In doing so, they can benefit from network effects, locking in customers. Therefore they may decide to develop their own internal payment capabilities.
Furthermore, the business model choice is crucial for success: the decision to use an e-wallet system exclusively, a PSP functionality or a combination of both models to control payments is complex and heavily dependent on the context and requirements of each individual Captive. The global heterogeneity of the payment environment adds further complexity. Even for the build approach, com-panies should evaluate whether and what payment func-tionalities can be outsourced.
Many different factors should be taken into account when evaluating strategic payment choices:
• Ambition level and payment vision
• Customer experience (alternative pay-ment methods, check-out process, etc.)
• Monetization potential (control of pay-ment processing, taxation, etc.)
• Business risk exposure (regulatory envi-ronment, fraud, risk management, etc.)
• Time to market and scalability
• Individual organizational and structural requirements etc.
• Market scope (global, regional, local)
Captive payment services
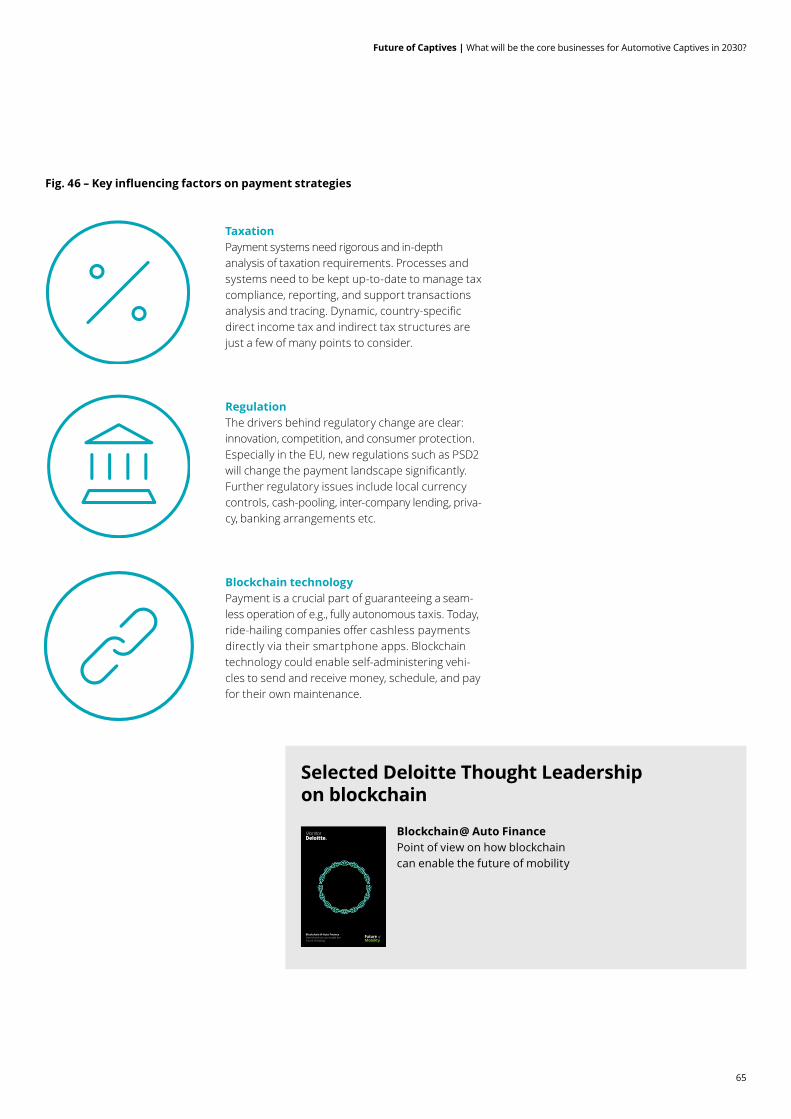
65
Future of Captives | What will be the core businesses for Automotive Captives in 2030?
TaxationPayment systems need rigorous and in-depth analysis of taxation requirements. Processes and systems need to be kept up-to-date to manage tax compliance, reporting, and support transactions analysis and tracing. Dynamic, country-specific direct income tax and indirect tax structures are just a few of many points to consider.
RegulationThe drivers behind regulatory change are clear: innovation, competition, and consumer protection. Especially in the EU, new regulations such as PSD2 will change the payment landscape significantly. Further regulatory issues include local currency controls, cash-pooling, inter-company lending, priva-cy, banking arrangements etc.
Blockchain technologyPayment is a crucial part of guaranteeing a seam-less operation of e.g., fully autonomous taxis. Today, ride-hailing companies offer cashless payments directly via their smartphone apps. Blockchain technology could enable self-administering vehi-cles to send and receive money, schedule, and pay for their own maintenance.
Fig. 46 – Key influencing factors on payment strategies
Blockchain @ Auto FinanceHow blockchain can enable the Future of Mobility
Selected Deloitte Thought Leadership on blockchain
Blockchain @ Auto Finance Point of view on how blockchain can enable the future of mobility
66
Excelling in operating an efficient business is a key element of most scenarios. Drivers are not only the need to increase profitability – e.g. in order to refinance investments into new, service-based business endeavors. But also customers demand various aspects of an efficient core business: convenient and fast – customer-centric – processes, multi-channel capabilities with seamless switch of channels.
Historically, most Captives have not ex-perienced great need for improving their operating ratio since they were subject to continuous and profitable growth. Hence, their culture of operational excellence has been much less pronounced than in retail banks or other industries.
Captive-specific drivers for inefficiencies are also induced by their typical role in the OEM’s group as sales support. Local and locally managed dealer networks have led to a heterogeneous product portfolio and highly individualized processes. On top of that most Captives work with outdated, custom-built IT-systems. Those allow only for a low degree of process automation and have become more and more cumbersome – both, in day-to-day operations as well as updates and maintenance.
The foundation of operational excellence therefore is simplification and standardization starting with cutting back the large vari-ety of products and variations to a more homogeneous product portfolio. With focus on activities that really add value to the customer and fulfilling their needs, processes can be re-designed, simplified and standardized. This also helps limiting the growing impact of regulations on the captive core business.
Due to the influence of other industries such as online retail business and retail banking, customers are more and more used to and willing to take over elaborate processes themselves. Through self-service capabilities Captives can “outsource” a number of activities like account updates, calculations and information gathering to their customers.
The remaining back-office processes usually provide the opportunity of automating procedures through score card-based au-tomated decision engines robotic process automation as well as workflow and case management tools.
Modernizing the IT-architecture by replacing outdated, custom-built systems with modern standard software on one hand represents a great lever for operational excellence. On the other it is a challenging endeavor since the Captive software market is dominated by mid-sized vendors and lacking established industry and process standards. Hence, such projects require a high degree of functional involvement and resolute management.
However, identifying areas of improvement is only half the story: Inducing a cultural change in the organization towards con-tinuous improvement is key in order to reach and maintain operational excellence. Bottom-up ideas have to be combined with top-down initiatives and larger programs like system replacements to initiate and implement change. All this should be orchestrated centrally to ensure strategic alignment.
Operational excellence
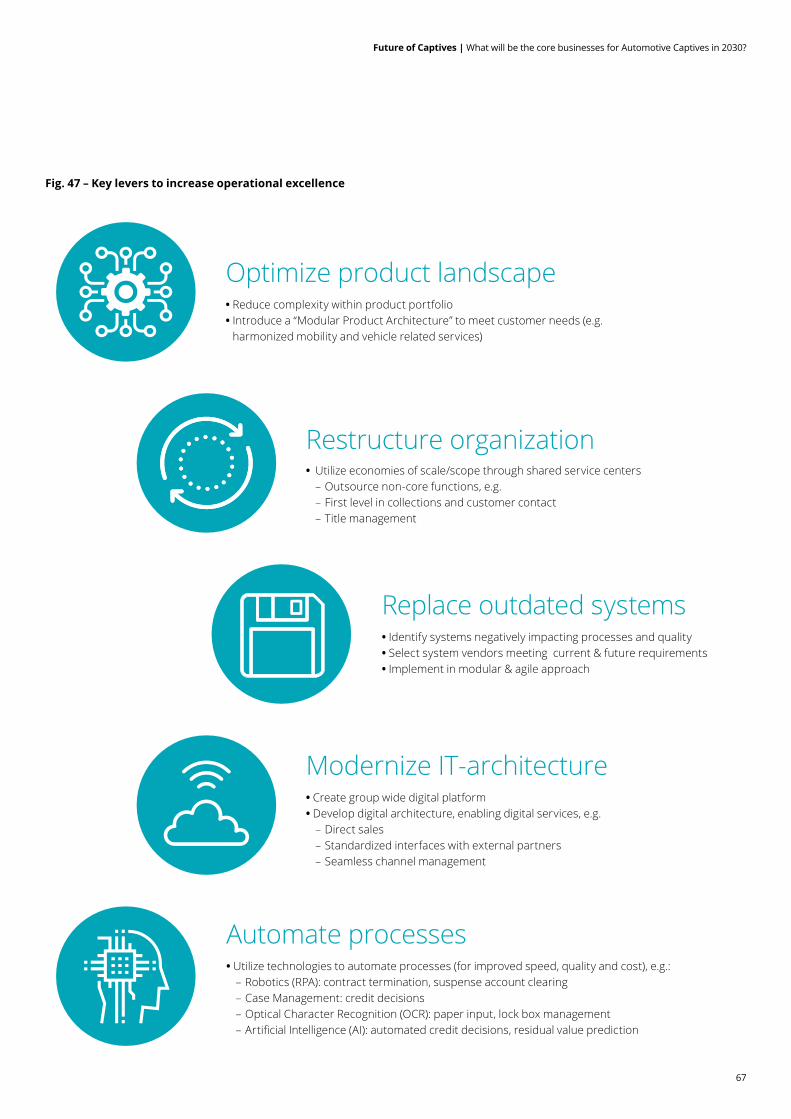
67
Future of Captives | What will be the core businesses for Automotive Captives in 2030?
Optimize product landscape • Reduce complexity within product portfolio• Introduce a “Modular Product Architecture” to meet customer needs (e.g.
harmonized mobility and vehicle related services)
Restructure organization • Utilize economies of scale/scope through shared service centers
– Outsource non-core functions, e.g. – First level in collections and customer contact – Title management
Replace outdated systems • Identify systems negatively impacting processes and quality• Select system vendors meeting current & future requirements• Implement in modular & agile approach
Modernize IT-architecture • Create group wide digital platform• Develop digital architecture, enabling digital services, e.g.
– Direct sales – Standardized interfaces with external partners – Seamless channel management
Automate processes • Utilize technologies to automate processes (for improved speed, quality and cost), e.g.:
– Robotics (RPA): contract termination, suspense account clearing – Case Management: credit decisions – Optical Character Recognition (OCR): paper input, lock box management – Artificial Intelligence (AI): automated credit decisions, residual value prediction
Fig. 47 – Key levers to increase operational excellence
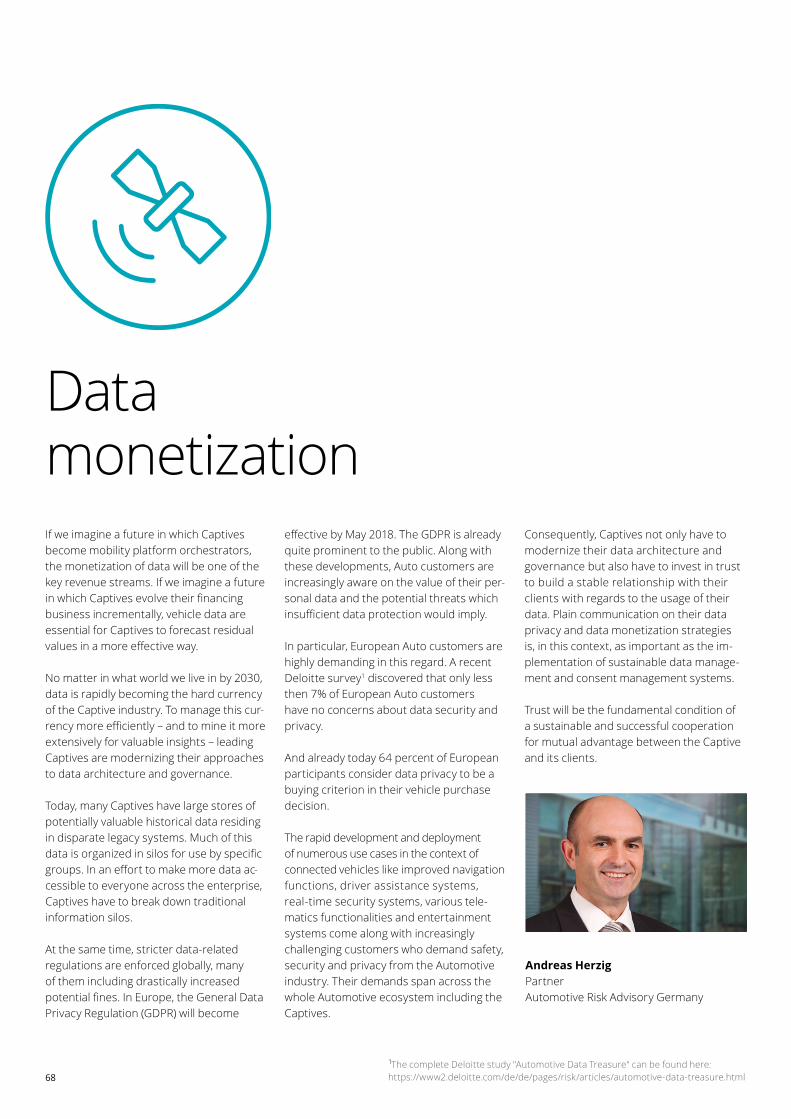
68
If we imagine a future in which Captives become mobility platform orchestrators, the monetization of data will be one of the key revenue streams. If we imagine a future in which Captives evolve their financing business incrementally, vehicle data are essential for Captives to forecast residual values in a more effective way.
No matter in what world we live in by 2030, data is rapidly becoming the hard currency of the Captive industry. To manage this cur-rency more efficiently – and to mine it more extensively for valuable insights – leading Captives are modernizing their approaches to data architecture and governance.
Today, many Captives have large stores of potentially valuable historical data residing in disparate legacy systems. Much of this data is organized in silos for use by specific groups. In an effort to make more data ac-cessible to everyone across the enterprise, Captives have to break down traditional information silos.
At the same time, stricter data-related regulations are enforced globally, many of them including drastically increased potential fines. In Europe, the General Data Privacy Regulation (GDPR) will become
effective by May 2018. The GDPR is already quite prominent to the public. Along with these developments, Auto customers are increasingly aware on the value of their per-sonal data and the potential threats which insufficient data protection would imply.
In particular, European Auto customers are highly demanding in this regard. A recent Deloitte survey1 discovered that only less then 7% of European Auto customers have no concerns about data security and privacy.
And already today 64 percent of European participants consider data privacy to be a buying criterion in their vehicle purchase decision.
The rapid development and deployment of numerous use cases in the context of connected vehicles like improved navigation functions, driver assistance systems, real-time security systems, various tele-matics functionalities and entertainment systems come along with increasingly challenging customers who demand safety, security and privacy from the Automotive industry. Their demands span across the whole Automotive ecosystem including the Captives.
Consequently, Captives not only have to modernize their data architecture and governance but also have to invest in trust to build a stable relationship with their clients with regards to the usage of their data. Plain communication on their data privacy and data monetization strategies is, in this context, as important as the im-plementation of sustainable data manage-ment and consent management systems.
Trust will be the fundamental condition of a sustainable and successful cooperation for mutual advantage between the Captive and its clients.
Data monetization
1The complete Deloitte study "Automotive Data Treasure" can be found here: https://www2.deloitte.com/de/de/pages/risk/articles/automotive-data-treasure.html
Andreas HerzigPartner Automotive Risk Advisory Germany
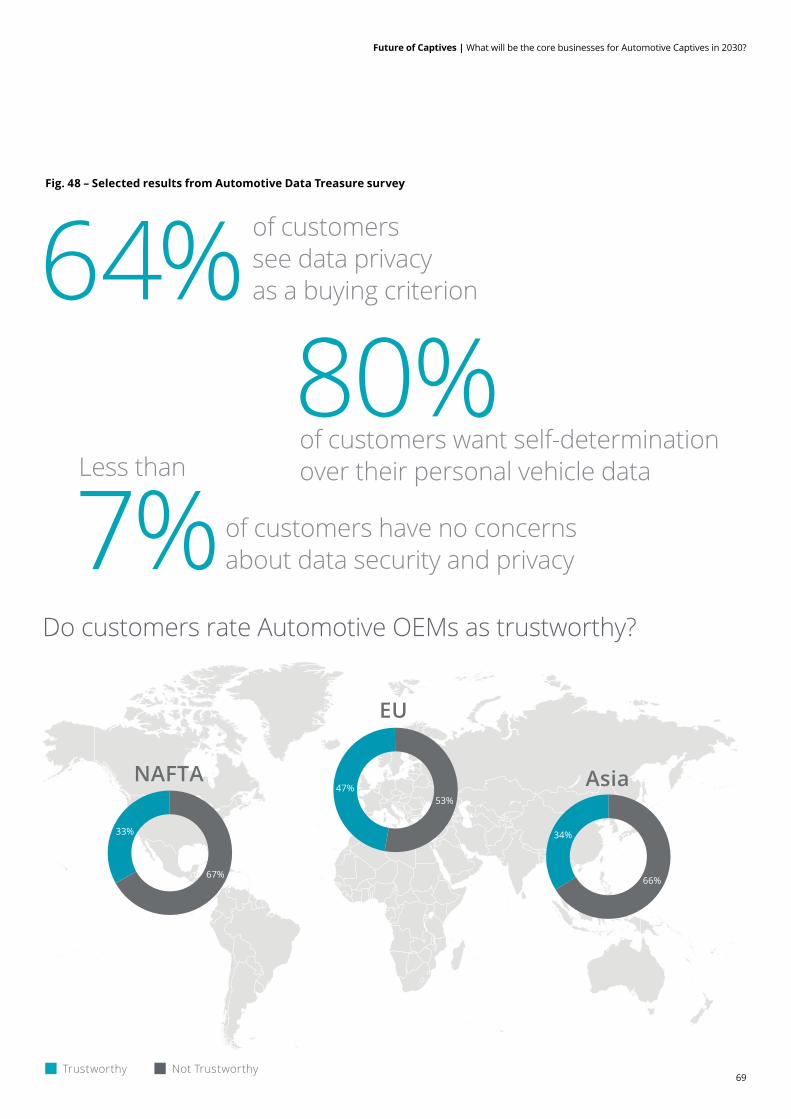
69
Future of Captives | What will be the core businesses for Automotive Captives in 2030?
Fig. 48 – Selected results from Automotive Data Treasure survey
67%
33%
66%
34%
53%47%
NAFTA
EU
Asia
Trustworthy Not Trustworthy
of customers see data privacy as a buying criterion64%80%of customers want self-determination over their personal vehicle data
7%Less than
of customers have no concerns about data security and privacy
Do customers rate Automotive OEMs as trustworthy?
70
Our analysis shows that the environment in which automotive Captives compete will undergo fundamental changes until 2030. Respectively, the core businesses of Captives, meaning asset-based financing business, will have to be complemented by service-based business on a global basis. This comes with a fundamental shift of mindset from focusing on one-time sale of assets towards focusing on recurring revenue over the full customer and vehicle lifetime. Due to their unique competencies Captives are well positioned to become a key enabler of this transition from asset-fo-cus to customer-centricity and service-ori-entation. Two of the most uncertain and most impactful variables are:
Ownership of the vehicle assets We expect global annual vehicle sales to grow by more than 30 percent until 2030. Most of this growth will come from emerging markets where current credit and leasing penetration rates have substantial growth potential. In parallel the vehicles themselves will change drastically due to the emergence of autonomous driving and e-mobility. But will the Captives be able to grasp this enormous growth potential? Their further growth in the asset-based business could be either hindered by financial regulation, emergence of strong competition or even their own OEMs shying away from the implied residual value risk.
Structure of the mobility provider landscape The mobility services landscape today is rapidly evolving and the key question is if a small number of players will be able to gain a global dominance. In any case the complexity and diversity of these services is intense. Captives will need to focus on deciding where they want to focus their limited resources on and strategic coop-eration to reduce the depth of own value creation become paramount. Our financial simulations indicate that the developments throughout the major global regions will be very diverse and changing rapidly. Constant measurement of the probabilities indicating which of the scenarios is most plausible are highly important. To be able to face this uncertainty with confidence and strategic foresight we have built our financial model being very customizable. We are able to simulate individual futures per Captive based on the status quo, requirements and strategic ambitions as well as current finan-cial figures. Using our artificial intelligence tools we can provide constant analysis of the market environment on a qualitative and quantitative basis. This enables deci-sion-takers of Captives to guide and steer their organizations towards a promising future in 2030 and beyond.
Conclusion
%
71
Future of Captives | What will be the core businesses for Automotive Captives in 2030?
%
72
Contacts
Niclas VietenConsultantAuto Finance StrategyGermanyTel.: +49 (0)151 5807 [email protected]
Special thanks to Dr. Frank Becker, Tessen Fritzsche, Andreas Schühly, Philipp Enderle, Kristin Gott, and Julian Zassenhaus for their contribution.
Sebastian Pfeifle PartnerGlobal Auto Finance Lead GermanyTel: +49 (0)151 5807 0435 [email protected]
Jan BakkerPartnerAutomotive StrategyGermanyTel.: +49 (0)151 5807 [email protected]
Dr. Florian KleinDirectorCenter for the Long ViewGermanyTel.: +49 (0)151 5800 [email protected]
Selcuk KaratasManagerAuto Finance Operations/ ITGermanyTel.: +49 (0)151 5807 [email protected]
Christopher LeySenior ManagerAuto Finance StrategyGermanyTel.: +49 (0)151 5807 [email protected]
Ingo SchmuckallSenior ManagerAuto Finance OperationsGermanyTel.: +49 (0)151 5807 [email protected]
Florian TauschekSenior ConsultantAuto Finance StrategyGermanyTel.: +49 (0)151 5800 [email protected]
73
Future of Captives | What will be the core businesses for Automotive Captives in 2030?
Deloitte’s Global Automotive Finance Practice
Daniel MartyniukPartner | Auto Finance LeadCentral Eastern EuropeTel.: +48 (0) 609 995 [email protected]
Joe Vitale Partner | Automotive Sector Lead GlobalUnited StatesTel: +1 (0)313 324 [email protected]
Dr. Thomas Schiller Partner | Automotive Sector Consulting Lead GlobalGermanyTel: +49 (0)89 290 367 [email protected]
Kelly Xiao Li ZhouDirector | Auto Finance LeadChinaTel.: (88) [email protected]
Marco MartinaPartner | Auto Finance LeadItalyTel.: +39 (0)3355 638 [email protected]
Arata TakahashiSenior Manager| Auto Finance LeadJapanTel.: +81 (0) [email protected]
Ruben FuentesPartner | Auto Finance LeadMexicoTel.: +52 555 080 [email protected]
Jaco van der MerweDirector | Auto Finance LeadSouth AfricaTel.: +72 (0)826 [email protected]
Sharad Mohan Mishra Partner | Auto Finance LeadSouth East AsiaTel.: +65 (0)6232 [email protected]
Tae Hwan KimDirector | Auto Finance LeadSouth KoreaTel.: +82 (0)2 6676 3756 [email protected]
Andre SalzPartner | Auto Finance LeadUnited StatesTel.: +1 (0)212 436 [email protected]
Rishi MalkaniPartner | Auto Finance LeadCanadaTel.: +1 (416)601 4855 [email protected]
Charlotte VandeputtePartner | Auto Finance LeadFranceTel.: +33 (0)6 82 64 10 [email protected]
Richard Blackwell Partner | Auto Finance LeadUnited KingdomTel.: +44 (0)7887 [email protected]
Shyam GovindanPartner | Auto Finance LeadIndiaTel.: +91 (0)22 6122 [email protected]
This study was developed thanks to the involved experts from Deloitte’s global automotive finance practice.


75
Future of Captives | What will be the core businesses for Automotive Captives in 2030?
This communication contains general information only not suitable for addressing the particular circumstances of any individual case and is not intended to be used as a basis for commercial decisions or decisions of any other kind. None of Deloitte Consulting GmbH or Deloitte Touche Tohmatsu Limited, its member firms, or their related entities (collectively, the “Deloitte network”) is, by means of this communication, rendering professional advice or services. No entity in the Deloitte network shall be responsible for any loss whatsoever sustained by any person who relies on this communication.
Deloitte refers to one or more of Deloitte Touche Tohmatsu Limited, a UK private company limited by guarantee (“DTTL”), its network of member firms, and their related entities. DTTL and each of its member firms are legally separate and independent entities. DTTL (also referred to as “Deloitte Global”) does not provide services to clients. Please see www.deloitte.com/de/UeberUns for a more detailed description of DTTL and its member firms.
Deloitte provides audit, risk advisory, tax, financial advisory and consulting services to public and private clients spanning multiple industries; legal advisory services in Germany are provided by Deloitte Legal. With a globally connected network of member firms in more than 150 countries, Deloitte brings world-class capabilities and high-quality service to clients, delivering the insights they need to address their most complex business challenges. Deloitte’s approximately 263,900 professionals are committed to making an impact that matters.
Issue 02/2018