Embed Size (px)
Citation preview
Future Need and Demand for Housing in Wales
September 2015
Future Need and Demand for Housing in Wales
Alan E. Holmans
Cambridge Centre for Housing and Planning Research
This report and the information contained within it are the copyright of the Queen’s Printer
and Controller of HMSO, and are licensed under the terms of the Open Government Licence
http://www.nationalarchives.gov.uk/doc/open-government-licence/version/3. The views
expressed are the author’s and do not necessarily reflect those of the Institute’s
Executive Group or Board of Governors.
Alan Holmans was acknowledged as the UK’s preeminent expert in projecting future housing
need and demand. He conducted the analysis presented in this report shortly before his
death in March 2015. Researchers from the Public Policy Institute for Wales edited Alan’s
draft submission in order to bring it to publication but the analysis and key findings are his.
For further information please contact:
Dan Bristow
Public Policy Institute for Wales
Tel: 029 2087 5345
Email: [email protected]
Contents
Summary .............................................................................................................................. 1
Introduction ........................................................................................................................... 2
Methodology ......................................................................................................................... 2
Estimating Total Need and Demand ...................................................................................... 3
Analysis of the Principal Projection ....................................................................................... 5
The Principal Projection: An Estimate of Future Housing Need and Demand ...................... 15
Discussion and Analysis of the Alternative Projection ......................................................... 20
Estimating the Backlog of Unmet Housing Need ................................................................. 30
Need and Demand for Housing in Wales 2011-2031: District Analysis ................................ 32
Conclusion .......................................................................................................................... 38
Annex 1: Calculating the Alternative Household Projection ................................................ 41
Annex 2: Calculating the demand and need for housing in Welsh districts 2011-2031 ........ 42
References ......................................................................................................................... 47
1
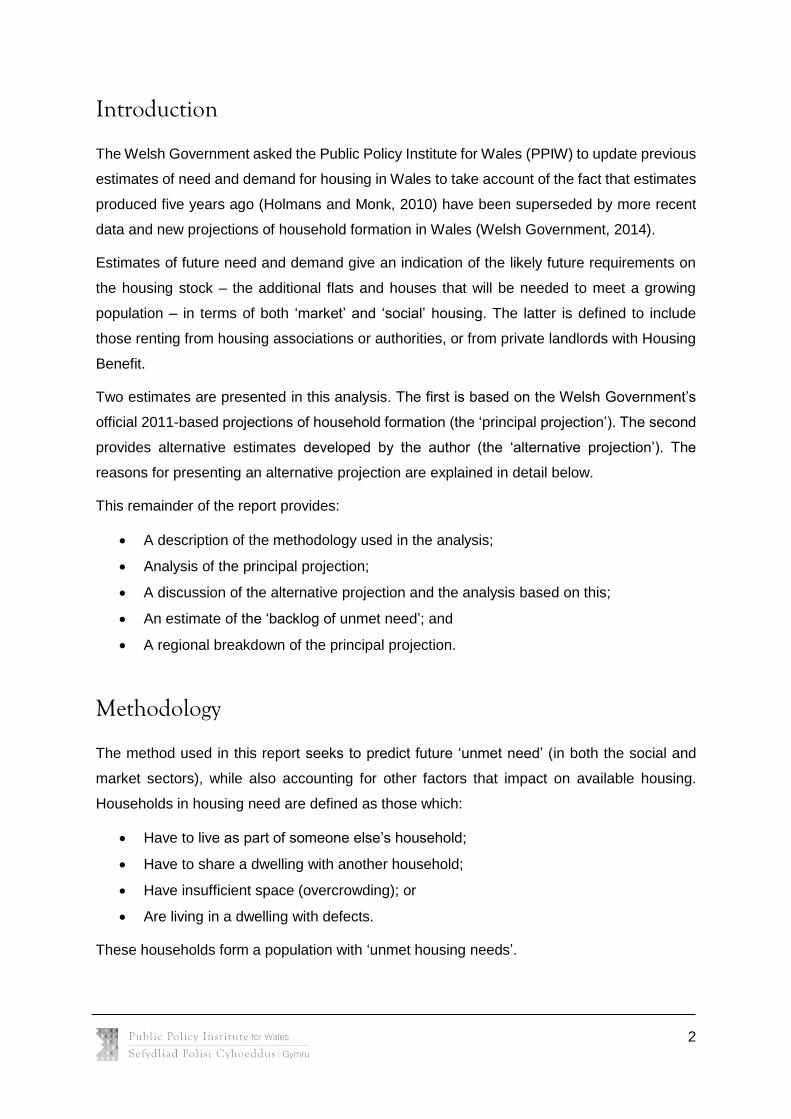
Summary
This report presents new estimates of the need and demand for housing in Wales over
the period 2011 to 2031. Two estimates are presented – one based on the Welsh
Government’s official projections for household formation (the ‘principal projection’), the
other based on a projection developed by the author (the ‘alternative projection’).
The principal projection is based on data for the rate of household formation between
2001 and 2011. During this period, household formation was lower than historic trends,
with the consequence that the projections which flow from these data are also lower than
previously expected. The alternative projection assumes, instead, that eventually there is
a return to ‘trend’ and that household formation is therefore higher than the principal
projection.
Based on the principal projection, it is estimated that over the period 2011 to 2031 an
additional 174,000 ‘units’ (houses or flats) will be needed, or 8,700 a year; of which, 60%
would be in the market sector (5,200 a year, 104,000 over the period), and 40% in the
social sector (3,500 a year, 70,000 over the period). A regional breakdown of the principal
projection is also presented.
The alternative projection leads to a higher estimate of need and demand: 240,000 units
over the period, or 12,000 a year; of which 58% would be in the market sector (7,000 a
year, 140,000 over the period) and 42% in the social sector (5,000 a year, 100,000 over
the period).
Historic rates of house building in Wales help put these figures into context. Since 1991
building rates have been declining. The annual average between 1991/92 and 1995/96
was 9,500. This dropped to 8,660 between 1996/97 and 2000/01, and to 7,360 for the
period 2006/07 – 2010/11.
In contrast, the number of affordable houses in Wales has grown by 15,981 since 2007-
08 and, over the last five years, at an annual average rate of almost 2,350. Planned and
proposed increases for 2014/15 and 2015/16 are 2,829 and 3,129 respectively.
This analysis suggests, therefore, that if future need and demand for housing in Wales is
to be met, there needs to be a return to rates of house building not seen for almost 20
years, and an increase in the rate of growth of affordable housing.
2
Introduction
The Welsh Government asked the Public Policy Institute for Wales (PPIW) to update previous
estimates of need and demand for housing in Wales to take account of the fact that estimates
produced five years ago (Holmans and Monk, 2010) have been superseded by more recent
data and new projections of household formation in Wales (Welsh Government, 2014).
Estimates of future need and demand give an indication of the likely future requirements on
the housing stock – the additional flats and houses that will be needed to meet a growing
population – in terms of both ‘market’ and ‘social’ housing. The latter is defined to include
those renting from housing associations or authorities, or from private landlords with Housing
Benefit.
Two estimates are presented in this analysis. The first is based on the Welsh Government’s
official 2011-based projections of household formation (the ‘principal projection’). The second
provides alternative estimates developed by the author (the ‘alternative projection’). The
reasons for presenting an alternative projection are explained in detail below.
This remainder of the report provides:
A description of the methodology used in the analysis;
Analysis of the principal projection;
A discussion of the alternative projection and the analysis based on this;
An estimate of the ‘backlog of unmet need’; and
A regional breakdown of the principal projection.
Methodology
The method used in this report seeks to predict future ‘unmet need’ (in both the social and
market sectors), while also accounting for other factors that impact on available housing.
Households in housing need are defined as those which:
Have to live as part of someone else’s household;
Have to share a dwelling with another household;
Have insufficient space (overcrowding); or
Are living in a dwelling with defects.
These households form a population with ‘unmet housing needs’.
3
Estimating Total Need and Demand
The main influence on estimates of future housing need and demand is the projection of future
household growth (which is based on predicted demographic change). As the number of
households increases, the housing supply needs to increase accordingly; otherwise the
proportion of the population with unmet housing needs will grow. This is termed ‘newly arising
need’.
In addition to household formation, two other main factors contribute to housing needs and
demands 1 : changes in the number of dwellings used as second homes and in vacant
dwellings. Increases in these lead to a decrease in the number of dwellings available for the
predicted increase in households. Increases in the number of second homes are largely
demand-determined. Changes in the number of vacant dwellings are a function of dwelling
stock increases. Vacant dwellings are likely to rise gradually as a result of the number of
moves within the dwelling stock, and departures from it.
Distinguishing between market and social sectors
The newly arising need for assisted housing (i.e. households unable to afford to rent or buy
adequate housing from their own funds) is estimated by dividing a demographically-based
total between the ‘market’ and ‘social’ sectors.
No method is currently available to estimate the need for social sector housing directly. It has
to be derived from an estimate of the total of all tenures. The division between the market and
social sectors is fundamentally between households able to afford to purchase or rent
adequate housing from their own funds, and those who require assistance. In the present
report, ‘market’ housing is defined as owner-occupied (including shared ownership) or rented
from private owners without Housing Benefit (including renting with a job or business). The
social sector comprises renting from a local housing authority or housing association or from
a private landlord with Housing Benefit.
Estimating future change in market and social sectors – the ageing
model
The overall division between market and social sectors in future years could be estimated by
applying base year proportions (analysed by household type and age) to projected numbers
1 The estimates of future newly arising need and demand for housing in this report are of the net increase. No attempt is made to include offsets to losses from the dwelling stock through demolition or disuse. This is because the information about the numbers is poor. The possibility of a return to policies of demolition and redevelopment during the next two decades cannot usefully be discussed here.
4
of households. There are, however, reasons for querying whether the relationship of housing
tenure to type of household and age in the base year (2011) will remain the same in
subsequent years. With an age distribution such as that in Wales in 2011, the relationship
between housing tenure and type and age is set to change.
Therefore, this analysis estimates the change in the relationship between housing tenure, type
and age using the ‘ageing model’. This model depends on the observed fact that among those
aged mid-40s and older, only low numbers of households move from renting to owner-
occupation (other than by purchase as sitting tenants at reduced prices) and few leave owner-
occupation2. The tenure division among households aged 55-64 in 2011, for example, will be
approximately the division among households aged 65-74 in 2021, and 75-84 in 2031. The
tenure division can be ‘rolled forward’ or ‘aged on’ to predict tenure proportions in future years.
In 2011, the market sector proportion in the 65-74 age group (or cohort) was 85%, and in the
75-84 cohort 84%. In 2021, the 65-74 cohort (in 2011) will have become 75-84 and the market
sector proportion 85%. Ageing will cause the market sector proportion in the 75-84 age group
to rise from 84% to 85% (derived from the 2011 census). Where the proportions of market
sector households reduce with age, the ageing model (which rolls forward the market sector
proportions of households) generates an overall rise in the proportion of households in the
market sector.
The ‘ageing model’ applies to couple households and one person households aged 45 and
over. It cannot be applied to lone parent households, because they are defined as households
represented by a lone parent with one or more dependent children. Dependent children are
aged 15 or under, or 16-18 if in full time education. So by the age at which the ageing model
might apply, children will have ceased to be dependent. The ageing model does not apply
also to ‘other multi-person households’ (i.e. multi-person households that are neither couples
nor lone parent households). These are a heterogeneous group, with market sector
proportions that vary erratically with age. For lone parent households and ‘other multi person
households’, the base year proportions of households in the market and social sectors are
taken to apply in future years as well. The base year proportions of households in the market
2 The ageing model was worked out with household projections for England, and uses the types of household in those projections. It uses the concept of the household representative, who statistically ‘represents’ the household. Households are classified according to the age and sex of the household representative. A couple household aged 65 to 74 is a couple household whose representative, defined according to statistical rules, is aged between 65 and 74. The Welsh official household projections use a ‘household membership’ method, which does not designate any one household member to represent it. To use the ageing model, the household membership data and types of household used in the Welsh official projections have to be converted into households with a household representative or reference person. A method to do this was worked out for the 2006 based household projection and was included in the 2010 report on future need and demand. It has been used without change in this report.
5
and social sectors are also taken to apply to couple households and one person households
under age 45.
Analysis of the Principal Projection
In order to estimate future need and demand, and the split between market and social sectors,
the data need to be analysed to estimate:
The division between market and social sectors in the base year. Categorisation of
households according to age, type and tenure in the base year is used to determine
how the divide between market and social sectors will evolve over the period; and
The age and type of households over the period. For the data to be compatible with
the ageing model, the household projections need to be adapted (i.e. reallocated
according to different household categories and according to age ranges).
The first is used to determine the proportion of households likely to be in market and social
sectors over the period (using the ageing model). The second then enables these proportions
to be applied to the projections of household formation to give estimates of need and demand
over the period.
The distribution between market and social sectors in the base year
As explained, the market sector comprises owner-occupiers (including shared ownership)
other than those who become owner-occupiers by purchasing as sitting tenants from local
housing authorities and other public bodies; and private sector tenants who are not receiving
Housing Benefit. ‘Private sector tenants’ in the statistical sense used here are a broad group
that includes occupiers by virtue of employment, renters with business premises, and rent-
free occupiers. The social sector comprises tenants of local authorities and housing
associations, plus owner-occupiers who came into the tenure by purchasing as sitting tenants
from local authorities and other public bodies (including housing associations), termed for
convenience ‘Right to Buy’ or RTB owner-occupiers; and private sector tenants receiving
Housing Benefit, termed for convenience ‘Housing Benefit’ or HB tenants.
Tables provided by the Office for National Statistics of households’ housing tenure according
to type of household and age of the reference person from the 2011 census were used in
preference to data from the National Survey for Wales (used in Holmans and Monk, 2010).
There is a problem, however, with the census figures for lone parent households. Lone parent
households are defined as comprising one adult and one or more dependent children.
‘Dependent’ here means under school leaving age or, if in full time higher or further education,
6
16 to 18. When children reach these ages, they become non-dependent (technically) and the
household of which they are part becomes an ‘other multi-person household’. The lone parent
is by definition the household reference person. So it is not to be expected that there would
be many people at the higher ages that count as lone parents. Nevertheless, in the census
tables received, 6.4% of all households aged 75-84 were lone parent households. In
household estimates for 2011 based on official household projections for Wales the proportion
is under 1%. Investigating the causes of the census lone parent figures is beyond the scope
of the work reported here. Since they are official census figures, they have to be used in a
census-based division of households between market and social sectors.
Owing to a lack of information about ‘RTB owner-occupiers’ or about ‘HB tenants’ relating to
Wales, figures for owner-occupiers, social sector tenants and private sector tenants are taken
from the English Housing Survey for 2008/09 to 2010/11 on numbers of all owner-occupiers
and RTB owner-occupiers in categories of households defined by age and type 3 . The
calculated ratios were then applied to the Welsh census housing figures in these categories
to obtain estimates of RTB owner-occupiers in Wales. A similar procedure was used for
tenants receiving Housing Benefit.
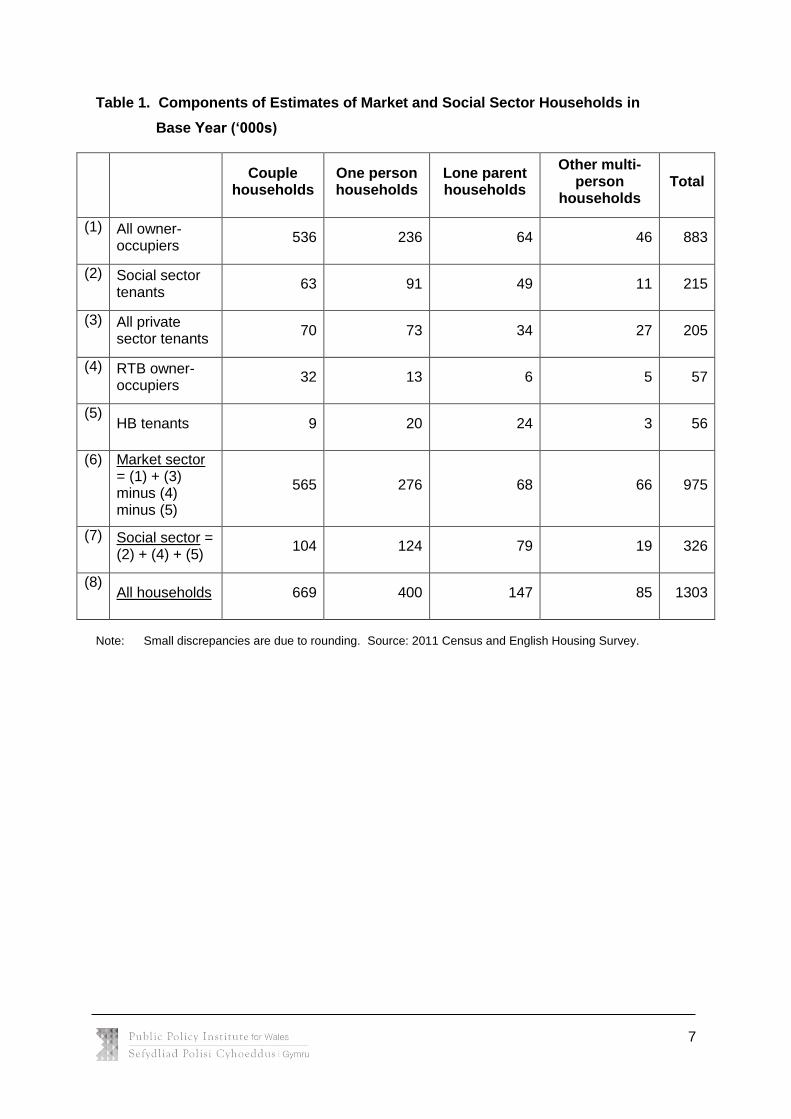
Table 1 shows the composition of the market and social sectors in 2011. Of a total of
1,303,000 households, 113,000 (9%) are transferred from the market to the social sector
through being RTB owner-occupiers or HB tenants. This appears sufficient for there to be a
risk of distortion of comparison between age groups if the number of RTB owner-occupiers
varies erratically. This possibility is looked at for owner-occupier couples and one-person
households. Table 2 shows market sector households as defined as proportions of all
households; and market sector households with RTB owner-occupiers added back.
3 It could be argued that the use of the English Housing Survey 2008/2009 to 2010/2011 data is inappropriate for estimating the recent number of Right to Buy owner occupiers in Wales. This is because Right to Buy Sales have reduced significantly in Wales since 2008 thus assumptions based on continuing trends from 2008 may therefore result in inflated estimates of Right to Buy owner occupiers in Wales (for more details readers are referred to https://statswales.wales.gov.uk/Catalogue/Housing/Social-Housing-Sales/TotalSocialHousingSales-by-Period-SaleType). Similarly, social housing sales in Wales have not followed the same pattern as seen in England, hence use of the English Housing Survey data could once again be called into question (for more details readers are referred to https://www.gov.uk/government/statistical-data-sets/live-tables-on-social-housing-sales). The same is true of estimates of Housing Benefit tenants as it could be speculated that the proportion on housing benefits is higher in Wales than in England.
7
Table 1. Components of Estimates of Market and Social Sector Households in
Base Year (‘000s)
Couple
households One person households
Lone parent households
Other multi-person
households Total
(1) All owner-occupiers
536 236 64 46 883
(2) Social sector tenants
63 91 49 11 215
(3) All private sector tenants
70 73 34 27 205
(4) RTB owner-occupiers
32 13 6 5 57
(5) HB tenants 9 20 24 3 56
(6) Market sector = (1) + (3) minus (4) minus (5)
565 276 68 66 975
(7) Social sector = (2) + (4) + (5)
104 124 79 19 326
(8) All households 669 400 147 85 1303
Note: Small discrepancies are due to rounding. Source: 2011 Census and English Housing Survey.
8
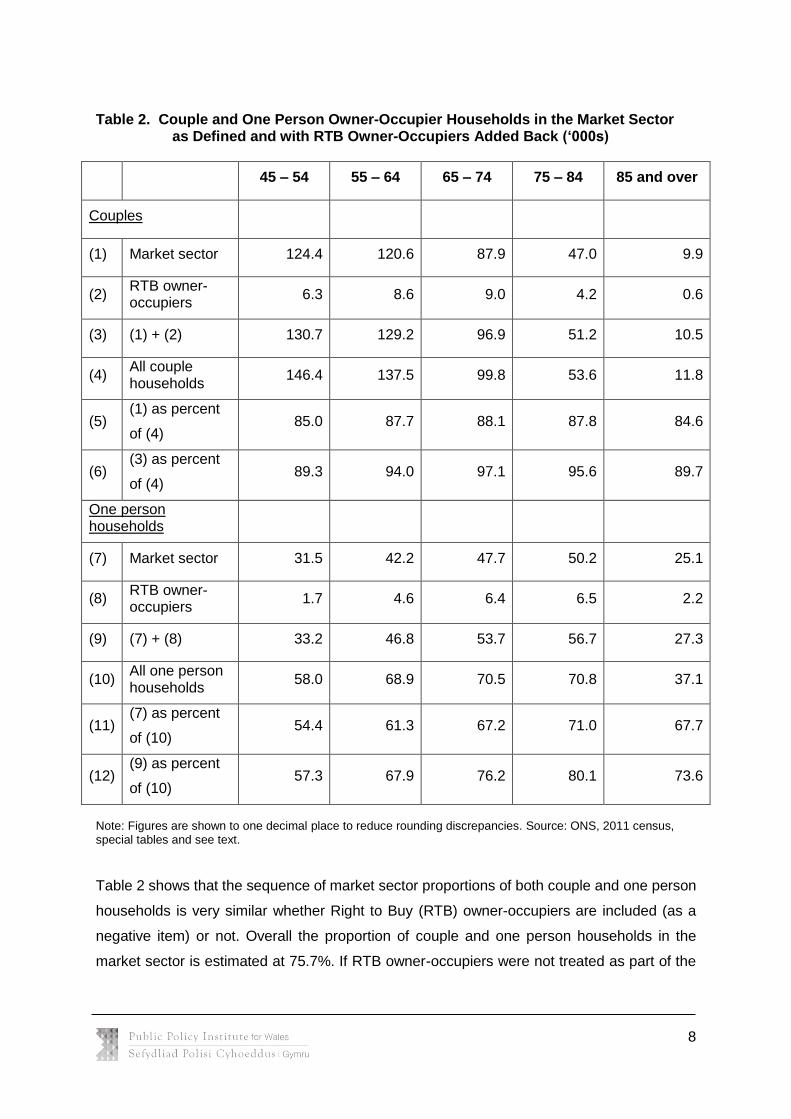
Table 2. Couple and One Person Owner-Occupier Households in the Market Sector as Defined and with RTB Owner-Occupiers Added Back (‘000s)
45 – 54 55 – 64 65 – 74 75 – 84 85 and over
Couples
(1) Market sector 124.4 120.6 87.9 47.0 9.9
(2) RTB owner-occupiers
6.3 8.6 9.0 4.2 0.6
(3) (1) + (2) 130.7 129.2 96.9 51.2 10.5
(4) All couple households
146.4 137.5 99.8 53.6 11.8
(5) (1) as percent
of (4) 85.0 87.7 88.1 87.8 84.6
(6) (3) as percent
of (4) 89.3 94.0 97.1 95.6 89.7
One person households
(7) Market sector 31.5 42.2 47.7 50.2 25.1
(8) RTB owner-occupiers
1.7 4.6 6.4 6.5 2.2
(9) (7) + (8) 33.2 46.8 53.7 56.7 27.3
(10) All one person households
58.0 68.9 70.5 70.8 37.1
(11) (7) as percent
of (10) 54.4 61.3 67.2 71.0 67.7
(12) (9) as percent
of (10) 57.3 67.9 76.2 80.1 73.6
Note: Figures are shown to one decimal place to reduce rounding discrepancies. Source: ONS, 2011 census, special tables and see text.
Table 2 shows that the sequence of market sector proportions of both couple and one person
households is very similar whether Right to Buy (RTB) owner-occupiers are included (as a
negative item) or not. Overall the proportion of couple and one person households in the
market sector is estimated at 75.7%. If RTB owner-occupiers were not treated as part of the
9
market sector, the division of households between the market and social sectors would be
80.2:19.8.
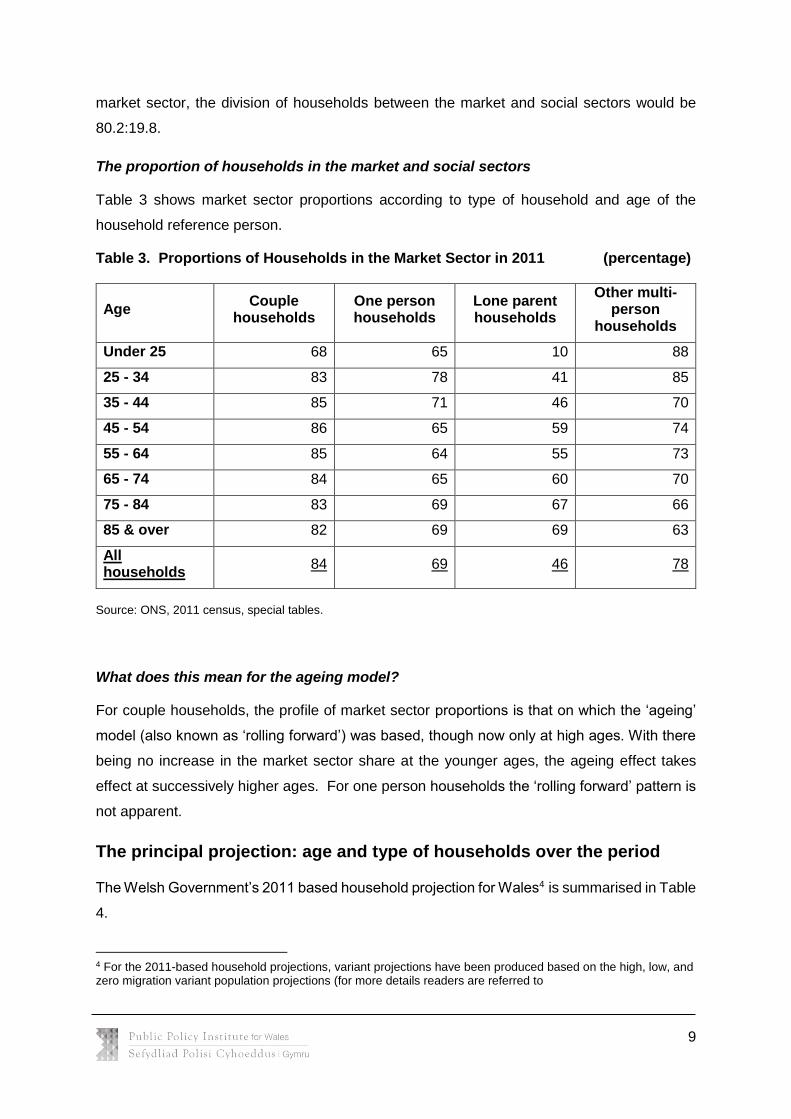
The proportion of households in the market and social sectors
Table 3 shows market sector proportions according to type of household and age of the
household reference person.
Table 3. Proportions of Households in the Market Sector in 2011 (percentage)
Age Couple
households One person households
Lone parent households
Other multi-person
households
Under 25 68 65 10 88
25 - 34 83 78 41 85
35 - 44 85 71 46 70
45 - 54 86 65 59 74
55 - 64 85 64 55 73
65 - 74 84 65 60 70
75 - 84 83 69 67 66
85 & over 82 69 69 63
All households
84 69 46 78
Source: ONS, 2011 census, special tables.
What does this mean for the ageing model?
For couple households, the profile of market sector proportions is that on which the ‘ageing’
model (also known as ‘rolling forward’) was based, though now only at high ages. With there
being no increase in the market sector share at the younger ages, the ageing effect takes
effect at successively higher ages. For one person households the ‘rolling forward’ pattern is
not apparent.
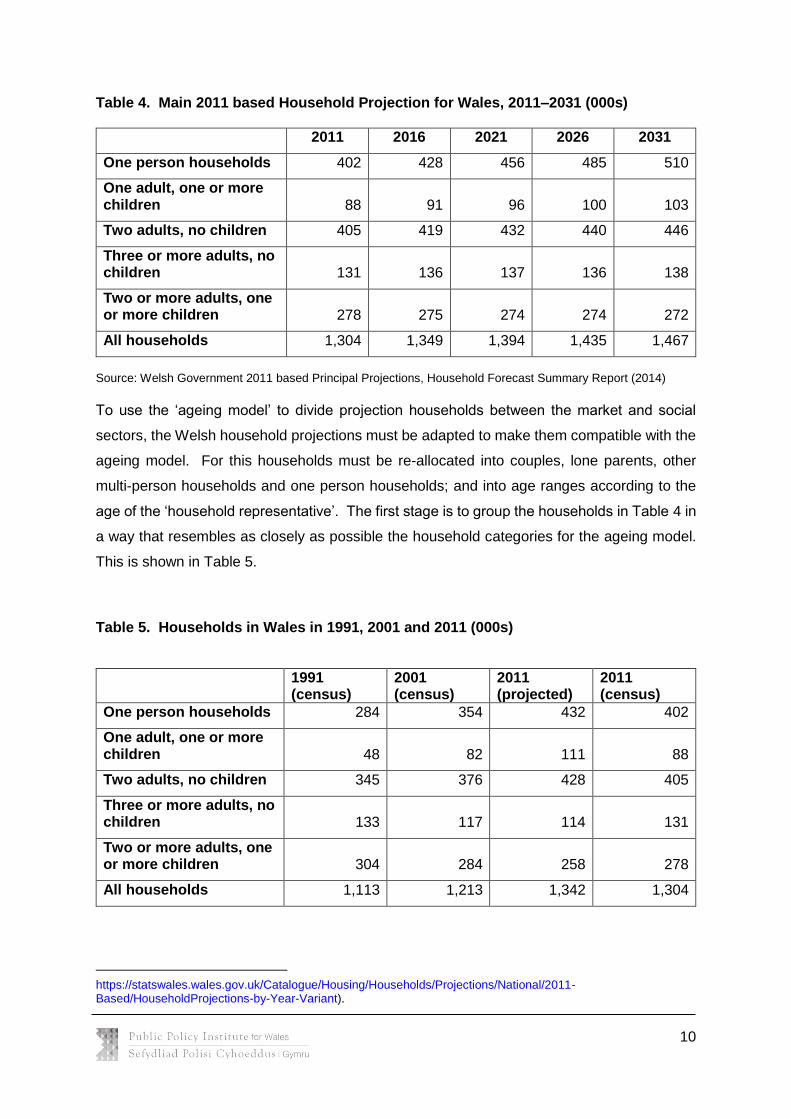
The principal projection: age and type of households over the period
The Welsh Government’s 2011 based household projection for Wales4 is summarised in Table
4.
4 For the 2011-based household projections, variant projections have been produced based on the high, low, and zero migration variant population projections (for more details readers are referred to
10
Table 4. Main 2011 based Household Projection for Wales, 2011–2031 (000s)
2011 2016 2021 2026 2031
One person households 402 428 456 485 510
One adult, one or more children 88 91 96 100 103
Two adults, no children 405 419 432 440 446
Three or more adults, no children 131 136 137 136 138
Two or more adults, one or more children 278 275 274 274 272
All households 1,304 1,349 1,394 1,435 1,467
Source: Welsh Government 2011 based Principal Projections, Household Forecast Summary Report (2014)
To use the ‘ageing model’ to divide projection households between the market and social
sectors, the Welsh household projections must be adapted to make them compatible with the
ageing model. For this households must be re-allocated into couples, lone parents, other
multi-person households and one person households; and into age ranges according to the
age of the ‘household representative’. The first stage is to group the households in Table 4 in
a way that resembles as closely as possible the household categories for the ageing model.
This is shown in Table 5.
Table 5. Households in Wales in 1991, 2001 and 2011 (000s)
1991 (census)
2001 (census)
2011 (projected)
2011 (census)
One person households 284 354 432 402
One adult, one or more children 48 82 111 88
Two adults, no children 345 376 428 405
Three or more adults, no children 133 117 114 131
Two or more adults, one or more children 304 284 258 278
All households 1,113 1,213 1,342 1,304
https://statswales.wales.gov.uk/Catalogue/Housing/Households/Projections/National/2011-Based/HouseholdProjections-by-Year-Variant).
11
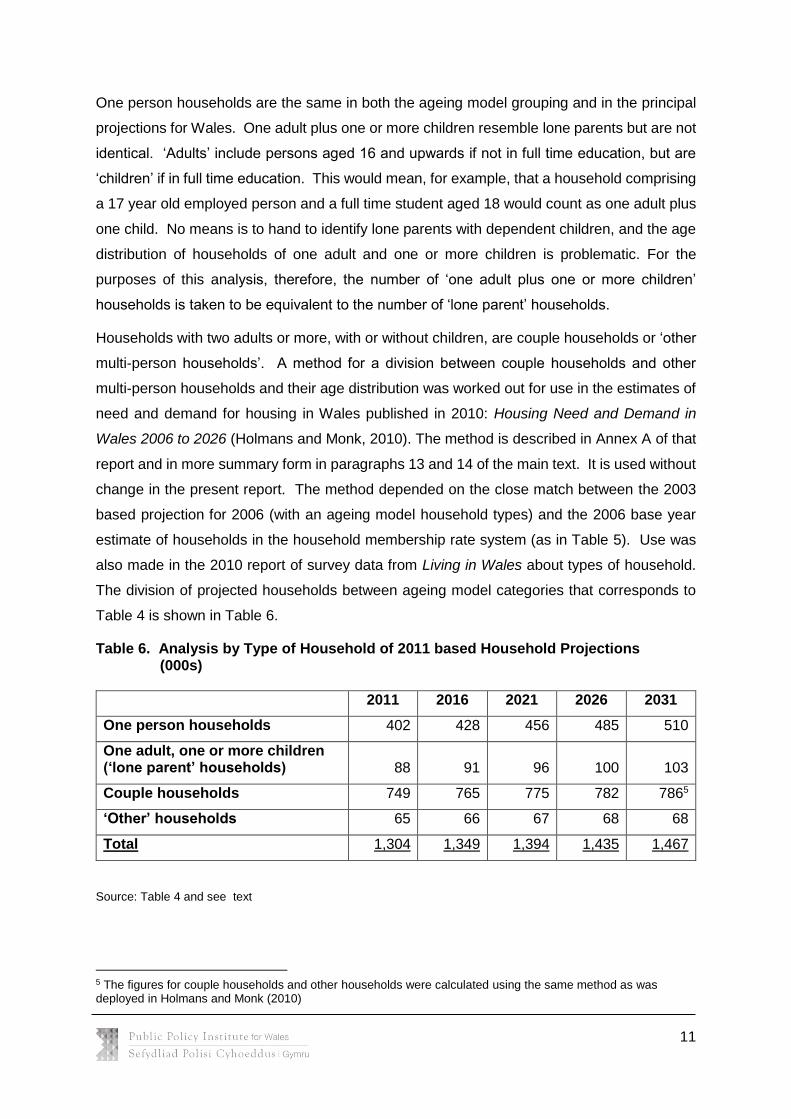
One person households are the same in both the ageing model grouping and in the principal
projections for Wales. One adult plus one or more children resemble lone parents but are not
identical. ‘Adults’ include persons aged 16 and upwards if not in full time education, but are
‘children’ if in full time education. This would mean, for example, that a household comprising
a 17 year old employed person and a full time student aged 18 would count as one adult plus
one child. No means is to hand to identify lone parents with dependent children, and the age
distribution of households of one adult and one or more children is problematic. For the
purposes of this analysis, therefore, the number of ‘one adult plus one or more children’
households is taken to be equivalent to the number of ‘lone parent’ households.
Households with two adults or more, with or without children, are couple households or ‘other
multi-person households’. A method for a division between couple households and other
multi-person households and their age distribution was worked out for use in the estimates of
need and demand for housing in Wales published in 2010: Housing Need and Demand in
Wales 2006 to 2026 (Holmans and Monk, 2010). The method is described in Annex A of that
report and in more summary form in paragraphs 13 and 14 of the main text. It is used without
change in the present report. The method depended on the close match between the 2003
based projection for 2006 (with an ageing model household types) and the 2006 base year
estimate of households in the household membership rate system (as in Table 5). Use was
also made in the 2010 report of survey data from Living in Wales about types of household.
The division of projected households between ageing model categories that corresponds to
Table 4 is shown in Table 6.
Table 6. Analysis by Type of Household of 2011 based Household Projections (000s)
2011 2016 2021 2026 2031
One person households 402 428 456 485 510
One adult, one or more children (‘lone parent’ households) 88 91 96 100 103
Couple households 749 765 775 782 7865
‘Other’ households 65 66 67 68 68
Total 1,304 1,349 1,394 1,435 1,467
Source: Table 4 and see text
5 The figures for couple households and other households were calculated using the same method as was deployed in Holmans and Monk (2010)
12
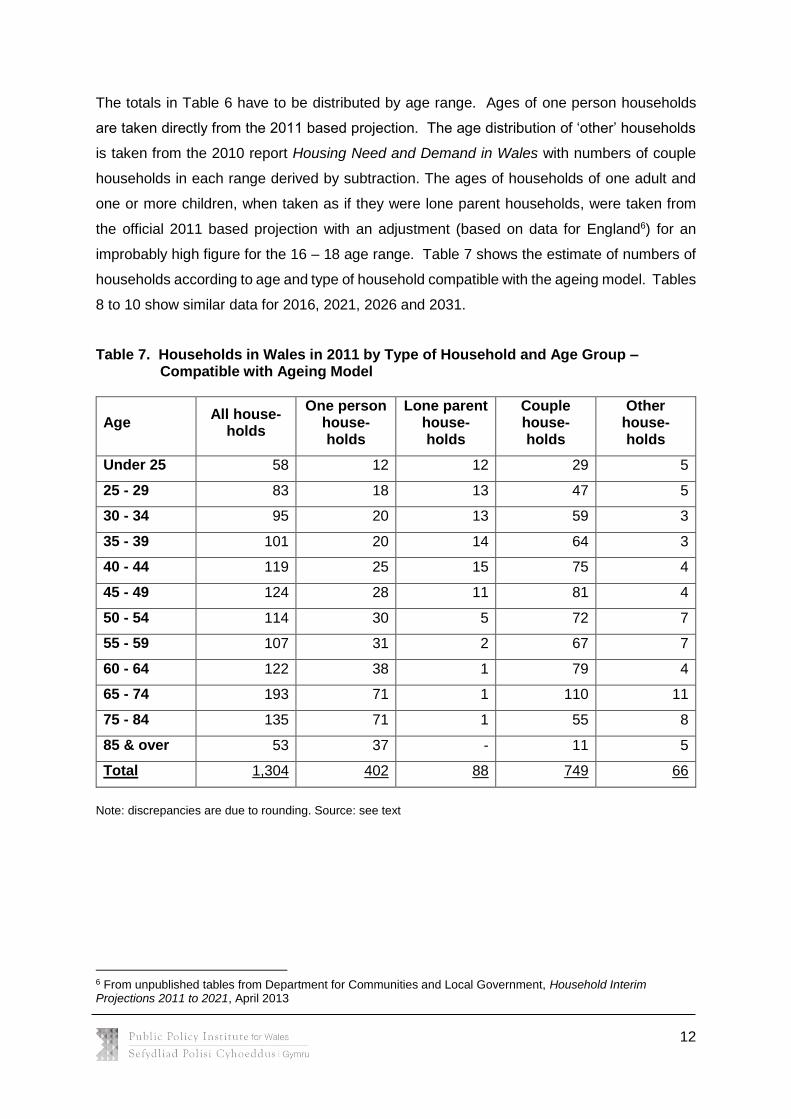
The totals in Table 6 have to be distributed by age range. Ages of one person households
are taken directly from the 2011 based projection. The age distribution of ‘other’ households
is taken from the 2010 report Housing Need and Demand in Wales with numbers of couple
households in each range derived by subtraction. The ages of households of one adult and
one or more children, when taken as if they were lone parent households, were taken from
the official 2011 based projection with an adjustment (based on data for England6) for an
improbably high figure for the 16 – 18 age range. Table 7 shows the estimate of numbers of
households according to age and type of household compatible with the ageing model. Tables
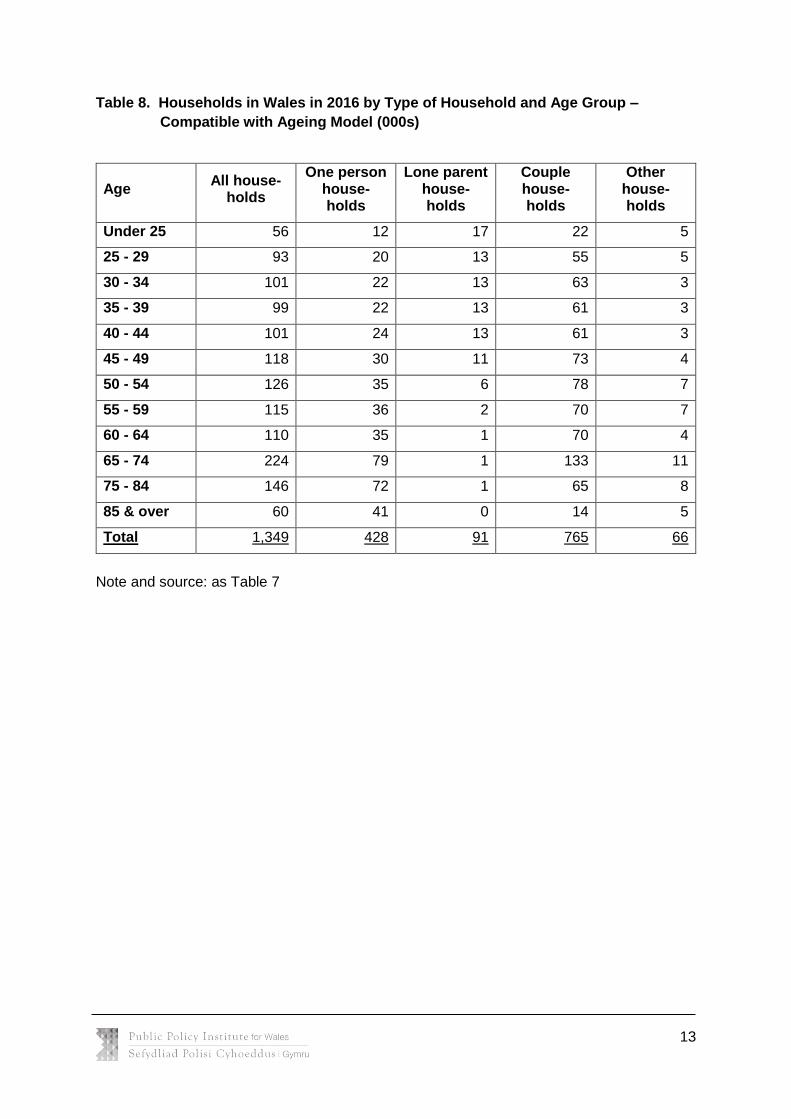
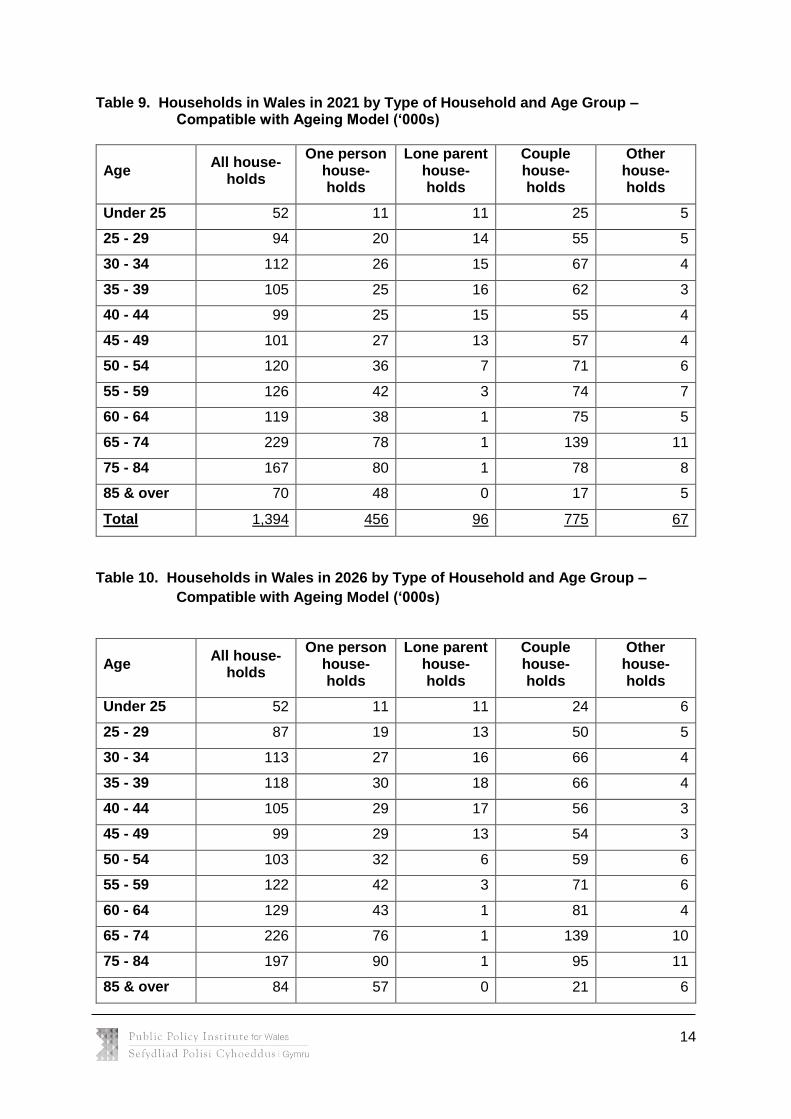
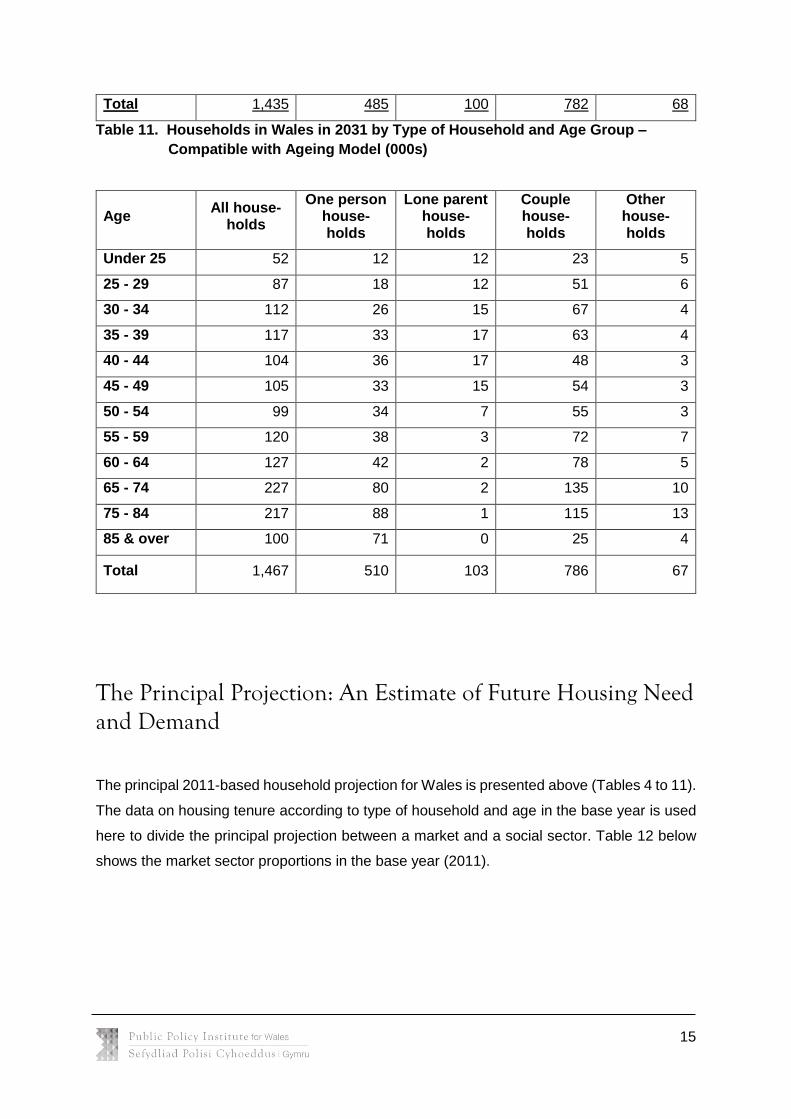
8 to 10 show similar data for 2016, 2021, 2026 and 2031.
Table 7. Households in Wales in 2011 by Type of Household and Age Group – Compatible with Ageing Model
Age All house-
holds
One person house-holds
Lone parent house-holds
Couple house-holds
Other house-holds
Under 25 58 12 12 29 5
25 - 29 83 18 13 47 5
30 - 34 95 20 13 59 3
35 - 39 101 20 14 64 3
40 - 44 119 25 15 75 4
45 - 49 124 28 11 81 4
50 - 54 114 30 5 72 7
55 - 59 107 31 2 67 7
60 - 64 122 38 1 79 4
65 - 74 193 71 1 110 11
75 - 84 135 71 1 55 8
85 & over 53 37 - 11 5
Total 1,304 402 88 749 66
Note: discrepancies are due to rounding. Source: see text
6 From unpublished tables from Department for Communities and Local Government, Household Interim Projections 2011 to 2021, April 2013
13
Table 8. Households in Wales in 2016 by Type of Household and Age Group –
Compatible with Ageing Model (000s)
Age All house-
holds
One person house-holds
Lone parent house-holds
Couple house-holds
Other house-holds
Under 25 56 12 17 22 5
25 - 29 93 20 13 55 5
30 - 34 101 22 13 63 3
35 - 39 99 22 13 61 3
40 - 44 101 24 13 61 3
45 - 49 118 30 11 73 4
50 - 54 126 35 6 78 7
55 - 59 115 36 2 70 7
60 - 64 110 35 1 70 4
65 - 74 224 79 1 133 11
75 - 84 146 72 1 65 8
85 & over 60 41 0 14 5
Total 1,349 428 91 765 66
Note and source: as Table 7
14
Table 9. Households in Wales in 2021 by Type of Household and Age Group – Compatible with Ageing Model (‘000s)
Age All house-
holds
One person house-holds
Lone parent house-holds
Couple house-holds
Other house-holds
Under 25 52 11 11 25 5
25 - 29 94 20 14 55 5
30 - 34 112 26 15 67 4
35 - 39 105 25 16 62 3
40 - 44 99 25 15 55 4
45 - 49 101 27 13 57 4
50 - 54 120 36 7 71 6
55 - 59 126 42 3 74 7
60 - 64 119 38 1 75 5
65 - 74 229 78 1 139 11
75 - 84 167 80 1 78 8
85 & over 70 48 0 17 5
Total 1,394 456 96 775 67
Table 10. Households in Wales in 2026 by Type of Household and Age Group –
Compatible with Ageing Model (‘000s)
Age All house-
holds
One person house-holds
Lone parent house-holds
Couple house-holds
Other house-holds
Under 25 52 11 11 24 6
25 - 29 87 19 13 50 5
30 - 34 113 27 16 66 4
35 - 39 118 30 18 66 4
40 - 44 105 29 17 56 3
45 - 49 99 29 13 54 3
50 - 54 103 32 6 59 6
55 - 59 122 42 3 71 6
60 - 64 129 43 1 81 4
65 - 74 226 76 1 139 10
75 - 84 197 90 1 95 11
85 & over 84 57 0 21 6
15
Total 1,435 485 100 782 68
Table 11. Households in Wales in 2031 by Type of Household and Age Group –
Compatible with Ageing Model (000s)
Age All house-
holds
One person house-holds
Lone parent house-holds
Couple house-holds
Other house-holds
Under 25 52 12 12 23 5
25 - 29 87 18 12 51 6
30 - 34 112 26 15 67 4
35 - 39 117 33 17 63 4
40 - 44 104 36 17 48 3
45 - 49 105 33 15 54 3
50 - 54 99 34 7 55 3
55 - 59 120 38 3 72 7
60 - 64 127 42 2 78 5
65 - 74 227 80 2 135 10
75 - 84 217 88 1 115 13
85 & over 100 71 0 25 4
Total 1,467 510 103 786 67
The Principal Projection: An Estimate of Future Housing Need and Demand
The principal 2011-based household projection for Wales is presented above (Tables 4 to 11).
The data on housing tenure according to type of household and age in the base year is used
here to divide the principal projection between a market and a social sector. Table 12 below
shows the market sector proportions in the base year (2011).
16
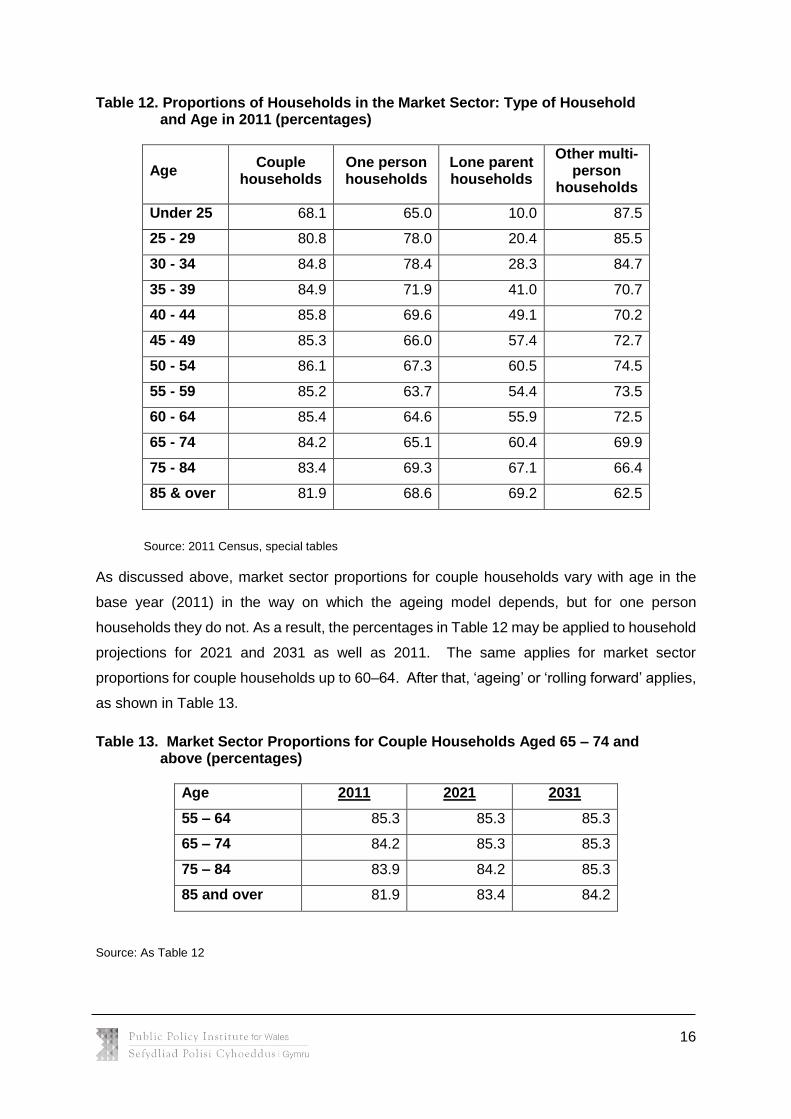
Table 12. Proportions of Households in the Market Sector: Type of Household and Age in 2011 (percentages)
Age Couple
households One person households
Lone parent households
Other multi-person
households
Under 25 68.1 65.0 10.0 87.5
25 - 29 80.8 78.0 20.4 85.5
30 - 34 84.8 78.4 28.3 84.7
35 - 39 84.9 71.9 41.0 70.7
40 - 44 85.8 69.6 49.1 70.2
45 - 49 85.3 66.0 57.4 72.7
50 - 54 86.1 67.3 60.5 74.5
55 - 59 85.2 63.7 54.4 73.5
60 - 64 85.4 64.6 55.9 72.5
65 - 74 84.2 65.1 60.4 69.9
75 - 84 83.4 69.3 67.1 66.4
85 & over 81.9 68.6 69.2 62.5
Source: 2011 Census, special tables
As discussed above, market sector proportions for couple households vary with age in the
base year (2011) in the way on which the ageing model depends, but for one person
households they do not. As a result, the percentages in Table 12 may be applied to household
projections for 2021 and 2031 as well as 2011. The same applies for market sector
proportions for couple households up to 60–64. After that, ‘ageing’ or ‘rolling forward’ applies,
as shown in Table 13.
Table 13. Market Sector Proportions for Couple Households Aged 65 – 74 and above (percentages)
Age 2011 2021 2031
55 – 64 85.3 85.3 85.3
65 – 74 84.2 85.3 85.3
75 – 84 83.9 84.2 85.3
85 and over 81.9 83.4 84.2
Source: As Table 12

17
The proportions in Tables 12 and 13 are applied to the households in Tables 7, 9 and 11. The
division of the principal projection between the market and social sectors produced in this way
is shown in Table 14.
Table 14. Projected Division of Households between Market and Social Sectors
in 2011 to 2031: Principal Projection (‘000s)
Couple house-holds
One person house-holds
Lone parent house-holds
Other multi-
person house-holds
All house-holds
2011
Market sector 627 273 33 48 981
Social sector 122 129 55 17 323
Total 749 402 88 65 1,304
2021
Market sector 651 311 38 49 1049
Social sector 124 145 58 18 345
Total 775 456 96 67 1,394
2031
Market sector 664 348 40 47 1099
Social sector 122 162 63 21 368
Total 786 510 103 68 1,467
Source: Tables 7, 9 and 10 and see text. There are differences of 1 from Tables 7 and 10 due to elimination of
rounding discrepancies.
Part of the increase in the number of couple households in the market sector is due to the
effect of ageing, expressed in the ‘rolling forward’ of market sector shares.
18
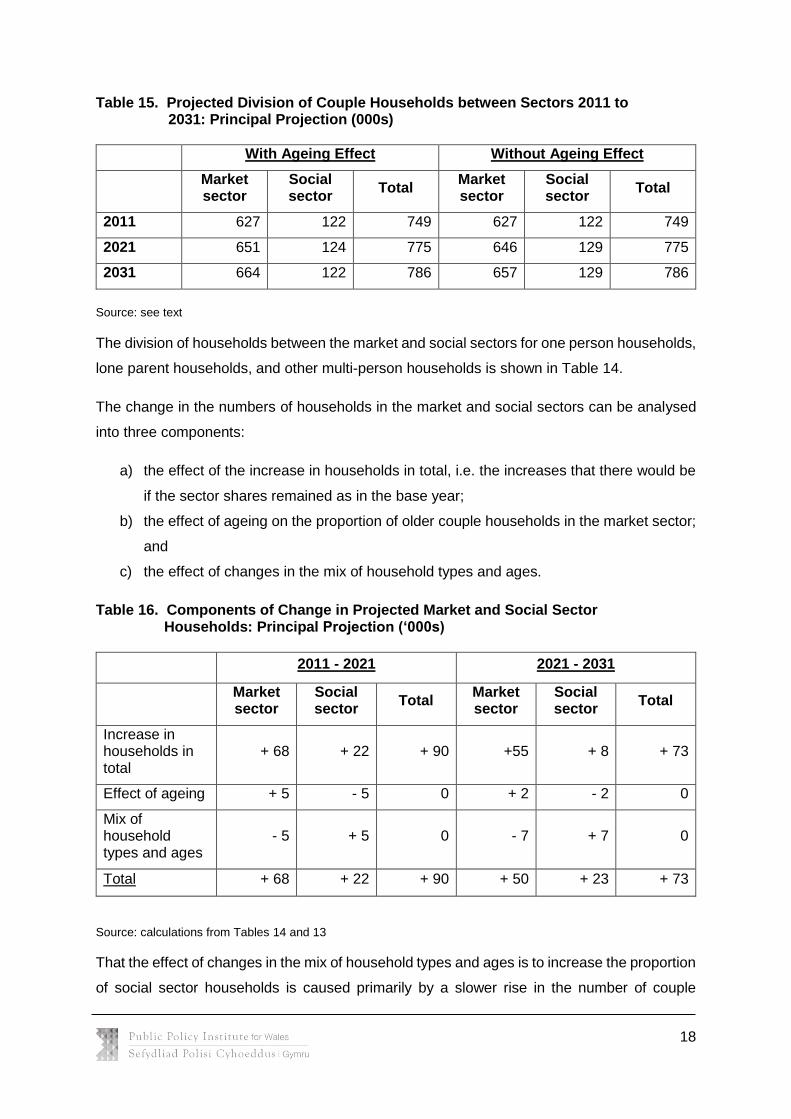
Table 15. Projected Division of Couple Households between Sectors 2011 to 2031: Principal Projection (000s)
With Ageing Effect Without Ageing Effect
Market sector
Social sector
Total Market sector
Social sector
Total
2011 627 122 749 627 122 749
2021 651 124 775 646 129 775
2031 664 122 786 657 129 786
Source: see text
The division of households between the market and social sectors for one person households,
lone parent households, and other multi-person households is shown in Table 14.
The change in the numbers of households in the market and social sectors can be analysed
into three components:
a) the effect of the increase in households in total, i.e. the increases that there would be
if the sector shares remained as in the base year;
b) the effect of ageing on the proportion of older couple households in the market sector;
and
c) the effect of changes in the mix of household types and ages.
Table 16. Components of Change in Projected Market and Social Sector Households: Principal Projection (‘000s)
2011 - 2021 2021 - 2031
Market sector
Social sector
Total Market sector
Social sector
Total
Increase in households in total
+ 68 + 22 + 90 +55 + 8 + 73
Effect of ageing + 5 - 5 0 + 2 - 2 0
Mix of household types and ages
- 5 + 5 0 - 7 + 7 0
Total + 68 + 22 + 90 + 50 + 23 + 73
Source: calculations from Tables 14 and 13
That the effect of changes in the mix of household types and ages is to increase the proportion
of social sector households is caused primarily by a slower rise in the number of couple
19
households, particularly between 2021 and 2031. Couple households have the highest
proportion of households in the market sector. They comprise 57.4% of all households in 2011,
55.6% in 2021, and 53.6% in 2031.
The projected net increases of 118,000 households in the market sector and 45,000 in the
social sector are the central core of the estimate of the net addition to the housing stock
required to meet future need and demand for housing in Wales, as derived from the Welsh
Government’s official 2011 based household projections.
The other components are: (a) second homes and other secondary residences; (b) an
increase in vacant dwellings to maintain a margin for mobility; and (c) an offset to the loss of
re-lets in the social sector stock caused by historical ‘sitting tenant’ sales. If these dwellings
had remained in the social sector stock, there would have been a vacancy for letting to a new
tenant. For secondary residences and vacant dwellings, the same figures have to be used as
in the previous 2010 estimates (Holmans and Monk 2010). The data source used then,
Council Tax information, is no longer available. The 2011 census data on residents of Wales
with a second address, divided into addresses within the United Kingdom and outside it, are
of no use; there are not even specific figures for addresses in Wales. In the absence of fresh
information, the figure used in the 2010 report of 30,000 for the offset for ‘lost’ re-lets is shaded
down to 25,000 in the two decades as the number of Right to Buy owner-occupiers in the
population declines.
20
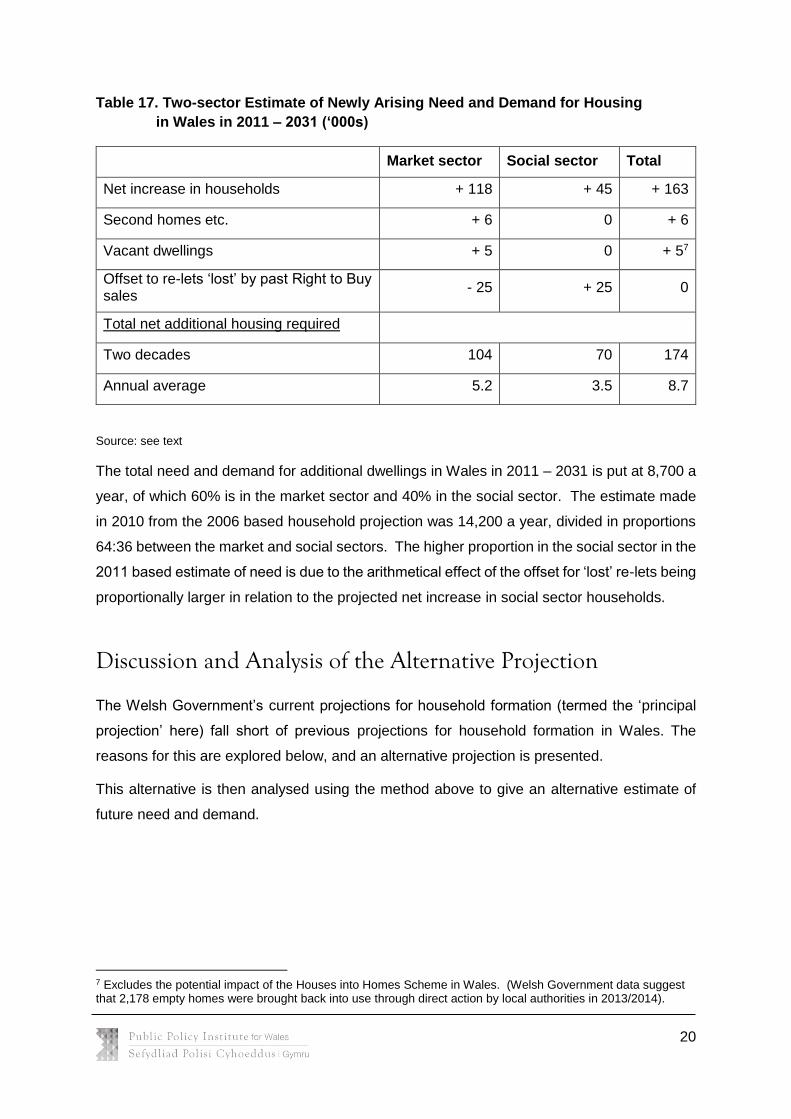
Table 17. Two-sector Estimate of Newly Arising Need and Demand for Housing
in Wales in 2011 – 2031 (‘000s)
Market sector Social sector Total
Net increase in households + 118 + 45 + 163
Second homes etc. + 6 0 + 6
Vacant dwellings + 5 0 + 57
Offset to re-lets ‘lost’ by past Right to Buy sales
- 25 + 25 0
Total net additional housing required
Two decades 104 70 174
Annual average 5.2 3.5 8.7
Source: see text
The total need and demand for additional dwellings in Wales in 2011 – 2031 is put at 8,700 a
year, of which 60% is in the market sector and 40% in the social sector. The estimate made
in 2010 from the 2006 based household projection was 14,200 a year, divided in proportions
64:36 between the market and social sectors. The higher proportion in the social sector in the
2011 based estimate of need is due to the arithmetical effect of the offset for ‘lost’ re-lets being
proportionally larger in relation to the projected net increase in social sector households.
Discussion and Analysis of the Alternative Projection
The Welsh Government’s current projections for household formation (termed the ‘principal
projection’ here) fall short of previous projections for household formation in Wales. The
reasons for this are explored below, and an alternative projection is presented.
This alternative is then analysed using the method above to give an alternative estimate of
future need and demand.
7 Excludes the potential impact of the Houses into Homes Scheme in Wales. (Welsh Government data suggest that 2,178 empty homes were brought back into use through direct action by local authorities in 2013/2014).
21
The rationale behind the consideration of an alternative projection
A critique of the principal projection
The current principal projection for household formation is a two-point projection. That is to
say, it depends on two data points – the 2001 and 2011 censuses – to specify the changes
that are projected in the future. Changes before 2001 do not enter into the projection of
changes post 2011.
This is significant because the changes in the total and mix of households between 2001 and
2011 were very different from 1991 – 2001 and earlier. Before 2001, there was a rising trend
in household membership rates; between 2001 and 2011 they were well below this trend.
Based on the previous rate of growth (from 1981 to 2001) the number of households in 2011
was expected to be 1,342,000. In fact, the 2011 census revealed that there were 38,000 fewer
than this (see Table 18).
Assuming that the rate of growth seen between 2001 and 2011 censuses will persist implies
that the influences that caused the departure from previous trends will continue throughout
the projection period. This is a strong assumption. The causes of the lower than previously
projected household membership rates are hard to ascertain; but a comparison of the previous
and current projections suggests that some of the influences might be temporary (see below)8.
8 In addition to temporary influences not reflected in earlier trends (such as the economic situation), other less transitory factors may have impacted on household composition during this period. The number of university students and the type of student accommodation provided could affect the number of multi-adult households at younger ages. Increasing life expectancy among men and convergence in life expectancy between men and women may lead to an increase in couple households in older age groups and fewer lone person households. However, this has to be balanced against an increasing rate of divorce and separation amongst older age groups.
22
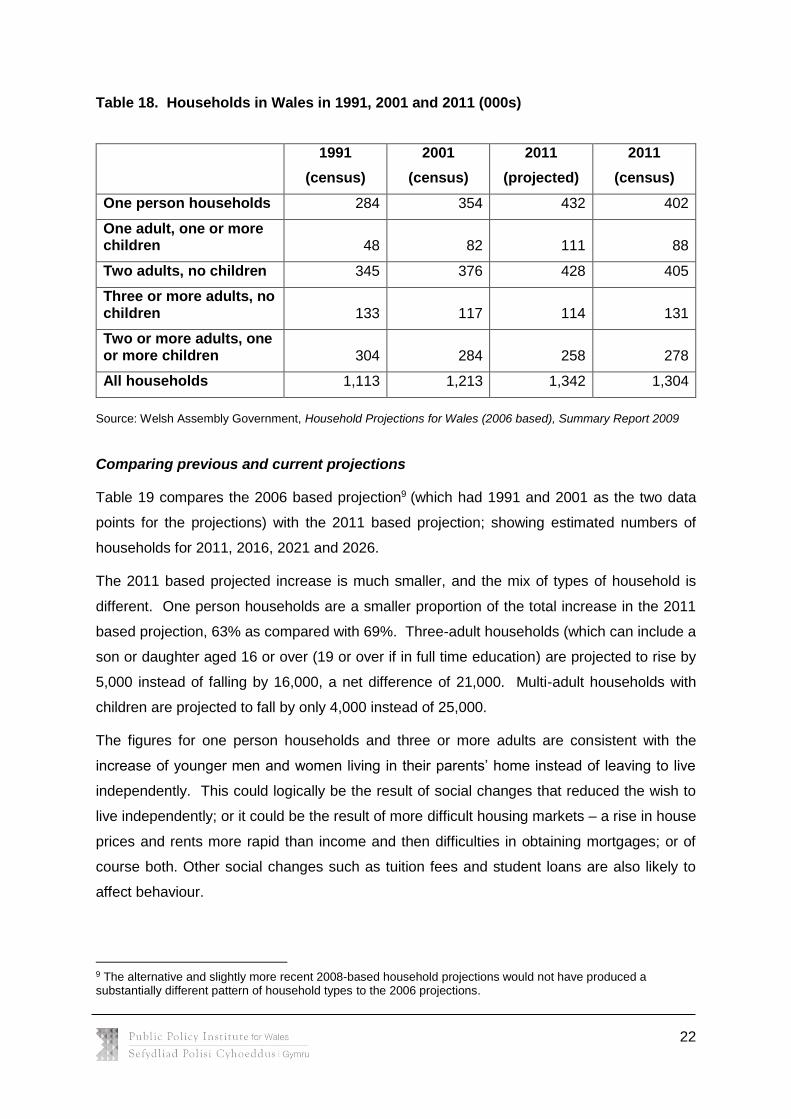
Table 18. Households in Wales in 1991, 2001 and 2011 (000s)
1991
(census)
2001
(census)
2011
(projected)
2011
(census)
One person households 284 354 432 402
One adult, one or more children 48 82 111 88
Two adults, no children 345 376 428 405
Three or more adults, no children 133 117 114 131
Two or more adults, one or more children 304 284 258 278
All households 1,113 1,213 1,342 1,304
Source: Welsh Assembly Government, Household Projections for Wales (2006 based), Summary Report 2009
Comparing previous and current projections
Table 19 compares the 2006 based projection9 (which had 1991 and 2001 as the two data
points for the projections) with the 2011 based projection; showing estimated numbers of
households for 2011, 2016, 2021 and 2026.
The 2011 based projected increase is much smaller, and the mix of types of household is
different. One person households are a smaller proportion of the total increase in the 2011
based projection, 63% as compared with 69%. Three-adult households (which can include a
son or daughter aged 16 or over (19 or over if in full time education) are projected to rise by
5,000 instead of falling by 16,000, a net difference of 21,000. Multi-adult households with
children are projected to fall by only 4,000 instead of 25,000.
The figures for one person households and three or more adults are consistent with the
increase of younger men and women living in their parents’ home instead of leaving to live
independently. This could logically be the result of social changes that reduced the wish to
live independently; or it could be the result of more difficult housing markets – a rise in house
prices and rents more rapid than income and then difficulties in obtaining mortgages; or of
course both. Other social changes such as tuition fees and student loans are also likely to
affect behaviour.
9 The alternative and slightly more recent 2008-based household projections would not have produced a substantially different pattern of household types to the 2006 projections.
23
There are thus reasons why the abrupt change of trend in household formation might be in
part at least due to causes that could be transitory. Before 2001, the rising trend in household
formation appears to have been well established. But because the Welsh official household
projections are two point projections, the course of household formation before 2001 can make
no difference at all to the 2011 based projection. It is therefore considered useful to look at
an alternative projection which, on the basis of the pre-2001 rising trend not having been
completely extinguished, will in time reappear in an attenuated form.
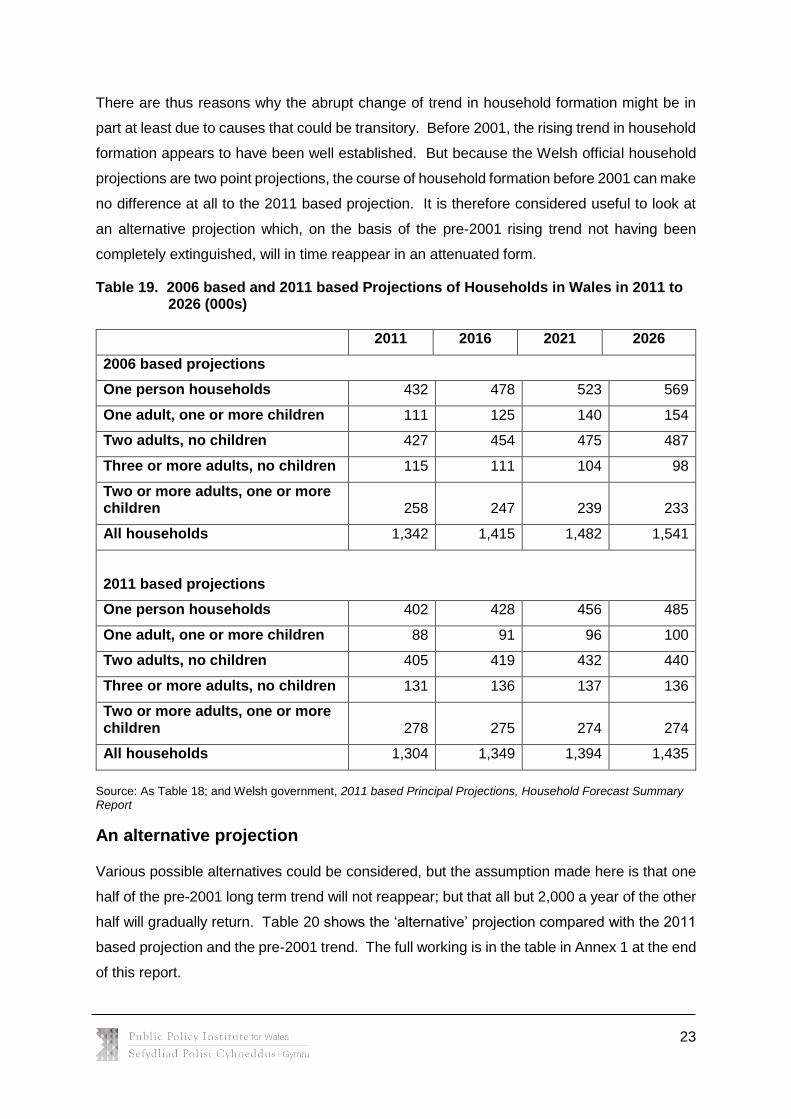
Table 19. 2006 based and 2011 based Projections of Households in Wales in 2011 to 2026 (000s)
2011 2016 2021 2026
2006 based projections
One person households 432 478 523 569
One adult, one or more children 111 125 140 154
Two adults, no children 427 454 475 487
Three or more adults, no children 115 111 104 98
Two or more adults, one or more children 258 247 239 233
All households 1,342 1,415 1,482 1,541
2011 based projections
One person households 402 428 456 485
One adult, one or more children 88 91 96 100
Two adults, no children 405 419 432 440
Three or more adults, no children 131 136 137 136
Two or more adults, one or more children 278 275 274 274
All households 1,304 1,349 1,394 1,435
Source: As Table 18; and Welsh government, 2011 based Principal Projections, Household Forecast Summary Report
An alternative projection
Various possible alternatives could be considered, but the assumption made here is that one
half of the pre-2001 long term trend will not reappear; but that all but 2,000 a year of the other
half will gradually return. Table 20 shows the ‘alternative’ projection compared with the 2011
based projection and the pre-2001 trend. The full working is in the table in Annex 1 at the end
of this report.
24
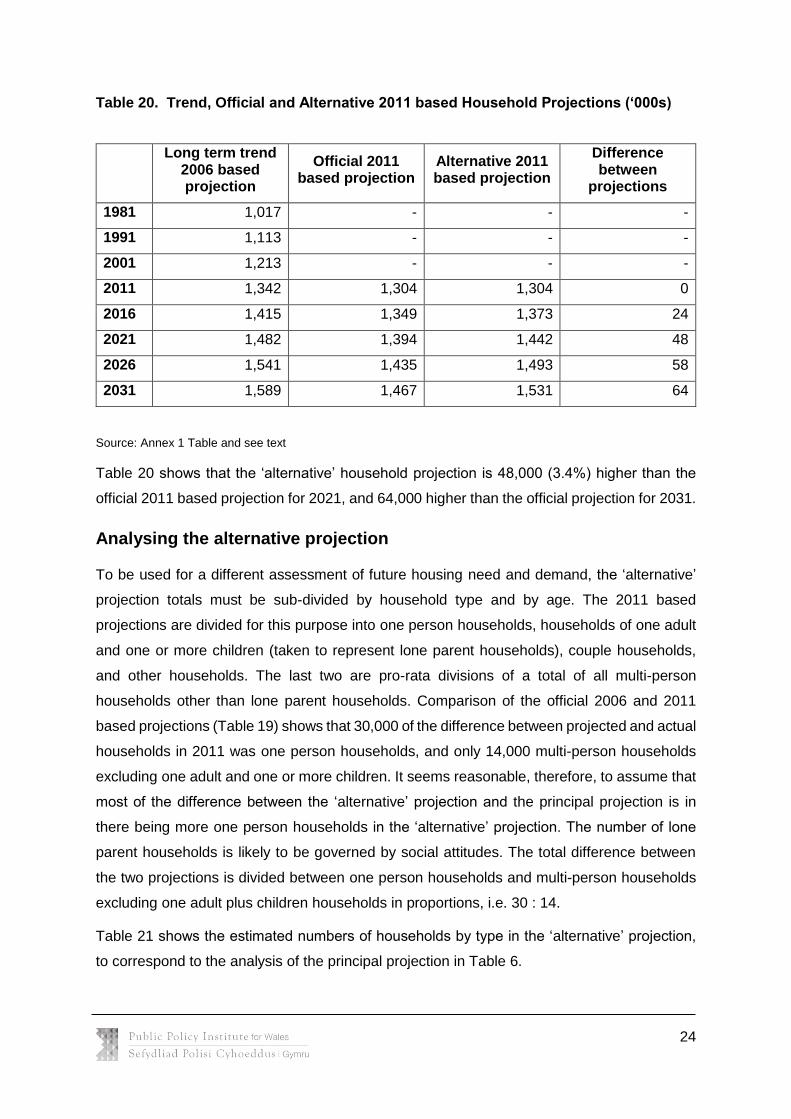
Table 20. Trend, Official and Alternative 2011 based Household Projections (‘000s)
Long term trend
2006 based projection
Official 2011 based projection
Alternative 2011 based projection
Difference between
projections
1981 1,017 - - -
1991 1,113 - - -
2001 1,213 - - -
2011 1,342 1,304 1,304 0
2016 1,415 1,349 1,373 24
2021 1,482 1,394 1,442 48
2026 1,541 1,435 1,493 58
2031 1,589 1,467 1,531 64
Source: Annex 1 Table and see text
Table 20 shows that the ‘alternative’ household projection is 48,000 (3.4%) higher than the
official 2011 based projection for 2021, and 64,000 higher than the official projection for 2031.
Analysing the alternative projection
To be used for a different assessment of future housing need and demand, the ‘alternative’
projection totals must be sub-divided by household type and by age. The 2011 based
projections are divided for this purpose into one person households, households of one adult
and one or more children (taken to represent lone parent households), couple households,
and other households. The last two are pro-rata divisions of a total of all multi-person
households other than lone parent households. Comparison of the official 2006 and 2011
based projections (Table 19) shows that 30,000 of the difference between projected and actual
households in 2011 was one person households, and only 14,000 multi-person households
excluding one adult and one or more children. It seems reasonable, therefore, to assume that
most of the difference between the ‘alternative’ projection and the principal projection is in
there being more one person households in the ‘alternative’ projection. The number of lone
parent households is likely to be governed by social attitudes. The total difference between
the two projections is divided between one person households and multi-person households
excluding one adult plus children households in proportions, i.e. 30 : 14.
Table 21 shows the estimated numbers of households by type in the ‘alternative’ projection,
to correspond to the analysis of the principal projection in Table 6.
25
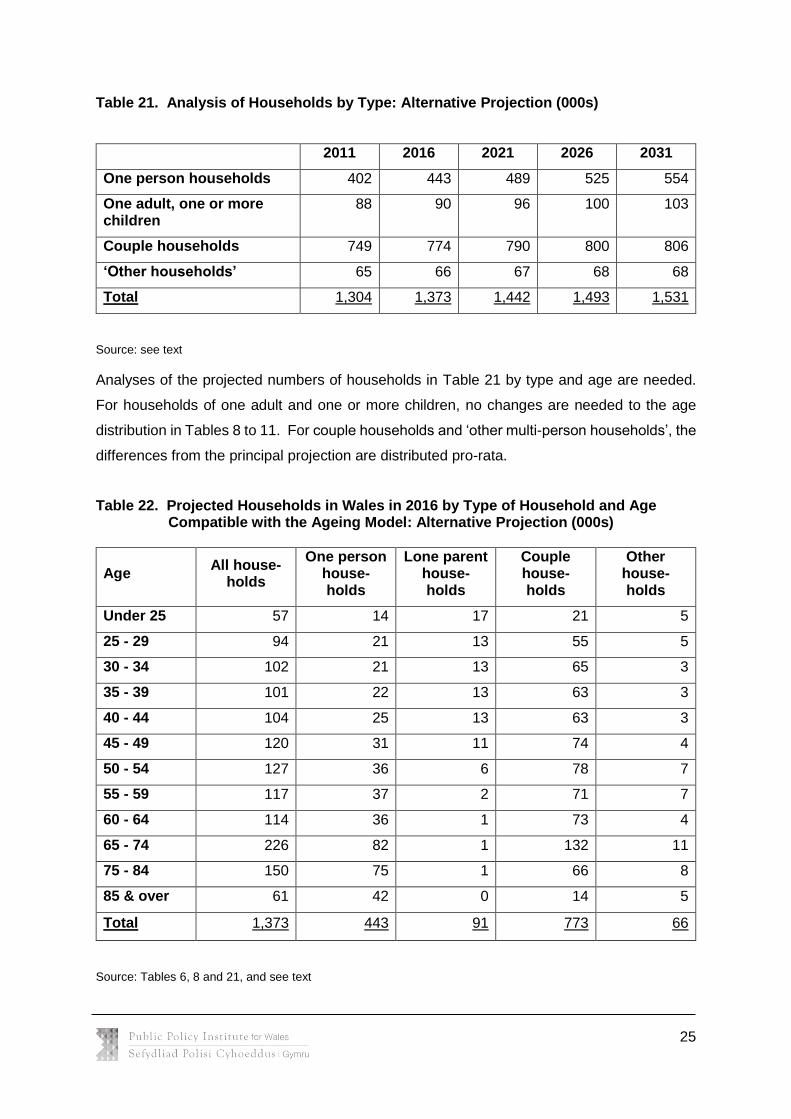
Table 21. Analysis of Households by Type: Alternative Projection (000s)
2011 2016 2021 2026 2031
One person households 402 443 489 525 554
One adult, one or more children
88 90 96 100 103
Couple households 749 774 790 800 806
‘Other households’ 65 66 67 68 68
Total 1,304 1,373 1,442 1,493 1,531
Source: see text
Analyses of the projected numbers of households in Table 21 by type and age are needed.
For households of one adult and one or more children, no changes are needed to the age
distribution in Tables 8 to 11. For couple households and ‘other multi-person households’, the
differences from the principal projection are distributed pro-rata.
Table 22. Projected Households in Wales in 2016 by Type of Household and Age Compatible with the Ageing Model: Alternative Projection (000s)
Age All house-
holds
One person house-holds
Lone parent house-holds
Couple house-holds
Other house-holds
Under 25 57 14 17 21 5
25 - 29 94 21 13 55 5
30 - 34 102 21 13 65 3
35 - 39 101 22 13 63 3
40 - 44 104 25 13 63 3
45 - 49 120 31 11 74 4
50 - 54 127 36 6 78 7
55 - 59 117 37 2 71 7
60 - 64 114 36 1 73 4
65 - 74 226 82 1 132 11
75 - 84 150 75 1 66 8
85 & over 61 42 0 14 5
Total 1,373 443 91 773 66
Source: Tables 6, 8 and 21, and see text
26
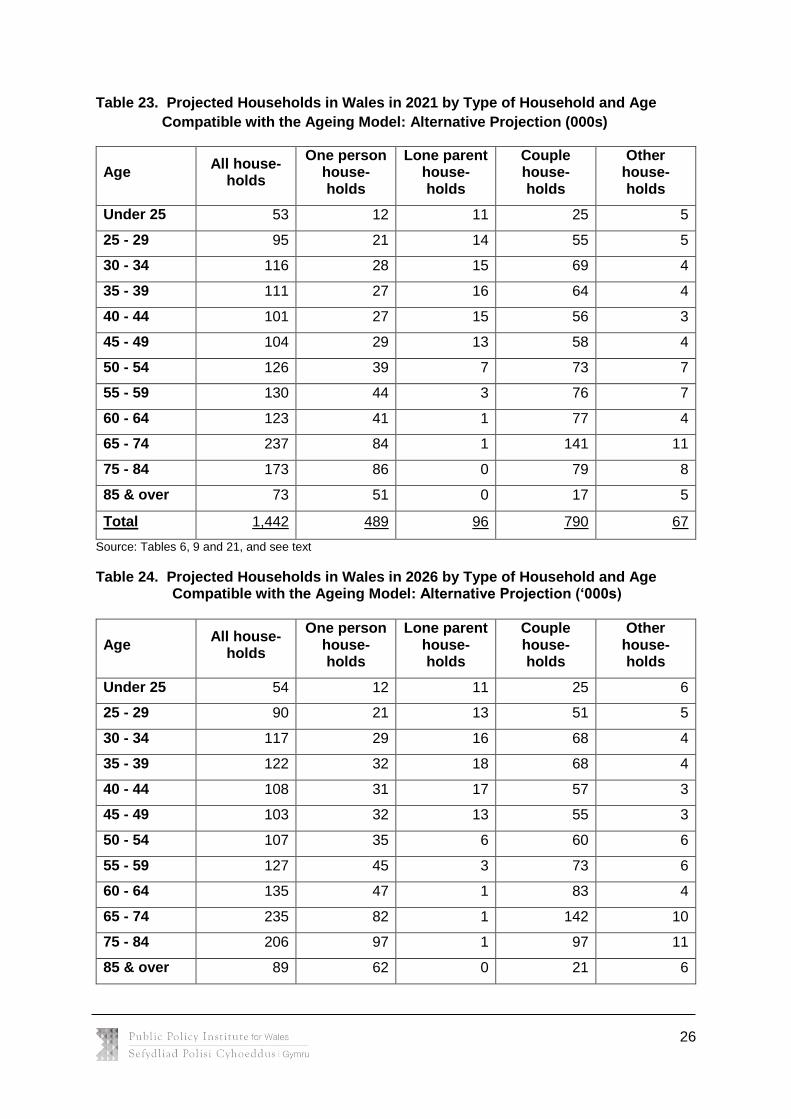
Table 23. Projected Households in Wales in 2021 by Type of Household and Age
Compatible with the Ageing Model: Alternative Projection (000s)
Age All house-
holds
One person house-holds
Lone parent house-holds
Couple house-holds
Other house-holds
Under 25 53 12 11 25 5
25 - 29 95 21 14 55 5
30 - 34 116 28 15 69 4
35 - 39 111 27 16 64 4
40 - 44 101 27 15 56 3
45 - 49 104 29 13 58 4
50 - 54 126 39 7 73 7
55 - 59 130 44 3 76 7
60 - 64 123 41 1 77 4
65 - 74 237 84 1 141 11
75 - 84 173 86 0 79 8
85 & over 73 51 0 17 5
Total 1,442 489 96 790 67
Source: Tables 6, 9 and 21, and see text
Table 24. Projected Households in Wales in 2026 by Type of Household and Age Compatible with the Ageing Model: Alternative Projection (‘000s)
Age All house-
holds
One person house-holds
Lone parent house-holds
Couple house-holds
Other house-holds
Under 25 54 12 11 25 6
25 - 29 90 21 13 51 5
30 - 34 117 29 16 68 4
35 - 39 122 32 18 68 4
40 - 44 108 31 17 57 3
45 - 49 103 32 13 55 3
50 - 54 107 35 6 60 6
55 - 59 127 45 3 73 6
60 - 64 135 47 1 83 4
65 - 74 235 82 1 142 10
75 - 84 206 97 1 97 11
85 & over 89 62 0 21 6
27
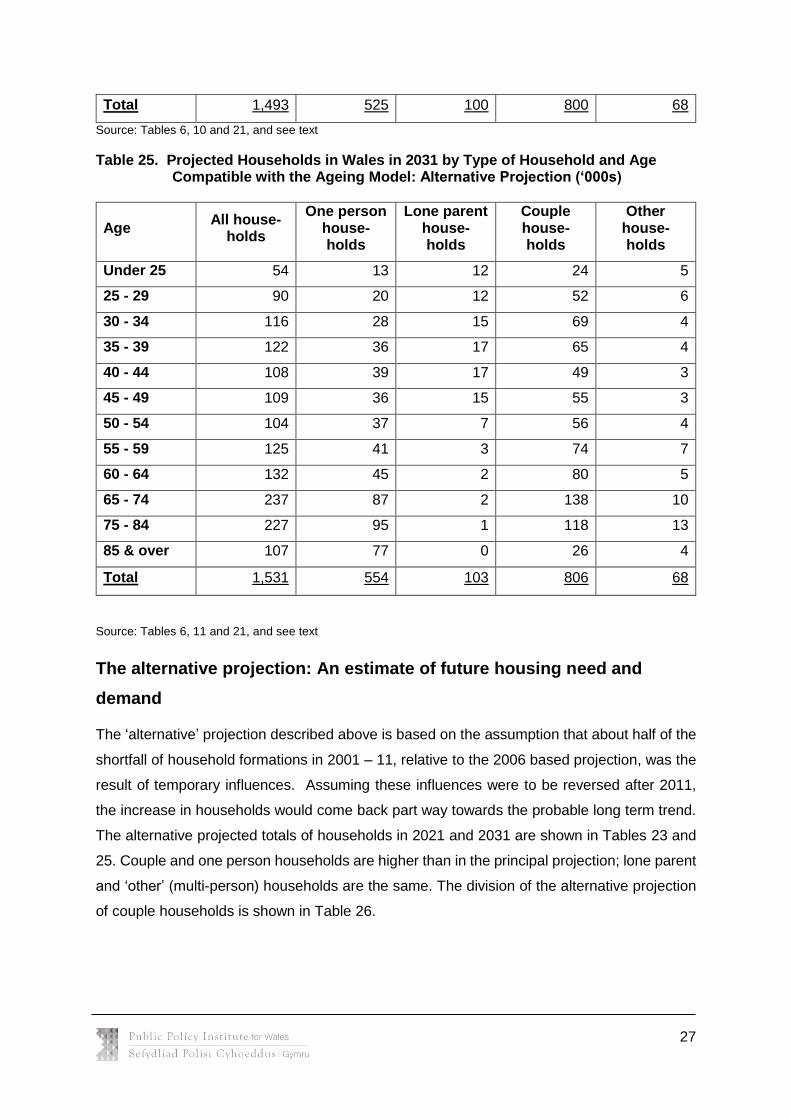
Total 1,493 525 100 800 68
Source: Tables 6, 10 and 21, and see text
Table 25. Projected Households in Wales in 2031 by Type of Household and Age Compatible with the Ageing Model: Alternative Projection (‘000s)
Age All house-
holds
One person house-holds
Lone parent house-holds
Couple house-holds
Other house-holds
Under 25 54 13 12 24 5
25 - 29 90 20 12 52 6
30 - 34 116 28 15 69 4
35 - 39 122 36 17 65 4
40 - 44 108 39 17 49 3
45 - 49 109 36 15 55 3
50 - 54 104 37 7 56 4
55 - 59 125 41 3 74 7
60 - 64 132 45 2 80 5
65 - 74 237 87 2 138 10
75 - 84 227 95 1 118 13
85 & over 107 77 0 26 4
Total 1,531 554 103 806 68
Source: Tables 6, 11 and 21, and see text
The alternative projection: An estimate of future housing need and
demand
The ‘alternative’ projection described above is based on the assumption that about half of the
shortfall of household formations in 2001 – 11, relative to the 2006 based projection, was the
result of temporary influences. Assuming these influences were to be reversed after 2011,
the increase in households would come back part way towards the probable long term trend.
The alternative projected totals of households in 2021 and 2031 are shown in Tables 23 and
25. Couple and one person households are higher than in the principal projection; lone parent
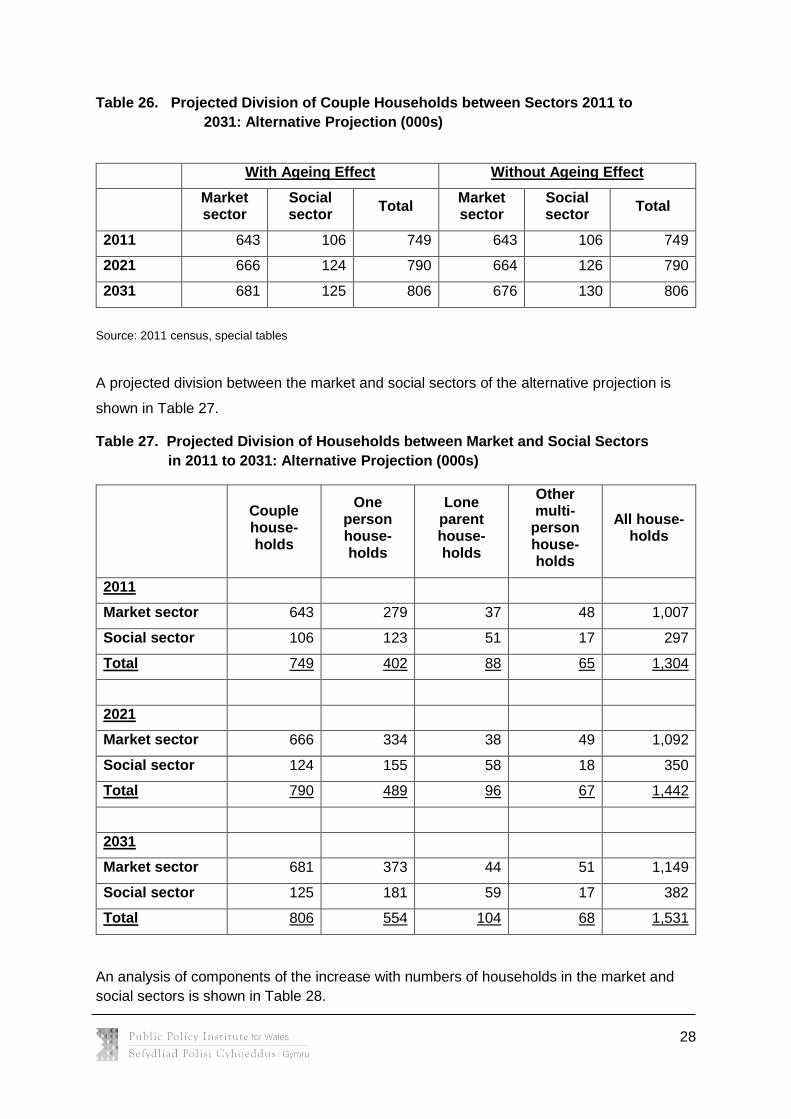
and ‘other’ (multi-person) households are the same. The division of the alternative projection
of couple households is shown in Table 26.
28
Table 26. Projected Division of Couple Households between Sectors 2011 to
2031: Alternative Projection (000s)
With Ageing Effect Without Ageing Effect
Market sector
Social sector
Total Market sector
Social sector
Total
2011 643 106 749 643 106 749
2021 666 124 790 664 126 790
2031 681 125 806 676 130 806
Source: 2011 census, special tables
A projected division between the market and social sectors of the alternative projection is
shown in Table 27.
Table 27. Projected Division of Households between Market and Social Sectors
in 2011 to 2031: Alternative Projection (000s)
Couple house-holds
One person house-holds
Lone parent house-holds
Other multi-
person house-holds
All house-holds
2011
Market sector 643 279 37 48 1,007
Social sector 106 123 51 17 297
Total 749 402 88 65 1,304
2021
Market sector 666 334 38 49 1,092
Social sector 124 155 58 18 350
Total 790 489 96 67 1,442
2031
Market sector 681 373 44 51 1,149
Social sector 125 181 59 17 382
Total 806 554 104 68 1,531
An analysis of components of the increase with numbers of households in the market and
social sectors is shown in Table 28.
29
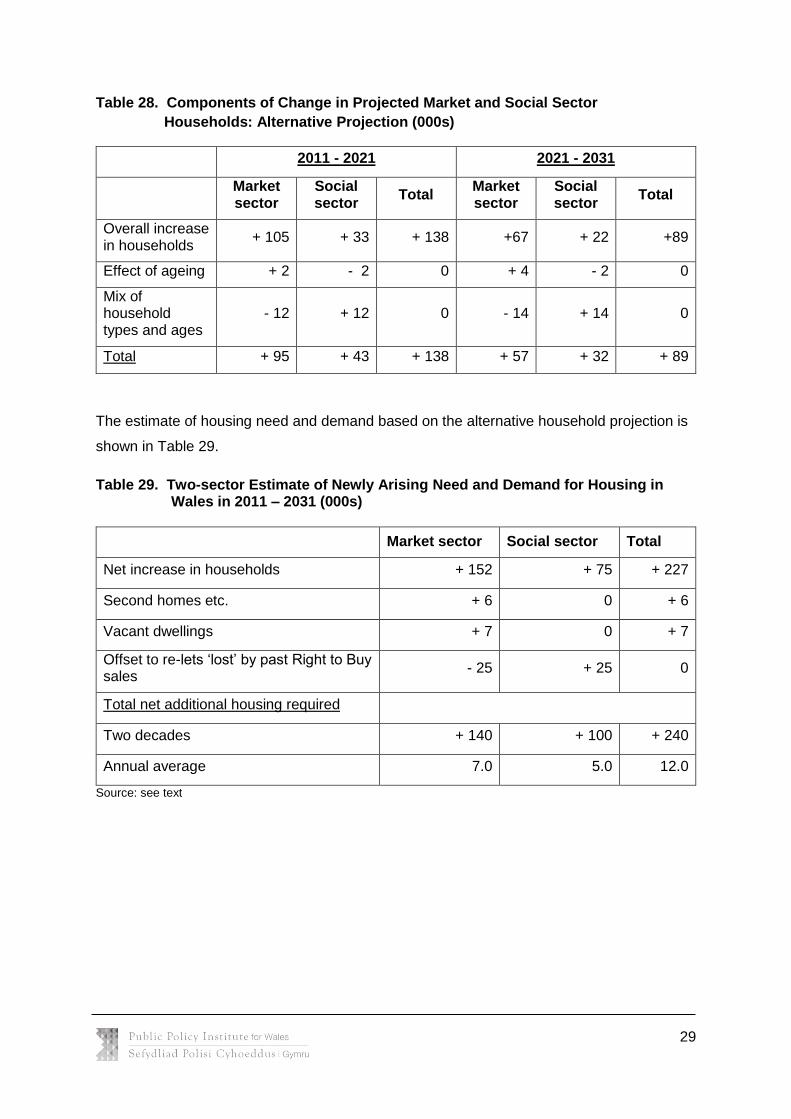
Table 28. Components of Change in Projected Market and Social Sector
Households: Alternative Projection (000s)
2011 - 2021 2021 - 2031
Market sector
Social sector
Total Market sector
Social sector
Total
Overall increase in households
+ 105 + 33 + 138 +67 + 22 +89
Effect of ageing + 2 - 2 0 + 4 - 2 0
Mix of household types and ages
- 12 + 12 0 - 14 + 14 0
Total + 95 + 43 + 138 + 57 + 32 + 89
The estimate of housing need and demand based on the alternative household projection is
shown in Table 29.
Table 29. Two-sector Estimate of Newly Arising Need and Demand for Housing in Wales in 2011 – 2031 (000s)
Market sector Social sector Total
Net increase in households + 152 + 75 + 227
Second homes etc. + 6 0 + 6
Vacant dwellings + 7 0 + 7
Offset to re-lets ‘lost’ by past Right to Buy sales
- 25 + 25 0
Total net additional housing required
Two decades + 140 + 100 + 240
Annual average 7.0 5.0 12.0
Source: see text
30
Estimating the Backlog of Unmet Housing Need
In considering the future need and demand for housing in Wales, it is important to include the
existing unmet housing needs (conventionally termed the ‘backlog of unmet need’). These
households should form part of the analysis of required new supply.
Information about the backlog of housing need in Wales was reviewed in Housing Need and
Demand in Wales 2006 to 2026. Information was available about three recognised
components of the backlog:
(a) households living in temporary accommodation;
(b) households in shared accommodation; and
(c) households whose accommodation was overcrowded.
There was no information about the fourth component, concealed households.
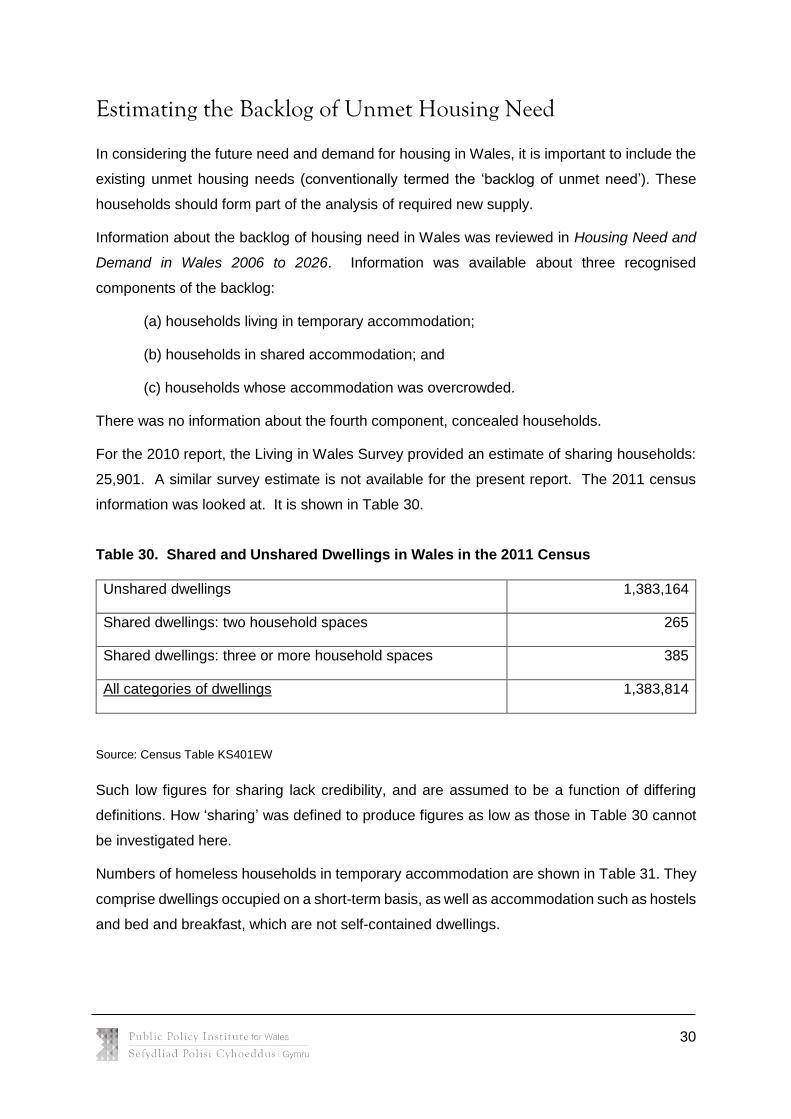
For the 2010 report, the Living in Wales Survey provided an estimate of sharing households:
25,901. A similar survey estimate is not available for the present report. The 2011 census
information was looked at. It is shown in Table 30.
Table 30. Shared and Unshared Dwellings in Wales in the 2011 Census
Unshared dwellings 1,383,164
Shared dwellings: two household spaces 265
Shared dwellings: three or more household spaces 385
All categories of dwellings 1,383,814
Source: Census Table KS401EW
Such low figures for sharing lack credibility, and are assumed to be a function of differing
definitions. How ‘sharing’ was defined to produce figures as low as those in Table 30 cannot
be investigated here.
Numbers of homeless households in temporary accommodation are shown in Table 31. They
comprise dwellings occupied on a short-term basis, as well as accommodation such as hostels
and bed and breakfast, which are not self-contained dwellings.
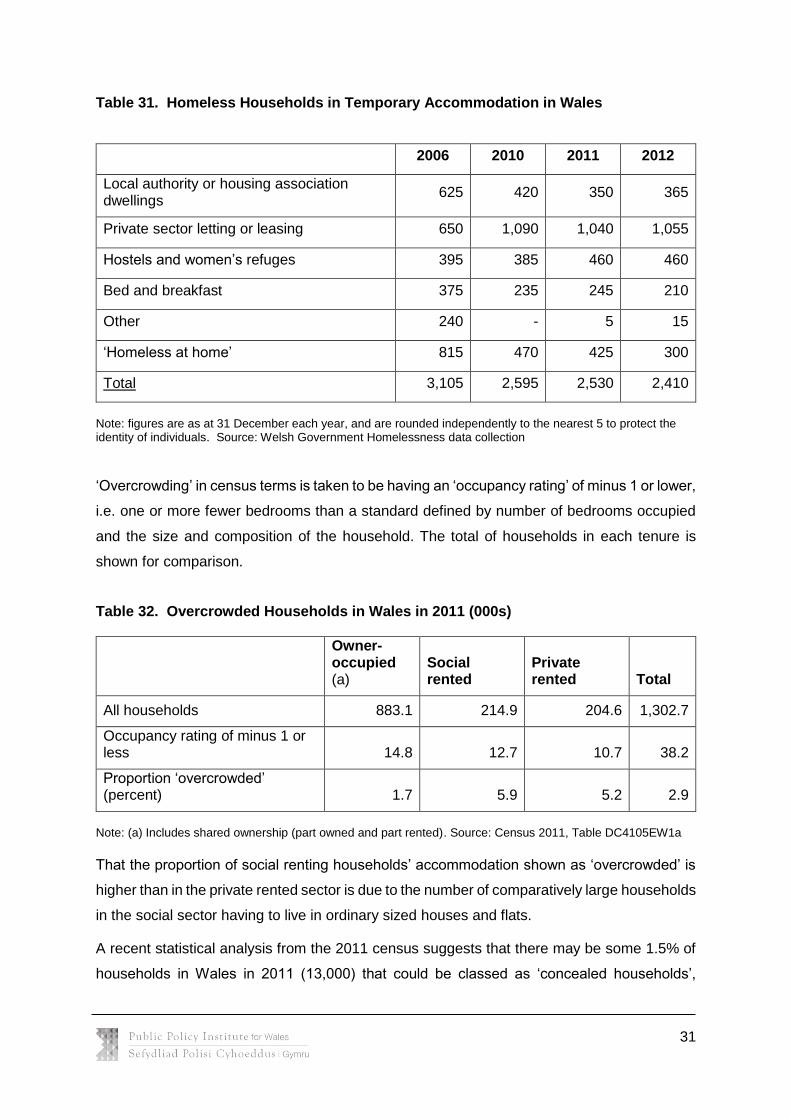
31
Table 31. Homeless Households in Temporary Accommodation in Wales
2006 2010 2011 2012
Local authority or housing association dwellings
625 420 350 365
Private sector letting or leasing 650 1,090 1,040 1,055
Hostels and women’s refuges 395 385 460 460
Bed and breakfast 375 235 245 210
Other 240 - 5 15
‘Homeless at home’ 815 470 425 300
Total 3,105 2,595 2,530 2,410
Note: figures are as at 31 December each year, and are rounded independently to the nearest 5 to protect the identity of individuals. Source: Welsh Government Homelessness data collection
‘Overcrowding’ in census terms is taken to be having an ‘occupancy rating’ of minus 1 or lower,
i.e. one or more fewer bedrooms than a standard defined by number of bedrooms occupied
and the size and composition of the household. The total of households in each tenure is
shown for comparison.
Table 32. Overcrowded Households in Wales in 2011 (000s)
Owner-occupied (a)
Social rented
Private rented Total
All households 883.1 214.9 204.6 1,302.7
Occupancy rating of minus 1 or less 14.8 12.7 10.7 38.2
Proportion ‘overcrowded’ (percent) 1.7 5.9 5.2 2.9
Note: (a) Includes shared ownership (part owned and part rented). Source: Census 2011, Table DC4105EW1a
That the proportion of social renting households’ accommodation shown as ‘overcrowded’ is
higher than in the private rented sector is due to the number of comparatively large households
in the social sector having to live in ordinary sized houses and flats.
A recent statistical analysis from the 2011 census suggests that there may be some 1.5% of
households in Wales in 2011 (13,000) that could be classed as ‘concealed households’,
32
defined as a household living in a multi-household dwelling, up from 9,000 in 2001. In the 2010
report (Holmans and Monk, 2010) survey data was used to estimate what proportion of such
households were genuinely ‘concealed’ i.e. would prefer to live independently. There is no
updated information to estimate this proportion from the 2011 census figure.
All these components of current unmet housing need are themselves estimates and, as noted
above, the census figures for sharing are unfeasibly low. All they provide is evidence that there
is unmet housing need but its extent is impossible to quantify with any confidence. It would
give a spurious accuracy to the data if the different components were to be summed and
termed ‘the estimate of current unmet need’.
Need and Demand for housing in Wales 2011-2031: District Analysis The central core of an estimate of future need and demand for housing in the local government
districts of Wales is the official household projections for these districts. These are part of the
2011-based household projections used in this report. 2011 census data was used to divide
households into each district in the base year between market and social sectors. The census
data divide between owner-occupiers plus private sector tenants (including rent-free
occupiers) – market sector; and local authority and housing association tenants – social
sector. The social sector includes, and the market sector excludes, owner-occupiers who
entered the tenure by purchase as sitting tenants from public authorities (‘RTB owner-
occupiers’) and private sector tenants receiving Housing Benefit (‘HB tenants’) – see Tables
1 and 2 for figures for Wales. Figures at district level for RTB owner-occupiers and HB tenants
have to be derived from the figure for Wales pro-rata, for all owner-occupiers and private
sector tenants respectively. Adding these to district totals of social sector tenants and
subtracting them from owner-occupiers plus private sector tenants gives the social and market
sectors as defined in this report. Sector shares in 2011 are then calculated.
Sector shares in 2031 are estimates by reference to the difference between sector shares in
2011 and 2031 for Wales as a whole. The market sector proportion in 2011 is put at 77.2%
and in 2031 at 77.0% (Table 13). The change in the market sector share between 2011 and
2031 is taken to apply at district level. For instance, the market sector share of households in
Cardiff in 2011 is estimated at 72.4%. Subtracting the change in the market sector proportions
in Wales as a whole (0.2%) gives an estimated market share for Cardiff in 2031 of 72.4 – 0.2
= 72.2%. This estimated market sector share in 2031 is applied to the projected total of
households in 2031 to give the estimated total of market sector households in 2031.
33
This method gives the net increase in the total of market sector households between 2011
and 2031 and, by subtraction, the net increase in the total of social sector households. The
other, minor, components of need and demand for housing are second homes, the increase
in vacant dwellings, and provision in the social sector to offset the loss of re-lets to past RTB
sales (the figure is not affected by recent sales). For second homes, the same figure as in the
2010 projection is taken for Wales as a whole, so the 2010 figures for second homes in
individual districts can reasonably be used. The increase in market sector vacants and the
offset to ‘lost’ re-lets are apportioned between districts pro rata.
Household projections
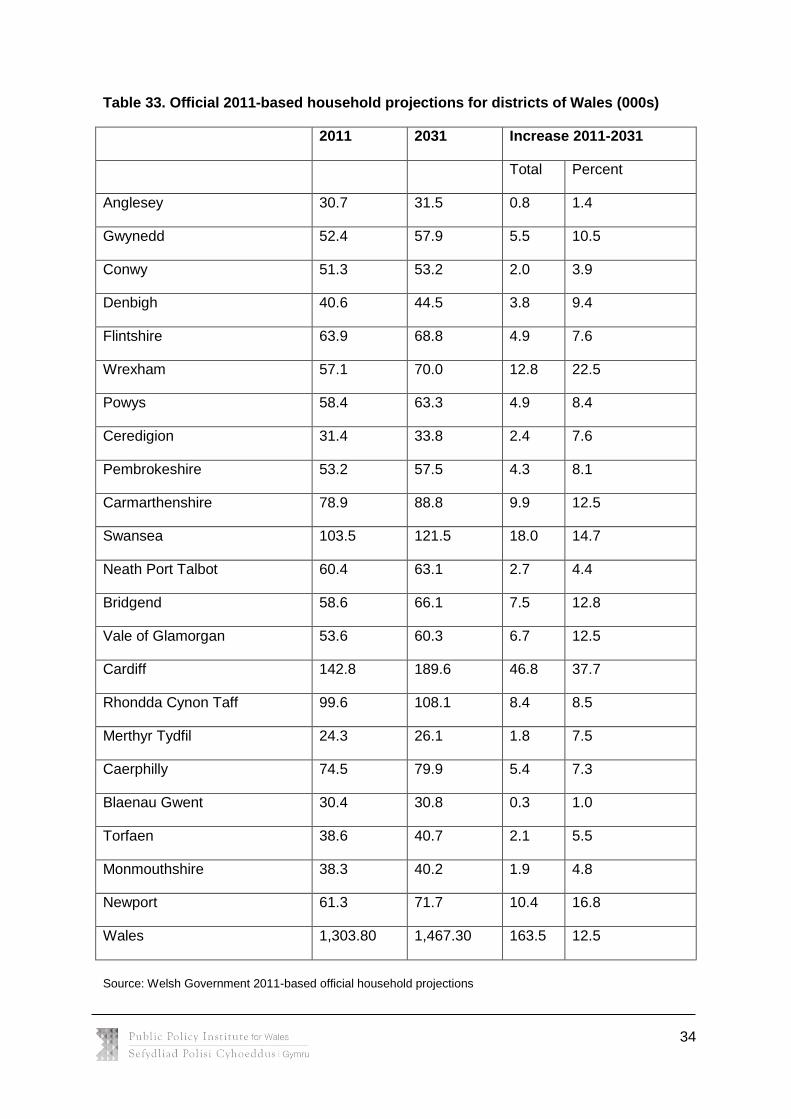
Official 2011-based household projections for the districts of Wales are shown in Table 33.
34
Table 33. Official 2011-based household projections for districts of Wales (000s)
2011 2031 Increase 2011-2031
Total Percent
Anglesey 30.7 31.5 0.8 1.4
Gwynedd 52.4 57.9 5.5 10.5
Conwy 51.3 53.2 2.0 3.9
Denbigh 40.6 44.5 3.8 9.4
Flintshire 63.9 68.8 4.9 7.6
Wrexham 57.1 70.0 12.8 22.5
Powys 58.4 63.3 4.9 8.4
Ceredigion 31.4 33.8 2.4 7.6
Pembrokeshire 53.2 57.5 4.3 8.1
Carmarthenshire 78.9 88.8 9.9 12.5
Swansea 103.5 121.5 18.0 14.7
Neath Port Talbot 60.4 63.1 2.7 4.4
Bridgend 58.6 66.1 7.5 12.8
Vale of Glamorgan 53.6 60.3 6.7 12.5
Cardiff 142.8 189.6 46.8 37.7
Rhondda Cynon Taff 99.6 108.1 8.4 8.5
Merthyr Tydfil 24.3 26.1 1.8 7.5
Caerphilly 74.5 79.9 5.4 7.3
Blaenau Gwent 30.4 30.8 0.3 1.0
Torfaen 38.6 40.7 2.1 5.5
Monmouthshire 38.3 40.2 1.9 4.8
Newport 61.3 71.7 10.4 16.8
Wales 1,303.80 1,467.30 163.5 12.5
Source: Welsh Government 2011-based official household projections

35
There are wide variations between the magnitude of the projected increases in households in
the 22 districts. The size of the increase projected for Cardiff merits note, nearly 30% of the
total for Wales. The next step is to divide the 2011 and 2031 totals of households into market
and social sectors. Table 34 shows the calculation. It starts with the market sector proportions
for each district in 2011. Proportions in 2031 are obtained by subtracting the
increase/decrease between 2011 and 2031 in Wales as a whole. The market sector
proportions in 2031 are then applied to the totals of households in 2031 (Table 33); and the
net change in the number of market sector households between 2011 and 2031 is calculated.
The calculation is presented in terms of market sector households for convenience; the social
sector figures could be derived by subtraction.
Table 34. Estimates of market sector households in districts of Wales in
2011 and 2031 (000s)
Market sector share % Market sector total Net change
2011 2031 2011 2031 2011-2031
Anglesey 76.1 75.9 23.4 23.9 0.5
Gwynedd 74.1 74.5 38.8 43.1 4.3
Conwy 78.7 78.5 40.4 41.8 1.4
Denbigh 77.8 77.6 31.6 34.5 2.9
Flintshire 79.2 79.0 50.6 54.4 3.7
Wrexham 69.6 69.4 39.7 48.6 8.8
Powys 77.0 76.8 45.0 48.6 3.6
Ceredigion 78.5 78.3 24.6 26.5 1.8
Pembrokeshire 75.6 75.3 40.2 43.3 3.1
Carmarthenshire 76.8 76.6 60.6 68.0 7.4
Swansea 72.1 71.9 74.6 87.4 12.7
Neath Port Talbot 74.0 73.8 44.7 46.6 1.9
Bridgend 77.8 77.6 45.6 51.3 5.7
Vale of Glamorgan 78.9 78.7 42.3 47.5 5.2
Cardiff 72.4 72.2 103.4 136.9 33.5
Rhondda Cynon Taff 78.9 78.7 78.6 85.1 6.5
Merthyr Tydfil 70.8 70.6 17.2 18.4 1.2
Caerphilly 73.3 73.1 54.6 58.4 3.8
Blaenau Gwent 68.1 68.0 20.7 20.9 0.2
Torfaen 69.4 69.2 26.8 28.2 1.4
Monmouthshire 78.3 78.1 30.0 31.4 1.4
36
Newport 71.7 71.5 44.0 51.3 7.3
Wales 77.2 77.0 977 1095 118
Source: Table 33 and 2011 Census
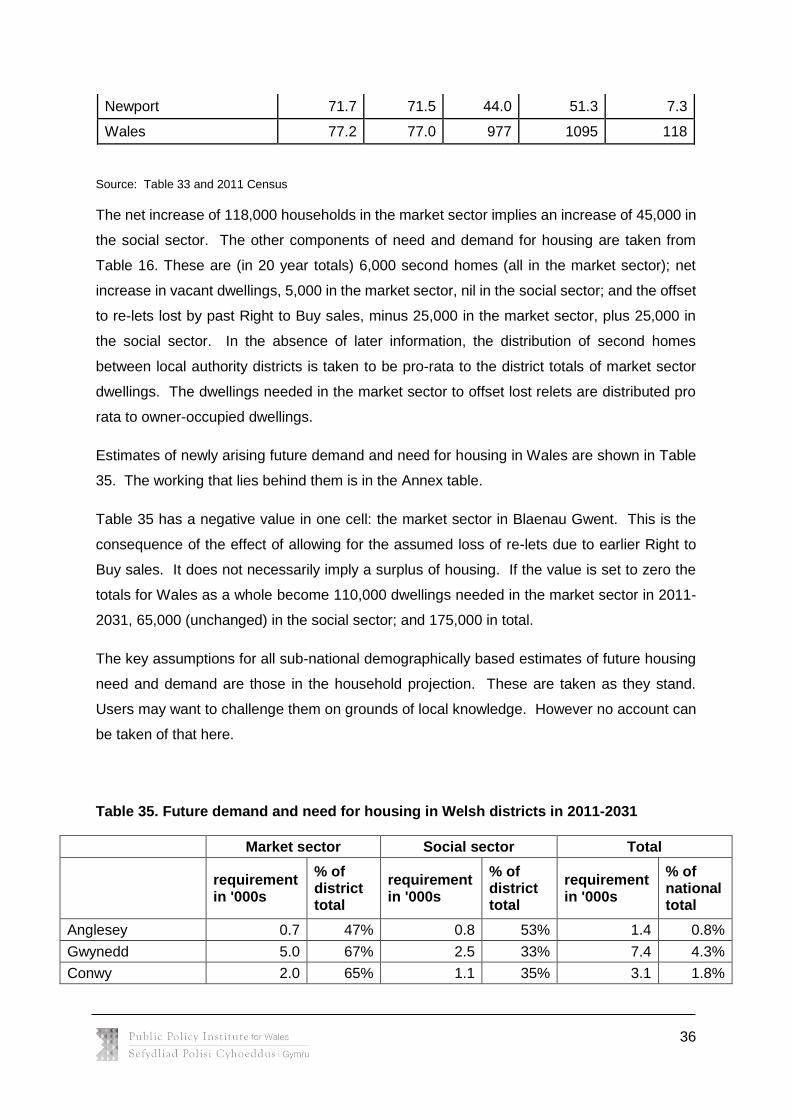
The net increase of 118,000 households in the market sector implies an increase of 45,000 in
the social sector. The other components of need and demand for housing are taken from
Table 16. These are (in 20 year totals) 6,000 second homes (all in the market sector); net
increase in vacant dwellings, 5,000 in the market sector, nil in the social sector; and the offset
to re-lets lost by past Right to Buy sales, minus 25,000 in the market sector, plus 25,000 in
the social sector. In the absence of later information, the distribution of second homes
between local authority districts is taken to be pro-rata to the district totals of market sector
dwellings. The dwellings needed in the market sector to offset lost relets are distributed pro
rata to owner-occupied dwellings.
Estimates of newly arising future demand and need for housing in Wales are shown in Table
35. The working that lies behind them is in the Annex table.
Table 35 has a negative value in one cell: the market sector in Blaenau Gwent. This is the
consequence of the effect of allowing for the assumed loss of re-lets due to earlier Right to
Buy sales. It does not necessarily imply a surplus of housing. If the value is set to zero the
totals for Wales as a whole become 110,000 dwellings needed in the market sector in 2011-
2031, 65,000 (unchanged) in the social sector; and 175,000 in total.
The key assumptions for all sub-national demographically based estimates of future housing
need and demand are those in the household projection. These are taken as they stand.
Users may want to challenge them on grounds of local knowledge. However no account can
be taken of that here.
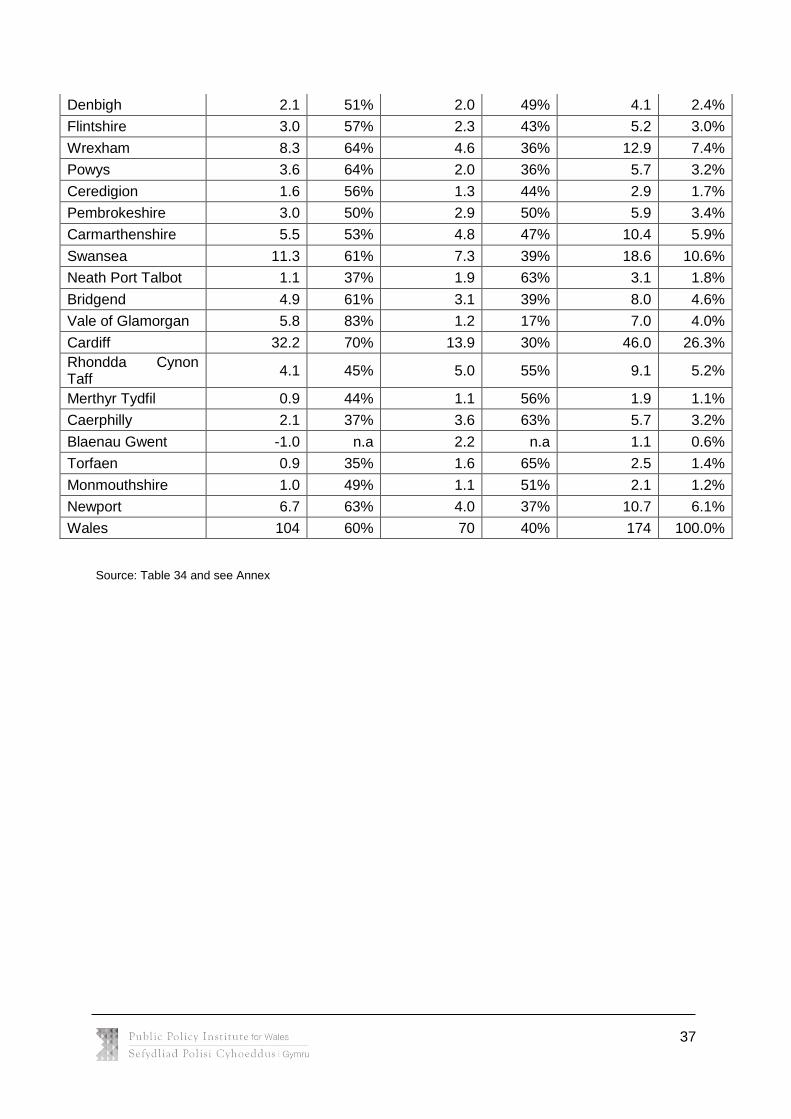
Table 35. Future demand and need for housing in Welsh districts in 2011-2031
Market sector Social sector Total
requirement in '000s
% of district total
requirement in '000s
% of district total
requirement in '000s
% of national total
Anglesey 0.7 47% 0.8 53% 1.4 0.8%
Gwynedd 5.0 67% 2.5 33% 7.4 4.3%
Conwy 2.0 65% 1.1 35% 3.1 1.8%
37
Denbigh 2.1 51% 2.0 49% 4.1 2.4%
Flintshire 3.0 57% 2.3 43% 5.2 3.0%
Wrexham 8.3 64% 4.6 36% 12.9 7.4%
Powys 3.6 64% 2.0 36% 5.7 3.2%
Ceredigion 1.6 56% 1.3 44% 2.9 1.7%
Pembrokeshire 3.0 50% 2.9 50% 5.9 3.4%
Carmarthenshire 5.5 53% 4.8 47% 10.4 5.9%
Swansea 11.3 61% 7.3 39% 18.6 10.6%
Neath Port Talbot 1.1 37% 1.9 63% 3.1 1.8%
Bridgend 4.9 61% 3.1 39% 8.0 4.6%
Vale of Glamorgan 5.8 83% 1.2 17% 7.0 4.0%
Cardiff 32.2 70% 13.9 30% 46.0 26.3%
Rhondda Cynon Taff
4.1 45% 5.0 55% 9.1 5.2%
Merthyr Tydfil 0.9 44% 1.1 56% 1.9 1.1%
Caerphilly 2.1 37% 3.6 63% 5.7 3.2%
Blaenau Gwent -1.0 n.a 2.2 n.a 1.1 0.6%
Torfaen 0.9 35% 1.6 65% 2.5 1.4%
Monmouthshire 1.0 49% 1.1 51% 2.1 1.2%
Newport 6.7 63% 4.0 37% 10.7 6.1%
Wales 104 60% 70 40% 174 100.0%
Source: Table 34 and see Annex
38
Conclusion
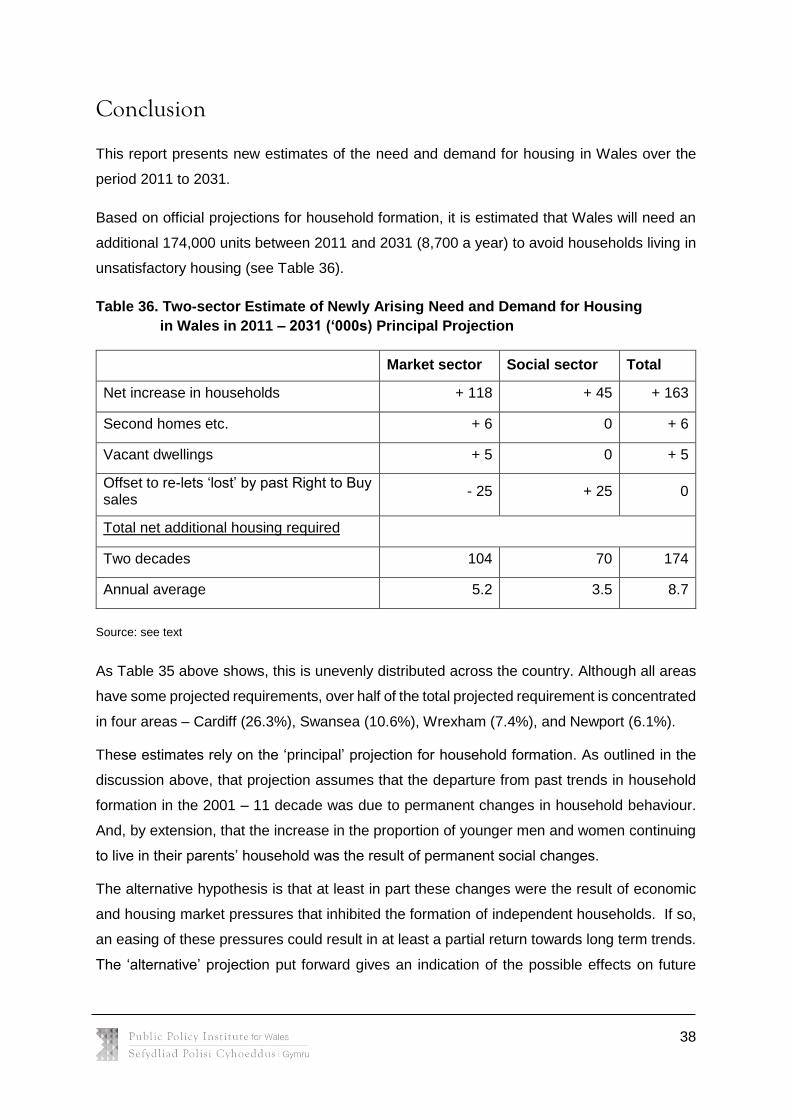
This report presents new estimates of the need and demand for housing in Wales over the
period 2011 to 2031.
Based on official projections for household formation, it is estimated that Wales will need an
additional 174,000 units between 2011 and 2031 (8,700 a year) to avoid households living in
unsatisfactory housing (see Table 36).
Table 36. Two-sector Estimate of Newly Arising Need and Demand for Housing
in Wales in 2011 – 2031 (‘000s) Principal Projection
Market sector Social sector Total
Net increase in households + 118 + 45 + 163
Second homes etc. + 6 0 + 6
Vacant dwellings + 5 0 + 5
Offset to re-lets ‘lost’ by past Right to Buy sales
- 25 + 25 0
Total net additional housing required
Two decades 104 70 174
Annual average 5.2 3.5 8.7
Source: see text
As Table 35 above shows, this is unevenly distributed across the country. Although all areas
have some projected requirements, over half of the total projected requirement is concentrated
in four areas – Cardiff (26.3%), Swansea (10.6%), Wrexham (7.4%), and Newport (6.1%).
These estimates rely on the ‘principal’ projection for household formation. As outlined in the
discussion above, that projection assumes that the departure from past trends in household
formation in the 2001 – 11 decade was due to permanent changes in household behaviour.
And, by extension, that the increase in the proportion of younger men and women continuing
to live in their parents’ household was the result of permanent social changes.
The alternative hypothesis is that at least in part these changes were the result of economic
and housing market pressures that inhibited the formation of independent households. If so,
an easing of these pressures could result in at least a partial return towards long term trends.
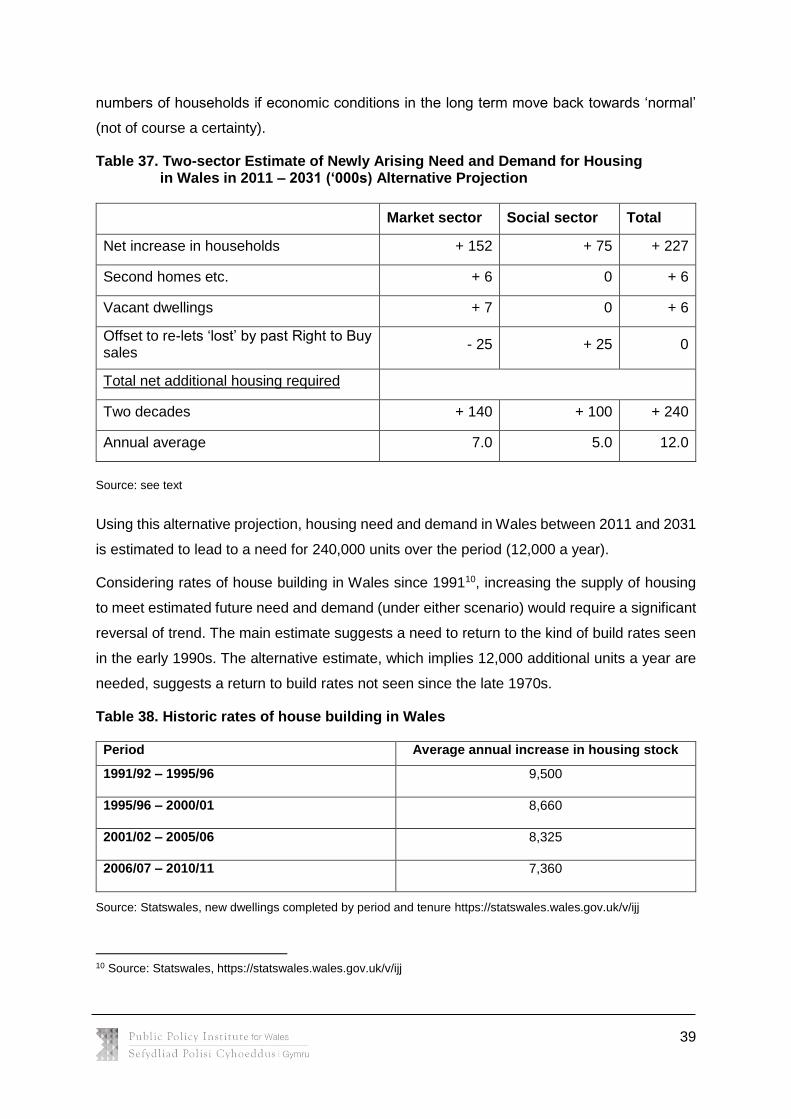
The ‘alternative’ projection put forward gives an indication of the possible effects on future
39
numbers of households if economic conditions in the long term move back towards ‘normal’
(not of course a certainty).
Table 37. Two-sector Estimate of Newly Arising Need and Demand for Housing in Wales in 2011 – 2031 (‘000s) Alternative Projection
Market sector Social sector Total
Net increase in households + 152 + 75 + 227
Second homes etc. + 6 0 + 6
Vacant dwellings + 7 0 + 6
Offset to re-lets ‘lost’ by past Right to Buy sales
- 25 + 25 0
Total net additional housing required
Two decades + 140 + 100 + 240
Annual average 7.0 5.0 12.0
Source: see text
Using this alternative projection, housing need and demand in Wales between 2011 and 2031
is estimated to lead to a need for 240,000 units over the period (12,000 a year).
Considering rates of house building in Wales since 199110, increasing the supply of housing
to meet estimated future need and demand (under either scenario) would require a significant
reversal of trend. The main estimate suggests a need to return to the kind of build rates seen
in the early 1990s. The alternative estimate, which implies 12,000 additional units a year are
needed, suggests a return to build rates not seen since the late 1970s.
Table 38. Historic rates of house building in Wales
Period Average annual increase in housing stock
1991/92 – 1995/96 9,500
1995/96 – 2000/01 8,660
2001/02 – 2005/06 8,325
2006/07 – 2010/11 7,360
Source: Statswales, new dwellings completed by period and tenure https://statswales.wales.gov.uk/v/ijj
10 Source: Statswales, https://statswales.wales.gov.uk/v/ijj
40
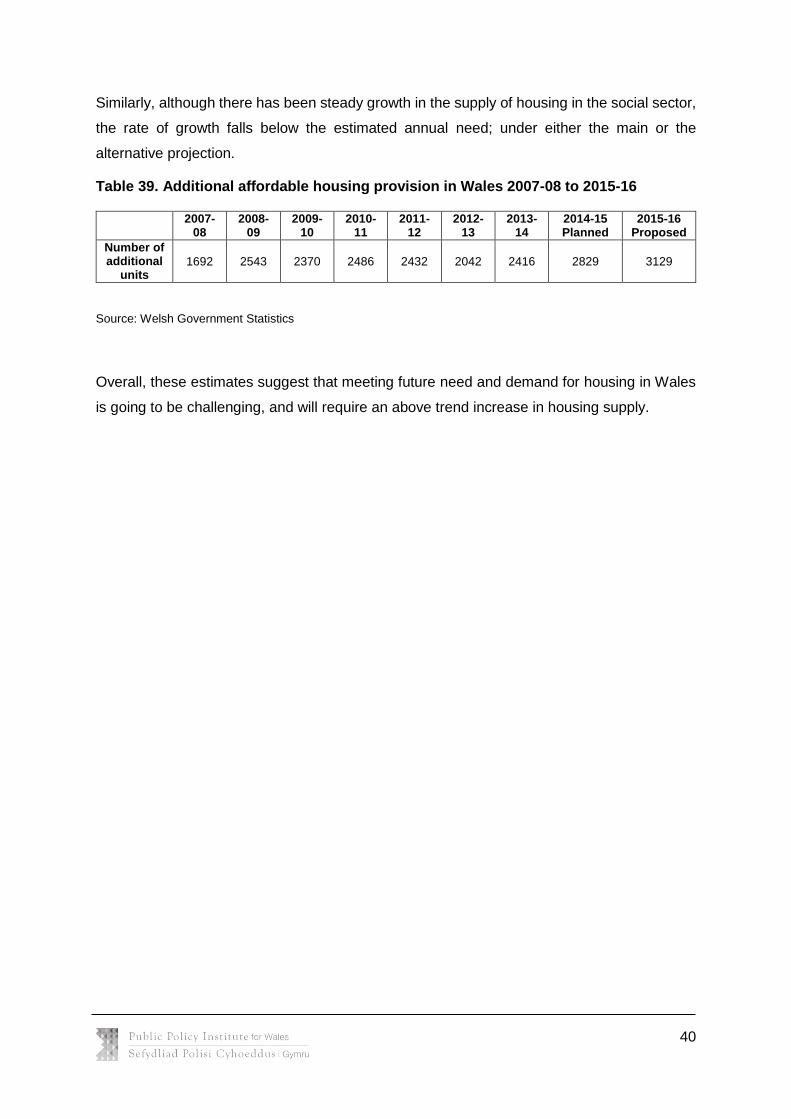
Similarly, although there has been steady growth in the supply of housing in the social sector,
the rate of growth falls below the estimated annual need; under either the main or the
alternative projection.
Table 39. Additional affordable housing provision in Wales 2007-08 to 2015-16
2007-
08 2008-
09 2009-
10 2010-
11 2011-
12 2012-
13 2013-
14 2014-15 Planned
2015-16 Proposed
Number of additional
units 1692 2543 2370 2486 2432 2042 2416 2829 3129
Source: Welsh Government Statistics
Overall, these estimates suggest that meeting future need and demand for housing in Wales
is going to be challenging, and will require an above trend increase in housing supply.
41
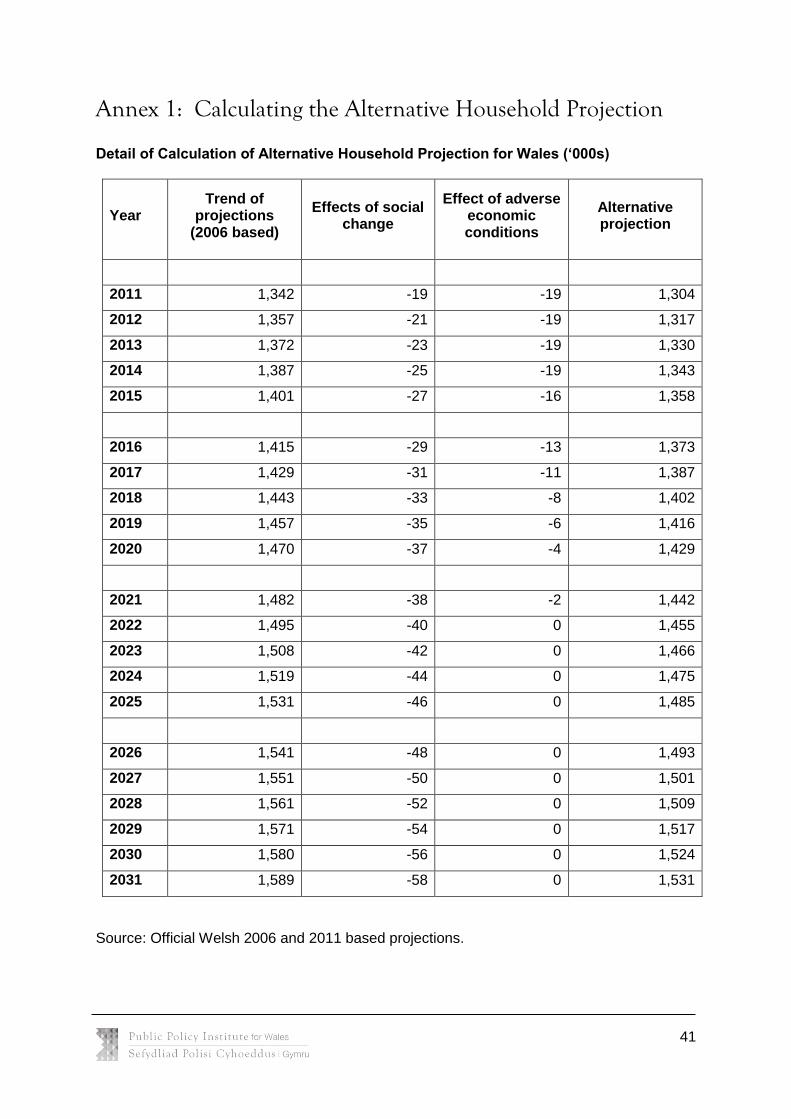
Annex 1: Calculating the Alternative Household Projection
Detail of Calculation of Alternative Household Projection for Wales (‘000s)
Year Trend of
projections (2006 based)
Effects of social change
Effect of adverse economic conditions
Alternative projection
2011 1,342 -19 -19 1,304
2012 1,357 -21 -19 1,317
2013 1,372 -23 -19 1,330
2014 1,387 -25 -19 1,343
2015 1,401 -27 -16 1,358
2016 1,415 -29 -13 1,373
2017 1,429 -31 -11 1,387
2018 1,443 -33 -8 1,402
2019 1,457 -35 -6 1,416
2020 1,470 -37 -4 1,429
2021 1,482 -38 -2 1,442
2022 1,495 -40 0 1,455
2023 1,508 -42 0 1,466
2024 1,519 -44 0 1,475
2025 1,531 -46 0 1,485
2026 1,541 -48 0 1,493
2027 1,551 -50 0 1,501
2028 1,561 -52 0 1,509
2029 1,571 -54 0 1,517
2030 1,580 -56 0 1,524
2031 1,589 -58 0 1,531
Source: Official Welsh 2006 and 2011 based projections.
42
Annex 2: Calculating the demand and need for housing in
Welsh districts 2011-2031
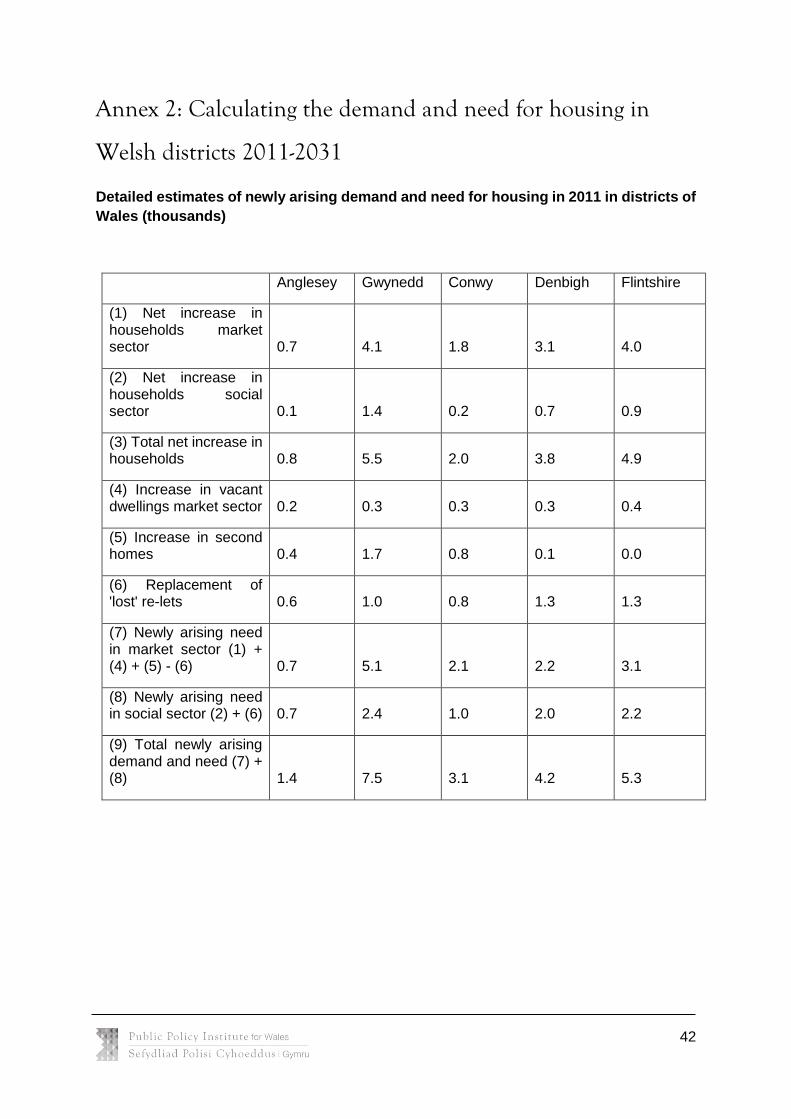
Detailed estimates of newly arising demand and need for housing in 2011 in districts of
Wales (thousands)
Anglesey Gwynedd Conwy Denbigh Flintshire
(1) Net increase in households market sector 0.7 4.1 1.8 3.1 4.0
(2) Net increase in households social sector 0.1 1.4 0.2 0.7 0.9
(3) Total net increase in households 0.8 5.5 2.0 3.8 4.9
(4) Increase in vacant dwellings market sector 0.2 0.3 0.3 0.3 0.4
(5) Increase in second homes 0.4 1.7 0.8 0.1 0.0
(6) Replacement of 'lost' re-lets 0.6 1.0 0.8 1.3 1.3
(7) Newly arising need in market sector (1) + (4) + (5) - (6) 0.7 5.1 2.1 2.2 3.1
(8) Newly arising need in social sector (2) + (6) 0.7 2.4 1.0 2.0 2.2
(9) Total newly arising demand and need (7) + (8) 1.4 7.5 3.1 4.2 5.3

43
Wrexham Powys Ceredigion Pembroke Carmarthen
(1) Net increase in
households market
sector 9.3 3.9 1.7 2.5 6.8
(2) Net increase in
households social
sector 3.5 1.0 0.7 1.8 3.1
(3) Total net increase in
households 12.8 4.9 2.4 4.3 9.9
(4) Increase in vacant
dwellings market sector 0.3 0.4 0.2 0.3 0.3
(5) Increase in second
homes 0.0 0.5 0.4 1.3 0.2
(6) Replacement of
'lost' re-lets 1.0 1.0 0.6 1.0 1.6
(7) Newly arising need
in market sector (1) +
(4) + (5) - (6) 8.6 3.8 1.7 3.1 5.7
(8) Newly arising need
in social sector (2) + (6) 4.5 2.0 1.3 2.8 4.7
(9) Total newly arising
demand and need (7) +
(8) 13.1 5.8 3.0 5.9 10.4
44
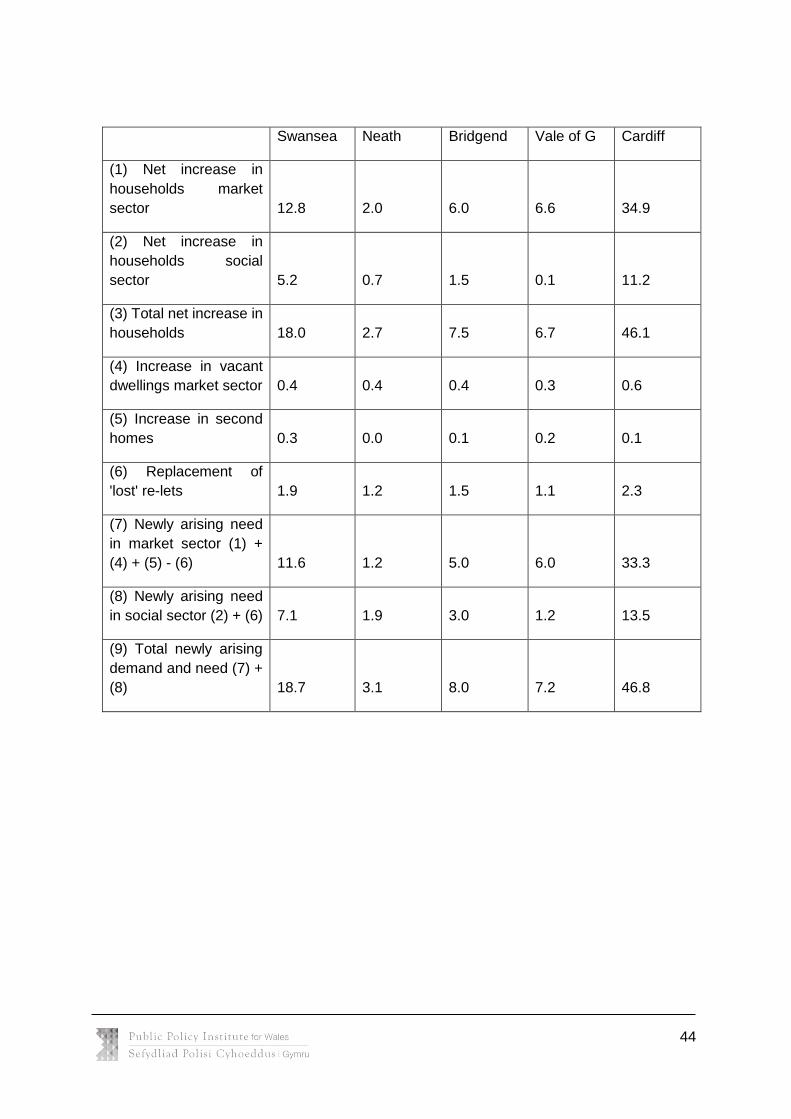
Swansea Neath Bridgend Vale of G Cardiff
(1) Net increase in
households market
sector 12.8 2.0 6.0 6.6 34.9
(2) Net increase in
households social
sector 5.2 0.7 1.5 0.1 11.2
(3) Total net increase in
households 18.0 2.7 7.5 6.7 46.1
(4) Increase in vacant
dwellings market sector 0.4 0.4 0.4 0.3 0.6
(5) Increase in second
homes 0.3 0.0 0.1 0.2 0.1
(6) Replacement of
'lost' re-lets 1.9 1.2 1.5 1.1 2.3
(7) Newly arising need
in market sector (1) +
(4) + (5) - (6) 11.6 1.2 5.0 6.0 33.3
(8) Newly arising need
in social sector (2) + (6) 7.1 1.9 3.0 1.2 13.5
(9) Total newly arising
demand and need (7) +
(8) 18.7 3.1 8.0 7.2 46.8
45
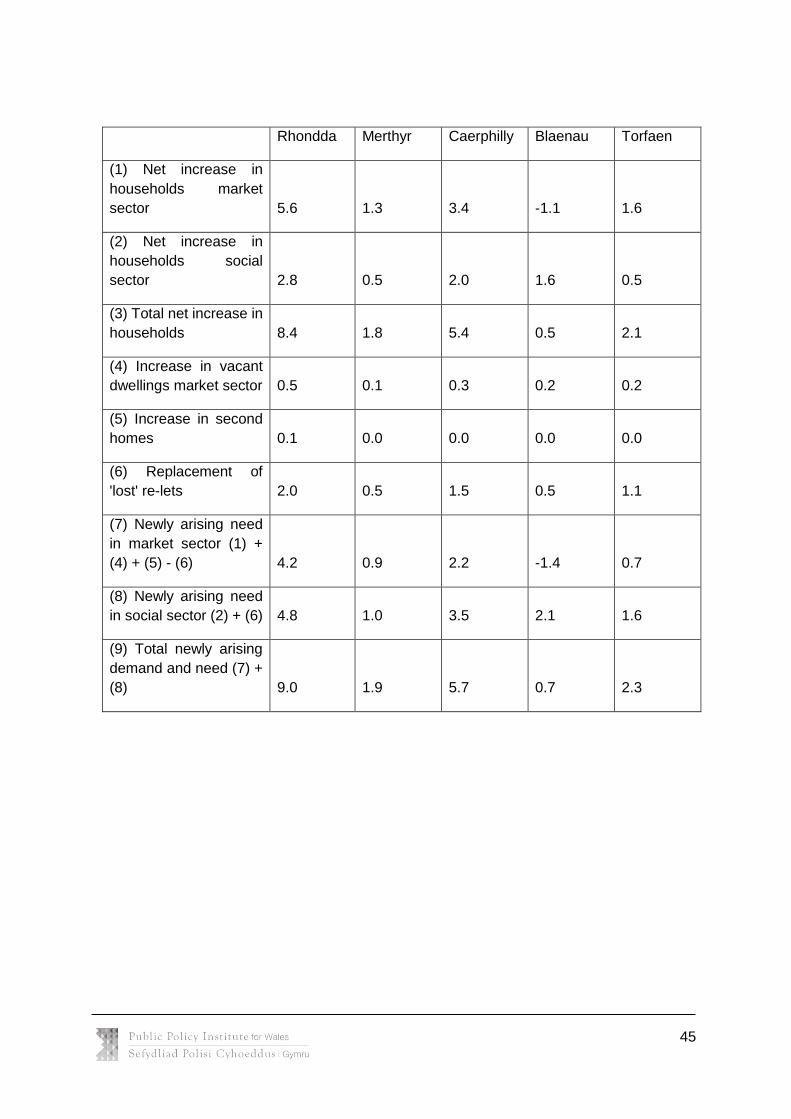
Rhondda Merthyr Caerphilly Blaenau Torfaen
(1) Net increase in
households market
sector 5.6 1.3 3.4 -1.1 1.6
(2) Net increase in
households social
sector 2.8 0.5 2.0 1.6 0.5
(3) Total net increase in
households 8.4 1.8 5.4 0.5 2.1
(4) Increase in vacant
dwellings market sector 0.5 0.1 0.3 0.2 0.2
(5) Increase in second
homes 0.1 0.0 0.0 0.0 0.0
(6) Replacement of
'lost' re-lets 2.0 0.5 1.5 0.5 1.1
(7) Newly arising need
in market sector (1) +
(4) + (5) - (6) 4.2 0.9 2.2 -1.4 0.7
(8) Newly arising need
in social sector (2) + (6) 4.8 1.0 3.5 2.1 1.6
(9) Total newly arising
demand and need (7) +
(8) 9.0 1.9 5.7 0.7 2.3
46
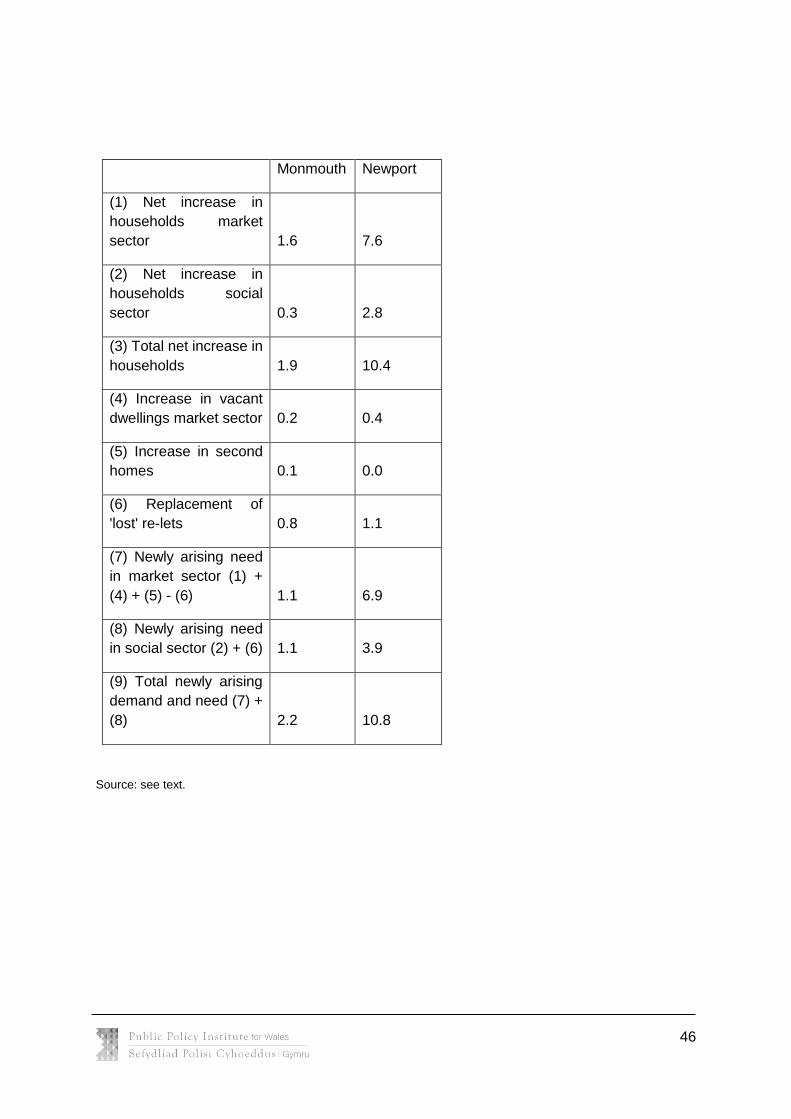
Monmouth Newport
(1) Net increase in
households market
sector 1.6 7.6
(2) Net increase in
households social
sector 0.3 2.8
(3) Total net increase in
households 1.9 10.4
(4) Increase in vacant
dwellings market sector 0.2 0.4
(5) Increase in second
homes 0.1 0.0
(6) Replacement of
'lost' re-lets 0.8 1.1
(7) Newly arising need
in market sector (1) +
(4) + (5) - (6) 1.1 6.9
(8) Newly arising need
in social sector (2) + (6) 1.1 3.9
(9) Total newly arising
demand and need (7) +
(8) 2.2 10.8
Source: see text.
47
References
Holmans, A. and Monk, S. (2010). Housing Need and Demand in Wales 2006 to 2026,
Welsh Assembly Government, Social Research Number 03/2010, available at
http://www.whnb.org.uk/uploads/media/100707housingdemandandneedfullen_full_report.pdf
Welsh Government (2014), Household Projections for Wales (2011-based), available at
http://gov.wales/docs/statistics/2014/140227-household-projections-2011-based-
en.pdf
48
The Public Policy Institute for Wales
The Public Policy Institute for Wales improves policy making and delivery by commissioning
and applying independent expert analysis and advice. Funded by the Welsh Government
and co-funded by the Economic and Social Research Council, the Institute:
Works directly with Welsh Ministers, helping them to identify the evidence they need and
commissioning policy experts to undertake work on their behalf
Is part of the What Works network and provides a strong link between the What Works
Centres in England and policy makers in Wales
Is leading a major programme of research on What Works in Tackling Poverty.
For further information please visit our website at: www.ppiw.org.uk
Author Details:
The late Alan Holmans CBE was a Senior Research Fellow at the Cambridge Centre for
Housing and Planning Research.
Acknowledgements
The assistance of Chihiro Udagawa and Pamela Johnson in the preparation of this report is
gratefully acknowledged.