Embed Size (px)
Citation preview
Future Job Opportunities for Victorian Manufacturers from the 1200 Buildings Program
Victorian Industry Manufacturing Council (VIMC)
Dept. of Innovation, Industry and Regional Development
3 August 2010 – ICN Major Projects Forum
2
Introduction
Objectives of the study
Research materials and services required to retrofit buildings
Audit existing Victorian manufacturing capabilities
Assess potential for locally manufacturing retrofit products
Investigate export opportunities
3
Manufacturing opportunities study for DIIRD
•Report and interactive tool available online at www.business.vic.gov.au/vimc
•1200 Buildings Products and Services Register on Regional Industry Link
•Retrofitting Opportunities for Manufacturing Businesses program
•Summary handout available
4
Presentation Overview
1. Background
2. Economic benefits (job creation)
3. Manufacturer opportunity study method
4. Opportunities for manufacturers (retrofit products)
5. Industry capability audit
5
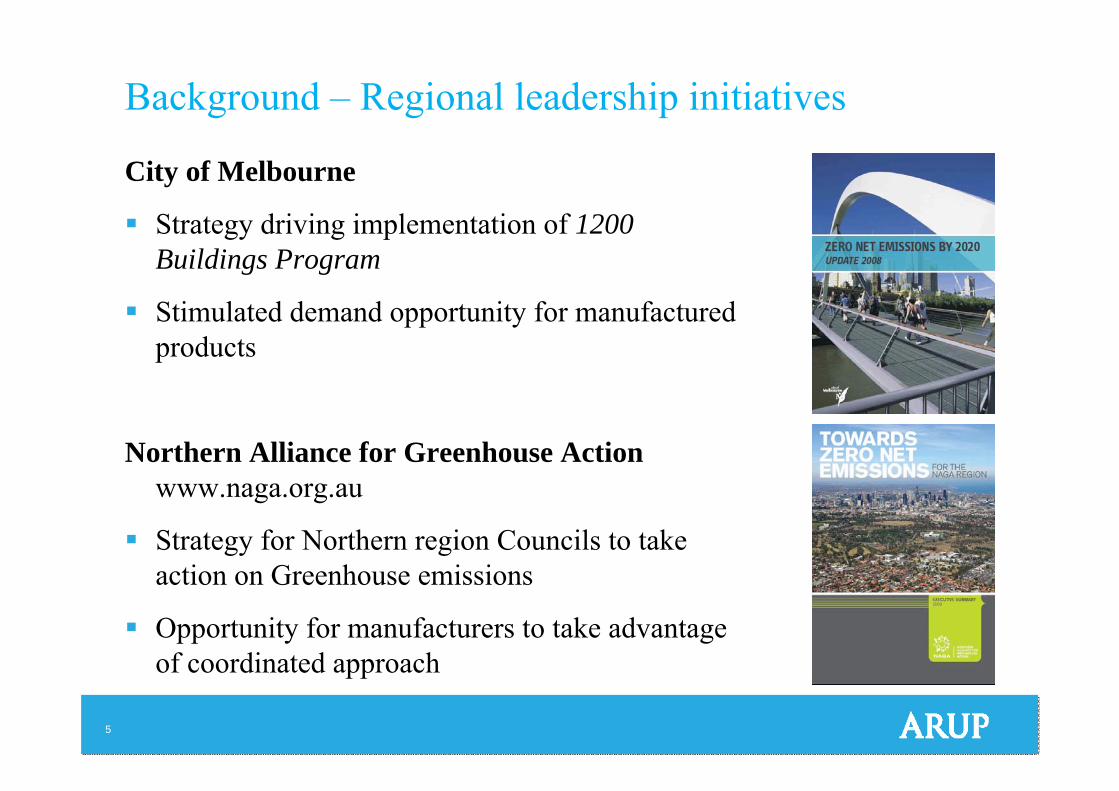
Background – Regional leadership initiatives
City of Melbourne
Strategy driving implementation of 1200 Buildings Program
Stimulated demand opportunity for manufactured products
Northern Alliance for Greenhouse Action www.naga.org.au
Strategy for Northern region Councils to take action on Greenhouse emissions
Opportunity for manufacturers to take advantage of coordinated approach
6
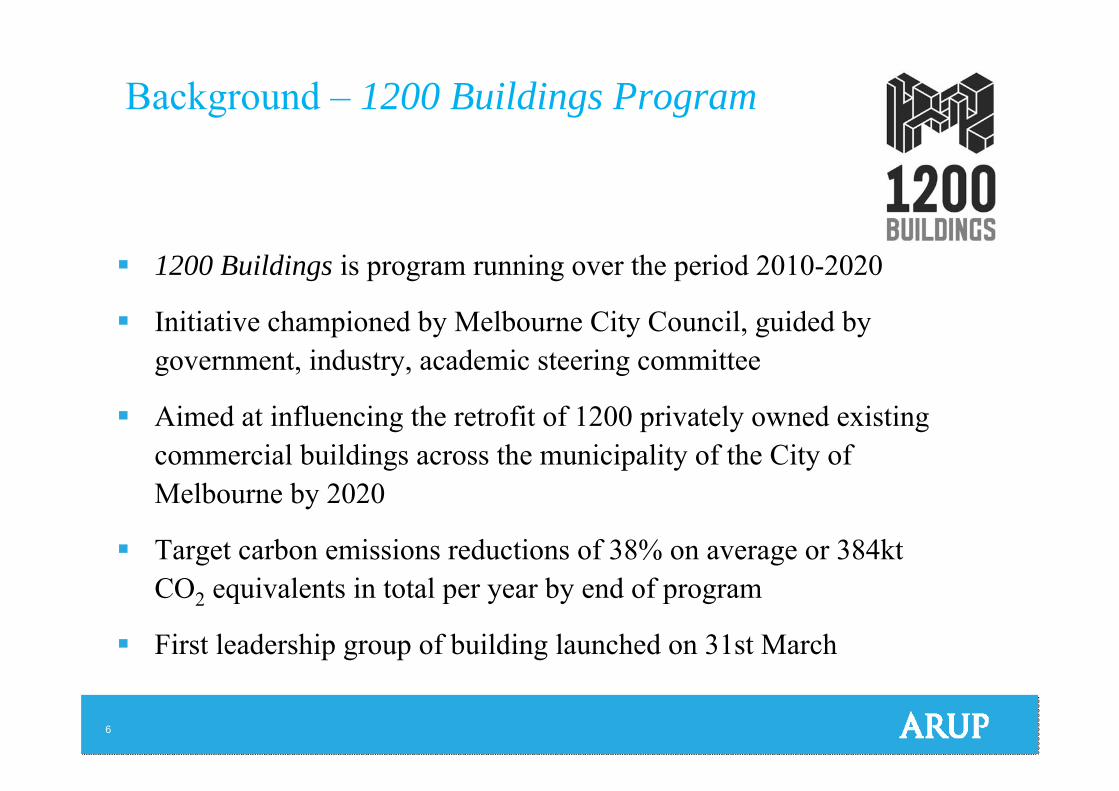
1200 Buildings is program running over the period 2010-2020
Initiative championed by Melbourne City Council, guided by government, industry, academic steering committee
Aimed at influencing the retrofit of 1200 privately owned existing commercial buildings across the municipality of the City of Melbourne by 2020
Target carbon emissions reductions of 38% on average or 384kt CO2 equivalents in total per year by end of program
First leadership group of building launched on 31st March
Background – 1200 Buildings Program
7
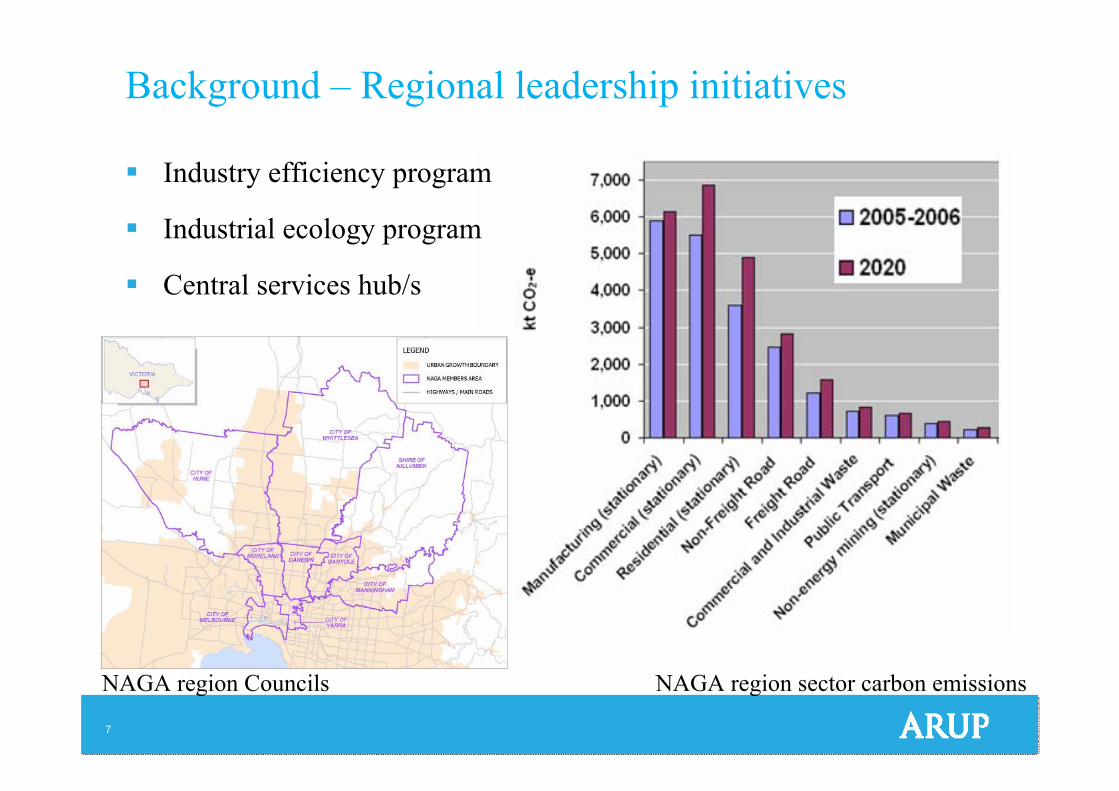
Background – Regional leadership initiatives
NAGA region Councils NAGA region sector carbon emissions
Industry efficiency program
Industrial ecology program
Central services hub/s
8
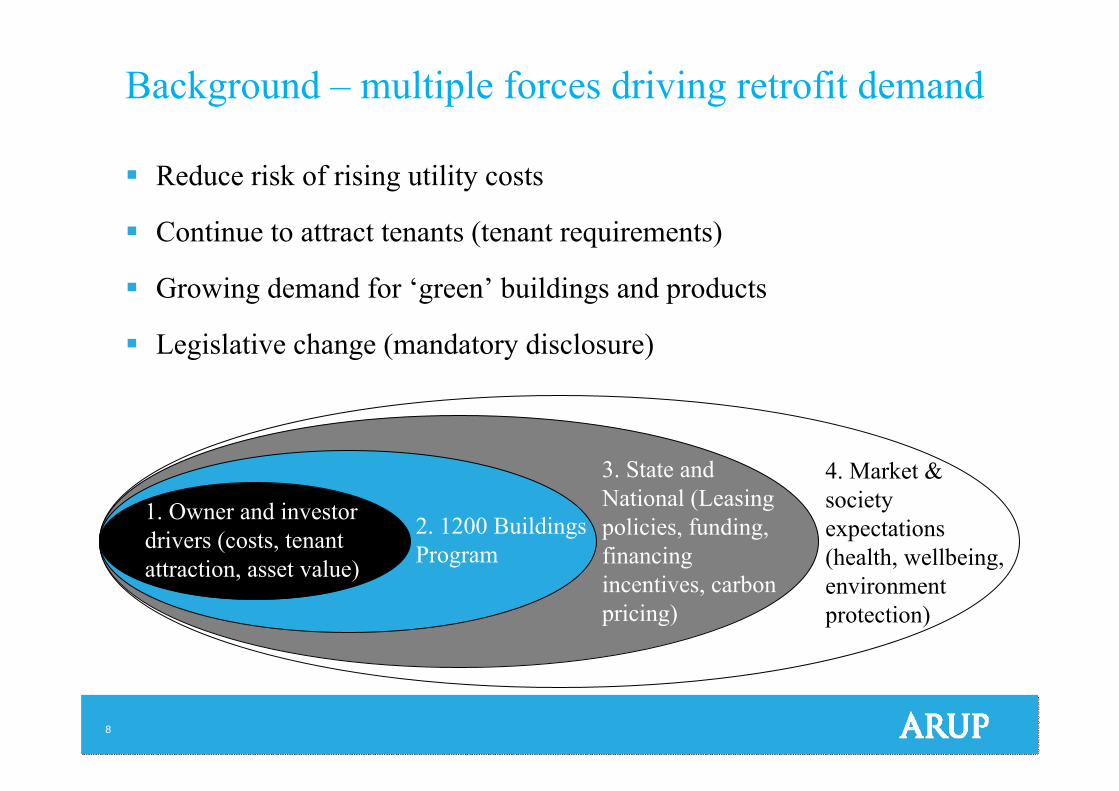
Background – multiple forces driving retrofit demand
Reduce risk of rising utility costs
Continue to attract tenants (tenant requirements)
Growing demand for ‘green’ buildings and products
Legislative change (mandatory disclosure)
3. State and National (Leasing policies, funding, financing incentives, carbon pricing)
2. 1200 Buildings Program
1. Owner and investor drivers (costs, tenant attraction, asset value)
4. Market & society expectations (health, wellbeing, environment protection)
9
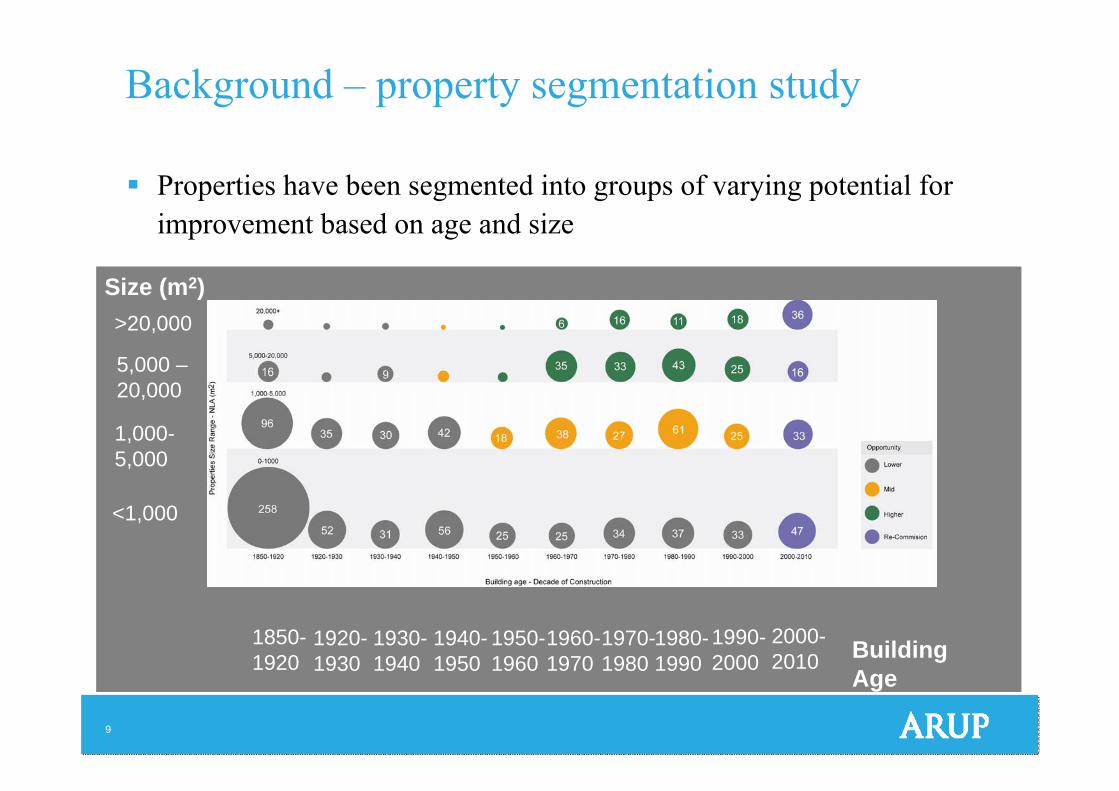
Background – property segmentation study
Properties have been segmented into groups of varying potential for improvement based on age and size
Replace with image
Size (m2)
5,000 –20,000
<1,000
1,000-5,000
>20,000
Building Age
1850-1920
1920-1930
1930-1940
1940-1950
1950-1960
1960-1970
1980-1990
2000-2010
1990-2000
1970-1980
10
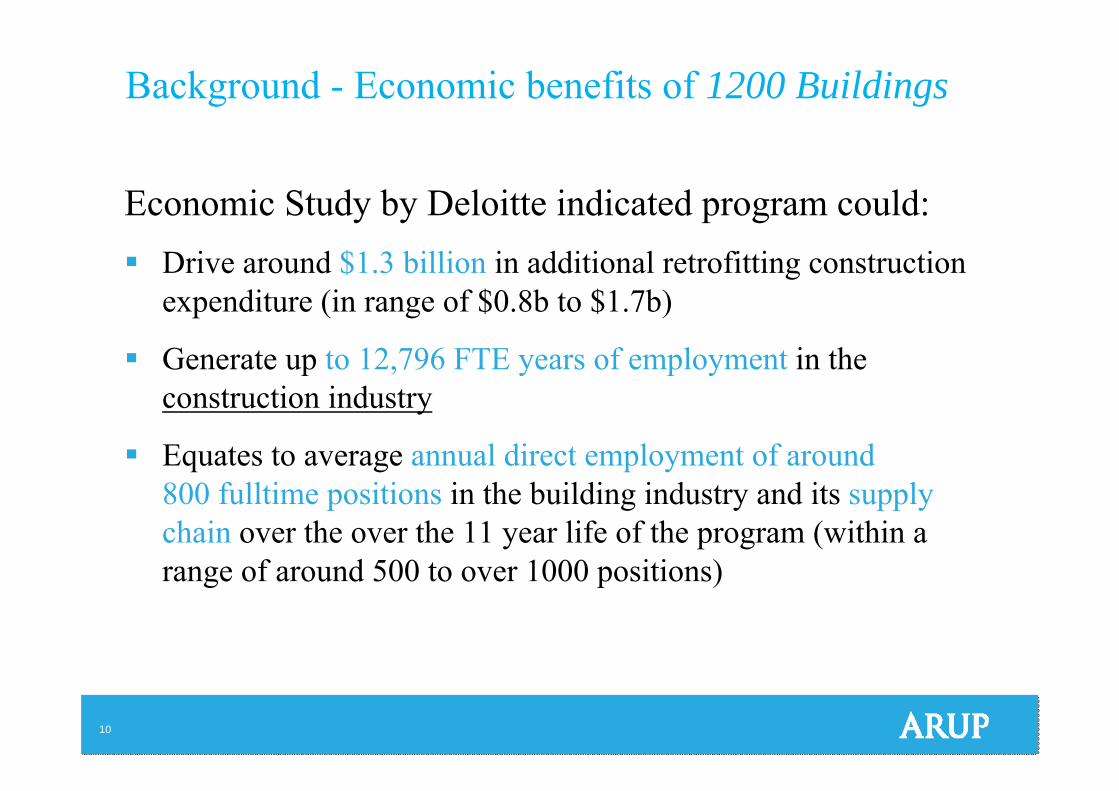
Background - Economic benefits of 1200 Buildings
Economic Study by Deloitte indicated program could: Drive around $1.3 billion in additional retrofitting construction
expenditure (in range of $0.8b to $1.7b)
Generate up to 12,796 FTE years of employment in the construction industry
Equates to average annual direct employment of around 800 fulltime positions in the building industry and its supply chain over the over the 11 year life of the program (within a range of around 500 to over 1000 positions)
11
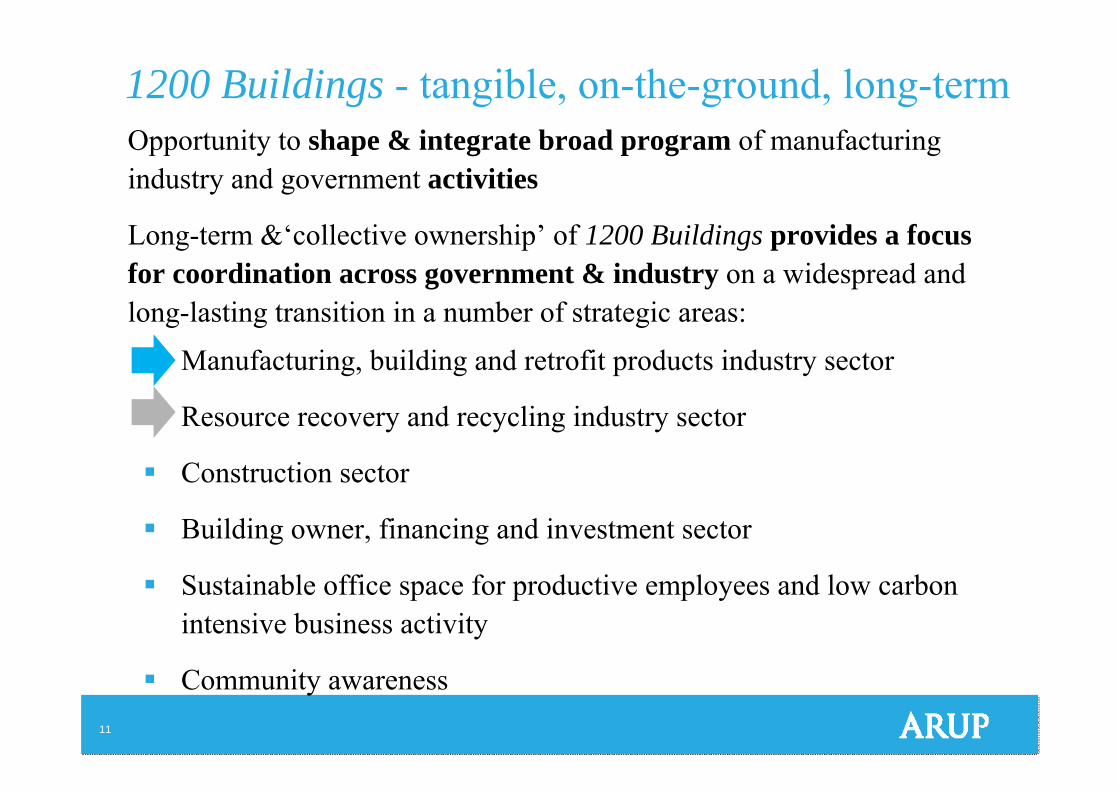
1200 Buildings - tangible, on-the-ground, long-termOpportunity to shape & integrate broad program of manufacturing industry and government activities
Long-term &‘collective ownership’ of 1200 Buildings provides a focus for coordination across government & industry on a widespread and long-lasting transition in a number of strategic areas:
Manufacturing, building and retrofit products industry sector
Resource recovery and recycling industry sector
Construction sector
Building owner, financing and investment sector
Sustainable office space for productive employees and low carbonintensive business activity
Community awareness
12
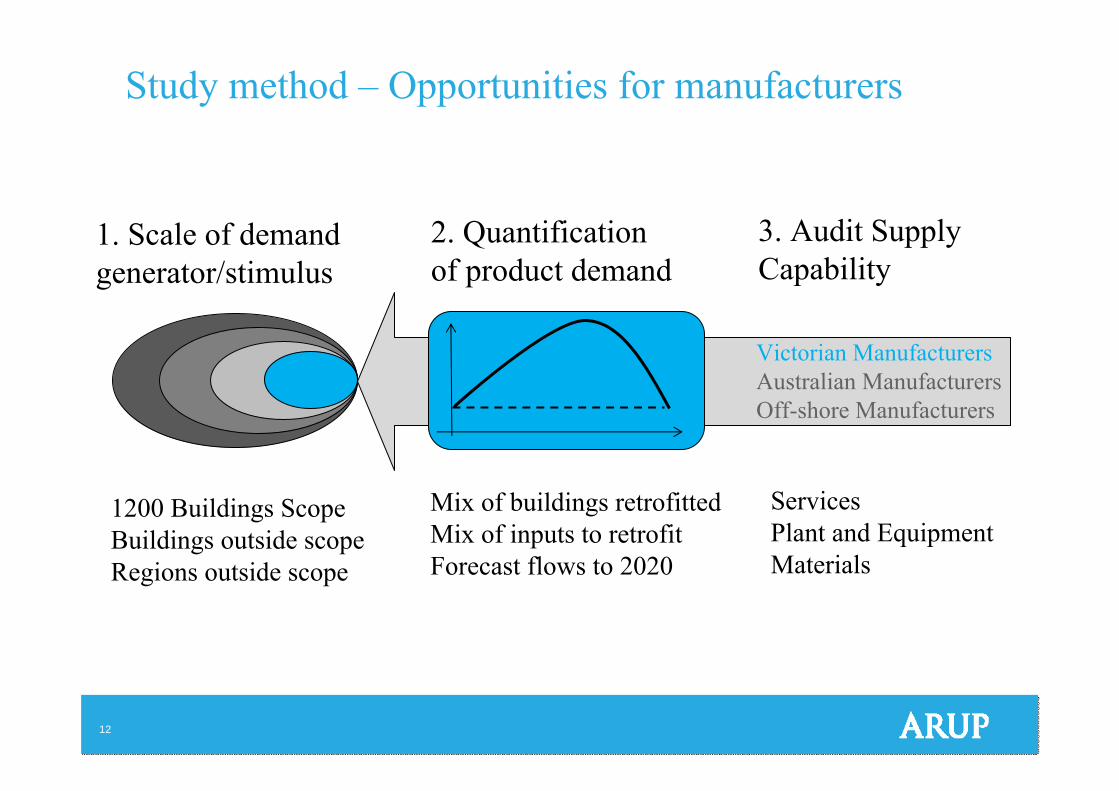
Study method – Opportunities for manufacturers
Victorian Manufacturers
3. Audit Supply Capability
Victorian ManufacturersAustralian ManufacturersOff-shore Manufacturers
ServicesPlant and EquipmentMaterials
1. Scale of demand generator/stimulus
1200 Buildings ScopeBuildings outside scopeRegions outside scope
2. Quantification of product demand
Mix of buildings retrofittedMix of inputs to retrofitForecast flows to 2020
13
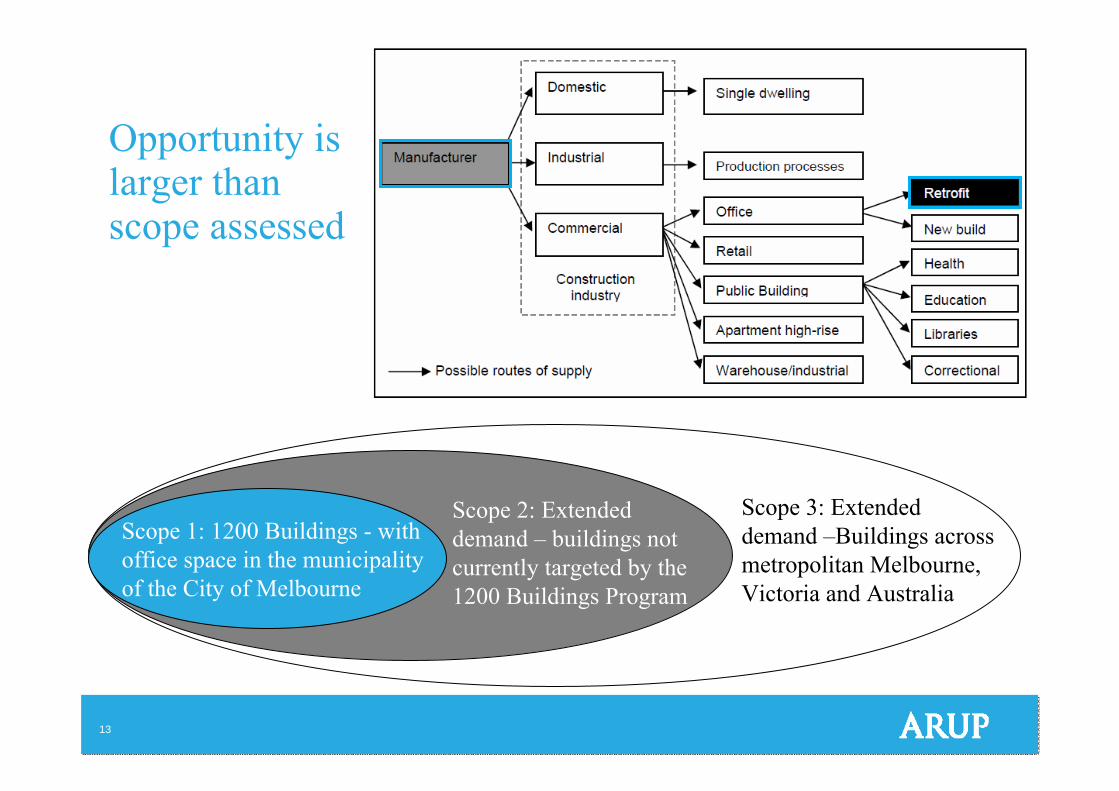
Opportunity is larger than scope assessed
Scope 3: Extended demand –Buildings across metropolitan Melbourne, Victoria and Australia
Scope 2: Extended demand – buildings not currently targeted by the 1200 Buildings Program
Scope 1: 1200 Buildings - with office space in the municipality of the City of Melbourne
14
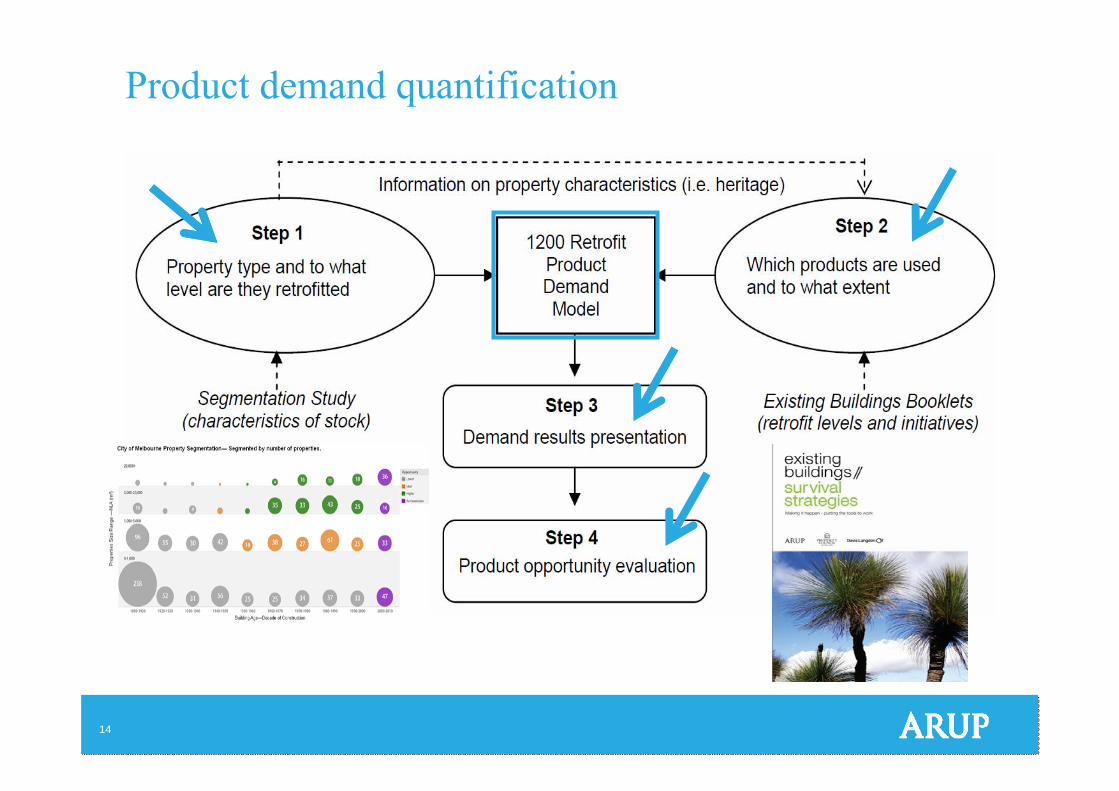
Product demand quantification
15
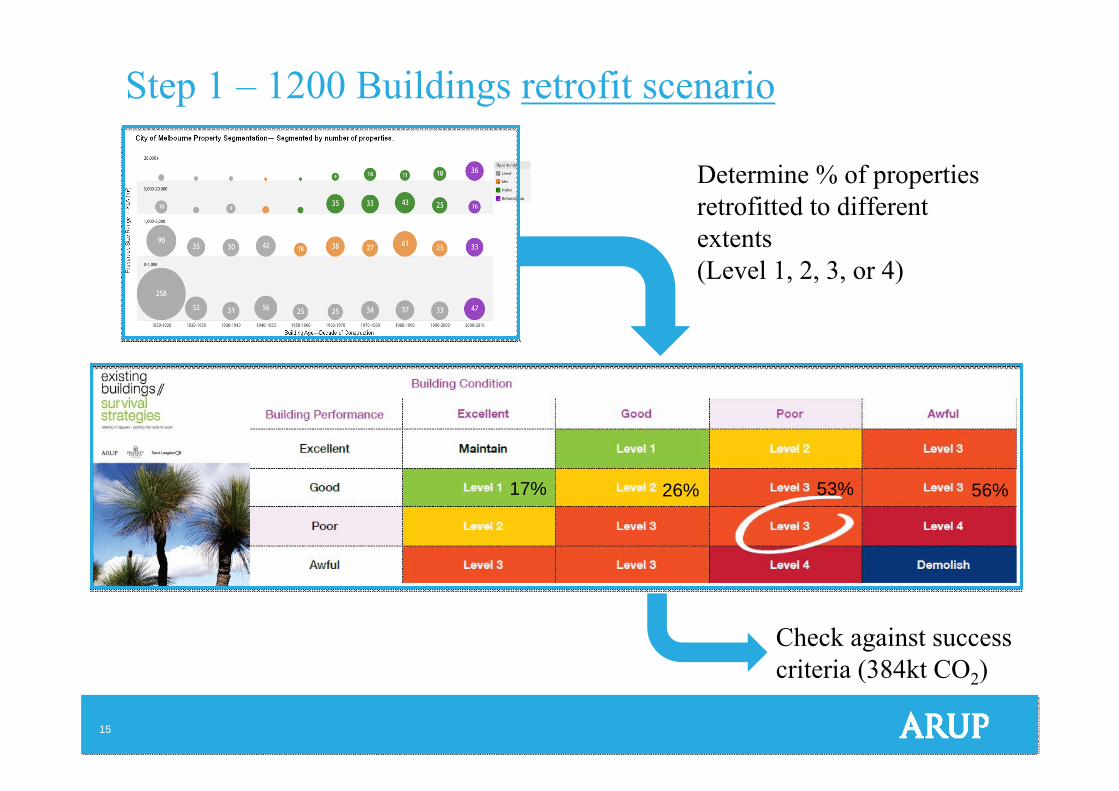
Step 1 – 1200 Buildings retrofit scenario
Determine % of properties retrofitted to different extents (Level 1, 2, 3, or 4)
Check against success criteria (384kt CO2)
17% 26% 53% 56%
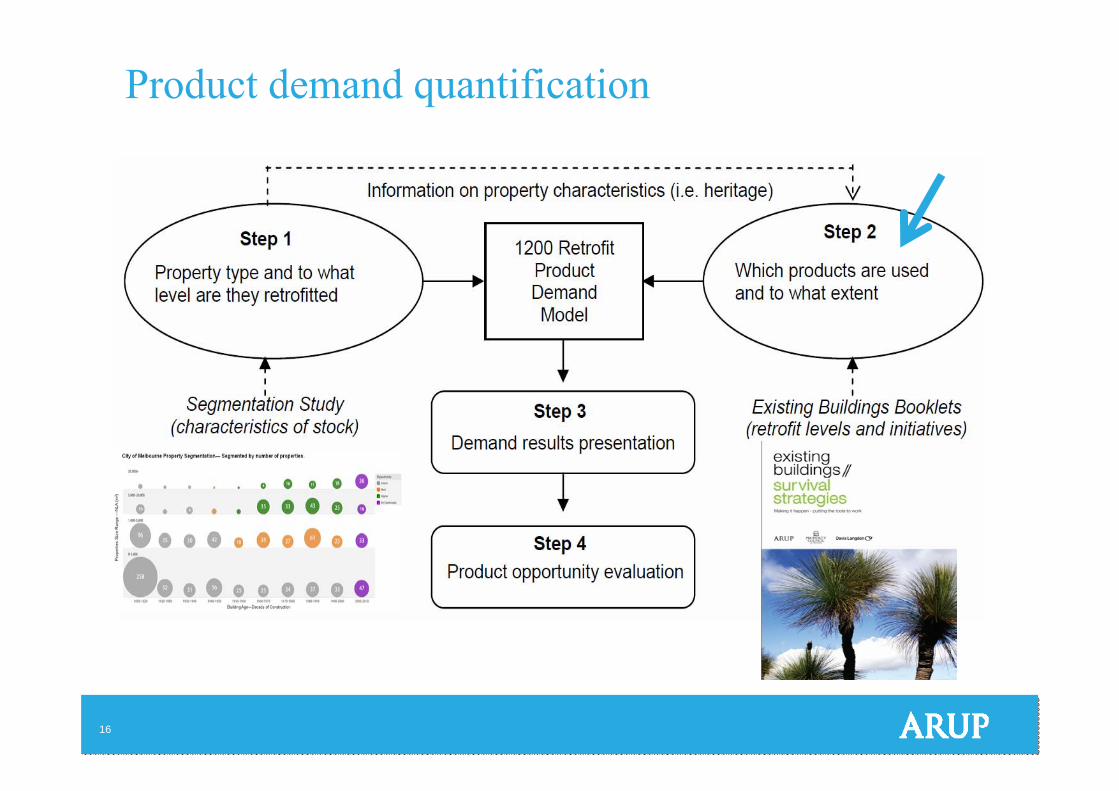
16
Product demand quantification
17
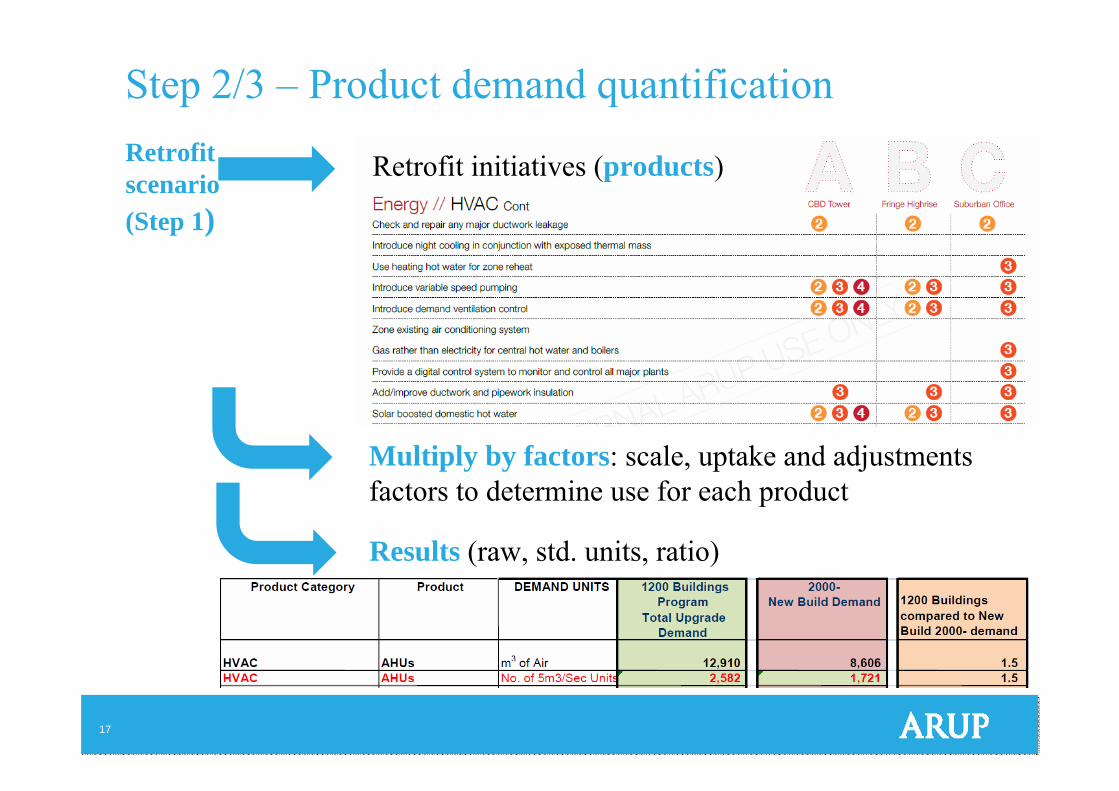
Step 2/3 – Product demand quantification
Retrofit initiatives (products)
Multiply by factors: scale, uptake and adjustments factors to determine use for each product
Results (raw, std. units, ratio)
Retrofit scenario (Step 1)
18
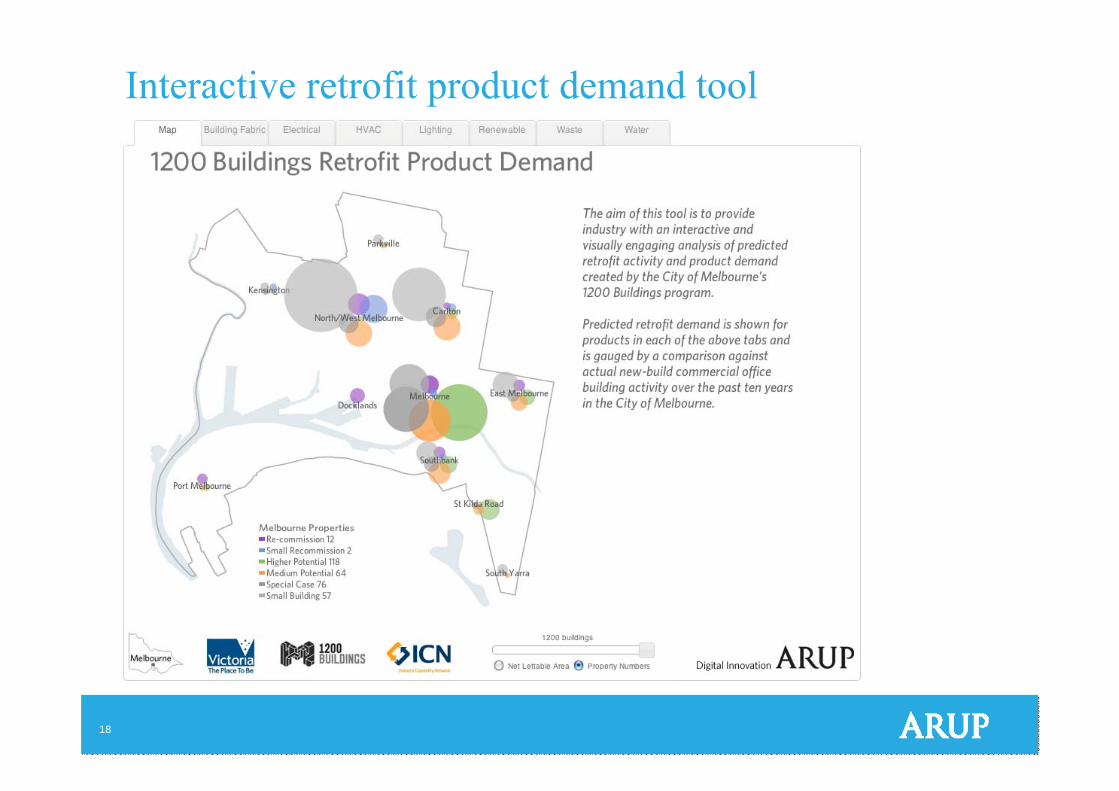
Interactive retrofit product demand tool
19
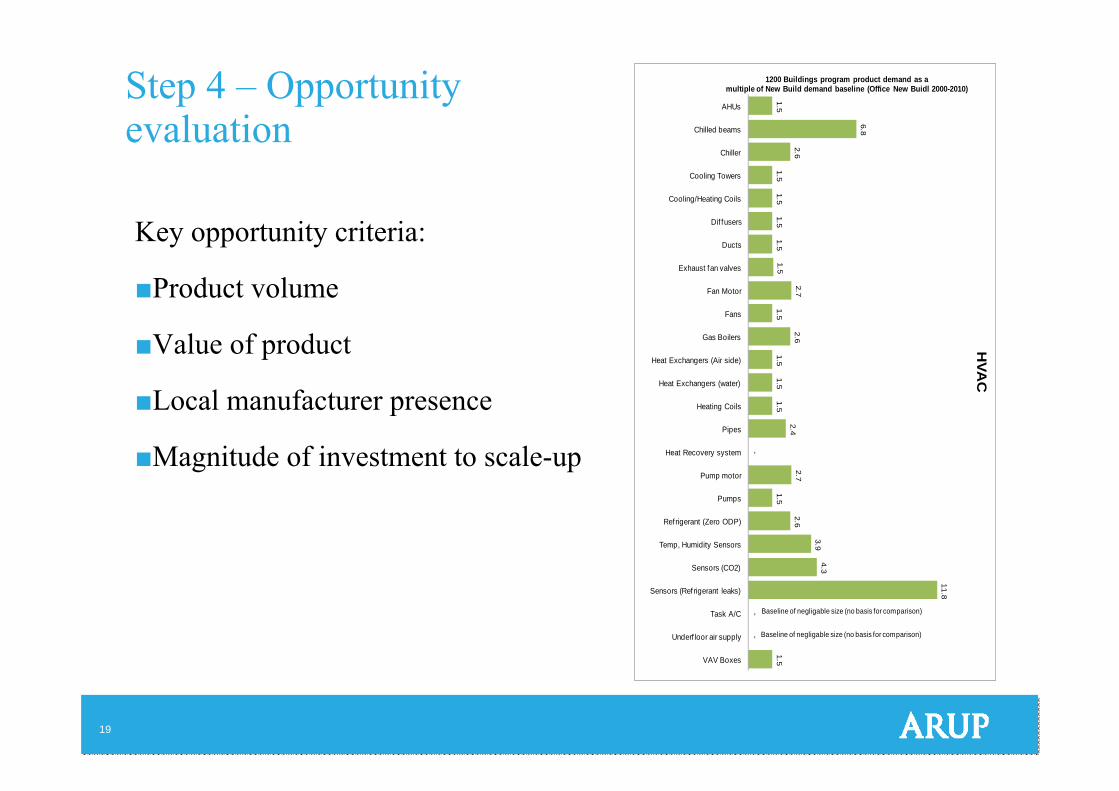
Step 4 – Opportunity evaluation
1.5
6.8
2.6
1.5 1.5
1.5 1.5
1.5
2.7
1.5
2.6
1.5 1.5
1.5
2.4
-
2.7
1.5
2.6
3.9 4.3
11.8
--
1.5
AHUs
Chilled beams
Chiller
Cooling Towers
Cooling/Heating Coils
Dif fusers
Ducts
Exhaust fan valves
Fan Motor
Fans
Gas Boilers
Heat Exchangers (Air side)
Heat Exchangers (water)
Heating Coils
Pipes
Heat Recovery system
Pump motor
Pumps
Refrigerant (Zero ODP)
Temp, Humidity Sensors
Sensors (CO2)
Sensors (Ref rigerant leaks)
Task A/C
Underf loor air supply
VAV Boxes
1200 Buildings program product demand as a multiple of New Build demand baseline (Office New Buidl 2000-2010)
HVA
C
Baseline of negligable size (no basis for comparison)
Baseline of negligable size (no basis for comparison)
Key opportunity criteria:
■Product volume
■Value of product
■Local manufacturer presence
■Magnitude of investment to scale-up
20
1.5
3.4
4.0 4.0
-
2.7
4.3
12.1 12.1
1.5
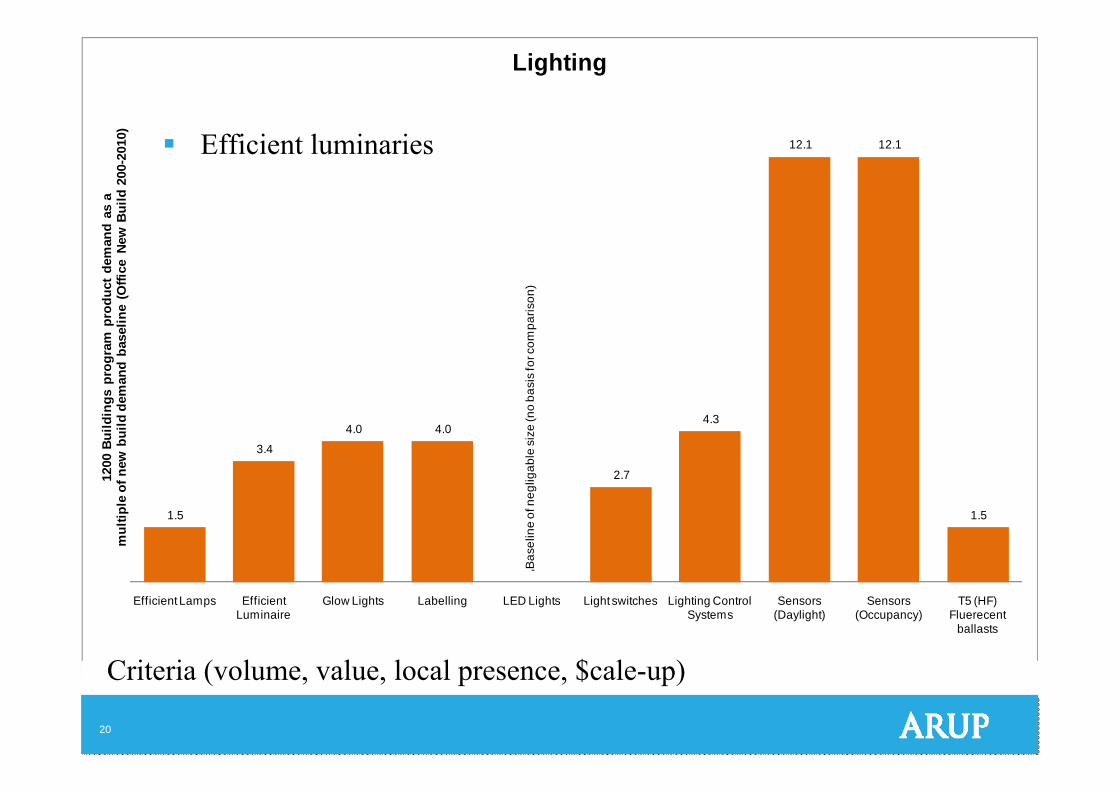
Efficient Lamps Efficient Luminaire
Glow Lights Labelling LED Lights Light switches Lighting Control Systems
Sensors (Daylight)
Sensors (Occupancy)
T5 (HF) Fluerecent
ballasts
1200
Bui
ldin
gs p
rogr
am p
rodu
ct d
eman
d as
a
mul
tiple
of n
ew b
uild
dem
and
base
line
(Offi
ce N
ew B
uild
200
-201
0)
Lighting
Bas
elin
eof
neg
ligab
le s
ize
(no
basi
s fo
r com
paris
on)
Efficient luminaries
Criteria (volume, value, local presence, $cale-up)
21
4.0
0.3
3.1
- -
1.5 1.5
-
4.5
-
6.7
1.5
1.2
0.3
Blinds Cladding Double Glazed
units (low-e)
FSC Timber
Double Skin
Glazing
Insulation Laminate Glazing (Low-e)
Natural Ventilation
Louvers
Low-e Film
Openable Windows
Solar Ref lective
Paint
Weather Sealing
Shading Skylights
1200
Bui
ldin
gs p
rogr
am p
rodu
ct d
eman
d as
a
mul
tiple
of N
ew B
uild
dem
and
base
line
(Offi
ce N
ew B
uidl
200
0-20
10)
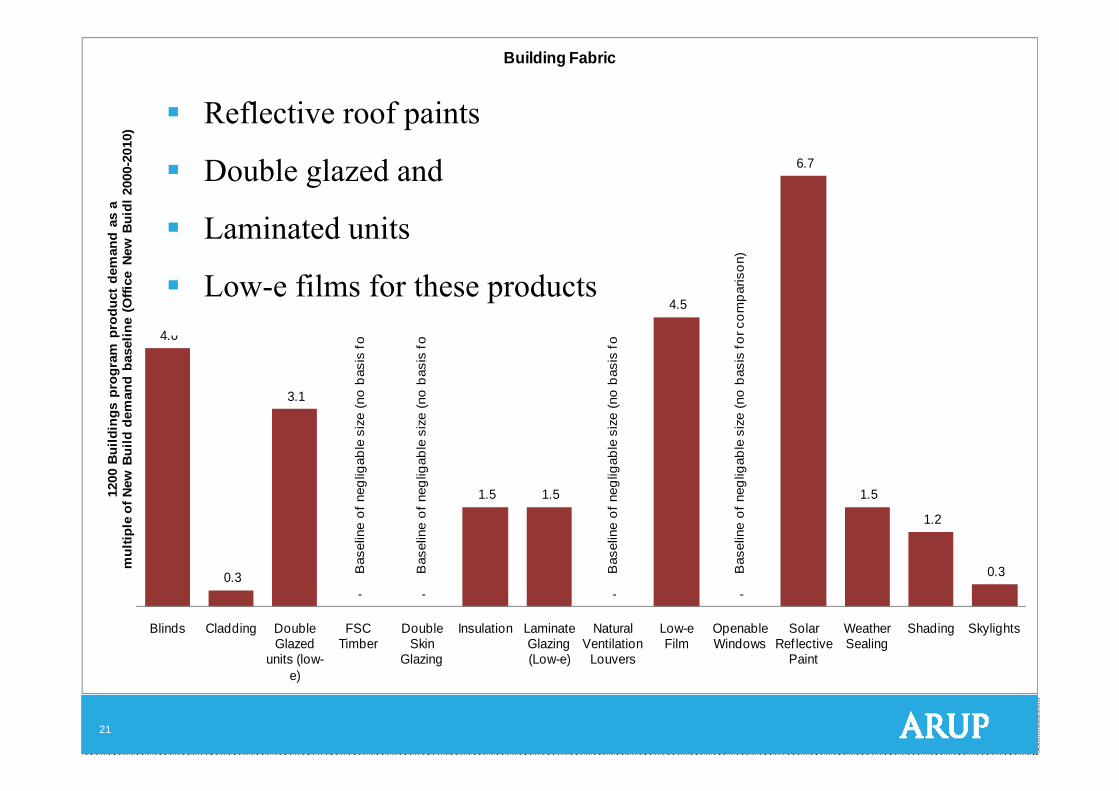
Building Fabric
Bas
elin
eof
neg
ligab
le s
ize
(no
basi
s fo
r com
paris
on)
Bas
elin
eof
neg
ligab
le s
ize
(no
basi
s fo
r com
paris
on)
Bas
elin
eof
neg
ligab
le s
ize
(no
basi
s fo
r com
paris
on)
Bas
elin
eof
neg
ligab
le s
ize
(no
basi
s fo
r com
paris
on)
Reflective roof paints
Double glazed and
Laminated units
Low-e films for these products
22
5.5
2.7 2.7
7.6
10.6
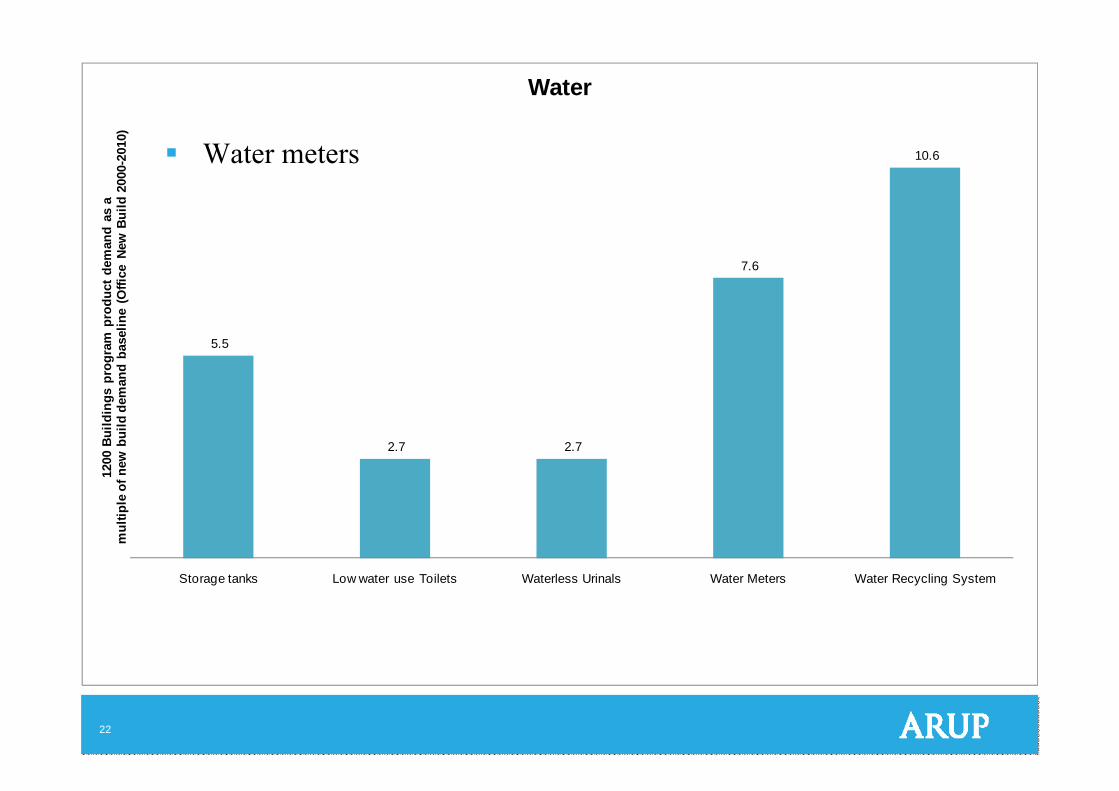
Storage tanks Low water use Toilets Waterless Urinals Water Meters Water Recycling System
1200
Bui
ldin
gs p
rogr
am p
rodu
ct d
eman
d as
a
mul
tiple
of n
ew b
uild
dem
and
base
line
(Offi
ce N
ew B
uild
200
0-20
10)
Water
Water meters
23
ICN input
Independent review of demand estimates Identify products with significant demands
Identify manufacturers for inclusion in case studies
Identify Victorian manufacturers for audit
Selection of priority manufacturers used in detailed audit: based on consultation between ICN and Arup’s building
engineering and construction industry supplier market experience
24
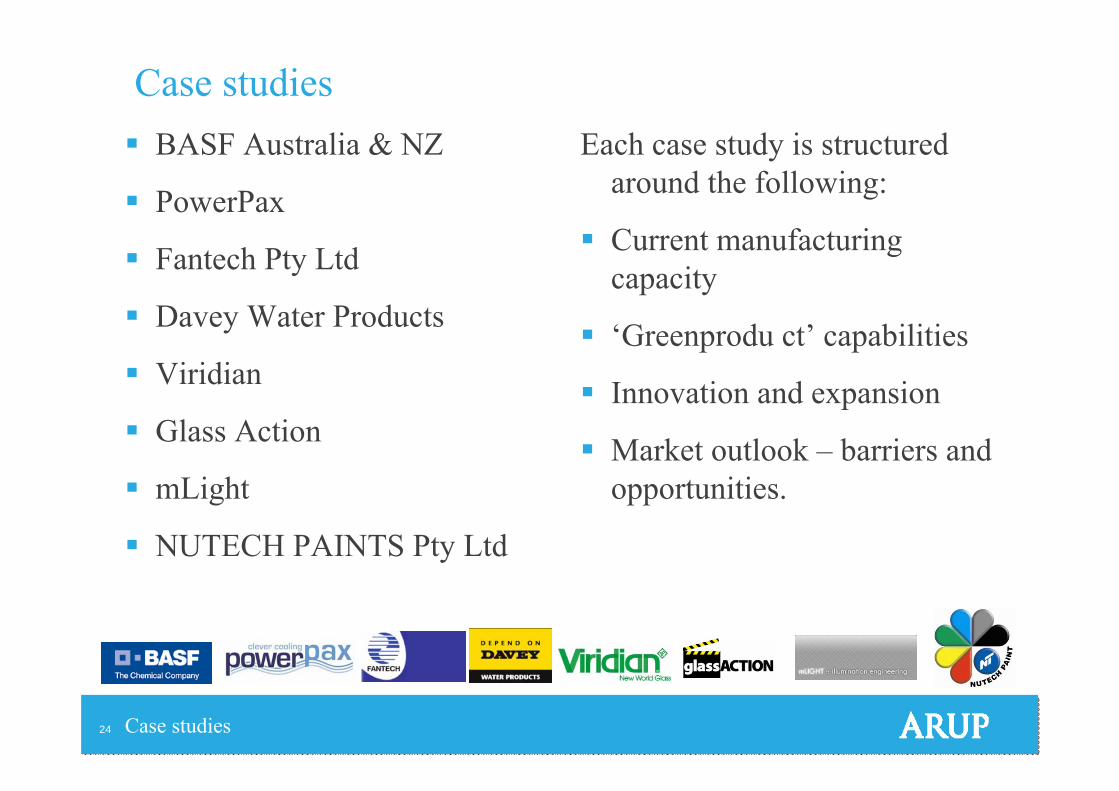
Each case study is structured around the following:
Current manufacturing capacity
‘Greenprodu ct’ capabilities
Innovation and expansion
Market outlook – barriers and opportunities.
BASF Australia & NZ
PowerPax
Fantech Pty Ltd
Davey Water Products
Viridian
Glass Action
mLight
NUTECH PAINTS Pty Ltd
Case studies
Case studies
25
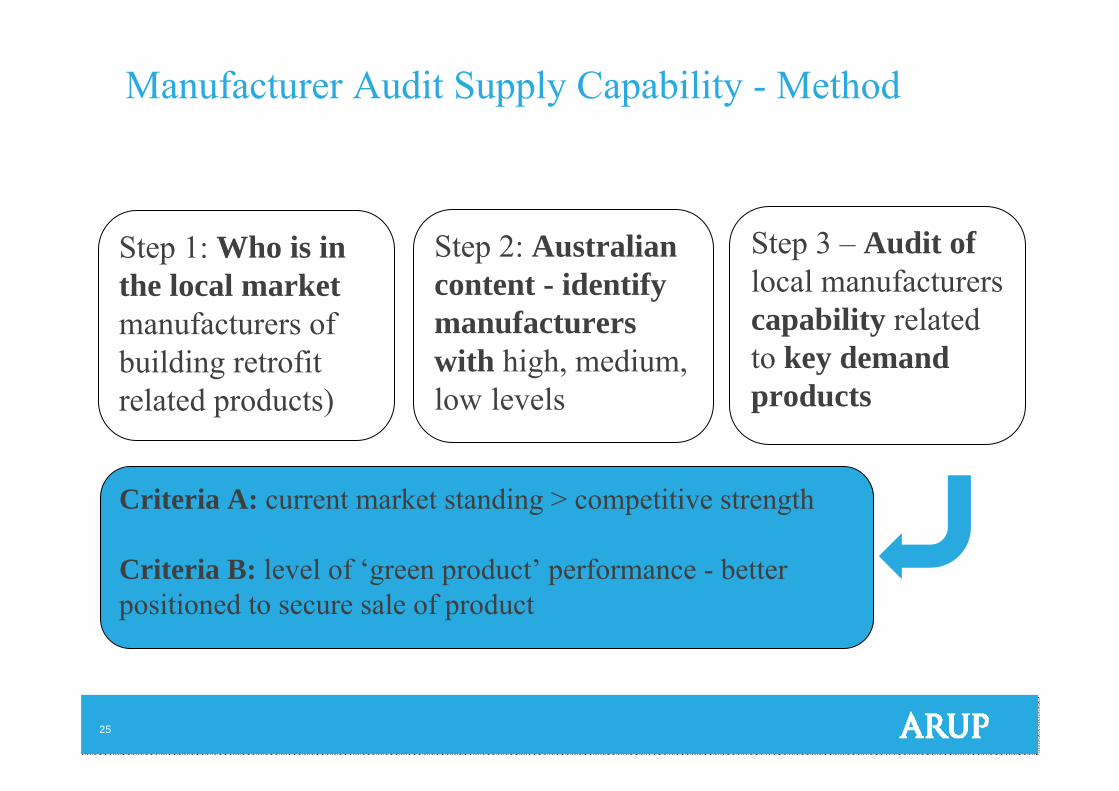
Manufacturer Audit Supply Capability - Method
Step 1: Who is in the local market manufacturers of building retrofit related products)
Step 2: Australian content - identify manufacturers with high, medium, low levels
Step 3 – Audit of local manufacturers capability related to key demand products
Criteria A: current market standing > competitive strength
Criteria B: level of ‘green product’ performance - better positioned to secure sale of product
26
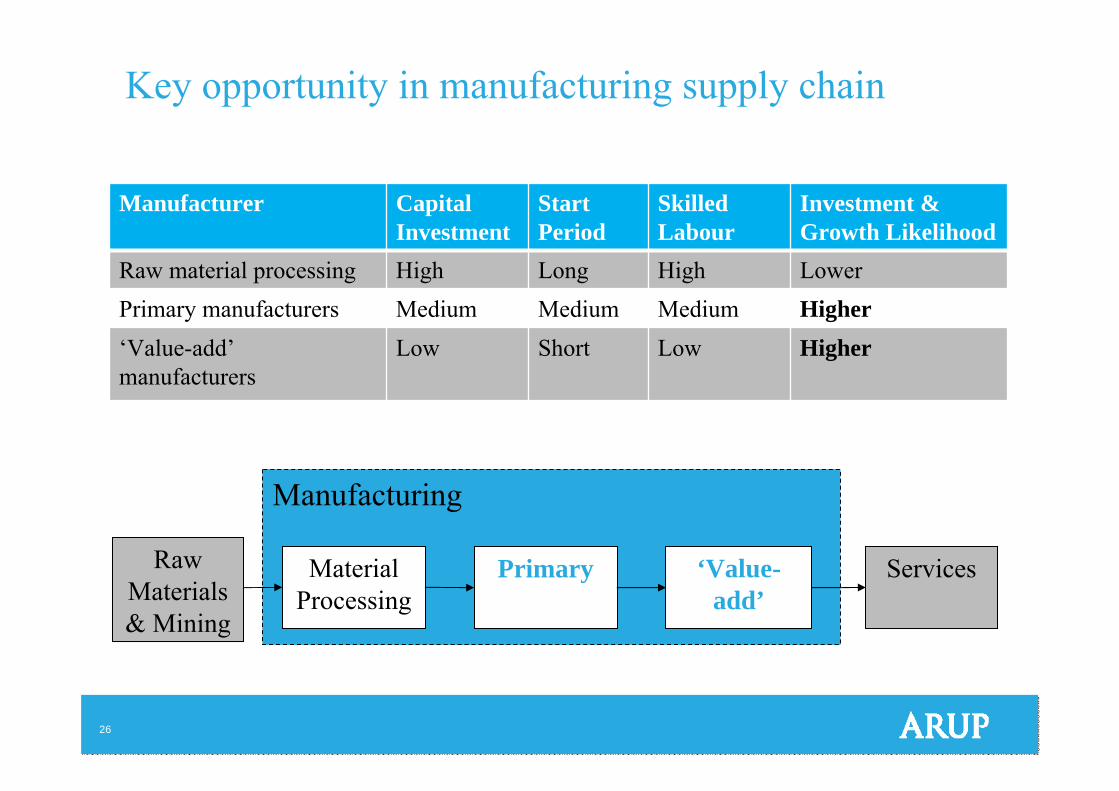
Key opportunity in manufacturing supply chain
Manufacturing
Raw Materials & Mining
Material Processing
‘Value-add’
ServicesPrimary
Manufacturer Capital Investment
Start Period
Skilled Labour
Investment & Growth Likelihood
Raw material processing High Long High LowerPrimary manufacturers Medium Medium Medium Higher‘Value-add’manufacturers
Low Short Low Higher
27
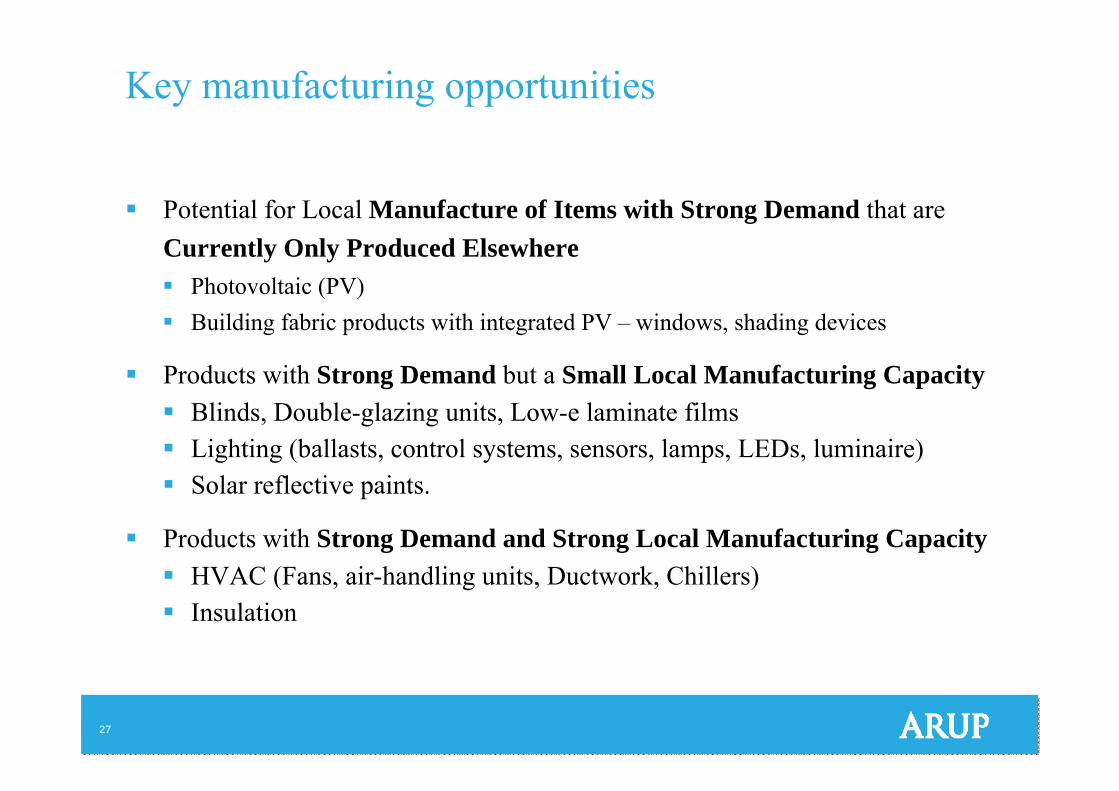
Key manufacturing opportunities
Potential for Local Manufacture of Items with Strong Demand that are Currently Only Produced Elsewhere Photovoltaic (PV) Building fabric products with integrated PV – windows, shading devices
Products with Strong Demand but a Small Local Manufacturing Capacity Blinds, Double-glazing units, Low-e laminate films Lighting (ballasts, control systems, sensors, lamps, LEDs, luminaire) Solar reflective paints.
Products with Strong Demand and Strong Local Manufacturing Capacity HVAC (Fans, air-handling units, Ductwork, Chillers) Insulation
28
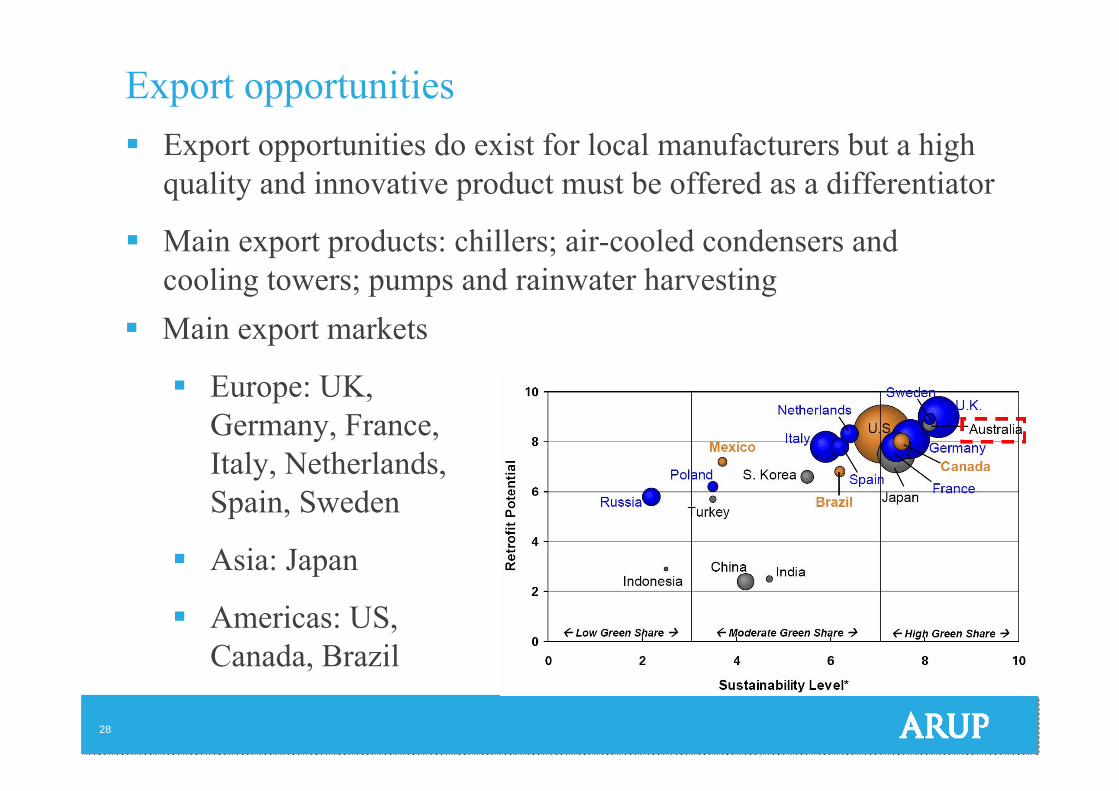
Export opportunities Export opportunities do exist for local manufacturers but a high
quality and innovative product must be offered as a differentiator
Main export products: chillers; air-cooled condensers and cooling towers; pumps and rainwater harvesting
Main export markets
Europe: UK, Germany, France, Italy, Netherlands, Spain, Sweden
Asia: Japan
Americas: US, Canada, Brazil
29
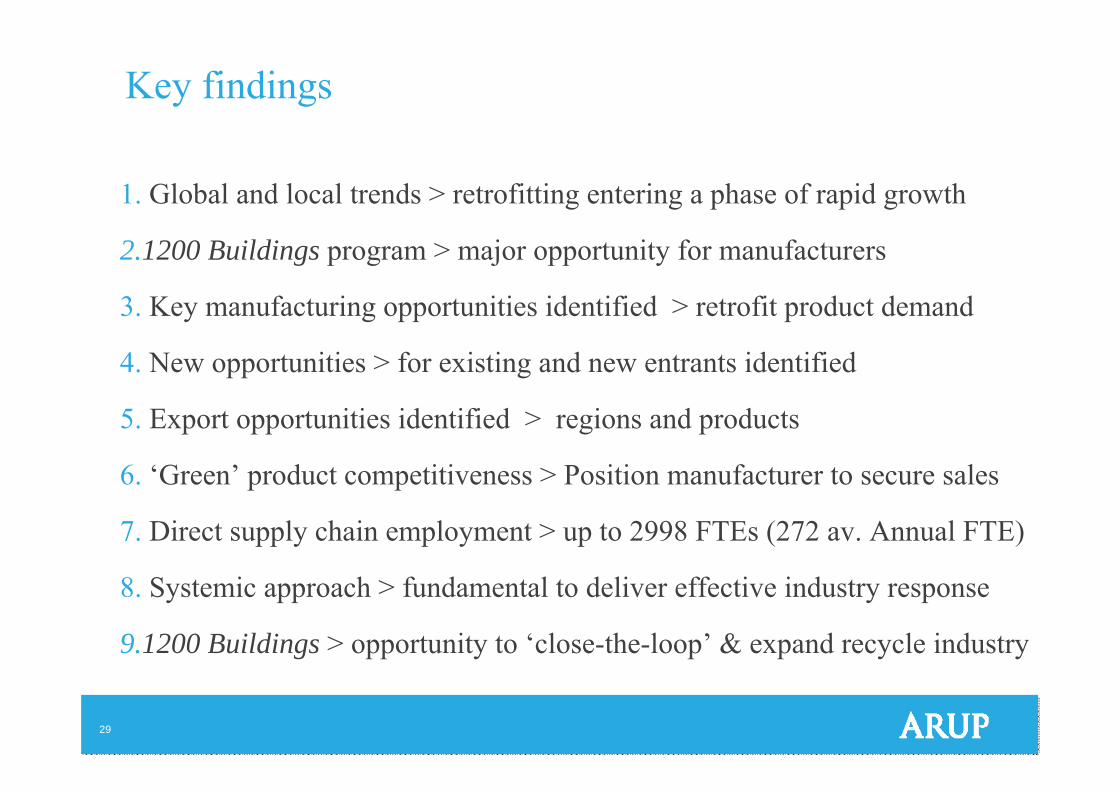
Key findings
1. Global and local trends > retrofitting entering a phase of rapid growth
2.1200 Buildings program > major opportunity for manufacturers
3. Key manufacturing opportunities identified > retrofit product demand
4. New opportunities > for existing and new entrants identified
5. Export opportunities identified > regions and products
6. ‘Green’ product competitiveness > Position manufacturer to secure sales
7. Direct supply chain employment > up to 2998 FTEs (272 av. Annual FTE)
8. Systemic approach > fundamental to deliver effective industry response
9.1200 Buildings > opportunity to ‘close-the-loop’ & expand recycle industry
Disclaimer
Product demand projections detailed in this study will vary depending on the amount of retrofit activity the 1200 Buildings program stimulates and the extent of retrofit that is implemented in buildings. As there are inherent uncertainties in predicting demand from future activity the product demand projections and findings may not be accurate. Specific advice should be sought and further detailed analysis undertaken before acting or relying on the product demand projections.

32