Embed Size (px)
Citation preview

Future Emissions of Air Pollutants and Greenhouse Gases Over Korea and East Asia
Jung-Hun Woo1, Younha Kim1, Ki-Chul Choi1, Dong-Keun Lee2, Jin-Han Park2, Tae Yong Jung3, Sung-Chul Hong4, Sangkyun Kim4, Ji-Hyung Hong4
plus IIASA, NIES, and many others…
1. Konkuk University, Korea (UC Irvine)2. Seoul National University, Korea3. KDI School, Korea4. National Institute of Environmental Research, Korea
HTAP Emission Scenario Workshop, February 12, 2015

Wish List
1. Future Scenarios for Climate-AQ over East Asia(Big and Far)
2. Future Scenarios for AQ Policy over Korea(Medium Range)
3. Emissions Evaluation : East Asia and Seoul(Close and Firm)
4. Summary

Domain1[105(EW)x65(NS)]
54km gridsDomain2
[45(EW)x69(NS18km grids
/CMAQ
/GEOS-Chem
Climate-Air Quality Modeling System- NIER/SNU-ICAMS*
3
OFF/ON LineCoupling
Climate Change Model
Atmos. Chemistry Model RegionalAtmos. Chemistry Model
Regional Climate Change Model
Global Scale Regional Scale
Regional ScaleGlobal Scale
OFF/ON LineCoupling
Downscaling
Downscaling
Integrated Modeling System(NIER -ICAMS)
OFF/ON LineCoupling
MM5
CMAQ
CCSM
GEOS-Chem
* KU-EPS : Konkuk University Emission Processing System
Global and regional emission processing system(KU-EPS* and SMOKE-Asia)
Global and Regional Emission Domains
Asia
• Integrated Climate Change and Air Quality Modeling System
- National Institute of Environmental Research(NIER), 2011; Lee et al., AE, 2015

Evolution of Climate Change and Air Quality Study using ICAMS
NCAR CCSM v3 (GCM)
GEOS-Chem (CTM)
for global ozone-PM
inputmeteorologygreenhouse
gases
ozone-PM precursors
boundaryconditions
boundaryconditions
CMAQ for regional ozone-
PM
inputmeteorology
MM-5 or WRF RCM
ozone-PM precursors
Applied to 2000 - 2100 global change simulations with six IPCC scenarios; Compare 2020, 2050, 2100 climate (10-yr averages) to 2000 (1998-2000)
4
IPCCfuture emission (SRES) Scenario 2008~2010
(1st Stage)
IPCCfuture emission (RCP) Scenario 2011~2013
(2nd Stage)
Newfuture emission (NIER) Scenario 2014~??
(3rd Stage)
IIASA
NIES
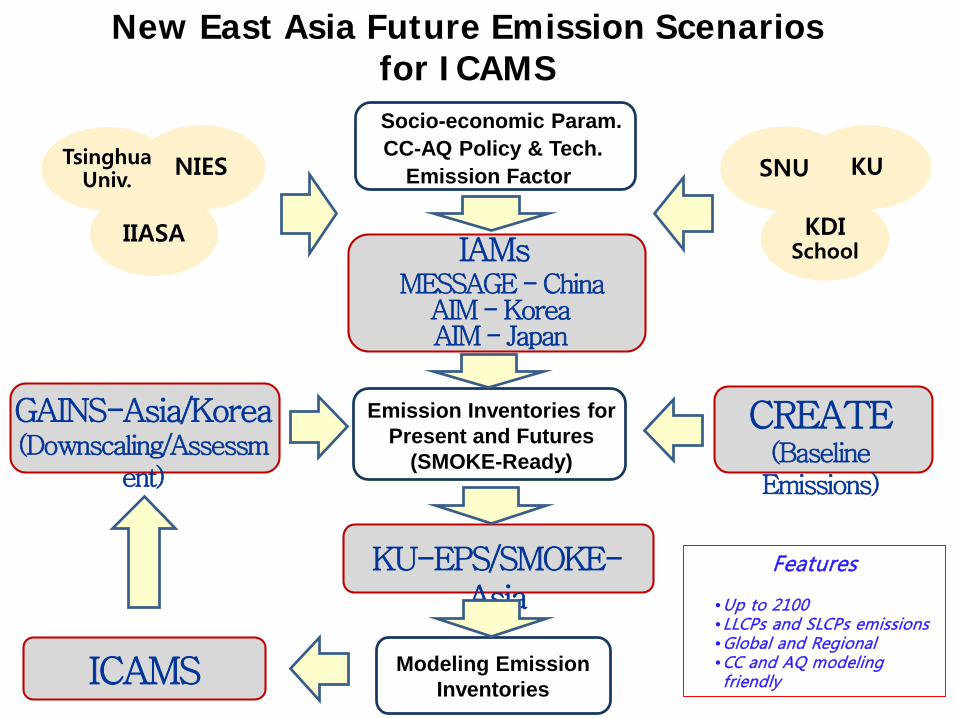
New East Asia Future Emission Scenarios for ICAMS
IAMs
TsinghuaUniv.
Socio-economic Param.CC-AQ Policy & Tech.
Emission Factor
CREATE(Baseline Emissions)
Emission Inventories for Present and Futures
(SMOKE-Ready)
KU-EPS/SMOKE-Asia
Modeling Emission Inventories
GAINS-Asia/Korea(Downscaling/Assessm
ent)
KU
MESSAGE -ChinaAIM -KoreaAIM - Japan
SNU
KDISchool
ICAMS
Features
•Up to 2100•LLCPs and SLCPs emissions•Global and Regional•CC and AQ modeling friendly

Social-Economic Condition
Low emissionScenario
High emissionScenario
Includingmitigation policies
BAUScenario
Socio-economic scenarios are matched to SSP2, 3, 5

Social economic condition
<Template for policy research>
BAU scenario contained the national policy of mitigation
<Example>
Distribution rate of high efficiency electronic device in residential sector from 2010 to 2050
Distribution rate of electric cars in transport sector from 2010 to 2020
National development plan in power sector to 2020
Energy plan in industrial sector
0
10
20
30
40
50
60
2010
2014
2018
2022
2026
2030
2034
2038
2042
2046
2050
2054
2058
2062
2066
2070
2074
2078
2082
2086
2090
2094
2098
Population
BAU Low High
Millions
30.0
42.5
18.5
48.2
Source : IIASA
0
2000
4000
6000
8000
10000
2010
2014
2018
2022
2026
2030
2034
2038
2042
2046
2050
2054
2058
2062
2066
2070
2074
2078
2082
2086
2090
2094
2098
GDP
BAU Low High
USD Billions
1321

Energy and Emissions Projection(CO2)
-
100
200
300
400
500
600
700
800
900
1,000
2010 2020 2030 2040 2050 2060 2070 2080 2090 2100
CO2 Emissions (Total)
BAU Low High
0
50
100
150
200
250
2010 2020 2030 2040 2050 2060 2070 2080 2090 2100
Energy Consumption(Total)
BAU Low High
0
5
10
15
20
25
2010 2030 2050 2100
Residential
BAU RSD Low RSD High RSD
0
5
10
15
20
25
2010 2030 2050 2100
Commercial
BAU SER Low SER High SER
0123456789
2010 2030 2050 2100
Steel
BAU STL Low STL High STL
0
20
40
60
80
100
120
140
2010 2030 2050 2100
Transport
BAU TRT Low TRT High TRT
MCO2t M TOE M TOE
M TOE M TOE M TOE
CO2Emissions
Inter-comparison
MCO2t

Wish List
1. Future Scenarios for Climate-AQ over East Asia(Big and Far)
2. Future Scenarios for AQ Policy over Korea(Medium Range)
3. Emissions Evaluation : East Asia and Seoul(Close and Firm)
4. Summary
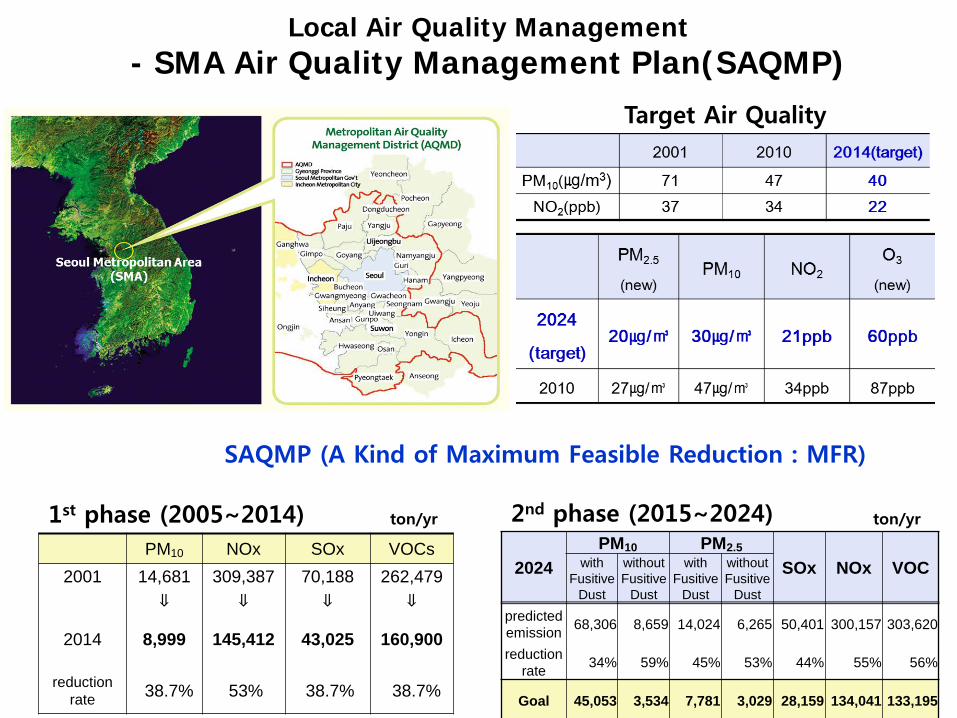
Local Air Quality Management - SMA Air Quality Management Plan(SAQMP)
Target Air Quality
SAQMP (A Kind of Maximum Feasible Reduction : MFR)
PM10 NOx SOx VOCs2001 14,681 309,387 70,188 262,479
⇓ ⇓ ⇓ ⇓
2014 8,999 145,412 43,025 160,900
reductionrate 38.7% 53% 38.7% 38.7%
ton/yr1st phase (2005~2014)
2024PM10 PM2.5
SOx NOx VOCwith Fusitive
Dust
without Fusitive
Dust
with Fusitive
Dust
without Fusitive
Dustpredicted emission 68,306 8,659 14,024 6,265 50,401 300,157 303,620
reductionrate 34% 59% 45% 53% 44% 55% 56%
Goal 45,053 3,534 7,781 3,029 28,159 134,041 133,195
ton/yr2nd phase (2015~2024)

Implementation of GAINS-Korea Model
• Regions : 17, Year: 2010(base) ~ 2050(Future)
• Pollutants: CO2, CH4, NOx, N2O, PM10, PM2.5, SO2,
VOC, NH3, CO, BC, OC, Mercury
• Sectors: Energy, Mobile, Industrial Process, VOCs,
Agriculture (detail sectors : 250)
• Source-Receptor Impact (CAMx & SMOKE)
KORS-NORT: 한국의 북부KORS-SOUT: 한국의 남부KORS-SEOI: 서울, 인천 등의지역KORS-PUSA: 부산 등
SR Matrices Blame Matrices
Jerzy Bartnicki, 2000• K: The influence of background conc. • SOMO35: the annual sum of daily maximum 8hr running average
of ozone subtracting 35 ppbv
useful tool to find better solution with least cost
GAINS-Asia : 4 regions
GAINS-Korea designed 17regions
11

• Sce1, NFC2010 : No further control after year 2010. All controls will be phased-out as life time reached
• Sce2, CLE2010 : Maintain 2010 level of control until 2025. No more control policies/devices will be introduced
• Sce3, SAQMP : Implement all planned control policies and technologies (SAQMP 1st + 2nd) until year 2025.
• Sce4, MFR2025 : Maximum Feasible Reduction by 2025. More stringent control technologies and control policies will be introduced
Four Scenario pathways
Base year 2010 2025
NFC 2010
2020
Emis
sion
2015
CLE 2010
SAQMP
MFR 2025
Real Control
Policies
(current + planed)
More stringentControl Policy
No Control
12

Selection of Control Measures from SAQMP (1st+2nd)
Source Regulations Source RegulationsTotal amount regulation and Emissions Trading Stringent emission standards for new vehicles
Expansion of areas using low-Sulfur fuel Distribution of low emission vehicles
Fuel switching, from Bituminous coal to LNG Emission reduction plan for specified-diesel-vehicles: SCR/DPF installation
Stricter Emission Allowance Standard Emission reduction plan for specified-diesel-vehicles: DOC installation
Introduction of emission taxes on Nox Emission reduction plan for specified-diesel-vehicles: LPG conversion
Closure of small-scale incineration facilities Early retirement program
Increase of environment-friendly firms Stringent emission standards
Agreement on voluntary environmental agreement Higher quality standards for engine oil
Training of Manuel for Best Facility Management Mandatory regular inspection program
Financial support for facility investment Higher quality standards for gasoline fuels
Stricter management of facility for PM10 & VOC Improvement of public transportation infrastructure
Expansion of district air conditioning and heating system Stage II controls at gas stations
Expansion of small-scale Community Energy System Restriction of the use of cutback asphalt
Expansion of Low-NOx boilers Restriction of solvent for consumer products
Better management of LNG facilities Solvent Emissions Directive for paint in construction and
Distribution of alternative energy: solar energy Expansion of water-paint type in construction and buildings
Regulation on indoor air-conditioning and heating Installation oc the control application for Briquettes production
Eco- building standards and certification programs Installation of the application for Charbroiling Restaurants
Conversion of anthracite into natural gas Clean Road
Expansion of areas using low-Sulfur and clean fuels Expansionof low tire wear
Regulation of fugitive dust in Industrial Process Ground to Green Infra
Mobile
AreaSource
AreaSource
PointSource
Source Regulations Source RegulationsTotal amount regulation and Emissions Trading Stringent emission standards for new vehicles
Expansion of areas using low-Sulfur fuel Distribution of low emission vehicles
Fuel switching, from Bituminous coal to LNG Emission reduction plan for specified-diesel-vehicles: SCR/DPF installation
Stricter Emission Allowance Standard Emission reduction plan for specified-diesel-vehicles: DOC installation
Introduction of emission taxes on Nox Emission reduction plan for specified-diesel-vehicles: LPG conversion
Closure of small-scale incineration facilities Early retirement program
Increase of environment-friendly firms Stringent emission standards
Agreement on voluntary environmental agreement Higher quality standards for engine oil
Training of Manuel for Best Facility Management Mandatory regular inspection program
Financial support for facility investment Higher quality standards for gasoline fuels
Stricter management of facility for PM10 & VOC Improvement of public transportation infrastructure
Expansion of district air conditioning and heating system Stage II controls at gas stations
Expansion of small-scale Community Energy System Restriction of the use of cutback asphalt
Expansion of Low-NOx boilers Restriction of solvent for consumer products
Better management of LNG facilities Solvent Emissions Directive for paint in construction and
Distribution of alternative energy: solar energy Expansion of water-paint type in construction and buildings
Regulation on indoor air-conditioning and heating Installation oc the control application for Briquettes production
Restriction of Solid fuels Installation of the application for Charbroiling Restaurants
Conversion of anthracite into natural gas Clean Road
Expansion of areas using low-Sulfur and clean fuels Expansionof low tire wear
Regulation of fugitive dust in Industrial Process Ground to Green Infra
PointSource
Mobile
AreaSource
AreaSource
Select 28 realistic control measures from all SAQMP regulations and
Implement them in the GAINS-Korea
13

Change of Emissions by Sector (SAQMP)
Kt/yr
Transport
Industrial process
Energy +Domestic Other
(Solvent use)

Future Emissions for SAQMP Scenario
PM10 PM2.5
NOx SO2 VOC
Baseyear=2010 Need additional measures!!
15
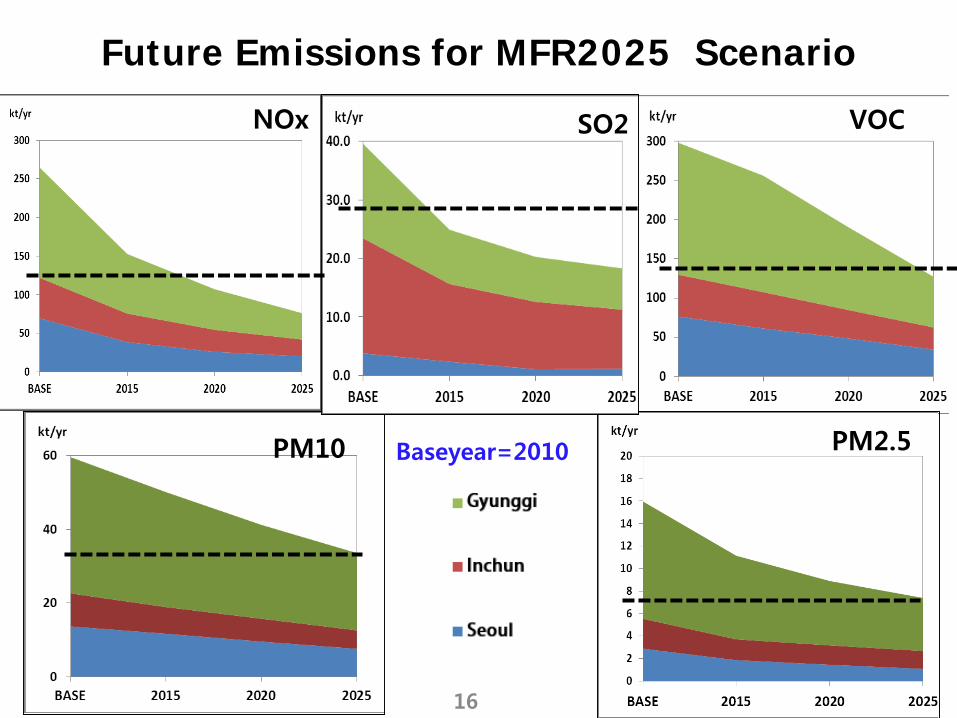
Future Emissions for MFR2025 Scenario
PM10 PM2.5
NOx SO2 VOC
Baseyear=2010
16

Inter-comparison of Emissions Scenario Pathways
Year/2010
Year/2010

Wish List
1. Future Scenarios for Climate-AQ over East Asia(Big and Far)
2. Future Scenarios for AQ Policy over Korea(Medium Range)
3. Emissions Evaluation : East Asia and Seoul(Close and Firm)
4. Summary

C. Song,2014
PM10: 166 ug/m32013, Dec 5th
2013, Dec 6th PM10: 35 ug/m3
NIER National Air Quality Forecasting(Nov. 2013)
Fine particle pollution over Seoul
Heavy pollution plume transport
China
Korea
New Challenge for Emissions and Air Quality- Winter Haze
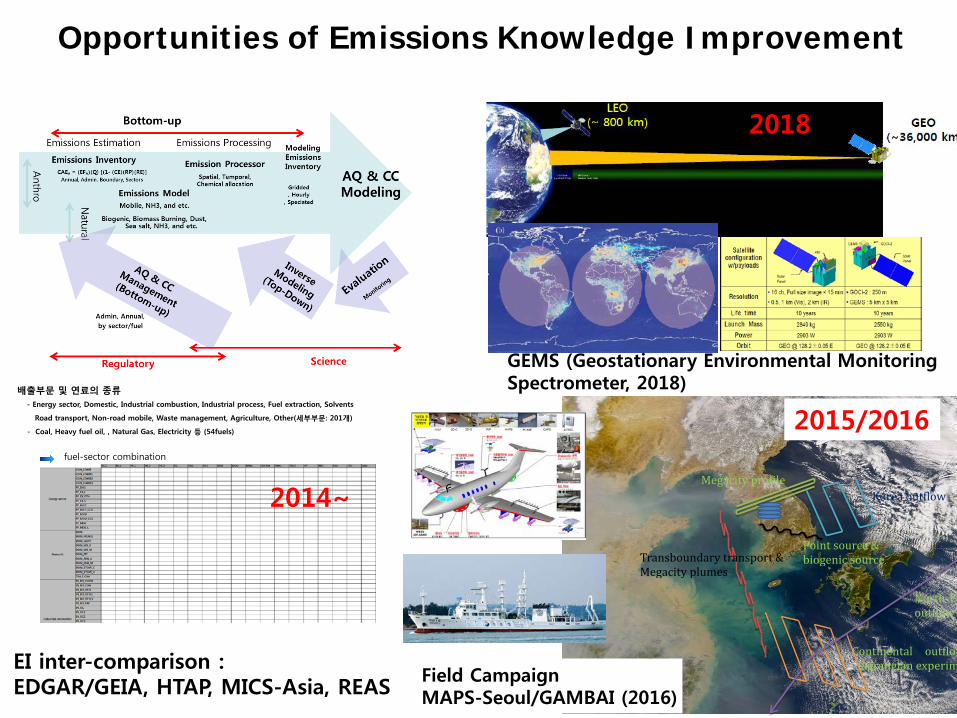
GEMS (Geostationary Environmental Monitoring Spectrometer, 2018)배출부문 및 연료의 종류
- Energy sector, Domestic, Industrial combustion, Industrial process, Fuel extraction, Solvents
Road transport, Non-road mobile, Waste management, Agriculture, Other(세부부문: 201개)
- Coal, Heavy fuel oil, , Natural Gas, Electricity 등 (54fuels)
fuel-sector combination
EI inter-comparison : EDGAR/GEIA, HTAP, MICS-Asia, REAS
Opportunities of Emissions Knowledge Improvement
North-Ea
outflow
Continental outflow
lagrangian experim
Transboundary transport &
Megacity plumes
Korea outflow
Megacity profile
Point source &
biogenic source
Field CampaignMAPS-Seoul/GAMBAI (2016)
2018
2014~
2015/2016

Uncertainties : Emissions Inter-comparison
0
10
20
30
40
50
60
70
INTE
X
REA
S
MIC
S-20
08
MIC
S-20
10
GA
INS
INTE
X
REA
S
MIC
S-20
08
MIC
S-20
10
GA
INS
INTE
X
REA
S
MIC
S-20
08
MIC
S-20
10
GA
INS
INTE
X
REA
S
MIC
S-20
08
MIC
S-20
10
GA
INS
SO2 NOx CO/10 NMVOC
Uni
t: T
g/yr
China Other East Asia(except china) Southeast Asia South Asia
05
1015202530354045
INTE
X
REA
S
MIC
S-20
08
MIC
S-20
10
GA
INS
INTE
X
REA
S
MIC
S-20
08
MIC
S-20
10
GA
INS
INTE
X
REA
S
MIC
S-20
08
MIC
S-20
10
GA
INS
INTE
X
REA
S
MIC
S-20
08
MIC
S-20
10
GA
INS
PM10 PM2.5 BC OC
Uni
t: T
g/yr
China Other East Asia(except china) Southeast Asia South Asia
2006 2008 2008 2010 2010
CR
EA
TEv1
CR
EA
TEv1
CR
EA
TEv1
CR
EA
TEv1
CR
EA
TEv1
CR
EA
TEv1
CR
EA
TEv1
CR
EA
TEv1
2008
2008 2010
2008 2010
2008 2010
2008 2010
2008

FGD Penetration
SO2 Emissions
Improve Asia Emissions Inventory : CREATE
- Control Technology and Emissions (SO2 and PM10 for China)
0
20
40
60
80
100
2002 2003 2004 2005 2006 2007 2008 2009 2010
中国煤电中国脱硫
美国煤电美国脱硫中国脱硫机组比例美国脱硫机组比例
Inst
alla
tion
capa
city
, GW
1000
800
600
400
200
0 Rat
io o
f FG
D in
stal
latio
n, %
Capacity of coal-fired power plants (China) Capacity of FGD installation (China)
Capacity of power plants (US)FGD capacity (US )FGD ratio (China)FGD ratio (US)
S. Wang, 2012
PM10 Emission Factors
PM10 Emissions

- Emissions Change due to 1st and 2nd Phase of SAQMP
1st SAQMP
SO2
Emission Trends for Pre/Post 2010 : Korea
2010
Rem
ainin
gEm
issi
ons
Red
uct
ions
2nd SAQMP
w/o Control
2nd SAQMP
1st SAQMP
w/o Control
20152005 2024

Emissions Evaluation over East Asia- China and Korea
NOx
Kim, S-T, 2014
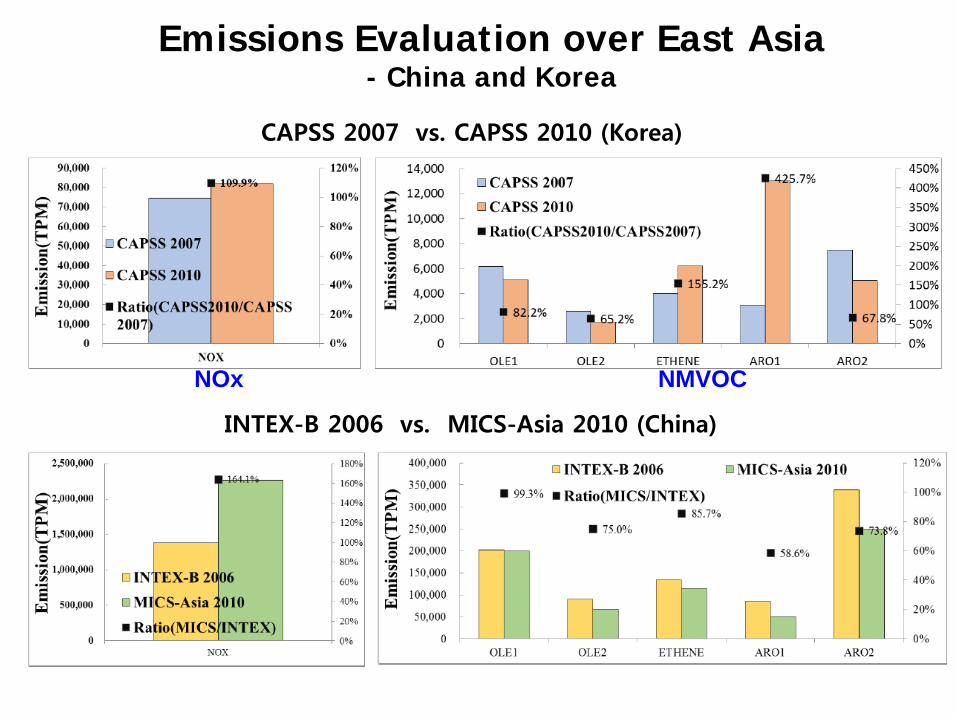
CAPSS 2007 vs. CAPSS 2010 (Korea)
INTEX-B 2006 vs. MICS-Asia 2010 (China)
NOx NMVOC
Emissions Evaluation over East Asia- China and Korea

Ozone
Emissions Evaluation over East Asia- China and Korea
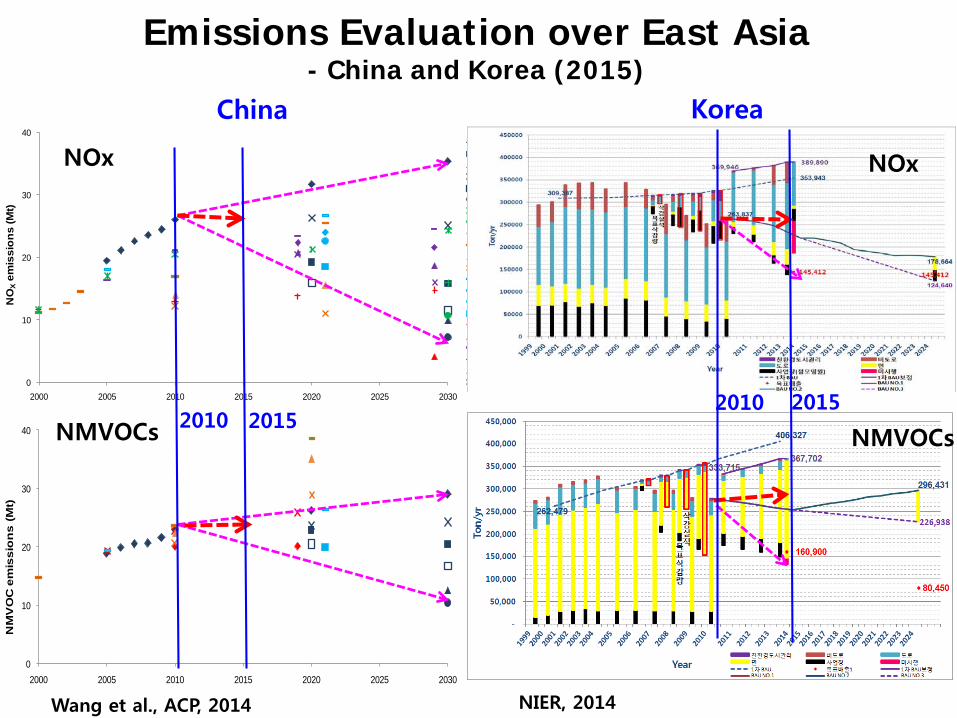
Emissions Evaluation over East Asia- China and Korea (2015)
0
10
20
30
40
2000 2005 2010 2015 2020 2025 2030
NO
Xem
issi
ons
(Mt)
This study-BAU[0]This study-BAU[1]This study-BAU[2]This study-PC[0]This study-PC[1]This study-PC[2]Amann et al. (2008)-current legislationAmann et al. (2008)-advanced control technologyAmann et al. (2008)-optimizedOhara et al. (2007)-policy failureOhara et al. (2007)-best guessOhara et al. (2007)-optimisticXing et al. (2011)-current legislation and implementationXing et al. (2011)-improved energy ef f iciency and current environmental legislationXing et al. (2011)-improved energy ef f iciency and better implementation of environmental policyXing et al. (2011)-improved energy ef f iciency and strict environmental legislationCofala et al. (2007)-current legislationCofala et al. (2007)-maximum feasible reductionCofala et al. (2012)-current policyCofala et al. (2012)-new policyCofala et al. (2012)-high energy ef f iciencyCofala et al. (2012)-450 ppm
0
10
20
30
40
2000 2005 2010 2015 2020 2025 2030
NM
VO
C e
mis
sio
ns
(Mt)
This study-BAU[0]
This study-BAU[1]
This study-BAU[2]
This study-PC[0]
This study-PC[1]
This study-PC[2]
Ohara et al. (2007)-policy failure
Ohara et al. (2007)-best guess
Ohara et al. (2007)-optimistic
Xing et al. (2011)-current legislation and implementation
Xing et al. (2011)-improved energy ef f iciency and strict environmental legislation
Wei et al. (2011)-current legislation
Wei et al. (2011)-advanced control measures
Wang et al., ACP, 2014
NOx
NMVOCs
NIER, 2014
China Korea
2010 20152010 2015
NOx
NMVOCs

Summary A new set of energy and emissions scenarios were developed using AIM-Korea. In transport sector, which turns out to be the most important one, the emission differs significantly according to emission scenarios. Thus, technical improvement and energy advancement from fossil fuel to alternative energy are needed
Four different emissions control pathways were set in the GAINS-Korea to assess the effectiveness of SAQMP from emissions reduction and air quality improvement standpoint.
Fast change of emission parameters, such as activities, control measures, make emissions nowcasting more difficult. More stringent control measures is being applied to emission sources in China and Korea, but the air quality improvements are not well realized yet – especially for ozone and fine PM.
The new challenges from transboundary transport and secondary pollution are becoming more important. Bottom-Bottom, Top-Bottom, Measurement-Modeling-Emissions collaboration should be the ways to go
28

Thank you for your attention!
29
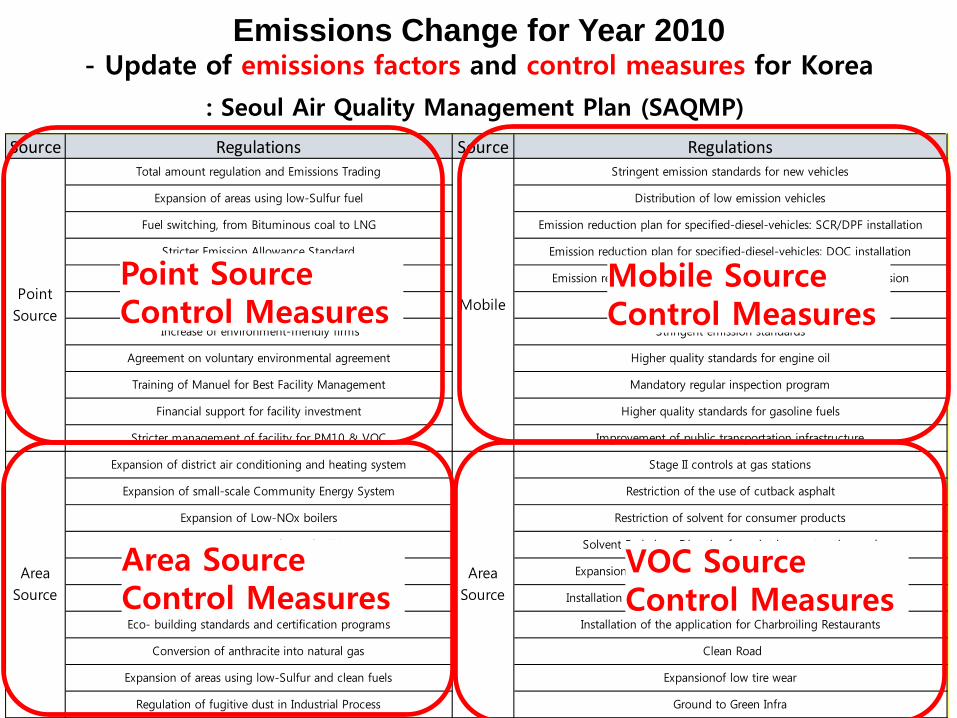
Emissions Change for Year 2010- Update of emissions factors and control measures for Korea
: Seoul Air Quality Management Plan (SAQMP)
Source Regulations Source RegulationsTotal amount regulation and Emissions Trading Stringent emission standards for new vehicles
Expansion of areas using low-Sulfur fuel Distribution of low emission vehicles
Fuel switching, from Bituminous coal to LNG Emission reduction plan for specified-diesel-vehicles: SCR/DPF installation
Stricter Emission Allowance Standard Emission reduction plan for specified-diesel-vehicles: DOC installation
Introduction of emission taxes on Nox Emission reduction plan for specified-diesel-vehicles: LPG conversion
Closure of small-scale incineration facilities Early retirement program
Increase of environment-friendly firms Stringent emission standards
Agreement on voluntary environmental agreement Higher quality standards for engine oil
Training of Manuel for Best Facility Management Mandatory regular inspection program
Financial support for facility investment Higher quality standards for gasoline fuels
Stricter management of facility for PM10 & VOC Improvement of public transportation infrastructure
Expansion of district air conditioning and heating system Stage II controls at gas stations
Expansion of small-scale Community Energy System Restriction of the use of cutback asphalt
Expansion of Low-NOx boilers Restriction of solvent for consumer products
Better management of LNG facilities Solvent Emissions Directive for paint in construction and
Distribution of alternative energy: solar energy Expansion of water-paint type in construction and buildings
Regulation on indoor air-conditioning and heating Installation oc the control application for Briquettes production
Eco- building standards and certification programs Installation of the application for Charbroiling Restaurants
Conversion of anthracite into natural gas Clean Road
Expansion of areas using low-Sulfur and clean fuels Expansionof low tire wear
Regulation of fugitive dust in Industrial Process Ground to Green Infra
Mobile
AreaSource
AreaSource
PointSource
Point SourceControl Measures
Mobile SourceControl Measures
Area SourceControl Measures
VOC SourceControl Measures

January
April
July
October
MICSR = 0.62
MICSR = 0.76
MICSR = 0.63
MICSR = 0.85
INTEXR = 0.67
INTEXR = 0.83
INTEXR = 0.49
INTEXR = 0.81
- MICS-Asia 2010- INTEX-B 2006
- MICS-Asia 2010- INTEX-B 2006
- MICS-Asia 2010- INTEX-B 2006
- MICS-Asia 2010- INTEX-B 2006
Emissions over SMA(Korea)
CAPSS2006 w Fugitive
CAPSS2010 w Fugitive
CAPSS2009 w/o Fugitive
Emissions Evaluation over East Asia- Haze and PM2.5
05
1015202530354045
INT
EX
RE
AS
MIC
S-20
08
MIC
S-20
10
GA
INS
INT
EX
RE
AS
MIC
S-20
08
MIC
S-20
10
GA
INS
INT
EX
RE
AS
MIC
S-20
08
MIC
S-20
10
GA
INS
INT
EX
PM10 PM2.5 BC
Uni
t: T
g/yr
China Other East Asia(except china) Southeast Asia South Asia
2006 2008 20102006 2008 2010

Emissions Evaluation over East Asia- China and Korea (2015)
0
5
10
15
20
2000 2005 2010 2015 2020 2025 2030
PM
10em
issi
ons
(Mt)
This study-BAU[0]
This study-BAU[1]
This study-BAU[2]
This study-PC[0]
This study-PC[1]
This study-PC[2]
Xing et al. (2011)-current legislation and implementation
Xing et al. (2011)-improved energy ef f iciency and current environmental legisla
Xing et al. (2011)-improved energy ef f iciency and better implementation of envi
Xing et al. (2011)-improved energy ef f iciency and strict environmental legislatio
PM10
China
Korea

(Lee et al., 2014)
Emissions
Model
Emissions Evaluation over East Asia- China

(Lee et al., 2014)
May, 2010
Emissions Evaluation over East Asia- Central Eastern China

35
National Statistics
1. Emission Inventory : Improve GAINS-Asia emissions using
updated national data, MEGAN/BlueSky emissions model
2. Year 2009/2010, Asia regions, ~10000 source categories
3. Pollutants: CO2, CH4, NOx, N2O, PM10, PM2.5, SO2, VOC, NH3,
CO, BC, OC, Mercury
4. Anthropogenic, Biogenic, Biomass burning
5. Emissions processing friendly
* Comprehensive Regional Emissions for Atmospheric Transport Experiments
CREATE* (Asia EI by NIER of Korea)

020406080
100120140160
2005 2006 2007 2008 2009 2010
Inst
alla
tion
of D
eNO
x te
chno
logy
, GW
SNCR SCR
18% of total coal-fired power (2010)
• Updated regulations, emission factors, and control measures
0.00.20.40.60.81.0
SO2 NOX PM10 PM2.5
Evo
lutio
n of
em
issi
on fa
ctor
s, %
2005 2006 2007 2008 2009 2010
0
20
40
60
80
100
2002 2003 2004 2005 2006 2007 2008 2009 2010
中国煤电中国脱硫
美国煤电美国脱硫中国脱硫机组比例美国脱硫机组比例
Inst
alla
tion
capa
city
, GW
1000
800
600
400
200
0 Rat
io o
f FG
D in
stal
latio
n, %
Capacity of coal-fired power plants (China) Capacity of FGD installation (China)
Capacity of power plants (US)FGD capacity (US )FGD ratio (China)FGD ratio (US)
S. Wang, 2011
Emissions Change for Year 2010- Update of emissions factors and control measures for China
SO2
NOx
PM
CAE = (EF)(Act) [(1- (CE)(RE)]CAE = Controlled emissionsEF = Uncontrolled emission factorAct = Category activityCE = % Control efficiency/100RE = % Rule effectiveness/100
Power Sector All coal-fired units shall install install F
GD, and the SO2 removal efficiency increase to 90%.
Coal-fired units except CFB boilers shall install denitration technologies.
Upgrade the PM standard(from 50 mg/m3 to 30mg/m3), promote to use ESP+FGD or FAB.
Industrial Boilers Coal-fired boilers great than 2
0 t/h shall use desulfurization technologies.
Upgrade the PM standard(50 mg/m3 for new boilers), promote to use ESP or FAB.
New boilers should install LNB.
Phase out small boilers.
Steel Industry Install desulfurization technologi
es on sintering operations. Upgrade the PM standard, prom
ote to use high-efficiency dedustors (FAB).
Eliminate outdated production capacity.
Cement Industry Install LNB and denitration technol
ogies in precalciner cement kilns. Upgrade the PM standard, promot
e to use high-efficiency dedustors(ESP or FAB).
Eliminate outdated production capacity.
Industrial Kilns Upgrade de-dusting facilities
Transportation Accelerate implementation of fuel and e
mission standards: implement Euro5 vehicle standards.
Scrap the yellow-labeled and old vehicles.
Promote to use new energy vehicles.
Key VOC industries Promote comprehensive treatment
of VOCs in petrochemical industry and chemical industry
Promote leak detection and repair, online monitoring technology in the petrochemical, chemical and other key enterprises.
Promote the use of water-based paint; encourage the production, sale and use of low toxicity, low volatile solvents.Residential Sector
Promote to use clean coal.
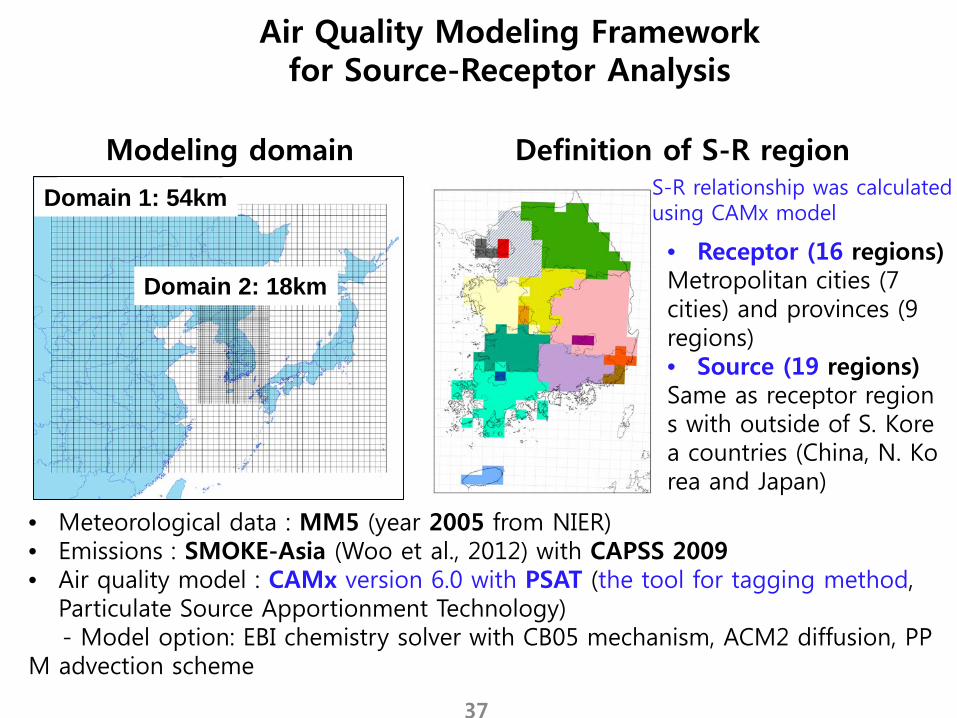
• Meteorological data : MM5 (year 2005 from NIER)• Emissions : SMOKE-Asia (Woo et al., 2012) with CAPSS 2009• Air quality model : CAMx version 6.0 with PSAT (the tool for tagging method,
Particulate Source Apportionment Technology)- Model option: EBI chemistry solver with CB05 mechanism, ACM2 diffusion, PP
M advection scheme
Modeling domain Definition of S-R region
Domain 1: 54km
Domain 2: 18km• Receptor (16 regions)Metropolitan cities (7 cities) and provinces (9 regions)• Source (19 regions)Same as receptor regions with outside of S. Korea countries (China, N. Korea and Japan)
Air Quality Modeling Framework for Source-Receptor Analysis
S-R relationship was calculated using CAMx model
37

Outline
1. Introduction
2. Emission Discrepancies and Changes
3. Emissions Evaluation : East Asia and Seoul
4. Summary

Can Seoul Metropolitan Area Air Quality Management Plan(SAQMP) really hit the Target Air Quality by 2025?
Objectives
Explorer possibilities of emission controls and air quality improvements
- What if we haven’t done anything after the baseyear (i.e. year 2010)
- What if we will only do something as we did in the baseyear
- What if we are going to do as we are planning to do
- What if we will do more effort than currently planned
How strong effect does th
Is that polic possible to satis 39

Result : PM2.5 Air Quality of Baseyear(2010)
PM2.5 (Primary) PM2.5 (Secondary)
PM2.5 : 33.8 ug/m3
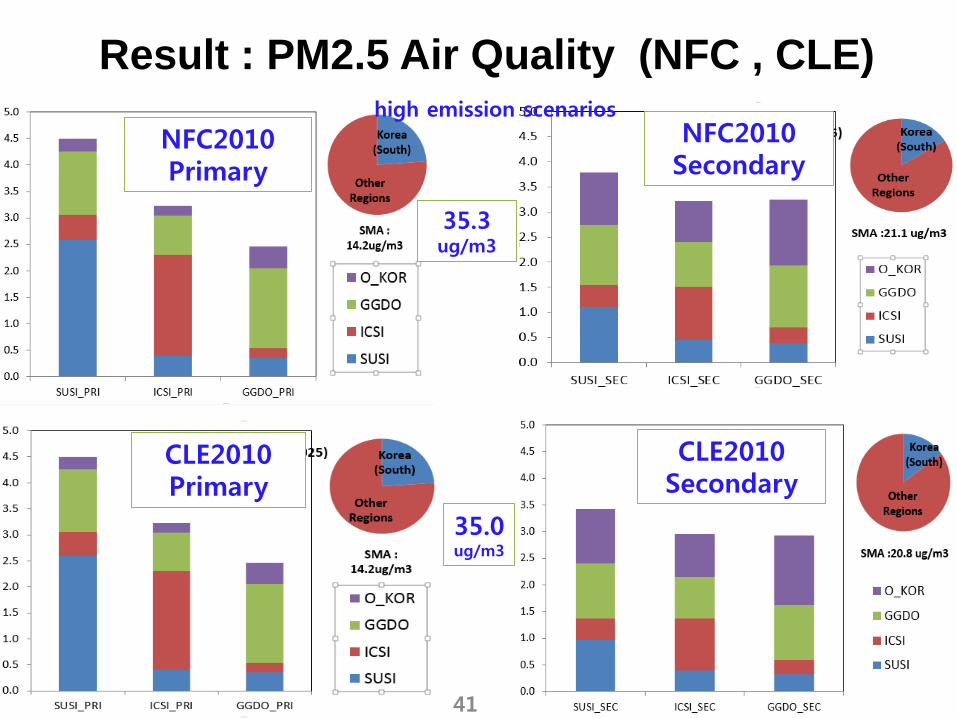
Result : PM2.5 Air Quality (NFC , CLE)
35.0ug/m3
35.3 ug/m3
NFC2010Secondary
CLE2010Primary
NFC2010Primary
CLE2010Secondary
high emission scenarios
41

Result : PM2.5 Air Quality (SAQMP, MFR)
SAQMPSecondary
MFR2025Primary
SAQMPPrimary
MFR2025Secondary
31.6ug/m3
32.3ug/m3
High reduction scenario has lower influence not only self-region but also out of region.
low emission scenarios
42

Result (SAQMP)- Emissions of All Target Pollutants by Region
35% 54%
28%62% 24%
18%
11%
Gyunggi > SEOUL > Incheon SMA 11%~62% vs other regions
GGDO : GyungGi Do
SUSI : Seoul Si
ICSI : Incheon Si
SMAnon-SMA
SUSI
43

Result : PM2.5 by Component (year 2025)44
PM2.5 SUSI ICSI GGDO Other Korea Korea Sum Other RegionsPrimary 70.9% 57.7% 51.9% 21.8% 46.6% 37.9%
Secondary 29.1% 42.3% 48.1% 78.2% 53.4% 62.1%sulfate 2.2% 13.8% 5.4% 7.3% 7.0% 9.1%nirtrate 10.6% 12.4% 16.7% 47.9% 25.1% 37.7%
ammonium 15.9% 15.7% 25.7% 22.9% 21.1% 14.4%SOA 0.4% 0.3% 0.2% 0.1% 0.2% 1.0%
PM2.5 SUSI ICSI GGDO Other Korea Korea Sum Other RegionsPrimary 60.1% 58.6% 52.3% 24.1% 44.2% 37.9%
Secondary 39.9% 41.4% 47.7% 75.9% 55.8% 62.1%sulfate 7.7% 13.5% 6.5% 8.1% 8.8% 9.1%nirtrate 14.5% 12.2% 16.1% 42.5% 25.1% 37.7%
ammonium 17.3% 15.3% 24.8% 25.2% 21.6% 14.4%SOA 0.4% 0.3% 0.3% 0.1% 0.2% 1.0%
NFC2010
SAQMP
MFR202531.6 ug/m3
32.3 ug/m3
PM2.5 SUSI ICSI GGDO Other Korea Korea Sum Other RegionsPrimary 63.1% 58.6% 50.9% 21.0% 49.8% 37.9%
Secondary 36.9% 41.4% 49.1% 79.0% 50.2% 62.1%sulfate 10.2% 15.8% 6.6% 7.7% 9.7% 9.1%nirtrate 19.7% 17.7% 29.6% 49.7% 28.4% 37.7%
ammonium 6.6% 7.5% 12.6% 21.6% 11.7% 14.4%SOA 0.3% 0.3% 0.3% 0.1% 0.3% 1.0%
35.4 ug/m3
44

Result : PM2.5 Air Quality (Concentration and Percent Contribution Change by Scenario)
NFC2010(%) CLE2010(%)
MFR2025(%)CLE2025(%)
BASE(ug/m3)
MFR2025(%)

Scenario Storyline- demographic change - economic development- technological change - policies
Population Economy
G4Mspatially explicit forest management
model
GLOBIOMintegrated agricultural, bioenergy and forestry model
MESSAGEsystems engineering model (all GHGs and all energy sector
s)
socio-economic drivers
consistency of land-cover changes (spatially explicit maps of agricultural, urban, an
d forest land)
carbon and biomass price
agricultural and forest bioenergy potentia
ls,land-use emissions
and mitigation potential
National level ProjectionsMAGICCsimple climate
model
GAINSGHG and air pollution mitigation model
emissions
air pollution emission coefficients & abatement costs
demandresponse
iteration
MACROAggregated macro-economic mo
del
energy service prices
socio-economic drivers
ESMPOP
MAG ENE (TNT)
ASAMulti-Criteria Anal
ysis Methods
IIASAM. Strubegger, 2014

Emission Pathways by Control Scenario - SMA Air Quality Management Plan(SAQMP)
CLE0
CLE1
CLE2
SAQMP1CAPSS
SO2
No Further Control (NFC)
Current Legislation (CLE)
Maximum Feasible Reduction (MFR)
Base-year Future
Emis
sions
SAQMP2
2010 2024
BAU1
1st SAQMP
2nd SAQMP
2005 2014
Emis
sion
1st Phase 2nd Phase
CAPSS
measure 1measure 2measure 3...
1st Phase 2nd Phase2005 2014 2024
NMVOCs

Result : Emission projection by scenarios Baseyear 2010=100%
0%
20%
40%
60%
80%
100%
120%
140%
2010 2015 2020 2025 2010 2015 2020 2025 2010 2015 2020 2025 2010 2015 2020 2025
NFC2010 CLE2010 CLE2025 MFR2025
NOx SO2 PM10 PM2.5 VOCSAQMP
2nd will be planned more strict policy with more a
ggressive technology1st Phase
2nd Phase
the pathway of emission by scenario
48

Overall, it is estimated that the NOx emissions are underestimated by 57.3% in North China and overestimated by 46.1% in South Korea over an entire year
Han et al., ACP 2009
Uncertainty of Emissions Estimation
CMAQ with 2001 TRACE-P emission inventory vs GOME-derived NO2
The overall uncertainties in 2006 INTEX-B Asian emission: ±16% (SO2), ±37% (NOx), ±130% (NMVOC), ±185% (CO), ±360% (BC), ±450% (OC).
Zhang et al., ACP 2009
Uncertainties of REAS2.1 emissions in China/India/therest of Asian countries : ±31/32/35% (SO2), ±37/49/47% (NOx), ±78/137/111% (NMVOC), ±86/114/131% (CO), ±176/178/257% (BC), ±271/233/286% (OC)
Kurokawa et al., ACP 2013
Overall Uncertainty in Anthropogenic Emission Estimates (±95% Confidence Intervals, Unit: %).
Streets et al., JGR, (2003).
Uncertainties of CREATE emissions in China: ±28% (SO2), ±39% (NOx), ±68 (NMVOC), ±60% (CO), ±101% (NH3), ±50% (PM10), ±54% (PM2.5)
NIER, 2013