Embed Size (px)
Citation preview
FUTURE DEMAND FOR VOCATIONAL EDUCATION
AND TRAINING IN NEW SOUTH WALES
REPORT BY ACCESS ECONOMICS PTY LIMITED
FOR
THE INDEPENDENT PRICING AND REGULATORY TRIBUNAL (IPART)
16 JUNE 2006
While every effort has been made to ensure the accuracy of this document, the uncertain nature of economic data, forecasting and analysis means that Access Economics Pty Limited is unable to make any warranties in relation to the information contained herein. Access Economics Pty Limited, its employees and agents disclaim liability for any loss or damage which may arise as a consequence of any person relying on the information contained in this document.
Future demand for vocational education and training in NSW
TABLE OF CONTENTS
EXECUTIVE SUMMARY i 1. Introduction 1
1.1 Scope of this report...............................................................................................................1 1.2 Summary of methodology .....................................................................................................2
2. The benefits of skill development 6 2.1 Links between education and work .......................................................................................6 2.2 The effect of education on participation rates .......................................................................9 2.3 The effect of education on unemployment ..........................................................................10
3. Profile of VET activity 12 3.1 Total VET activity................................................................................................................12 3.2 VET activity by category .....................................................................................................15 3.3 Qualifications profile ...........................................................................................................17
4. Baseline scenario – labour market projections 20 4.1 Employment growth ............................................................................................................20 4.2 Labour force participation ...................................................................................................21 4.3 Industry employment forecasts ...........................................................................................23 4.4 Occupational employment forecasts ...................................................................................25 4.5 Regional dimension ............................................................................................................28
5. Additional labour market influences on future training needs 32 5.1 Retirements ........................................................................................................................32 5.2 Other staff turnover.............................................................................................................34 5.3 Part-time share of the workforce.........................................................................................36 5.4 Casual and self employed share of the workforce ..............................................................37 5.5 Productivity .........................................................................................................................39 5.6 Workforce longevity ............................................................................................................39 5.7 Supply side influences on VET activity ...............................................................................39
6. Baseline scenario – projected VET activity 41 7. Specifying the target scenario 48
7.1 Labour market projections ..................................................................................................48 7.2 Additional assumptions on training .....................................................................................52
8. Target scenario – projected VET activity 56 8.1 Scenario results ..................................................................................................................56 8.2 Plausibility of the target scenario ........................................................................................65
9. References 70
Future demand for vocational education and training in NSW
i
EXECUTIVE SUMMARY The Independent Pricing and Regulatory Tribunal (IPART) in New South Wales has commissioned Access Economics to develop projections of the future demand for publicly funded vocational education and training (VET).
Benefits of skill development
Our living standards per head are a function of the effectiveness with which we work (productivity) and the proportion of us working (participation).
Importantly, improved skills development (such as via VET studies to improve work skills) can do both of these. As economists have increasingly noted, not merely does increased investment in skills show up as more productive workers, those workers also tend to stay in the workforce for longer – thereby boosting participation as well as productivity. And, equally importantly, early moves to increase skills development are likely to have their prime years of payoff across the decades when growth will be most at risk from baby boomer retirement.
Profile of VET activity
VET activity ramped up notably in the 1990s in New South Wales, but since 2000 student numbers and the number of hours delivered has levelled off. That decline has been more notable in New South Wales than nationally. In 2004, VET students in New South Wales amounted to 16.3% of total people employed, a participation rate just below the national average.
In part, the recent decline in VET participation reflects a petering out of supply side initiatives which were encouraging greater participation in VET in the 1990s. Other factors here are that (1) productivity growth has also slowed (thereby slowing the need for up-skilling, by slowing the pace of change), (2) higher student fees and until relatively recently, (3) a strong job market negated some short term training needs by offering attractive short term returns to working versus training.
Baseline scenario – labour market projections
Employment growth in Australia is expected to slow notably from recent rates, not only for cyclical reasons, but as a key symptom of our ageing population. In particular, the retirement of the baby boomers is likely to see average labour force participation drop over time.
Over the 20 year forecast period here (2005 to 2025), average growth in jobs is projected at:
0.64% per annum for New South Wales; and
0.87% per annum for Australia.
Those projections are based on an only modest further increase in age cohort labour force participation rates, and with an unemployment rate staying roughly constant at around 5.0%.
While net employment growth trends are a key influence, the gross number of people entering an occupation (including to replace those who retire, or leave for some other reason – normal turnover), may be more important in addressing training requirements. These are accounted for here in the projections for future VET in this report.
Future demand for vocational education and training in NSW
ii
A continuing trend towards a higher share of the workforce working part-time or being casually employed or self-employed is also likely to be a plus for VET demand, as it means that more people have to be trained for any given amount of work for part-time, and because casual employees may receive less on-the job-training (and so may be more likely to seek out the publicly-funded VET training considered here).
Finally, increased workforce longevity as age cohort labour force participation rates rise will also provide a stimulus to VET demand in both the baseline and target scenarios.
Baseline scenario – projected VET activity
The projections for VET activity in the baseline scenario are for overall modest growth. Over the 20 year period (2005 to 2025) for New South Wales projections are for:
average growth in the number of VET students of 0.98% per annum; and
average growth in the number of VET hours of 1.08% per annum.
That is faster growth for student numbers than has been achieved recently, and faster than projected employment growth, but notably slower than VET activity growth over the 1990s.
Slowing overall job growth is the key driver of more moderate VET demand over time. In addition, a cyclical downturn in demand for trade skills is a negative over the short term.
Projections for the composition of VET activity are for a shift towards continuing training and catering for re-entrants, at the expense of New Apprenticeships. Relatively little workforce growth means relatively less need for the latter. It also means that the skewing of the VET age profile towards younger students (44% of students in 2004 were under 25) will become less acute over time (only 39% of students under 25 in 2025).
Specifying the target scenario
The baseline projections in this report can be compared with VET demand under a ‘target’ scenario. The target scenario is one of economic success. It is defined using the ratio of employed to civilian (15+) population. For Australia that means maintaining the recent level for that ratio, rather than seeing it fall as the population ages. For New South Wales it means moving up to the Australian ratio of employed to civilian population and then maintaining that ratio. As population growth assumptions are the same in the target scenario as in the baseline scenario, these targets are achieved through employment gains, with a substantial lift in labour force participation rates by age cohort required.
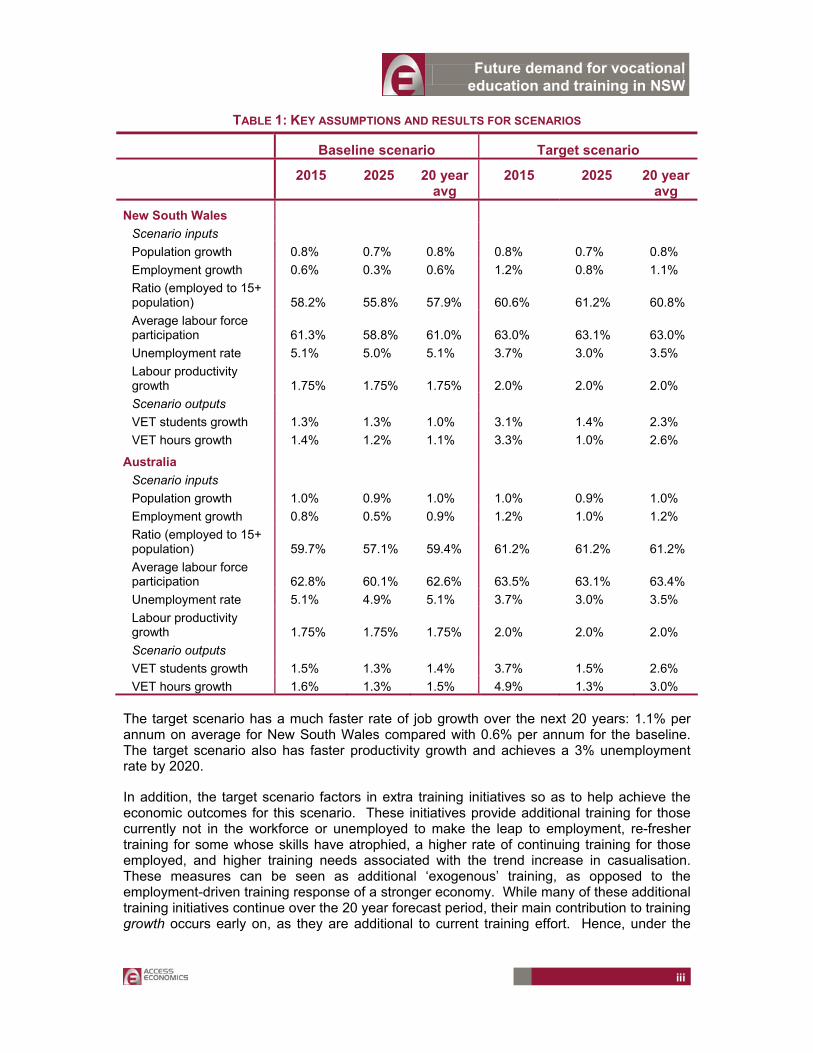
Key assumptions and outputs for the baseline and target scenarios are noted in Table 1.
Future demand for vocational education and training in NSW
iii
TABLE 1: KEY ASSUMPTIONS AND RESULTS FOR SCENARIOS
Baseline scenario Target scenario
2015 2025 20 year avg
2015 2025 20 year avg
New South Wales Scenario inputs Population growth 0.8% 0.7% 0.8% 0.8% 0.7% 0.8% Employment growth 0.6% 0.3% 0.6% 1.2% 0.8% 1.1% Ratio (employed to 15+ population) 58.2% 55.8% 57.9% 60.6% 61.2% 60.8% Average labour force participation 61.3% 58.8% 61.0% 63.0% 63.1% 63.0% Unemployment rate 5.1% 5.0% 5.1% 3.7% 3.0% 3.5% Labour productivity growth 1.75% 1.75% 1.75% 2.0% 2.0% 2.0% Scenario outputs VET students growth 1.3% 1.3% 1.0% 3.1% 1.4% 2.3% VET hours growth 1.4% 1.2% 1.1% 3.3% 1.0% 2.6%
Australia Scenario inputs Population growth 1.0% 0.9% 1.0% 1.0% 0.9% 1.0% Employment growth 0.8% 0.5% 0.9% 1.2% 1.0% 1.2% Ratio (employed to 15+ population) 59.7% 57.1% 59.4% 61.2% 61.2% 61.2% Average labour force participation 62.8% 60.1% 62.6% 63.5% 63.1% 63.4% Unemployment rate 5.1% 4.9% 5.1% 3.7% 3.0% 3.5% Labour productivity growth 1.75% 1.75% 1.75% 2.0% 2.0% 2.0% Scenario outputs VET students growth 1.5% 1.3% 1.4% 3.7% 1.5% 2.6% VET hours growth 1.6% 1.3% 1.5% 4.9% 1.3% 3.0%
The target scenario has a much faster rate of job growth over the next 20 years: 1.1% per annum on average for New South Wales compared with 0.6% per annum for the baseline. The target scenario also has faster productivity growth and achieves a 3% unemployment rate by 2020.
In addition, the target scenario factors in extra training initiatives so as to help achieve the economic outcomes for this scenario. These initiatives provide additional training for those currently not in the workforce or unemployed to make the leap to employment, re-fresher training for some whose skills have atrophied, a higher rate of continuing training for those employed, and higher training needs associated with the trend increase in casualisation. These measures can be seen as additional ‘exogenous’ training, as opposed to the employment-driven training response of a stronger economy. While many of these additional training initiatives continue over the 20 year forecast period, their main contribution to training growth occurs early on, as they are additional to current training effort. Hence, under the
Future demand for vocational education and training in NSW
iv
target scenario, growth in training requirements is faster earlier on, and therefore average VET growth rates over 20 years shown in Table 1 are stronger than those shown for 2025.
Increased VET is seen as a necessary (but far from sufficient) condition to achieve the target scenario – increased skills development is likely to be an important contributing factor to such economic success, but Australia will also need to do well otherwise in terms of policy issues and business performance to achieve the target.
Target scenario – projected VET activity
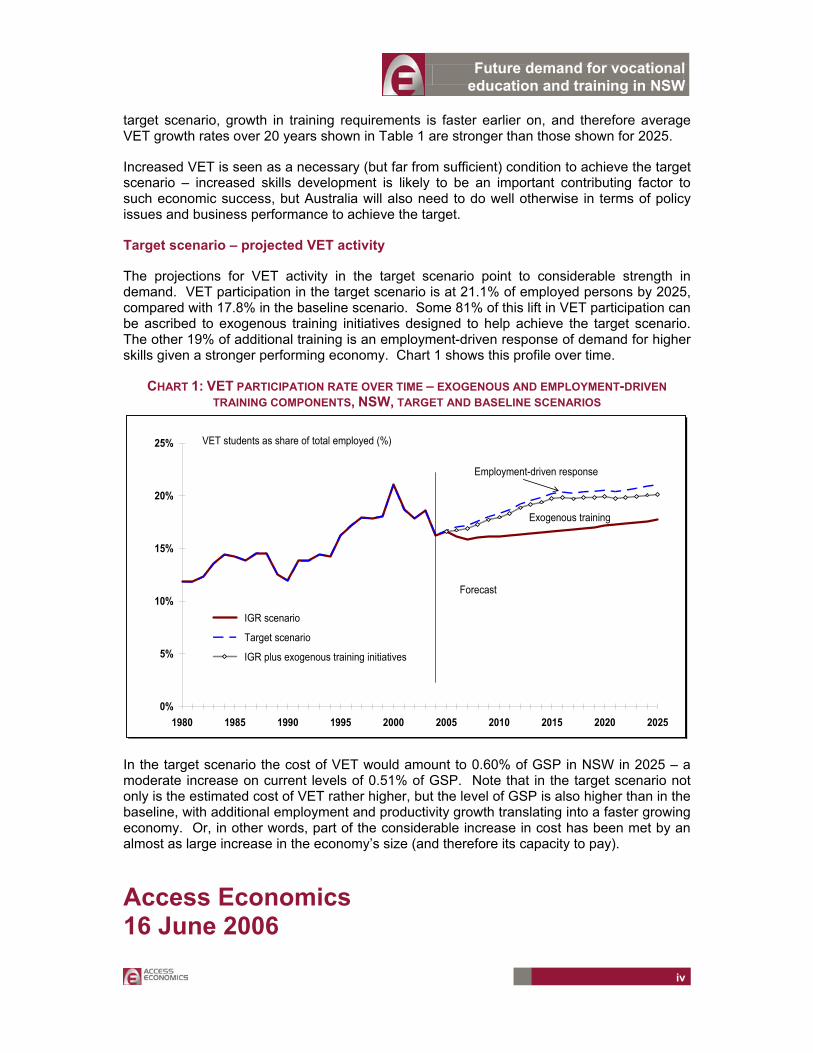
The projections for VET activity in the target scenario point to considerable strength in demand. VET participation in the target scenario is at 21.1% of employed persons by 2025, compared with 17.8% in the baseline scenario. Some 81% of this lift in VET participation can be ascribed to exogenous training initiatives designed to help achieve the target scenario. The other 19% of additional training is an employment-driven response of demand for higher skills given a stronger performing economy. Chart 1 shows this profile over time.
CHART 1: VET PARTICIPATION RATE OVER TIME – EXOGENOUS AND EMPLOYMENT-DRIVEN TRAINING COMPONENTS, NSW, TARGET AND BASELINE SCENARIOS
0%
5%
10%
15%
20%
25%
1980 1985 1990 1995 2000 2005 2010 2015 2020 2025
IGR scenario
Target scenario
IGR plus exogenous training initiatives
VET students as share of total employed (%)
Forecast
Exogenous training i iti ti
Employment-driven response
In the target scenario the cost of VET would amount to 0.60% of GSP in NSW in 2025 – a moderate increase on current levels of 0.51% of GSP. Note that in the target scenario not only is the estimated cost of VET rather higher, but the level of GSP is also higher than in the baseline, with additional employment and productivity growth translating into a faster growing economy. Or, in other words, part of the considerable increase in cost has been met by an almost as large increase in the economy’s size (and therefore its capacity to pay).
Access Economics 16 June 2006
Future demand for vocational education and training in NSW
1
1. INTRODUCTION The Independent Pricing and Regulatory Tribunal (IPART) in New South Wales has commissioned Access Economics to develop projections of the future demand for publicly funded vocational education and training (VET).
The projections of VET are from an employer or demand side perspective – the level of VET which is likely to be required to maintain and grow the skill base of the available workforce.
Access Economics has previously developed a framework for forecasting VET demand based on labour market analysis. This forecasting framework has been updated, critically examined, and improved for this project.
1.1 SCOPE OF THIS REPORT
This report presents projections for VET activity over the next 20 years for both New South Wales and Australia. The key interest is in identifying the skill needs associated with longer term trends, as opposed to a short term forecasting exercise. As a result, the presentation of VET projections in this report focuses on averages over the five year periods:
1 January 2006 to 31 December 2010;
1 January 2011 to 31 December 2015;
1 January 2016 to 31 December 2020; and
1 January 2021 to 31 December 2025.
Two scenarios are presented in this report:
a baseline or IGR scenario showing what employer demand will be if present policies are continued (with long term growth broadly consistent with that in the Federal Government’s 2002 Intergenerational Report); and
a target scenario showing what employer demand will be if policies succeed in raising participation so as to ensure there is no change in the ratio of aged persons to the employed population (this has been interpreted as no change in the ratio of the employed to the civilian (15+) population).
The key data projected for this report is total hours of training and number of students in training in the national provider collection by the National Centre for Vocational Education Research (NCVER).
This covers all VET delivered by providers in receipt of public funding allocations for VET. That is, any VET which is funded wholly or in part from public funds. Providers include TAFE, other government providers, community providers and private providers who have been allocated public funds to deliver VET programs.
VET which is fee for service by private providers is outside the scope of this data collection, as are ‘non-vocational’ programs, and VET delivered in schools where the delivery has been undertaken by schools.
This remainder of this report is organised as follows:
Future demand for vocational education and training in NSW
2
The following section provides an overview of the methodology employed in forecasting employer demand for VET.
Chapter 2 discusses some of the overall economic benefits which accrue from investment in skills development, drawing on recent research.
Chapter 3 provides a brief overview of VET activity growth over the past decade, in terms of students and hours, for New South Wales and Australia as a whole.
Chapter 4 details the labour market projections which underpin the VET demand forecast in the baseline scenario.
Chapter 5 discusses some additional labour market influences on training requirements, including rates of retirement and other turnover, and the possible implications of trends toward both a higher part-time share and a higher casual and self-employed share of the workforce.
Chapter 6 presents projected VET activity in the baseline scenario, including a split of these projections into new labour force entrants, re-entrants, and those undertaking continuing training.
Chapter 7 examines the implications for participation rates and other labour market variables which stem from the target scenario, along with assumed exogenous changes to training participation to help enable the lift in labour force participation.
Chapter 8 reports the implications for skills development under the target scenario, including projections for overall VET activity.
The report is also accompanied by spreadsheet models which provide greater detail on the forecasts, and which also allow IPART to conduct some further sensitivity analysis on the forecasts.
1.2 SUMMARY OF METHODOLOGY
Projections for publicly funded VET activity in this report respond through various different channels to the skill requirements demanded by employers. The same structure is followed for national projections and for those for New South Wales. An overview of the VET forecasting framework follows:
Forecasts for key macro variables are obtained from the Access Economics Macro (AEM) model, a small, dynamic model of the Australian economy, regularly used for macroeconomic forecasts. These key macro variables include components of final demand (such as categories of private consumption and investment) and total employment.
For the baseline or IGR scenario, the projection for total employment is scaled to be broadly consistent with IGR projections on labour force participation rates – with participation rates by age cohort rising gradually over time, but with the economy-wide average participation rate falling as the population ages.
Growth in employment by industry (for 55 industries) is forecast using known relationships between components of final demand and industry employment (based on 1996-97 input-output data, the latest available). For example, if the investment forecasts suggest that residential and construction are gaining strength, then the construction industry will gain strength. Or, say, if rural exports are lifting, then the farm sector is similarly seen lifting.
A counterfactual estimation is conducted on historical data to determine actual employment growth not picked up by this methodology, for example due to changes in
Future demand for vocational education and training in NSW
3
worker productivity and structural changes in the economy. Corresponding adjustments are made to the forecasts. The modelling also allows for some adjustment to be made to the early forecast periods to allow for any jumping-off problems.
Forecasts for industry employment are translated into occupational employment forecasts (for 81 occupations) using 2001 Census data which shows the occupational employment share for each of the industry groups examined. For forecasts, these shares are allowed to change over time, with the change in shares between the 1996 and 2001 Censuses used as a guide.
That framework provides the net employment change demanded by occupation over time.
This net change is translated into the gross number of people entering an occupation by allowing for projections of retirements and normal turnover. National workforce participation rates by age and Census data of observed retirements by age are used to estimate the rate of retirement for each occupation, while data from the labour mobility survey allows an estimate of normal turnover (not relating to new workforce entry or retirement) by occupation.
The key outputs from this framework are forecasts by occupation (for 81 occupations) of the level of employment and the number of people entering an occupation, year by year. These outputs are used as a link to measures of VET, allowing projected workforce developments to exert a strong and consistent influence over forecasts of demand for VET.
VET activity by occupation (in terms of both hours and number of students) from the national provider collection is split into four components, each with its own set of VET demand drivers for the forecasts:
New Apprenticeships for new entrants: Formal training associated with New Apprenticeships being undertaken by new entrants to the workforce.
New Apprenticeships for existing workers: Formal training associated with New Apprenticeships being undertaken by existing workers.
Re-entrants: Re-entry training – VET undertaken by those unemployed or not in the workforce.
Continuing training: The balance, undertaken by people currently employed (which includes some recent labour market entrants who are currently employed and not captured through the New Apprenticeships program).
The formal training associated with New Apprenticeships is isolated from total VET activity by using the number of enrolments in a contract of training, and hours of formal training per enrolment derived by the NCVER. This data was available for new entrants to the workforce and existing workers. Total hours for all apprentices and trainees in training were derived from historic relationships of numbers in-training to commencements (incorporating both the duration of programmes and cancellation/withdrawal rates).
VET ‘penetration ratios’ by occupation are derived by combining the measures of VET activity (hours and number of students each for New Apprenticeships for new entrants, New Apprenticeships for new workers, re-entrants and continuing training) as the numerator with the two key workforce measures (employment levels by occupation and number of people entering by occupation) as the denominator.
For the forecasts, the default assumption is to hold penetration ratios at their average ratio over the past three years. The most recent ratio is used where there appears to have been a trend in VET participation up or down.
Future demand for vocational education and training in NSW
4
A portion of VET activity cannot be classified to a specific occupational category, but is instead listed as various categories of ‘general’ training. These categories of activity are projected forwards on the basis of employment in broader occupational groups or total employment.
Allowance is made for a continuing trend towards part-time work (estimated from examining past trends by broad occupational group). This raises VET demand as more people, and therefore more skills, are required to perform a given number of hours of work than previously.
Allowance is made for a continuing trend towards casualisation of the workforce. (estimated from examining past trends of casual employment and self-employment by broad occupational group). This raises demand for publicly funded VET on the view that casual employees may receive less on-the-job training than permanent employees.
Allowance is made for employees to have a longer working life, on average, looking forward. As labour force participation increases among older age cohorts, so will the average working life, which implies some additional continuing training in order to keep skills relevant.
(Note that the baseline scenario has a lift in participation among older age cohorts, consistent with that in the Intergenerational Report. The target scenario increase is higher still.)
Allowance is made for movement to a higher rate of productivity growth to drive additional training needs. Note that only has an effect in the target scenario, as continuation of the same rate of productivity growth (as in the baseline scenario), is consistent with current rates of VET participation for up-skilling.
The model allows for future policy initiatives, such as broader implementation of Training Packages, though none have been specifically factored in to these scenarios.
Finally for the baseline scenario, projections for the various components of VET activity are collated to give a projection for total publicly funded VET demand over time, nationally and for New South Wales.
The target scenario is a scenario rather than a forecast. It uses a different series for the projected level of total employment over time. It is based on labour force participation rates by age cohort rising over time in order to keep the economy’s employment to 15+ population ratio constant (and to lift the ratio in New South Wales to that Australian target level). Changes to other broad economic parameters in this scenario include:
a higher rate of productivity growth (2% per annum rather than 1.75% per annum); and
a lower unemployment rate (down to 3% by 2020).
Projections under the target scenario follow the same set of steps as outlined above using the projected higher level of employment as a basis. In addition, a range of further initiatives are hypothesised to take place in the target scenario, which would help in producing the lift in labour force participation rates projected for this scenario. These training initiatives are:
additional training for those currently not in the labour force (in order to encourage them into the labour force);
additional training for those unemployed (to help move unemployment down to 3%);
additional (re-fresher) training for some people who have VET qualifications but are employed in occupations where they may not be fully utilising them;
Future demand for vocational education and training in NSW
5
a higher rate of continuing training for those employed (a preventative measure to maintain or upgrade the skills of existing workers to avoid premature retirements); and
a faster rate of casualisation of the workforce (with the additional people casually employed seen as having higher training needs).
Finally for the target scenario, using the standard forecast process and applying the initiatives noted above, projections for the various components of VET activity are collated to give a projection for total publicly funded VET demand over time, nationally and for New South Wales.
Future demand for vocational education and training in NSW
6
2. THE BENEFITS OF SKILL DEVELOPMENT
Australia’s living standards per head are a function of the effectiveness with which we work (productivity) and the proportion of us working (participation).
As the Federal Treasury’s Intergenerational Report noted in 2002, the coming decades of baby boomer retirement will see aggregate participation fall. Therefore Treasury and others have argued the need for policies which can help fill that shortfall by increasing either participation or productivity.
Importantly, improved skills developments (such as VET studies to improve work skills) can do both of these. As economists have increasingly noted, not merely does increased investment in skills show up as more productive workers, those workers also tend to stay in the workforce for longer – thereby boosting participation as well as productivity. And, equally importantly, early moves to increase skills development are likely to have their prime years of payoff across the decades when growth will be most at risk from baby boomer retirement.
This chapter sets out some of those linkages.
The ageing of the baby boomers will eat into economic growth, particularly through the years of maximum retirement from 2015-2030.
That point is made at length in Federal Treasury’s 2002 Intergenerational Report and the Productivity Commission’s 2005 Economic Implications of an Ageing Australia.
As a result, Federal Treasury and others have been urging faster productivity growth and higher levels of participation, as the resultant increase in the size of the economy would directly address many of the risks associated with slowing growth.
That point has been hammered home by the Treasury Secretary Ken Henry in several speeches including, for example, his August 2004 Policy Strategies for Future Growth.
And Treasury researchers are now making the point that one way to increase both productivity and participation is to have a higher skilled workforce. Productivity rises due to increased skills, and participation rises as those increased skills lead to higher wages, a reduced likelihood of unemployment and (typically) better working conditions.
Such points have been made by Kennedy and Hedley of Treasury in a 2003 Working Paper, Gruen and Garbutt in a 2004 paper and Davis and Ewing in a 2005 paper.
This chapter joins the above dots.
2.1 LINKS BETWEEN EDUCATION AND WORK
For the economy as a whole more education means more skilled workers, which means:
Higher productivity. Workers with more education bring a higher level of skills to the workplace.
Higher participation. Workers with higher skill levels are more likely to work, and also tend to work for longer by choosing to delay retirement.
Higher employment. Workers with more education are more employable and enjoy lower unemployment rates.
Future demand for vocational education and training in NSW
7
There is a clear and well-established relationship between education levels and productivity. Recently, economists have also emphasised a second and almost as well-established linkage – those with higher levels of education also have higher rates of workforce participation: both during working age and as they approach traditional retirement age.
For society, higher levels of education also mean higher average incomes. That in turn means even faster growth in income tax collections because of our progressive income tax system (which applies higher average tax rates to higher earnings).
Those increased taxes may be spent for the benefit of everyone. These extra taxes – which can then be redistributed to everyone by the government – are perhaps the most direct economic channel by which society benefits from having a more educated workforce.
2.1.1 THE DIRECT EFFECT OF EDUCATION ON PRODUCTIVITY
Education is increasingly becoming the ‘engine room’ of modern economies. If we get this part of the economy right, most other things ought to fall into place, because increased investment in education boosts both productivity and participation.
Education has a direct effect on the level of productivity in the economy (and therefore output growth) because it increases the productivity of individuals. A more educated worker is a more productive worker, and investment in education provides a pool of more skilled labour.
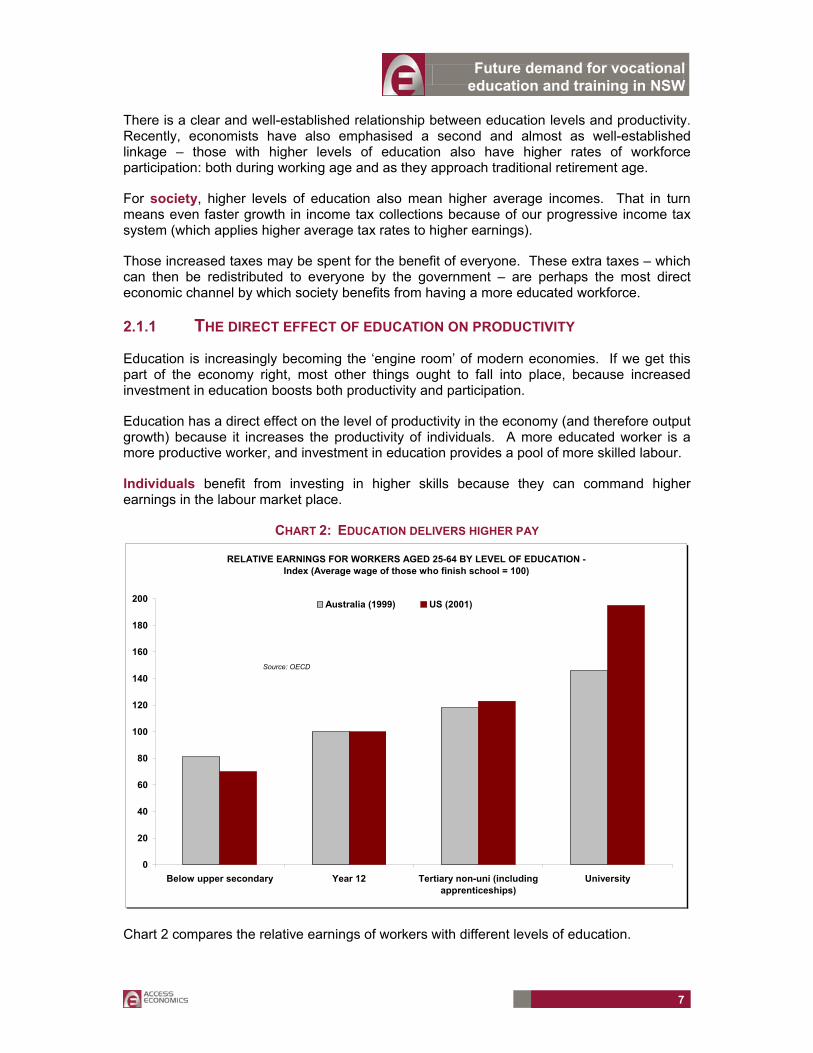
Individuals benefit from investing in higher skills because they can command higher earnings in the labour market place.
CHART 2: EDUCATION DELIVERS HIGHER PAY
RELATIVE EARNINGS FOR WORKERS AGED 25-64 BY LEVEL OF EDUCATION - Index (Average wage of those who finish school = 100)
0
20
40
60
80
100
120
140
160
180
200
Below upper secondary Year 12 Tertiary non-uni (includingapprenticeships)
University
Australia (1999) US (2001)
Source: OECD
Chart 2 compares the relative earnings of workers with different levels of education.
Future demand for vocational education and training in NSW
8
The index is compiled on the basis that those who completed year 12 are assumed to have an average wage of 100.
Lesser skilled workers have relatively lower average wages. In Australia (in 1999), those who had not completed Year 12 earned almost 20% less than those who had. (For the US, the pay cut was even greater at 30%.)
Higher skilled workers have relatively higher average wages. For Australia, university educated workers earned 40% more than those who completed Year 12, and 75% more than the least educated. For ‘tertiary non-uni’, a group which includes those with VET qualifications, the wage premium above Year 12 rates is close to 20%.
Note that the US experience suggests a greater spread of wages there than in Australia: in the US, the least educated earn relatively less; and the most educated earn relatively more. The possible reasons for this difference are complex.
But it is possible that the US experience could provide a pointer to future trends in Australia as international competition for skilled labour will likely become more intense over time: placing pressure on Australia’s relatively compressed skill differentials.
If that scenario was to happen, it would further underline the case for limiting the number of Australian ‘early education exits’.
Research has attempted to measure the effect of education on productivity in two broad ways. The first looks at relative wages across skill levels, and attempts to estimate the ‘private return to education’, the increased wages received by workers who have done an extra year of education. Chart 2 provides evidence of the strength of the results.
Aschenfelter and Krueger (1993) undertook a study of wage data for a sample of twins in the US. They found that an additional year of schooling resulted in increased wages of between 12% and 16%.
An Australian study (Miller, Mulvey and Martin (1995), using similar twins data collected in the 1980s) found a wage increment from an extra year of schooling of around 7.5%. This ignores the effects of schooling on wages within occupations, instead focusing on the effect of education on wages through the impact on the occupation of the individual.
The second method of estimating the return to schooling looks at levels of education and income across countries.
As with all cross-country studies, the strength of any conclusions is limited by the availability of comparable data.
Research by Bassanini and Scarpetta of the OECD indicates that an extra year of schooling eventually raises GDP by around 6%. This approach has not (as yet) incorporated the further refinement of adjusting for cross-country differences in educational quality. Note that this figure combines the productivity and participation channels of higher education levels.
2.1.2 THE EFFECT OF EDUCATION ON PRODUCTIVITY GROWTH
In addition, some researchers argue that a more skilled workforce is more able to adapt to new technologies in the workplace. This argument puts forth the idea that not only does
Future demand for vocational education and training in NSW
9
education increase the level of productivity in the economy, it also has an effect on the growth of productivity over time1.
Research into this ‘catch up’ phenomenon has produced some interesting results by comparing countries over time, but is yet to produce solid evidence for developed countries.
It is perhaps too early to tell whether productivity growth is improved over and above the direct increase in worker productivity, but to the extent that there are positive ‘spillovers’ from education, there is potential for an increase in broad productivity growth.
2.2 THE EFFECT OF EDUCATION ON PARTICIPATION RATES
Higher education increases the wage an individual can command, giving them a stronger incentive to work, and reduces their likelihood of any spells in unemployment.
To the extent that higher skilled jobs tend to be less ‘back breaking’ and more interesting, it also means that older higher skilled workers are more likely to be willing and able to maintain a connection with the workforce than less skilled workers.
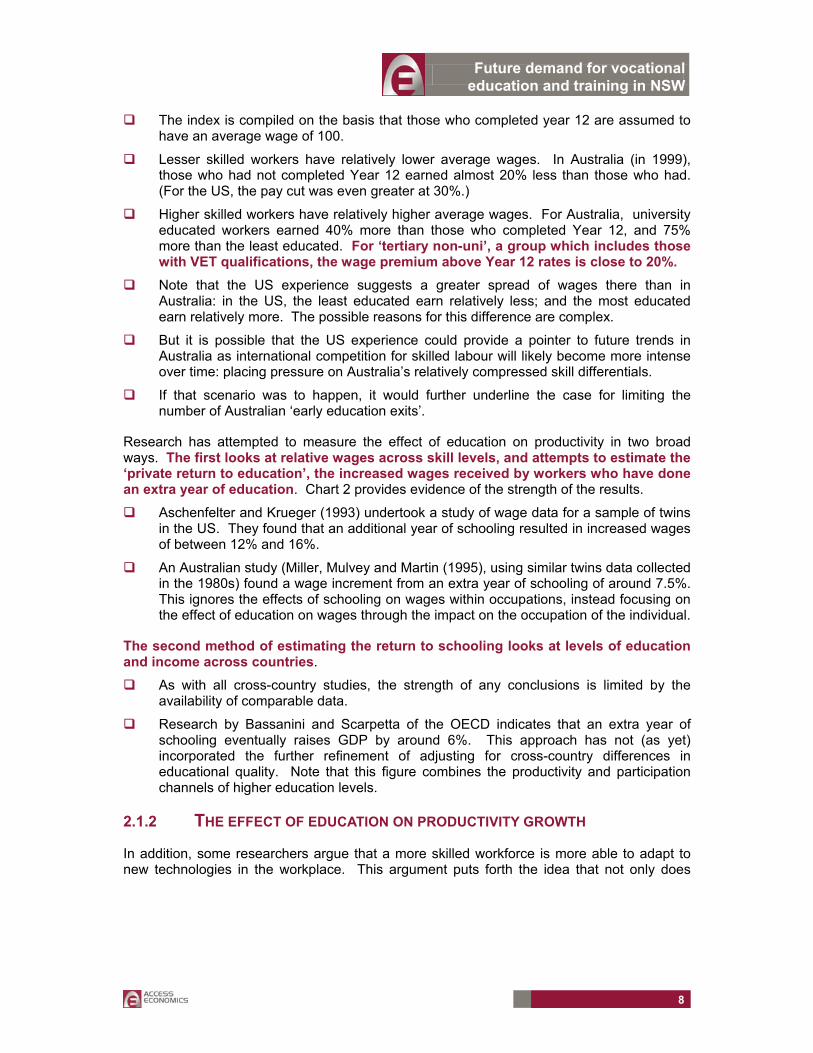
While detailed data on the effects of a small increase in education on the length of working life are not available, there is ample evidence that increased educational attainment results in increase labour force participation – see Chart 3.
CHART 3: PARTICIPATION RISES WITH SKILL LEVELS
Participation rates by skill level
0
10
20
30
40
50
60
Skilled Middle Skill Unskilled
%
25-34 35-49
50-59 Total
*Where Skilled represents a bachelor degree or higher, and unskilled no qualification
1 This is a strand of the literature on ‘endogenous growth’ economic models which attempts to identify the forces underlying multifactor productivity growth rather than applying the traditional assumption of an ‘exogenous’ parameter.
Future demand for vocational education and training in NSW
10
2.3 THE EFFECT OF EDUCATION ON UNEMPLOYMENT
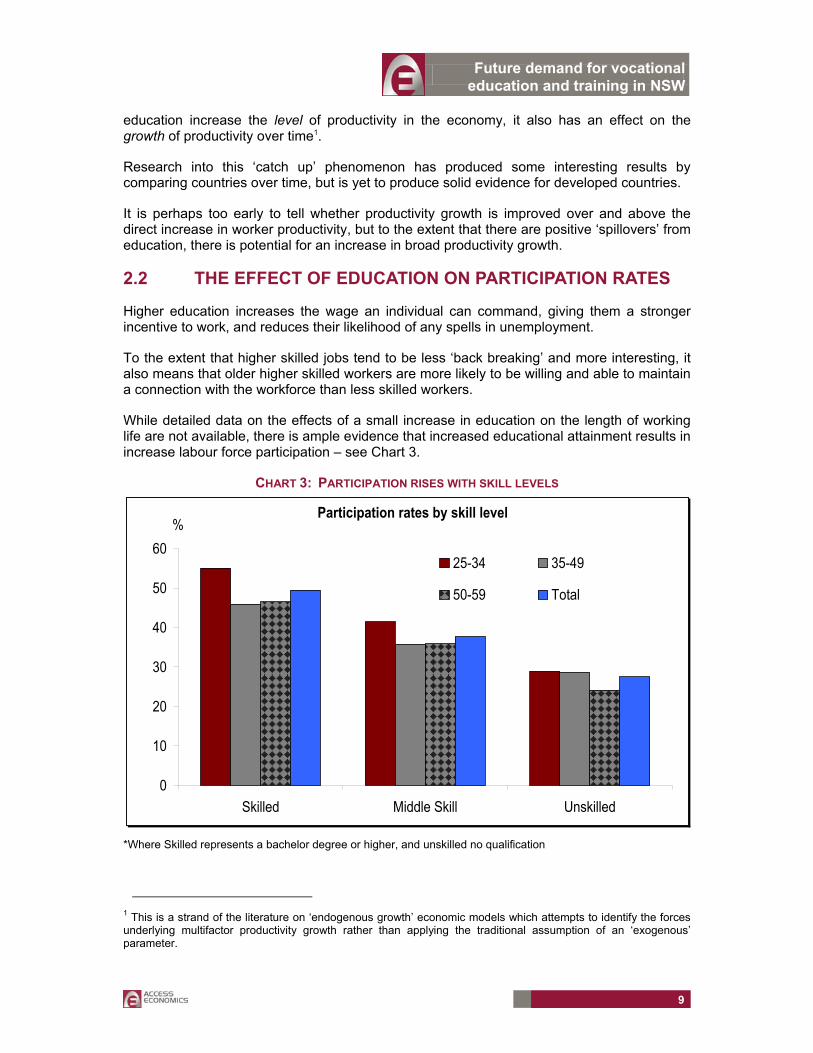
Higher rates of education also reduce the likelihood of unemployment because the unemployment rate declines as education levels rise – see Chart 4.
Economic growth inevitably involves a degree of disruptive change – capital and labour is made redundant in some industries at the same time that other industries are experiencing capital and labour shortages.
Higher levels of education allow displaced workers to more easily pick up the threads of their career. (Less educated workers have greater difficulty in demonstrating the skills that would allow them to quickly find another job.)
In Australia, the chances of being unemployed are three times greater for those who have not completed Year 12 compared to those who have completed university.
CHART 4: AND EDUCATION DELIVERS JOBS
UNEMPLOYMENT RATES BY LEVEL OF EDUCATION - 2001 (%)
0
2
4
6
8
10
Below upper secondary Year 12 Tertiary non-uni (includingapprenticeships)
University
Australia US
Source: OECD
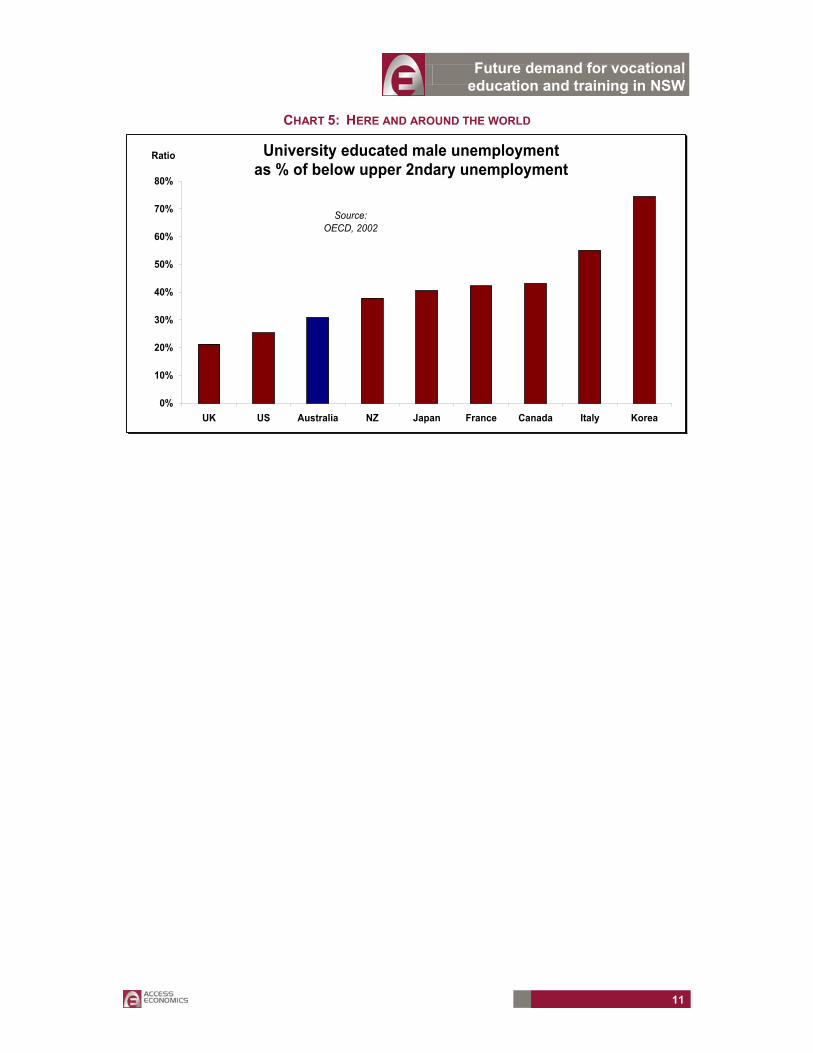
Chart 5 shows Australia’s experience with the higher employability of higher skilled workers is broadly reflected in international experience. In the US, the chances are more than four times greater of being unemployed for those not completing the equivalent of Year 12.
Future demand for vocational education and training in NSW
11
CHART 5: HERE AND AROUND THE WORLD
University educated male unemployment as % of below upper 2ndary unemployment
0%
10%
20%
30%
40%
50%
60%
70%
80%
UK US Australia NZ Japan France Canada Italy Korea
Ratio
Source: OECD, 2002
Future demand for vocational education and training in NSW
12
3. PROFILE OF VET ACTIVITY
VET activity ramped up notably in the 1990s in New South Wales, but since 2000 student numbers and the number of hours delivered has levelled off. That decline has been more notable in New South Wales than nationally.
In part, the recent decline in VET participation reflects a petering out of supply side initiatives which were encouraging greater participation in VET in the 1990s. Other factors here are that (1) productivity growth has also slowed, (2) higher student fees and (3), until relatively recently, a strong labour market negated some short term training needs by offering attractive short term returns.
In 2004, VET students in New South Wales amounted to 16.3% of total people employed, a participation rate just below the national average. The profile of VET delivered was approximately 50% of training as continuing training (for those already in or who have recently joined the workforce), 30% as re-entrant training, and 20% for New Apprenticeships. Overall some 44% of VET students were aged under 25.
This report examines publicly funded VET which is one component of the overall skills development effort. The extent of publicly funded VET is reported in the national provider collection maintained by the National Centre for Vocational Education Research (NCVER).
This covers all VET delivered by providers in receipt of public funding allocations for VET. This includes:
all VET delivered by TAFE and other government providers;
most VET delivered by multi-sector higher education institutions;
public VET delivered by community education providers; and
public VET delivered by registered private providers.
VET which is fee for service by private providers is outside the scope of this report, as is delivery of recreation, leisure and personal enrichment activity (‘non-vocational’ programs), as is VET delivered in schools where the delivery has been undertaken by schools.
3.1 TOTAL VET ACTIVITY
In New South Wales in 2004:
there were 517,500 students undertaking publicly funded VET; and
some 112 million hours of VET was delivered to those students.
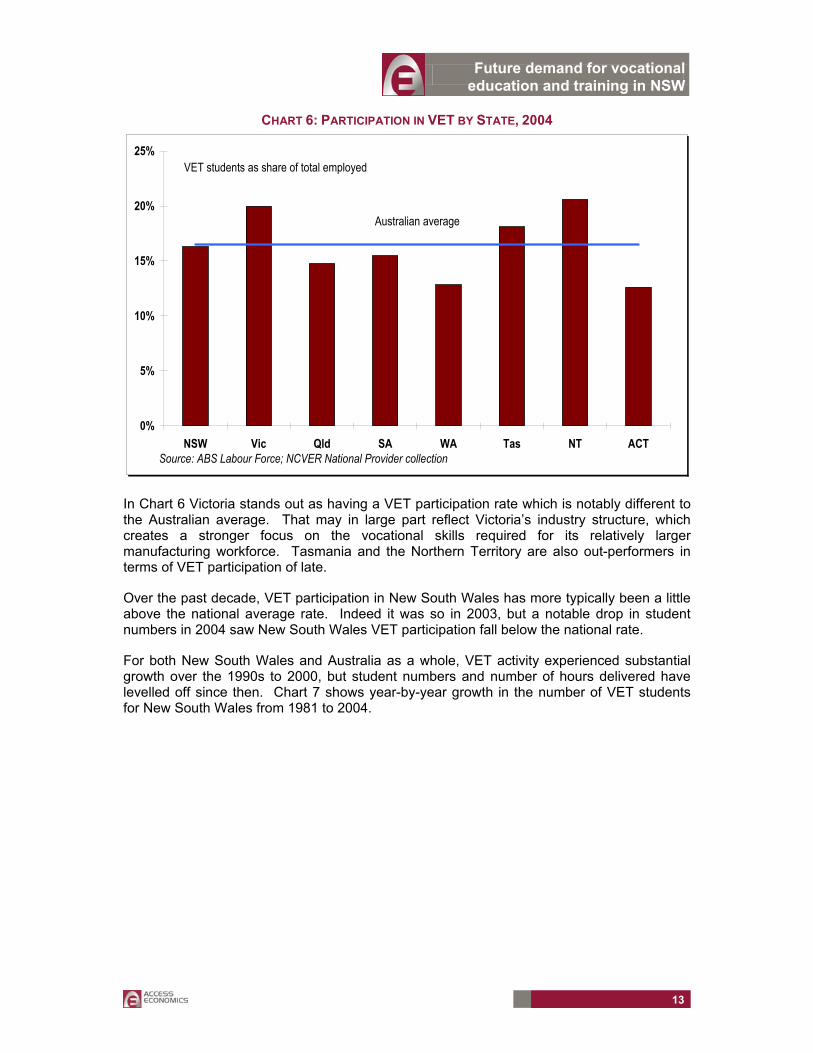
Chart 6 shows VET participation (the number of VET students as a share of those employed) State by State and nationally in 2004. VET participation in New South Wales is marginally lower than that seen for Australia as a whole.
Future demand for vocational education and training in NSW
13
CHART 6: PARTICIPATION IN VET BY STATE, 2004
0%
5%
10%
15%
20%
25%
NSW Vic Qld SA WA Tas NT ACT
VET students as share of total employed
Australian average
Source: ABS Labour Force; NCVER National Provider collection
In Chart 6 Victoria stands out as having a VET participation rate which is notably different to the Australian average. That may in large part reflect Victoria’s industry structure, which creates a stronger focus on the vocational skills required for its relatively larger manufacturing workforce. Tasmania and the Northern Territory are also out-performers in terms of VET participation of late.
Over the past decade, VET participation in New South Wales has more typically been a little above the national average rate. Indeed it was so in 2003, but a notable drop in student numbers in 2004 saw New South Wales VET participation fall below the national rate.
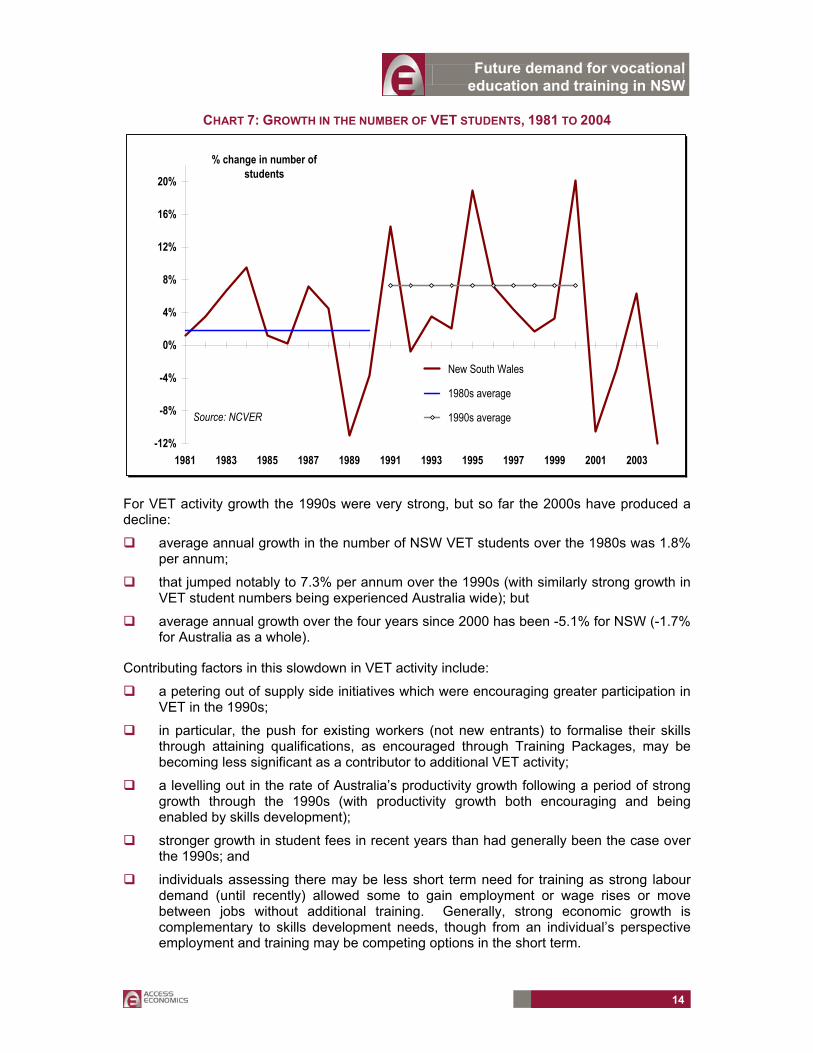
For both New South Wales and Australia as a whole, VET activity experienced substantial growth over the 1990s to 2000, but student numbers and number of hours delivered have levelled off since then. Chart 7 shows year-by-year growth in the number of VET students for New South Wales from 1981 to 2004.
Future demand for vocational education and training in NSW
14
CHART 7: GROWTH IN THE NUMBER OF VET STUDENTS, 1981 TO 2004
-12%
-8%
-4%
0%
4%
8%
12%
16%
20%
1981 1983 1985 1987 1989 1991 1993 1995 1997 1999 2001 2003
% change in number of students
New South Wales
1980s average
1990s averageSource: NCVER
For VET activity growth the 1990s were very strong, but so far the 2000s have produced a decline:
average annual growth in the number of NSW VET students over the 1980s was 1.8% per annum;
that jumped notably to 7.3% per annum over the 1990s (with similarly strong growth in VET student numbers being experienced Australia wide); but
average annual growth over the four years since 2000 has been -5.1% for NSW (-1.7% for Australia as a whole).
Contributing factors in this slowdown in VET activity include:
a petering out of supply side initiatives which were encouraging greater participation in VET in the 1990s;
in particular, the push for existing workers (not new entrants) to formalise their skills through attaining qualifications, as encouraged through Training Packages, may be becoming less significant as a contributor to additional VET activity;
a levelling out in the rate of Australia’s productivity growth following a period of strong growth through the 1990s (with productivity growth both encouraging and being enabled by skills development);
stronger growth in student fees in recent years than had generally been the case over the 1990s; and
individuals assessing there may be less short term need for training as strong labour demand (until recently) allowed some to gain employment or wage rises or move between jobs without additional training. Generally, strong economic growth is complementary to skills development needs, though from an individual’s perspective employment and training may be competing options in the short term.
Future demand for vocational education and training in NSW
15
Note also that the year 2000 may provide somewhat of an artificial peak for VET activity in New South Wales. Part of the strong growth in training in that year was related to the Olympic Games, with a significant number of people undertaking VET courses associated with volunteer work at the Olympics. The Olympics would also have placed demands on the need for skilled construction workers at that time. However, the recent slowdown in VET in New South Wales is not only against that peak year – the number of VET students in New South Wales in 2004 is even below 1999 levels.
In terms of the number of hours of VET delivered, New South Wales has seen a decline in 2004 of some 5.0%. The level of VET hours delivered however remains a little above year 2000 levels. The average number of VET hours delivered per student in New South Wales has expanded from 169 in 2000 to 216 in 2004, with a similar expansion seen nationally.
The shift to longer courses in recent years may reflect the job cycle which in recent years has favoured blue collar jobs more so than previously, and skills here are often developed through long apprenticeships rather than shorter courses of study.
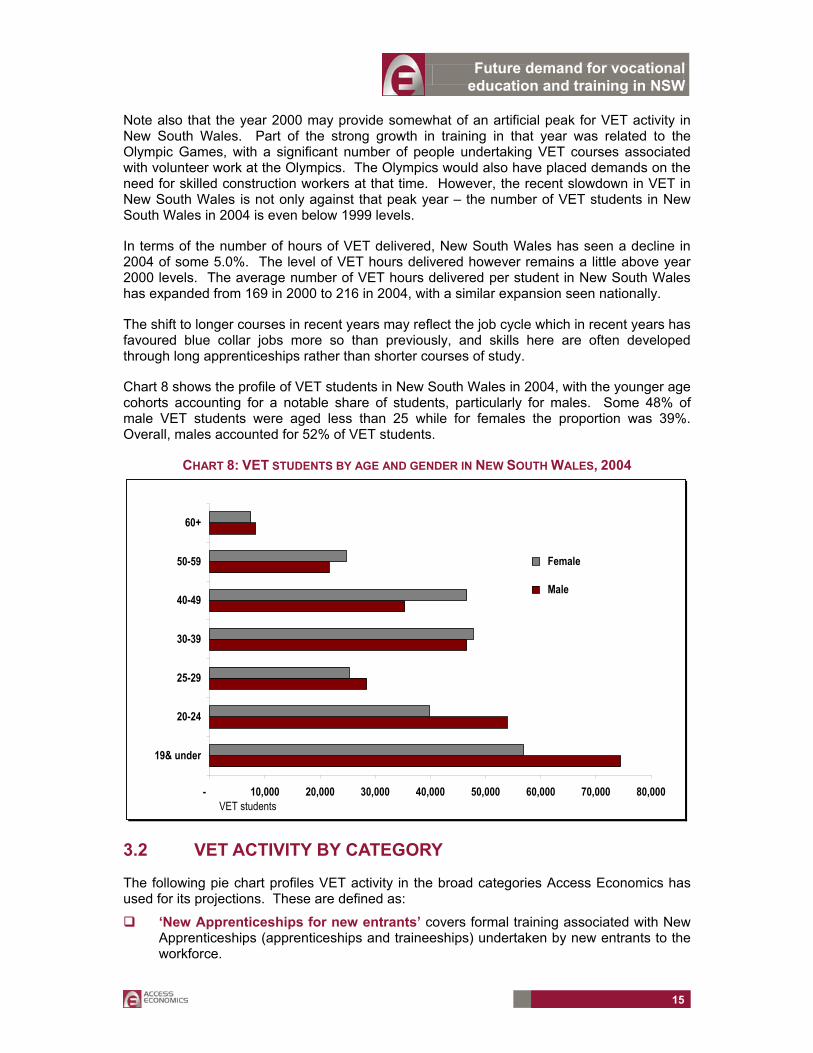
Chart 8 shows the profile of VET students in New South Wales in 2004, with the younger age cohorts accounting for a notable share of students, particularly for males. Some 48% of male VET students were aged less than 25 while for females the proportion was 39%. Overall, males accounted for 52% of VET students.
CHART 8: VET STUDENTS BY AGE AND GENDER IN NEW SOUTH WALES, 2004
- 10,000 20,000 30,000 40,000 50,000 60,000 70,000 80,000
19& under
20-24
25-29
30-39
40-49
50-59
60+
Female
Male
VET students
3.2 VET ACTIVITY BY CATEGORY
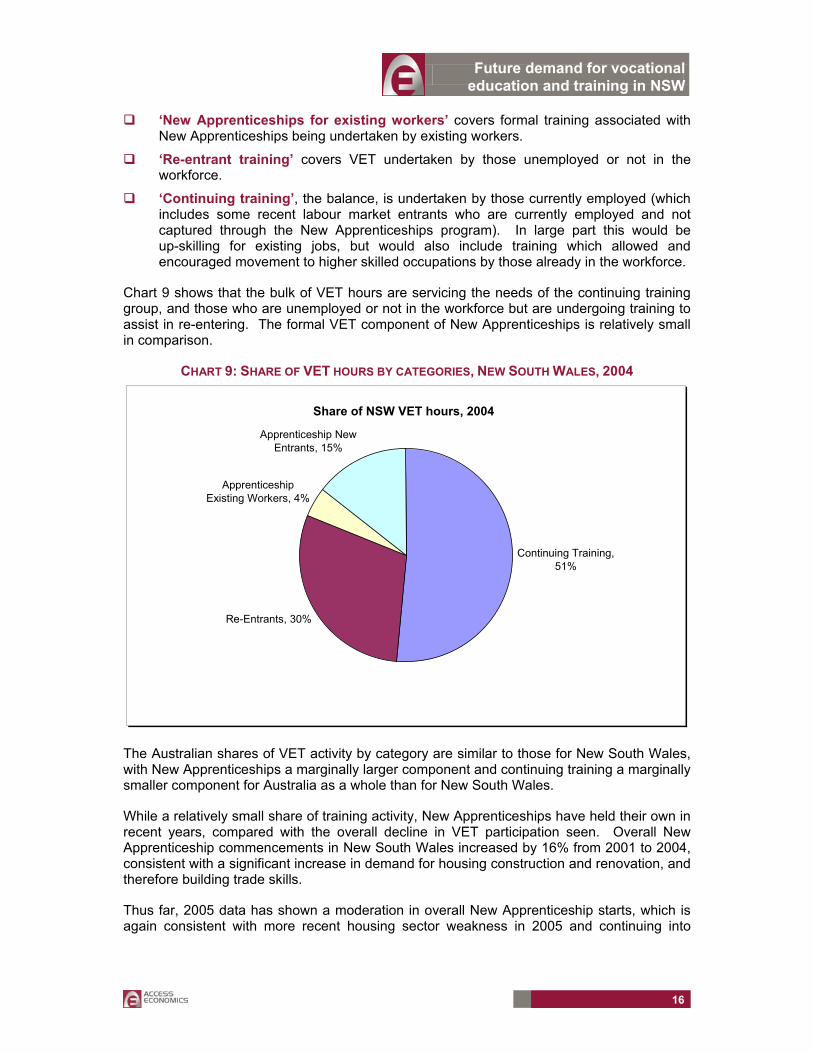
The following pie chart profiles VET activity in the broad categories Access Economics has used for its projections. These are defined as:
‘New Apprenticeships for new entrants’ covers formal training associated with New Apprenticeships (apprenticeships and traineeships) undertaken by new entrants to the workforce.
Future demand for vocational education and training in NSW
16
‘New Apprenticeships for existing workers’ covers formal training associated with New Apprenticeships being undertaken by existing workers.
‘Re-entrant training’ covers VET undertaken by those unemployed or not in the workforce.
‘Continuing training’, the balance, is undertaken by those currently employed (which includes some recent labour market entrants who are currently employed and not captured through the New Apprenticeships program). In large part this would be up-skilling for existing jobs, but would also include training which allowed and encouraged movement to higher skilled occupations by those already in the workforce.
Chart 9 shows that the bulk of VET hours are servicing the needs of the continuing training group, and those who are unemployed or not in the workforce but are undergoing training to assist in re-entering. The formal VET component of New Apprenticeships is relatively small in comparison.
CHART 9: SHARE OF VET HOURS BY CATEGORIES, NEW SOUTH WALES, 2004
Continuing Training, 51%
Re-Entrants, 30%
Apprenticeship Existing Workers, 4%
Apprenticeship New Entrants, 15%
Share of NSW VET hours, 2004
The Australian shares of VET activity by category are similar to those for New South Wales, with New Apprenticeships a marginally larger component and continuing training a marginally smaller component for Australia as a whole than for New South Wales.
While a relatively small share of training activity, New Apprenticeships have held their own in recent years, compared with the overall decline in VET participation seen. Overall New Apprenticeship commencements in New South Wales increased by 16% from 2001 to 2004, consistent with a significant increase in demand for housing construction and renovation, and therefore building trade skills.
Thus far, 2005 data has shown a moderation in overall New Apprenticeship starts, which is again consistent with more recent housing sector weakness in 2005 and continuing into
Future demand for vocational education and training in NSW
17
2006.2 For the purposes of these projections, interest in New Apprenticeships appears to be starting from a cyclical high point, given the strong influence exerted by building trade skills.
3.3 QUALIFICATIONS PROFILE
Consistent with VET activity data (which showed a significant ramping up in training over the 1990s) is the data on the stock of VET qualifications. This information is drawn from the ABS rather than the National Provider collection, and is only available in occupational detail at the national level.
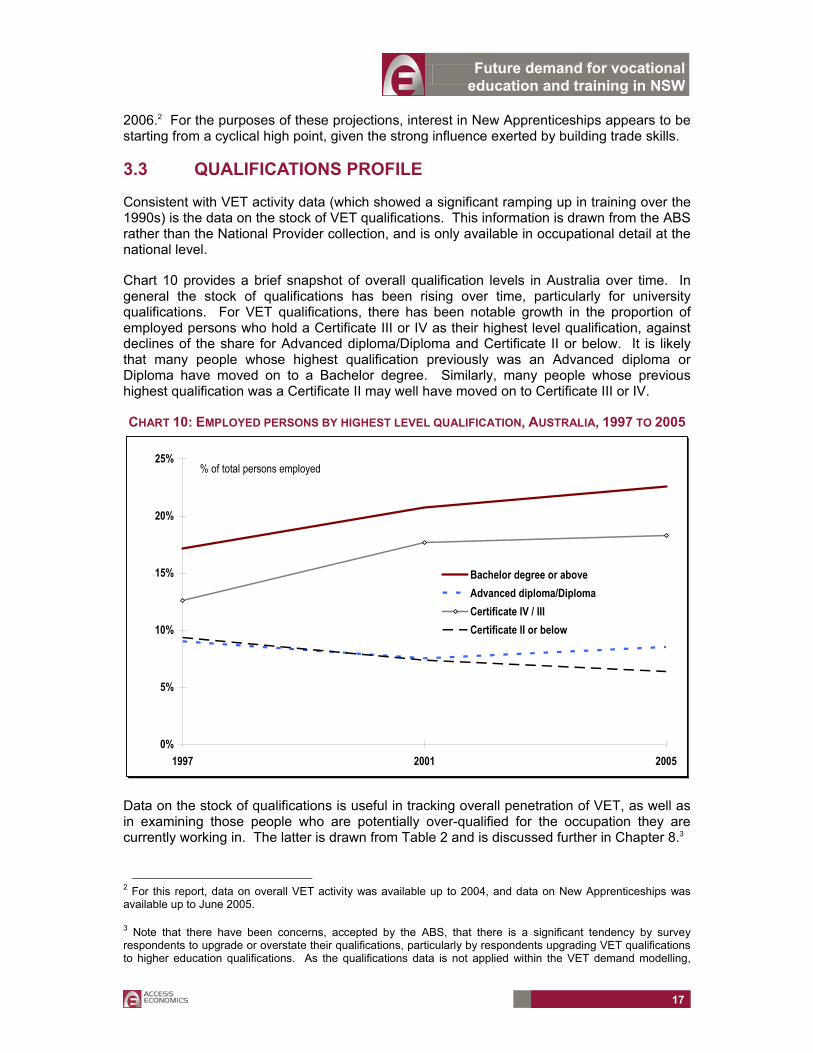
Chart 10 provides a brief snapshot of overall qualification levels in Australia over time. In general the stock of qualifications has been rising over time, particularly for university qualifications. For VET qualifications, there has been notable growth in the proportion of employed persons who hold a Certificate III or IV as their highest level qualification, against declines of the share for Advanced diploma/Diploma and Certificate II or below. It is likely that many people whose highest qualification previously was an Advanced diploma or Diploma have moved on to a Bachelor degree. Similarly, many people whose previous highest qualification was a Certificate II may well have moved on to Certificate III or IV.
CHART 10: EMPLOYED PERSONS BY HIGHEST LEVEL QUALIFICATION, AUSTRALIA, 1997 TO 2005
0%
5%
10%
15%
20%
25%
1997 2001 2005
Bachelor degree or aboveAdvanced diploma/DiplomaCertificate IV / III Certificate II or below
% of total persons employed
Data on the stock of qualifications is useful in tracking overall penetration of VET, as well as in examining those people who are potentially over-qualified for the occupation they are currently working in. The latter is drawn from Table 2 and is discussed further in Chapter 8.3
2 For this report, data on overall VET activity was available up to 2004, and data on New Apprenticeships was available up to June 2005.
3 Note that there have been concerns, accepted by the ABS, that there is a significant tendency by survey respondents to upgrade or overstate their qualifications, particularly by respondents upgrading VET qualifications to higher education qualifications. As the qualifications data is not applied within the VET demand modelling,
Future demand for vocational education and training in NSW
18
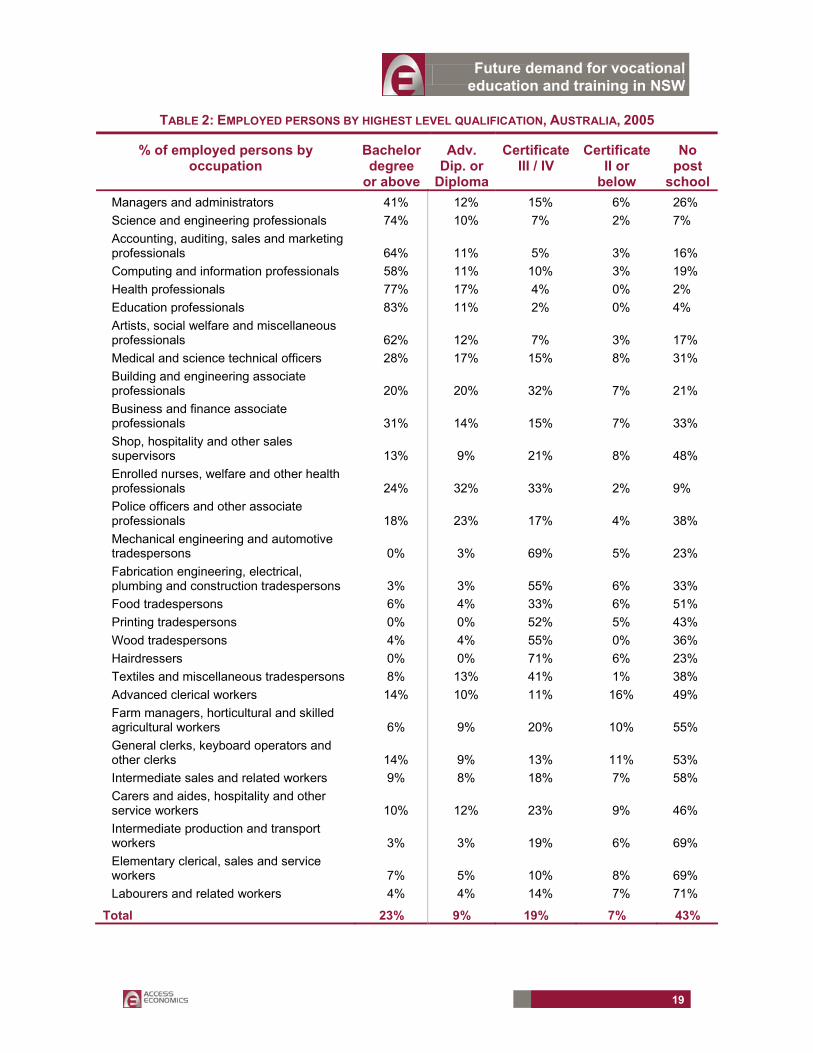
Table 2 shows highest level qualification rates for 28 occupational groups.4 The table can be seen as very broadly in order of skill levels of from top to bottom. Key features include:
as one would expect, higher levels of qualifications are more prevalent for the higher skill occupations;
while the trades occupations show a relatively high proportion of employees with VET qualifications, there are also a considerable number with no post-school qualifications (for example, 51% of food tradespersons and 36% of wood tradespersons); and
with the bottom six occupations in the table representing the least skilled, there are a reasonable proportion of these workers who have post-school qualifications. Arguably, they may not all be using them to the fullest extent.
other than in calibrating one initiative in the target scenario, such overstatement does not materially affect the VET demand projections presented here.
4 These 28 groups are an aggregation of 3-digit ASCO occupational categories, with the classification agreed with IPART for the reporting of occupational information.
Future demand for vocational education and training in NSW
19
TABLE 2: EMPLOYED PERSONS BY HIGHEST LEVEL QUALIFICATION, AUSTRALIA, 2005
% of employed persons by occupation
Bachelor degree
or above
Adv. Dip. or
Diploma
Certificate III / IV
Certificate II or
below
No post
school Managers and administrators 41% 12% 15% 6% 26% Science and engineering professionals 74% 10% 7% 2% 7% Accounting, auditing, sales and marketing professionals 64% 11% 5% 3% 16% Computing and information professionals 58% 11% 10% 3% 19% Health professionals 77% 17% 4% 0% 2% Education professionals 83% 11% 2% 0% 4% Artists, social welfare and miscellaneous professionals 62% 12% 7% 3% 17% Medical and science technical officers 28% 17% 15% 8% 31% Building and engineering associate professionals 20% 20% 32% 7% 21% Business and finance associate professionals 31% 14% 15% 7% 33% Shop, hospitality and other sales supervisors 13% 9% 21% 8% 48% Enrolled nurses, welfare and other health professionals 24% 32% 33% 2% 9% Police officers and other associate professionals 18% 23% 17% 4% 38% Mechanical engineering and automotive tradespersons 0% 3% 69% 5% 23% Fabrication engineering, electrical, plumbing and construction tradespersons 3% 3% 55% 6% 33% Food tradespersons 6% 4% 33% 6% 51% Printing tradespersons 0% 0% 52% 5% 43% Wood tradespersons 4% 4% 55% 0% 36% Hairdressers 0% 0% 71% 6% 23% Textiles and miscellaneous tradespersons 8% 13% 41% 1% 38% Advanced clerical workers 14% 10% 11% 16% 49% Farm managers, horticultural and skilled agricultural workers 6% 9% 20% 10% 55% General clerks, keyboard operators and other clerks 14% 9% 13% 11% 53% Intermediate sales and related workers 9% 8% 18% 7% 58% Carers and aides, hospitality and other service workers 10% 12% 23% 9% 46% Intermediate production and transport workers 3% 3% 19% 6% 69% Elementary clerical, sales and service workers 7% 5% 10% 8% 69% Labourers and related workers 4% 4% 14% 7% 71%
Total 23% 9% 19% 7% 43%
Future demand for vocational education and training in NSW
20
4. BASELINE SCENARIO – LABOUR MARKET PROJECTIONS
Employment growth in Australia is expected to slow notably from recent rates, not only for cyclical reasons (indeed, the latter have already prompted a slowdown from recent rapid rates of job growth), but as a key symptom of Australia’s ageing population. The latter is likely to see average labour force participation drop over time.
Over the 20 year forecast period here (2005 to 2025), average growth in employment is projected at:
• 0.64% per annum for New South Wales; and
• 0.87% per annum for Australia.
Those projections are based on a modest further increase in age cohort labour force participation rates, and with unemployment staying roughly constant at around 5.0%.
On an industry basis, job generation is expected to be led by business services, community services and recreational services. These are sectors which employ a lot of people and have also dominated job creation over the past decade.
On an occupational basis, that would translate into strong demand for the likes of nurses and other community service workers to service Australia’s ageing population, and skilled service jobs generally. There may also continue to be good job growth in lower skilled occupations such as ‘shop, hospitality and other sales supervisors’ and ‘elementary clerical, sales and service workers’, which will benefit from continued growth in demand for business and recreational services.
4.1 EMPLOYMENT GROWTH
Australia’s economy has been a strong performer over the past decade and a half. Probably the strongest hallmark of economic success over this time has been bringing the national unemployment rate down from a peak of 11% in 1993 to just 5% of late.
Recent years have seen above average employment growth, with that growth slanted towards traditionally VET-intensive blue collar sectors. At times of late employment growth has been faster than overall GDP growth, with a peak in employment growth in mid-2005 and some moderation since then. New South Wales has experienced similar labour market trends to those exhibited nationally, but with a lower recent peak in employment growth and notable moderation since then, in part Australia’s commodity boom has created stronger opportunities in the sun-belt States than it has in New South Wales, and in part because the strength of the recent housing boom in Sydney reduced inflows of population and encouraged outflows.
While employment growth was very strong at times of late, that was in large part cyclical, related to the strength of construction activity to support (recently strong but now moderating) housing investment and booming business investment.
Future demand for vocational education and training in NSW
21
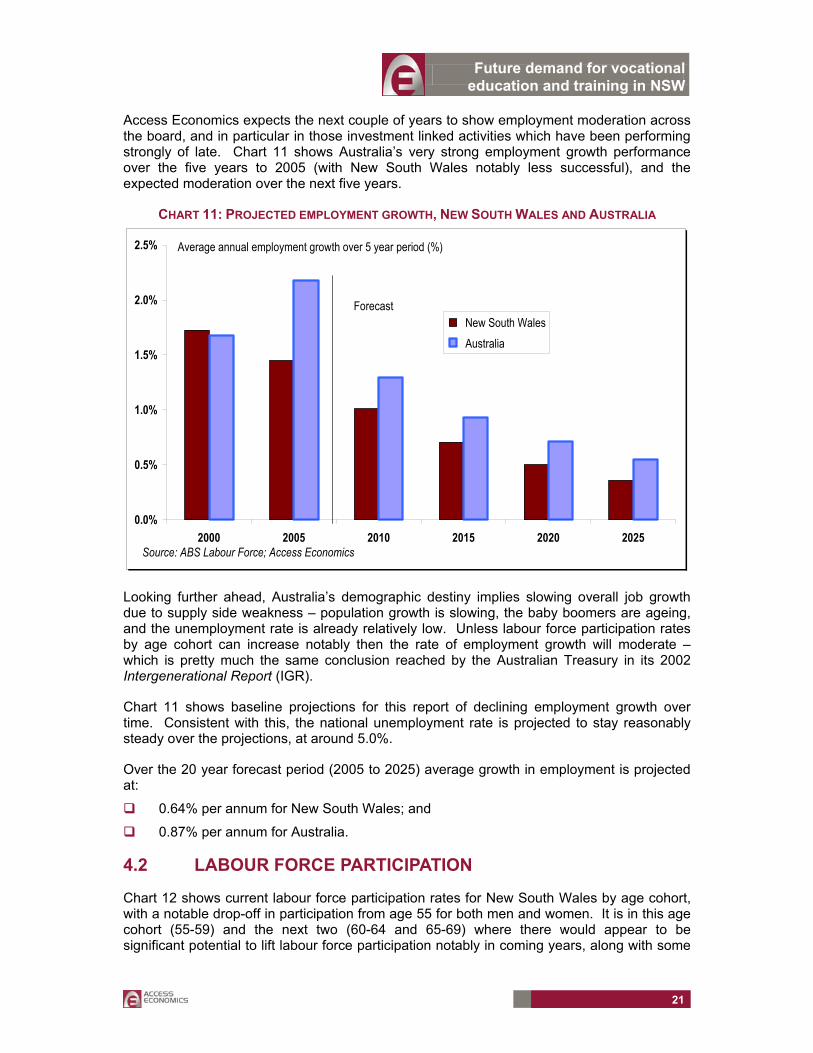
Access Economics expects the next couple of years to show employment moderation across the board, and in particular in those investment linked activities which have been performing strongly of late. Chart 11 shows Australia’s very strong employment growth performance over the five years to 2005 (with New South Wales notably less successful), and the expected moderation over the next five years.
CHART 11: PROJECTED EMPLOYMENT GROWTH, NEW SOUTH WALES AND AUSTRALIA
0.0%
0.5%
1.0%
1.5%
2.0%
2.5%
2000 2005 2010 2015 2020 2025
New South Wales Australia
Source: ABS Labour Force; Access Economics
Average annual employment growth over 5 year period (%)
Forecast
Looking further ahead, Australia’s demographic destiny implies slowing overall job growth due to supply side weakness – population growth is slowing, the baby boomers are ageing, and the unemployment rate is already relatively low. Unless labour force participation rates by age cohort can increase notably then the rate of employment growth will moderate – which is pretty much the same conclusion reached by the Australian Treasury in its 2002 Intergenerational Report (IGR).
Chart 11 shows baseline projections for this report of declining employment growth over time. Consistent with this, the national unemployment rate is projected to stay reasonably steady over the projections, at around 5.0%.
Over the 20 year forecast period (2005 to 2025) average growth in employment is projected at:
0.64% per annum for New South Wales; and
0.87% per annum for Australia.
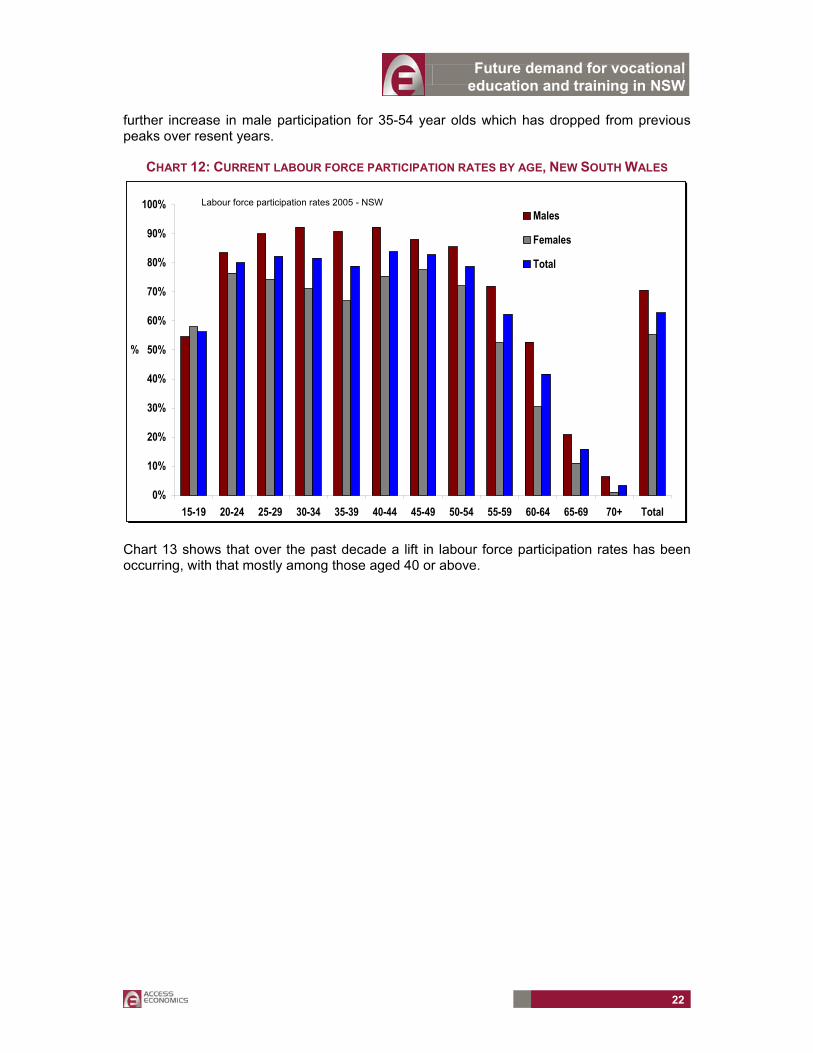
4.2 LABOUR FORCE PARTICIPATION
Chart 12 shows current labour force participation rates for New South Wales by age cohort, with a notable drop-off in participation from age 55 for both men and women. It is in this age cohort (55-59) and the next two (60-64 and 65-69) where there would appear to be significant potential to lift labour force participation notably in coming years, along with some
Future demand for vocational education and training in NSW
22
further increase in male participation for 35-54 year olds which has dropped from previous peaks over resent years.
CHART 12: CURRENT LABOUR FORCE PARTICIPATION RATES BY AGE, NEW SOUTH WALES
0%
10%
20%
30%
40%
50%
60%
70%
80%
90%
100%
15-19 20-24 25-29 30-34 35-39 40-44 45-49 50-54 55-59 60-64 65-69 70+ Total
%
Males
Females
Total
Labour force participation rates 2005 - NSW
Chart 13 shows that over the past decade a lift in labour force participation rates has been occurring, with that mostly among those aged 40 or above.
Future demand for vocational education and training in NSW
23
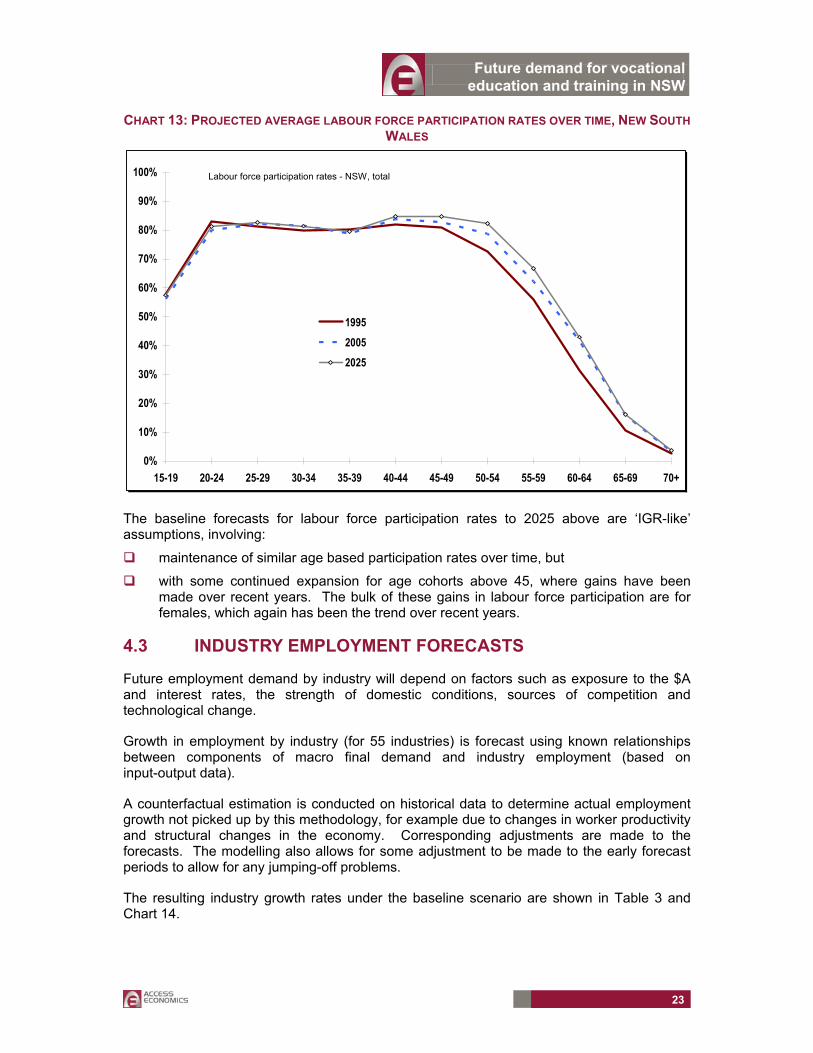
CHART 13: PROJECTED AVERAGE LABOUR FORCE PARTICIPATION RATES OVER TIME, NEW SOUTH WALES
0%
10%
20%
30%
40%
50%
60%
70%
80%
90%
100%
15-19 20-24 25-29 30-34 35-39 40-44 45-49 50-54 55-59 60-64 65-69 70+
199520052025
Labour force participation rates - NSW, total
The baseline forecasts for labour force participation rates to 2025 above are ‘IGR-like’ assumptions, involving:
maintenance of similar age based participation rates over time, but
with some continued expansion for age cohorts above 45, where gains have been made over recent years. The bulk of these gains in labour force participation are for females, which again has been the trend over recent years.
4.3 INDUSTRY EMPLOYMENT FORECASTS
Future employment demand by industry will depend on factors such as exposure to the $A and interest rates, the strength of domestic conditions, sources of competition and technological change.
Growth in employment by industry (for 55 industries) is forecast using known relationships between components of macro final demand and industry employment (based on input-output data).
A counterfactual estimation is conducted on historical data to determine actual employment growth not picked up by this methodology, for example due to changes in worker productivity and structural changes in the economy. Corresponding adjustments are made to the forecasts. The modelling also allows for some adjustment to be made to the early forecast periods to allow for any jumping-off problems.
The resulting industry growth rates under the baseline scenario are shown in Table 3 and Chart 14.
Future demand for vocational education and training in NSW
24
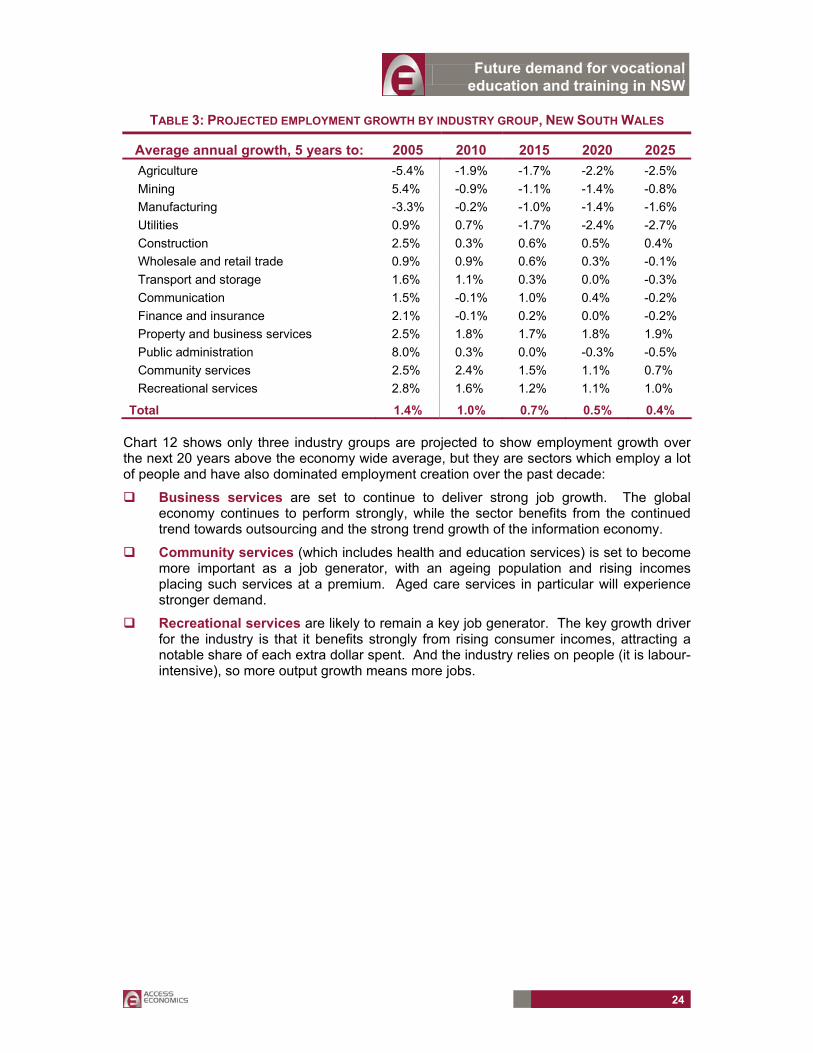
TABLE 3: PROJECTED EMPLOYMENT GROWTH BY INDUSTRY GROUP, NEW SOUTH WALES
Average annual growth, 5 years to: 2005 2010 2015 2020 2025 Agriculture -5.4% -1.9% -1.7% -2.2% -2.5% Mining 5.4% -0.9% -1.1% -1.4% -0.8% Manufacturing -3.3% -0.2% -1.0% -1.4% -1.6% Utilities 0.9% 0.7% -1.7% -2.4% -2.7% Construction 2.5% 0.3% 0.6% 0.5% 0.4% Wholesale and retail trade 0.9% 0.9% 0.6% 0.3% -0.1% Transport and storage 1.6% 1.1% 0.3% 0.0% -0.3% Communication 1.5% -0.1% 1.0% 0.4% -0.2% Finance and insurance 2.1% -0.1% 0.2% 0.0% -0.2% Property and business services 2.5% 1.8% 1.7% 1.8% 1.9% Public administration 8.0% 0.3% 0.0% -0.3% -0.5% Community services 2.5% 2.4% 1.5% 1.1% 0.7% Recreational services 2.8% 1.6% 1.2% 1.1% 1.0%
Total 1.4% 1.0% 0.7% 0.5% 0.4%
Chart 12 shows only three industry groups are projected to show employment growth over the next 20 years above the economy wide average, but they are sectors which employ a lot of people and have also dominated employment creation over the past decade:
Business services are set to continue to deliver strong job growth. The global economy continues to perform strongly, while the sector benefits from the continued trend towards outsourcing and the strong trend growth of the information economy.
Community services (which includes health and education services) is set to become more important as a job generator, with an ageing population and rising incomes placing such services at a premium. Aged care services in particular will experience stronger demand.
Recreational services are likely to remain a key job generator. The key growth driver for the industry is that it benefits strongly from rising consumer incomes, attracting a notable share of each extra dollar spent. And the industry relies on people (it is labour-intensive), so more output growth means more jobs.
Future demand for vocational education and training in NSW
25
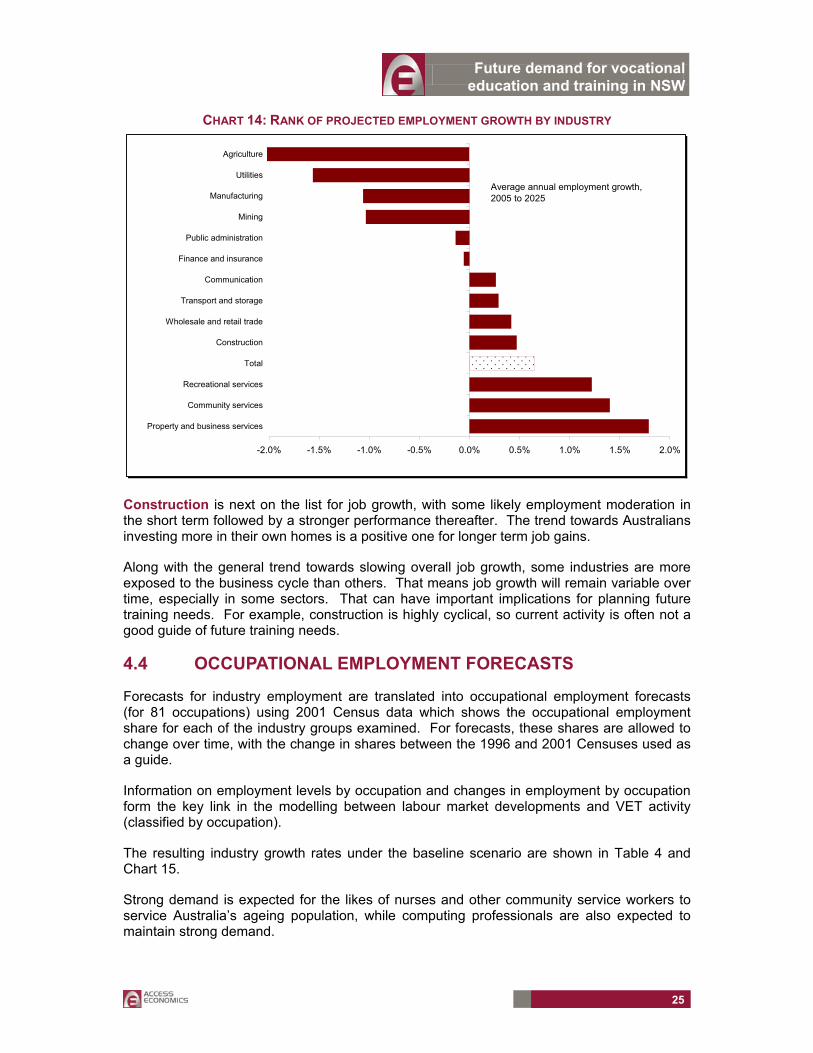
CHART 14: RANK OF PROJECTED EMPLOYMENT GROWTH BY INDUSTRY
-2.0% -1.5% -1.0% -0.5% 0.0% 0.5% 1.0% 1.5% 2.0%
Property and business services
Community services
Recreational services
Total
Construction
Wholesale and retail trade
Transport and storage
Communication
Finance and insurance
Public administration
Mining
Manufacturing
Utilities
Agriculture
Average annual employment growth, 2005 to 2025
Construction is next on the list for job growth, with some likely employment moderation in the short term followed by a stronger performance thereafter. The trend towards Australians investing more in their own homes is a positive one for longer term job gains.
Along with the general trend towards slowing overall job growth, some industries are more exposed to the business cycle than others. That means job growth will remain variable over time, especially in some sectors. That can have important implications for planning future training needs. For example, construction is highly cyclical, so current activity is often not a good guide of future training needs.
4.4 OCCUPATIONAL EMPLOYMENT FORECASTS
Forecasts for industry employment are translated into occupational employment forecasts (for 81 occupations) using 2001 Census data which shows the occupational employment share for each of the industry groups examined. For forecasts, these shares are allowed to change over time, with the change in shares between the 1996 and 2001 Censuses used as a guide.
Information on employment levels by occupation and changes in employment by occupation form the key link in the modelling between labour market developments and VET activity (classified by occupation).
The resulting industry growth rates under the baseline scenario are shown in Table 4 and Chart 15.
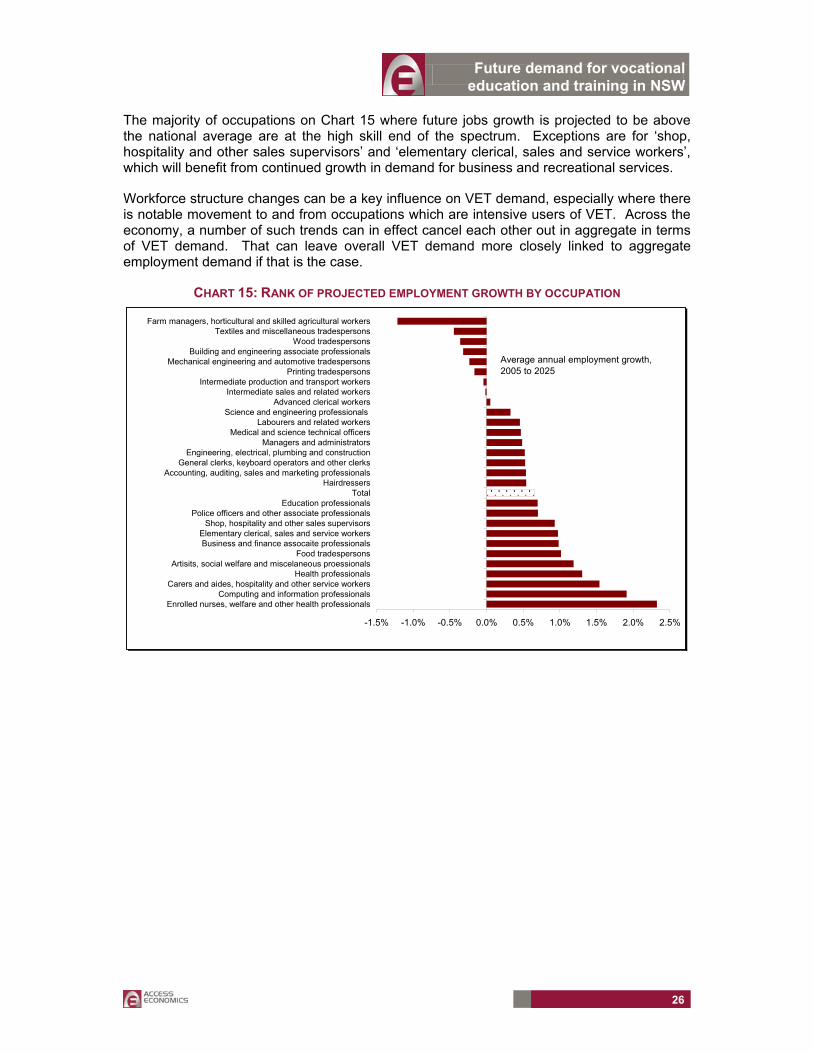
Strong demand is expected for the likes of nurses and other community service workers to service Australia’s ageing population, while computing professionals are also expected to maintain strong demand.
Future demand for vocational education and training in NSW
26
The majority of occupations on Chart 15 where future jobs growth is projected to be above the national average are at the high skill end of the spectrum. Exceptions are for ‘shop, hospitality and other sales supervisors’ and ‘elementary clerical, sales and service workers’, which will benefit from continued growth in demand for business and recreational services.
Workforce structure changes can be a key influence on VET demand, especially where there is notable movement to and from occupations which are intensive users of VET. Across the economy, a number of such trends can in effect cancel each other out in aggregate in terms of VET demand. That can leave overall VET demand more closely linked to aggregate employment demand if that is the case.
CHART 15: RANK OF PROJECTED EMPLOYMENT GROWTH BY OCCUPATION
-1.5% -1.0% -0.5% 0.0% 0.5% 1.0% 1.5% 2.0% 2.5%
Enrolled nurses, welfare and other health professionalsComputing and information professionals
Carers and aides, hospitality and other service workersHealth professionals
Artisits, social welfare and miscelaneous proessionalsFood tradespersons
Business and finance assocaite professionalsElementary clerical, sales and service workers
Shop, hospitality and other sales supervisorsPolice officers and other associate professionals
Education professionalsTotal
HairdressersAccounting, auditing, sales and marketing professionals
General clerks, keyboard operators and other clerksEngineering, electrical, plumbing and construction
Managers and administratorsMedical and science technical officers
Labourers and related workersScience and engineering professionals
Advanced clerical workersIntermediate sales and related workers
Intermediate production and transport workersPrinting tradespersons
Mechanical engineering and automotive tradespersonsBuilding and engineering associate professionals
Wood tradespersonsTextiles and miscellaneous tradespersons
Farm managers, horticultural and skilled agricultural workers
Average annual employment growth, 2005 to 2025

Future demand for vocational education and training in NSW
27
TABLE 4: PROJECTED EMPLOYMENT GROWTH BY OCCUPATION GROUP, NSW
Average annual growth, 5 years to: 2005 2010 2015 2020 2025 Managers and administrators 8.1% 1.0% 0.5% 0.3% 0.2% Science and engineering professionals 3.6% 0.7% 0.4% 0.2% 0.0% Accounting, auditing, sales and marketing professionals 3.2% 0.7% 0.6% 0.5% 0.4% Computing and information professionals 0.3% 2.1% 1.7% 1.8% 2.0% Health professionals 1.6% 1.8% 1.5% 1.1% 0.8% Education professionals 2.2% 1.5% 0.9% 0.4% 0.0% Artists, social welfare and miscellaneous professionals 3.0% 1.3% 1.2% 1.1% 1.1% Medical and science technical officers 2.8% 0.8% 0.8% 0.3% 0.0% Building and engineering associate professionals 1.5% -0.1% -0.3% -0.5% -0.4% Business and finance associate professionals 7.6% 1.2% 1.0% 0.9% 0.9% Shop, hospitality and other sales supervisors 3.0% 1.3% 1.0% 0.8% 0.6% Enrolled nurses, welfare and other health professionals 7.2% 3.6% 2.2% 1.9% 1.6% Police officers and other associate professionals 5.8% 0.4% 0.9% 0.8% 0.7% Mechanical engineering and automotive tradespersons 0.0% 0.2% -0.1% -0.4% -0.6% Fabrication engineering, electrical, plumbing and construction tradespersons 0.6% 1.2% 0.5% 0.2% 0.2% Food tradespersons -2.0% 2.4% 0.9% 0.5% 0.3% Printing tradespersons -11.2% 0.9% -0.3% -0.6% -0.6% Wood tradespersons -4.1% 0.1% -0.2% -0.6% -0.8% Hairdressers 0.8% 1.2% 0.5% 0.3% 0.2% Textiles and miscellaneous tradespersons 1.5% 0.0% -0.3% -0.6% -0.9% Advanced clerical workers -0.8% 0.5% 0.2% -0.1% -0.3% Farm managers, horticultural and skilled agricultural workers -2.7% -1.1% -1.1% -1.3% -1.5% General clerks, keyboard operators and other clerks -2.4% 1.0% 0.6% 0.3% 0.2% Intermediate sales and related workers -2.2% 0.7% 0.1% -0.3% -0.6% Carers and aides, hospitality and other service workers 1.8% 2.1% 1.6% 1.3% 1.1% Intermediate production and transport workers 0.9% 0.3% 0.1% -0.2% -0.4% Elementary clerical, sales and service workers 3.0% 1.2% 1.2% 0.9% 0.7% Labourers and related workers -1.3% 1.0% 0.4% 0.3% 0.2%
Total 1.4% 1.0% 0.7% 0.5% 0.4%
Future demand for vocational education and training in NSW
28
4.5 REGIONAL DIMENSION
The projections of VET demand have been developed at both the Australian and New South Wales levels.
Yet within New South Wales there is likely to be some variability in training demand at the regional level, thanks to different age structures, different population growth rates, different occupational profiles for employment, as well as differences in the regional distribution of the underemployed population and the extent of training infrastructure available.
It is not possible to report VET demand at the regional level in this report, but some broad thoughts on regional employment profiles are noted here.
4.5.1 SYDNEY AND THE REGIONS
Councillor Peter Woods OAM, President of the Local Government Association of NSW, noted at a 2001 Sydney Population Forum that NSW had five distinguishable regions:
Established/global Sydney: the areas closely integrated with the global economy and the information economy – eg CBD, North Sydney, Southern Sydney, Eastern Suburbs, Chatswood and other inner ring suburbs.
Developing Sydney: Western and South Western Sydney and the Central Coast.
Post-industrial regions: the Hunter and Illawarra.
Lifestyle regions: north coast and to a growing extent, south coast of NSW.
Rural NSW: largely west of the Great Dividing Range.
The ‘Greater Sydney’ region (excluding Newcastle and Wollongong, but including Camden, Penrith and Windsor) is now home to well over 4 million people. The city (whose boundaries have gradually expanded) has grown to measure:
50,000 residents by the late 1840s;
100,000 by the mid-1860s;
500,000 by 1900;
1 million by the early 1920s;
2 million by the late 1950s;
3 million by 1990;
4 million in the 2001 census.
Its underlying national population growth rate means that Sydney’s population is likely to rise above 5 million within in the next 20 years. This will occur even with the large outflow of migrants to other States, as Sydney is still the major point of entry to Australia for overseas migrants.
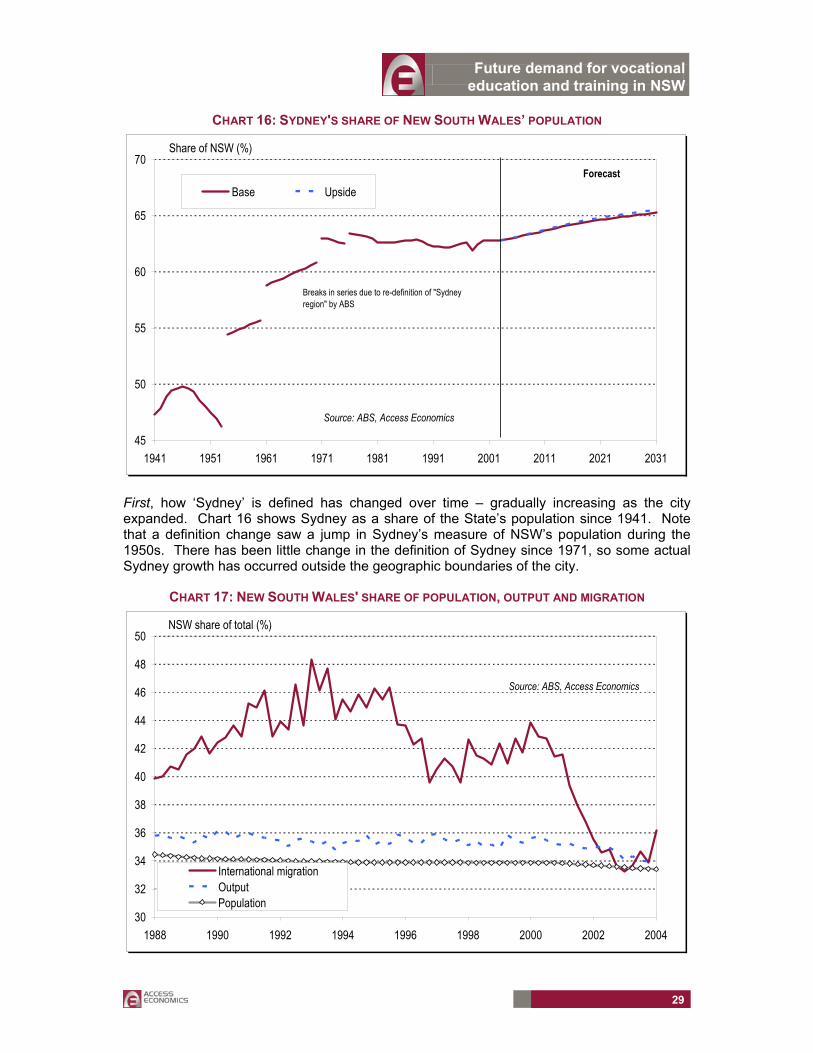
Yet despite its attractiveness for new arrivals from overseas, Sydney’s share of Australia’s population has been in decline for some time. The 1971 census found Sydney had 22.0% of Australia’s population. Thirty years on, its share was 21.1% (see Chart 16).
Future demand for vocational education and training in NSW
29
CHART 16: SYDNEY'S SHARE OF NEW SOUTH WALES’ POPULATION
45
50
55
60
65
70
1941 1951 1961 1971 1981 1991 2001 2011 2021 2031
Base Upside
Source: ABS, Access Economics
Share of NSW (%)
Forecast
Breaks in series due to re-definition of "Sydney region" by ABS
First, how ‘Sydney’ is defined has changed over time – gradually increasing as the city expanded. Chart 16 shows Sydney as a share of the State’s population since 1941. Note that a definition change saw a jump in Sydney’s measure of NSW’s population during the 1950s. There has been little change in the definition of Sydney since 1971, so some actual Sydney growth has occurred outside the geographic boundaries of the city.
CHART 17: NEW SOUTH WALES' SHARE OF POPULATION, OUTPUT AND MIGRATION
30
32
34
36
38
40
42
44
46
48
50
1988 1990 1992 1994 1996 1998 2000 2002 2004
International migrationOutputPopulation
Source: ABS, Access Economics
NSW share of total (%)
Future demand for vocational education and training in NSW
30
Second, Sydney’s high housing prices have encouraged existing residents to trade-in their Sydney home for a ‘sea-change’ lifestyle elsewhere, either in retirement or while still working. Despite the job opportunities it offers, Sydney’s higher prices have traditionally acted as a barrier to entry for people considering moving from other States.
4.5.2 POSSIBLE REGIONAL DIFFERENCES
Both demand and supply side drivers have an impact on participation – and therefore on the demand for VET at the regional level.
The discussion here starts with demand drivers, including job demand by industry and by region.
Access Economics has developed employment forecasts by industry for NSW. These are based on ABS LFS data, and follow our long-established methodology. Our approach directly links industry output (and employment) with components of final demand.
But NSW’s regions have different industry profiles than does the State as a whole. Some are more exposed to particular industries than others. And that exposure can also change over time. That is important because, as discussed above, some industries are projected to grow faster than others, which may have an impact on job growth (and therefore participation rates) by region.
As noted in the above two sections, Access Economics projects broadly faster job growth in the service sectors than in the goods sectors (farming, manufacturing and mining). Within service sectors, the fastest growth is seen in ‘luxuries’ such as cafes and restaurants and cultural services, or in demographic-driven areas such as health. Given the outlook for farming in particular, the relative industry growth profile here points to faster job gains in Sydney than in regional NSW.
As a result, and partly also in response to the supply side drivers discussed next, Access Economics projects employment growth over the next decade to be rather faster in Sydney than in regional NSW.
Moreover, these results need to be seen within the context of a State-wide and national slowdown in overall employment growth. Or, in other words, regional NSW will not merely see relatively less job gains within a fast growing State total. Rather, it will see particular weakness within an overall slowdown at the State and national levels.
On the supply side, both overall population and the supply of labour are influenced by:
Birth rates.
Migration (including interstate migration).
Life expectancy.
The changing age structure of the population.
Changing relative participation by age, gender, and cultural background.
Education levels.
The demand for labour (employment).
Given the first five of the above factors, population growth has already slowed, and it will slow further. In addition, overall participation rates are set to move down in response to the

Future demand for vocational education and training in NSW
31
retirement of the baby boomers. The next decade will therefore be a crunch point in NSW’s demographics.
Access Economics projects a worsening in participation in both Sydney and regional NSW. However, that worsening in participation will be concentrated in regional NSW (especially rural NSW), given both demand pull (its slower job growth) and supply push (its older age profile).
In turn, that points to a greater need for, but probably slower growth in, the use of VET in regional NSW than in Sydney over the next decade.
Future demand for vocational education and training in NSW
32
5. ADDITIONAL LABOUR MARKET INFLUENCES ON FUTURE TRAINING NEEDS
While net employment growth trends are a key influence, the gross number of people entering an occupation (including to replace those who retire, or leave for some other reason such as normal turnover), may be more important in assessing training requirements. These are accounted for here in developing projections for future VET.
The rate of retirement is expected to grow steadily over the next two decades as more boomers head into retirement, with rates rising from 1.7% per annum currently to 2.0% per annum in 2025. Access Economics estimates that the average rate of staff turnover across occupations which may create a training need is around 4.5% per annum.
A continuation of the trend towards greater part-time and greater casual or self-employment is also likely to be a positive for VET demand, as:
• it means that more people have to be trained for any given amount of work for part-time, and because
• casual employees may receive less on-the job-training, making them more likely to seek out the types of VET training considered in this report.
The part-time share of the workforce is projected to grow from 29% of those employed in 2005 to 39% of those employed in 2025, while the casual and self employed share of the workforce is projected to grow from 41% of those employed in 2005 to 47% of those employed in 2025.
Finally, increased workforce longevity as age cohort labour force participation rates rise will also provide a stimulus to VET demand in both the baseline and target scenarios, as longer stays in the workforce imply increased re-skilling and up-skilling needs.
5.1 RETIREMENTS
The projected net change in employment by occupation is translated into the gross number of people entering an occupation by allowing for projections of retirements and normal turnover. National workforce participation rates by age and Census data of observed retirements by age are used to estimate the rate of retirement for each occupation.
A retirement can be seen as creating a training need with a net new entrant needed to replace the retiree before accounting for any jobs growth. Given Australia’s ageing population, it will become a more important issue over time – especially over the next 20 years, a period over which most of the baby boomers will retire.
Table 5 shows projected retirement rates by occupational group over the next 20 years. In general, projected retirement rates are expected to remain steady or gradually increase over time, depending on each occupations’ current age structure and observed labour force exits from occupations over time.
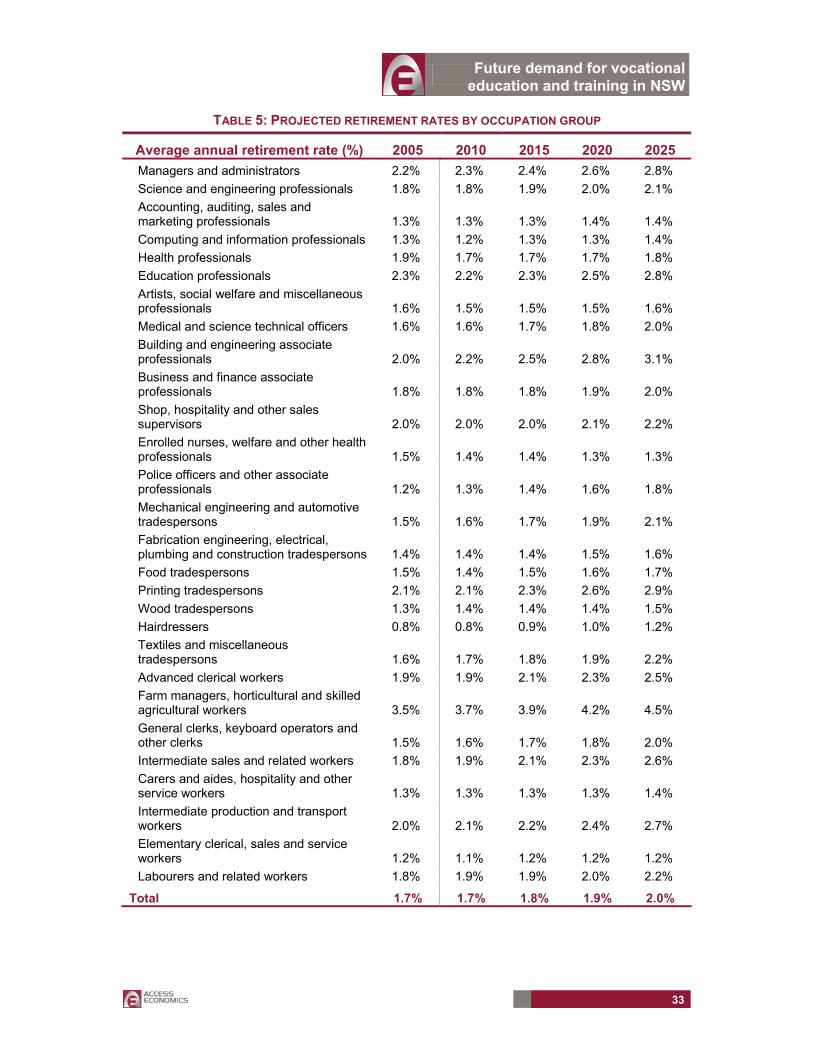
Future demand for vocational education and training in NSW
33
TABLE 5: PROJECTED RETIREMENT RATES BY OCCUPATION GROUP
Average annual retirement rate (%) 2005 2010 2015 2020 2025 Managers and administrators 2.2% 2.3% 2.4% 2.6% 2.8% Science and engineering professionals 1.8% 1.8% 1.9% 2.0% 2.1% Accounting, auditing, sales and marketing professionals 1.3% 1.3% 1.3% 1.4% 1.4% Computing and information professionals 1.3% 1.2% 1.3% 1.3% 1.4% Health professionals 1.9% 1.7% 1.7% 1.7% 1.8% Education professionals 2.3% 2.2% 2.3% 2.5% 2.8% Artists, social welfare and miscellaneous professionals 1.6% 1.5% 1.5% 1.5% 1.6% Medical and science technical officers 1.6% 1.6% 1.7% 1.8% 2.0% Building and engineering associate professionals 2.0% 2.2% 2.5% 2.8% 3.1% Business and finance associate professionals 1.8% 1.8% 1.8% 1.9% 2.0% Shop, hospitality and other sales supervisors 2.0% 2.0% 2.0% 2.1% 2.2% Enrolled nurses, welfare and other health professionals 1.5% 1.4% 1.4% 1.3% 1.3% Police officers and other associate professionals 1.2% 1.3% 1.4% 1.6% 1.8% Mechanical engineering and automotive tradespersons 1.5% 1.6% 1.7% 1.9% 2.1% Fabrication engineering, electrical, plumbing and construction tradespersons 1.4% 1.4% 1.4% 1.5% 1.6% Food tradespersons 1.5% 1.4% 1.5% 1.6% 1.7% Printing tradespersons 2.1% 2.1% 2.3% 2.6% 2.9% Wood tradespersons 1.3% 1.4% 1.4% 1.4% 1.5% Hairdressers 0.8% 0.8% 0.9% 1.0% 1.2% Textiles and miscellaneous tradespersons 1.6% 1.7% 1.8% 1.9% 2.2% Advanced clerical workers 1.9% 1.9% 2.1% 2.3% 2.5% Farm managers, horticultural and skilled agricultural workers 3.5% 3.7% 3.9% 4.2% 4.5% General clerks, keyboard operators and other clerks 1.5% 1.6% 1.7% 1.8% 2.0% Intermediate sales and related workers 1.8% 1.9% 2.1% 2.3% 2.6% Carers and aides, hospitality and other service workers 1.3% 1.3% 1.3% 1.3% 1.4% Intermediate production and transport workers 2.0% 2.1% 2.2% 2.4% 2.7% Elementary clerical, sales and service workers 1.2% 1.1% 1.2% 1.2% 1.2% Labourers and related workers 1.8% 1.9% 1.9% 2.0% 2.2%
Total 1.7% 1.7% 1.8% 1.9% 2.0%
Future demand for vocational education and training in NSW
34
The greatest replacement need pressure due to retirements is expected to come from farmers, education professionals, building and engineering associate professionals, teachers, general managers and printing tradespersons.
Across all occupations, the expected retirement rate is expected to increase from 1.7% per annum currently to 2.0% per annum in 2025.
5.2 OTHER STAFF TURNOVER
People leave their occupations for many reasons other than retirement, with some of these having implications for training. Staff turnover may reflect:
movement to a role with a different skill set (requiring training);
movement to another occupation but using the same skills (not requiring training); or
time out of the workforce (perhaps requiring re-training on return).
Some turnover may be involuntary. Indeed, it is possible that a greater supply of trained workers may create some turnover, as – at the margin – businesses may be more likely to dismiss some existing employees when there is a larger pool of newly trained workers from whom replacements can be hired. Data on staff turnover is obtained from the ABS Labour Mobility survey. Some of this turnover will be associated with a training need while much will not. From a training perspective, what would be the ideal measure of replacement demand to apply?
Those who are moving between jobs but staying within the same occupational category (based on the categories shown in Table 6) are seen as likely to already have the skill requirements for their new job. They will continue to have up-skilling needs over time, but are unlikely to need additional training related to their new job.
Looking at changes between occupations, in the training context, one would like to ascertain what proportion of new entrants to an occupation currently do not have the skills for that occupation. That will imply a different set of VET course requirements to cater for the changing occupational structure of employment. A labour market proxy for those who do have the skills for that occupation may be those new entrants who have some time previously worked in the same or a very similar occupation. Unfortunately, there is no data source which informs us if people entering an occupation have previously worked in that occupation:
An appropriate measure of replacement to be used in the context of estimating demand for training could be replacement for those retiring, moving to unemployment or moving to other occupations, less those who are entering the occupation from either the same skill level or a higher skill level.
Essentially, this amounts to a measure similar to gross replacement demand, but one which nets off the estimated replacement for training that share of positions filled by those moving from the same skill level or higher skill level occupations. Intuitively, this suggests there may be a training need for those entering an occupation from a lower skill level, but when moving between occupations at the same skill level, or moving from a higher skill, that does not necessarily imply a training demand.
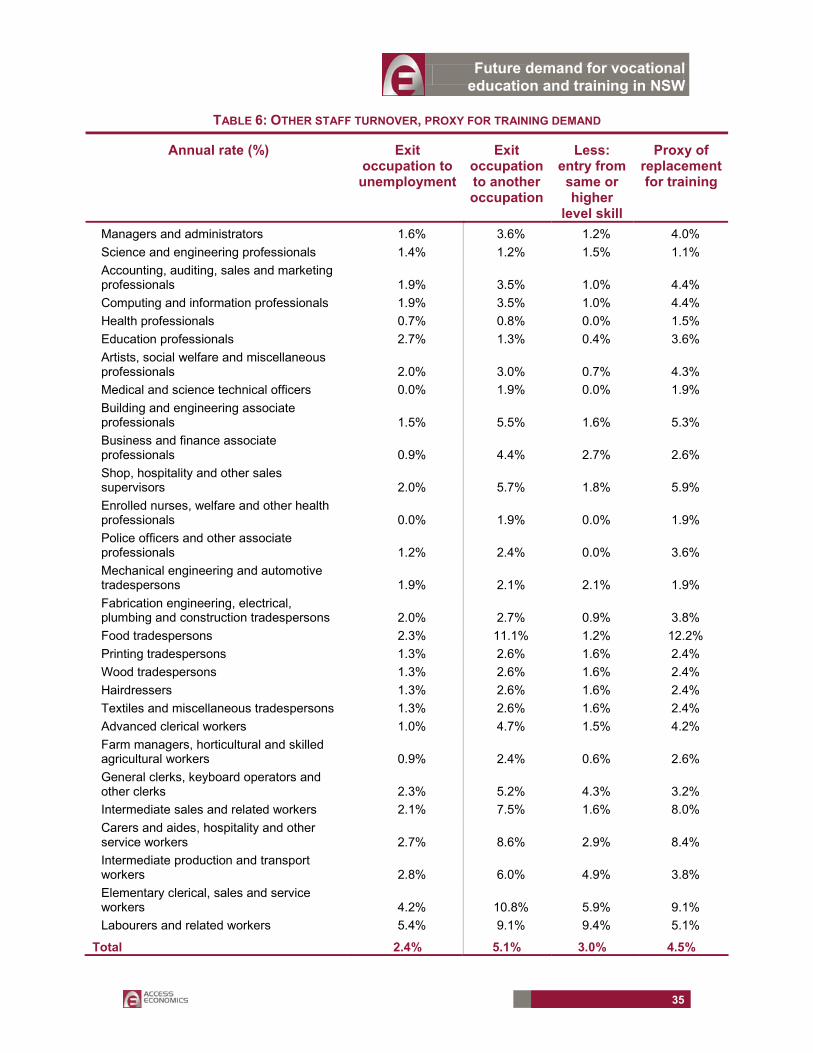
Future demand for vocational education and training in NSW
35
TABLE 6: OTHER STAFF TURNOVER, PROXY FOR TRAINING DEMAND
Annual rate (%) Exit occupation to
unemployment
Exit occupation to another occupation
Less: entry from same or higher
level skill
Proxy of replacement for training
Managers and administrators 1.6% 3.6% 1.2% 4.0% Science and engineering professionals 1.4% 1.2% 1.5% 1.1% Accounting, auditing, sales and marketing professionals 1.9% 3.5% 1.0% 4.4% Computing and information professionals 1.9% 3.5% 1.0% 4.4% Health professionals 0.7% 0.8% 0.0% 1.5% Education professionals 2.7% 1.3% 0.4% 3.6% Artists, social welfare and miscellaneous professionals 2.0% 3.0% 0.7% 4.3% Medical and science technical officers 0.0% 1.9% 0.0% 1.9% Building and engineering associate professionals 1.5% 5.5% 1.6% 5.3% Business and finance associate professionals 0.9% 4.4% 2.7% 2.6% Shop, hospitality and other sales supervisors 2.0% 5.7% 1.8% 5.9% Enrolled nurses, welfare and other health professionals 0.0% 1.9% 0.0% 1.9% Police officers and other associate professionals 1.2% 2.4% 0.0% 3.6% Mechanical engineering and automotive tradespersons 1.9% 2.1% 2.1% 1.9% Fabrication engineering, electrical, plumbing and construction tradespersons 2.0% 2.7% 0.9% 3.8% Food tradespersons 2.3% 11.1% 1.2% 12.2% Printing tradespersons 1.3% 2.6% 1.6% 2.4% Wood tradespersons 1.3% 2.6% 1.6% 2.4% Hairdressers 1.3% 2.6% 1.6% 2.4% Textiles and miscellaneous tradespersons 1.3% 2.6% 1.6% 2.4% Advanced clerical workers 1.0% 4.7% 1.5% 4.2% Farm managers, horticultural and skilled agricultural workers 0.9% 2.4% 0.6% 2.6% General clerks, keyboard operators and other clerks 2.3% 5.2% 4.3% 3.2% Intermediate sales and related workers 2.1% 7.5% 1.6% 8.0% Carers and aides, hospitality and other service workers 2.7% 8.6% 2.9% 8.4% Intermediate production and transport workers 2.8% 6.0% 4.9% 3.8% Elementary clerical, sales and service workers 4.2% 10.8% 5.9% 9.1% Labourers and related workers 5.4% 9.1% 9.4% 5.1%
Total 2.4% 5.1% 3.0% 4.5%
Future demand for vocational education and training in NSW
36
For example, a plumber who decides to open his own business and become a manager may well require some training in business administration. However, if that same person decides to close his business and go back to working for someone else as a plumber, he does not necessarily require further training as a plumber.
Of course, there will be many exceptions, where people moving up in skill level don’t require training, or those moving down in skill level do require training. But such a measure may be closer to the mark as an estimate of training demand than other options.
Table 6 suggests that the average rate of staff turnover across occupations which may create a training need is around 4.5% a year. As one might expect, turnover tends to be higher for the lower skilled occupations, while for the highest skill occupations, there are relatively fewer people leaving for reasons other than retirement.
For the VET projections which follow, this turnover estimate is not equated one-for-one with training needs, but combined with measures of actual VET undertaken.
5.3 PART-TIME SHARE OF THE WORKFORCE
The part-time/full-time split of employment is subject to cyclical and trend influences:
The trend over the last decade and more has been for a greater share of work to be performed on a part-time or casual basis.
As a cyclical counter to this trend towards part-time, much of the strong job growth Australia has experienced of late has been in full-time jobs, consistent both with being at the peak of the employment cycle in 2004-05, and the fact recent job gains have been centred on the construction industry and (until recently) associated manufacturing sectors.
Access Economics’ labour market forecasts are for the share of total jobs which are part-time to generally continue to rise over the forecast period, save for cyclical periods when construction and related activities are strong. Projections by broad occupational group are shown in Chart 18.
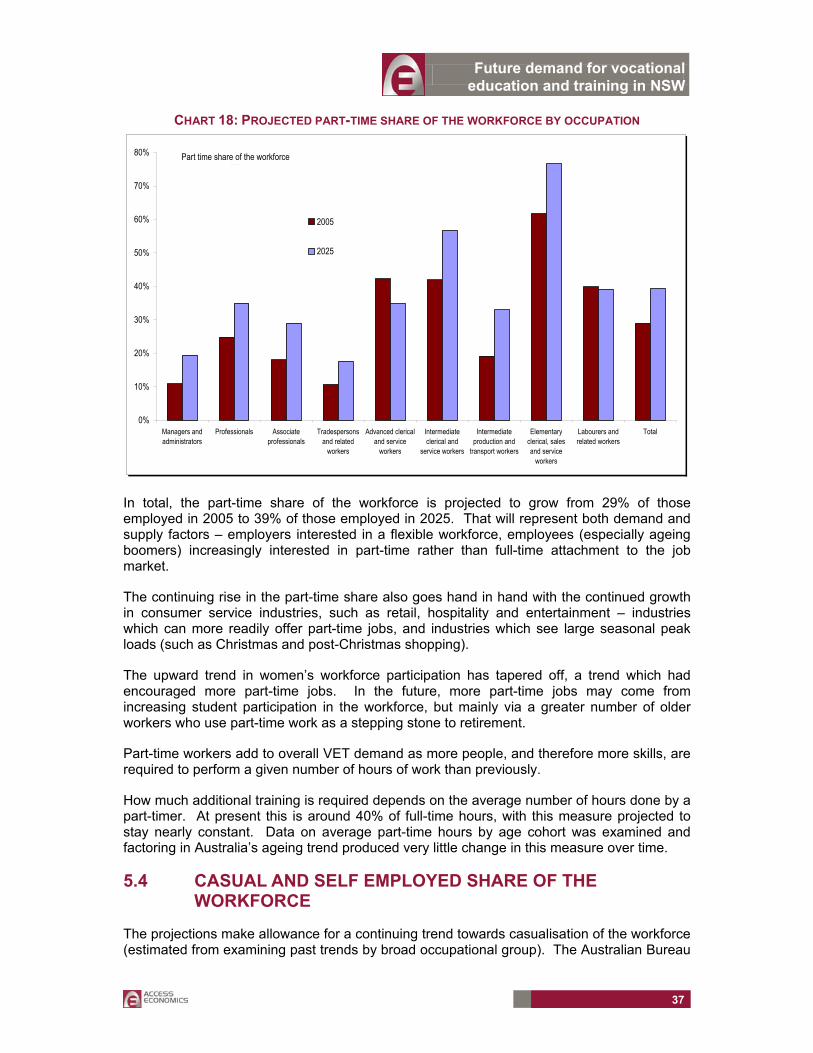
Future demand for vocational education and training in NSW
37
CHART 18: PROJECTED PART-TIME SHARE OF THE WORKFORCE BY OCCUPATION
0%
10%
20%
30%
40%
50%
60%
70%
80%
Managers andadministrators
Professionals Associateprofessionals
Tradespersonsand related
workers
Advanced clericaland service
workers
Intermediateclerical and
service workers
Intermediateproduction and
transport workers
Elementaryclerical, salesand service
workers
Labourers andrelated workers
Total
2005
2025
Part time share of the workforce (%)
In total, the part-time share of the workforce is projected to grow from 29% of those employed in 2005 to 39% of those employed in 2025. That will represent both demand and supply factors – employers interested in a flexible workforce, employees (especially ageing boomers) increasingly interested in part-time rather than full-time attachment to the job market.
The continuing rise in the part-time share also goes hand in hand with the continued growth in consumer service industries, such as retail, hospitality and entertainment – industries which can more readily offer part-time jobs, and industries which see large seasonal peak loads (such as Christmas and post-Christmas shopping).
The upward trend in women’s workforce participation has tapered off, a trend which had encouraged more part-time jobs. In the future, more part-time jobs may come from increasing student participation in the workforce, but mainly via a greater number of older workers who use part-time work as a stepping stone to retirement.
Part-time workers add to overall VET demand as more people, and therefore more skills, are required to perform a given number of hours of work than previously.
How much additional training is required depends on the average number of hours done by a part-timer. At present this is around 40% of full-time hours, with this measure projected to stay nearly constant. Data on average part-time hours by age cohort was examined and factoring in Australia’s ageing trend produced very little change in this measure over time.
5.4 CASUAL AND SELF EMPLOYED SHARE OF THE WORKFORCE
The projections make allowance for a continuing trend towards casualisation of the workforce (estimated from examining past trends by broad occupational group). The Australian Bureau
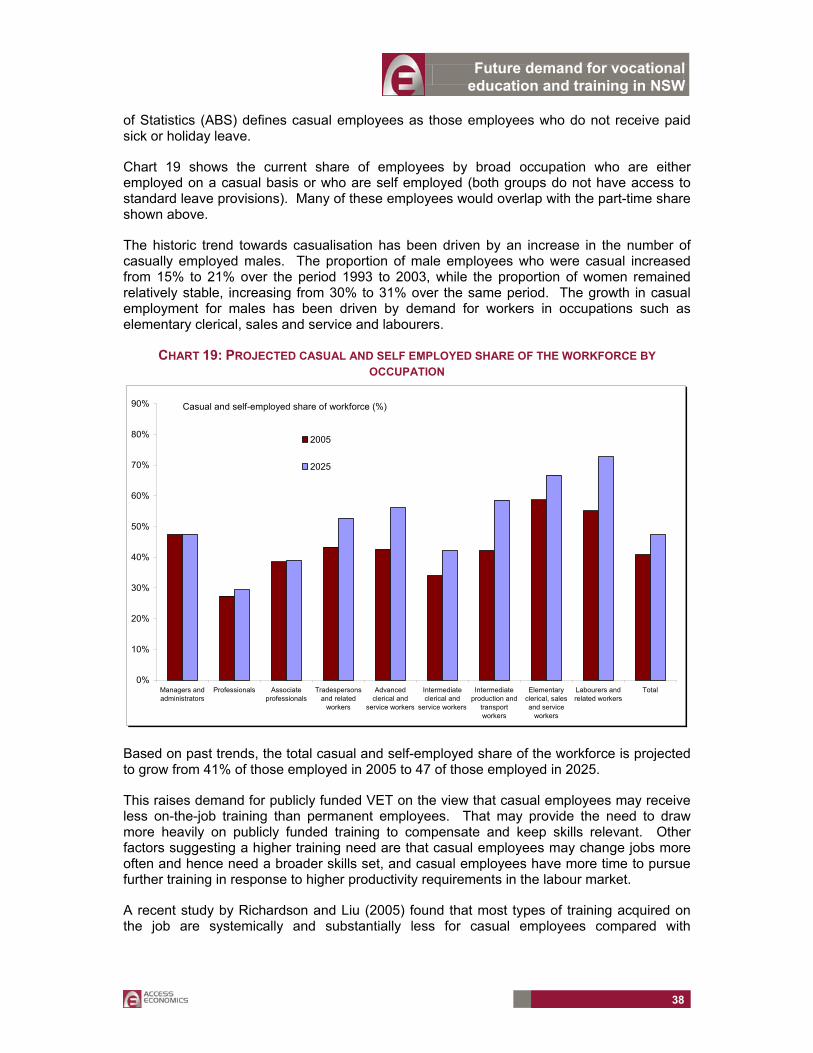
Future demand for vocational education and training in NSW
38
of Statistics (ABS) defines casual employees as those employees who do not receive paid sick or holiday leave.
Chart 19 shows the current share of employees by broad occupation who are either employed on a casual basis or who are self employed (both groups do not have access to standard leave provisions). Many of these employees would overlap with the part-time share shown above.
The historic trend towards casualisation has been driven by an increase in the number of casually employed males. The proportion of male employees who were casual increased from 15% to 21% over the period 1993 to 2003, while the proportion of women remained relatively stable, increasing from 30% to 31% over the same period. The growth in casual employment for males has been driven by demand for workers in occupations such as elementary clerical, sales and service and labourers.
CHART 19: PROJECTED CASUAL AND SELF EMPLOYED SHARE OF THE WORKFORCE BY OCCUPATION
0%
10%
20%
30%
40%
50%
60%
70%
80%
90%
Managers andadministrators
Professionals Associateprofessionals
Tradespersonsand related
workers
Advancedclerical and
service workers
Intermediateclerical and
service workers
Intermediateproduction and
transportworkers
Elementaryclerical, salesand service
workers
Labourers andrelated workers
Total
2005
2025
Casual and self-employed share of workforce (%)
Based on past trends, the total casual and self-employed share of the workforce is projected to grow from 41% of those employed in 2005 to 47 of those employed in 2025.
This raises demand for publicly funded VET on the view that casual employees may receive less on-the-job training than permanent employees. That may provide the need to draw more heavily on publicly funded training to compensate and keep skills relevant. Other factors suggesting a higher training need are that casual employees may change jobs more often and hence need a broader skills set, and casual employees have more time to pursue further training in response to higher productivity requirements in the labour market.
A recent study by Richardson and Liu (2005) found that most types of training acquired on the job are systemically and substantially less for casual employees compared with
Future demand for vocational education and training in NSW
39
permanent employees. This increases the likelihood of casual workers drawing upon publicly funded training.
5.5 PRODUCTIVITY
Allowance is made in the modelling for movement to a higher rate of productivity growth to drive additional training needs.
Productivity growth assumptions used in the projections are:
1.75% per annum for the baseline scenario (which is seen as broadly consistent with recent experience in Australia); and
2% per annum for the target scenario.
Note that productivity growth only has an effect on additional training needs in the target scenario, as continuing the same rate of productivity growth (as in the baseline scenario) is consistent with current rates of VET participation for up-skilling.
5.6 WORKFORCE LONGEVITY
Allowance is made in the modelling for employees to have longer working lives. As labour force participation increases among older age cohorts, so will the average working life, which implies some additional continuing training in order to keep skills relevant.
This effect comes into play in both the baseline and target scenarios. Based on projections for labour force participation rates as noted earlier in this chapter for the baseline scenario, and as outlined in Chapter 8 for the target scenario, the average working life of an employee by 2025 may be:
3.3% longer in the baseline scenario; and
6.6% longer in the target scenario (thanks to higher labour force participation rates among older age cohorts).
5.7 SUPPLY SIDE INFLUENCES ON VET ACTIVITY
A variety of VET policy initiatives have been implemented over recent years which have been significant in encouraging greater participation in publicly funded VET. These include the New Apprenticeships system, the implementation of National Training packages, development of the Australian Qualifications Framework, and user choice policy.
While it is often difficult to attribute specific VET activity to specific policy initiatives, collectively such initiatives were successful in raising participation in publicly funded VET well beyond that which would be explained by workforce developments, as least over the 1990s.
Further increases in VET participation may arise as a result of policy initiatives, particularly as training packages penetrate non-traditional industry sectors. However, there has also been an element of ‘catch-up’ in policy driven VET activity in recent years (workers upgrading their qualifications after a long period without formal training).
That same intensity of ‘catch-up’ cannot be expected to be maintained to the same degree in the future.

Future demand for vocational education and training in NSW
40
Indeed, it may have already begun to ease back. The very modest growth performance of VET in recent years suggests that policy initiatives are no longer having a powerful influence in lifting participation. Given this levelling out in activity, and the fact that further policy initiatives are difficult to project, they are absent from the baseline forecasts (though Chapter 8 discusses some possible VET policy initiatives in the target scenario).
Future demand for vocational education and training in NSW
41
6. BASELINE SCENARIO – PROJECTED VET ACTIVITY
The projections for VET activity in the baseline or IGR scenario are for overall modest growth. Over the 20 year period (2005 to 2025) for New South Wales the projections are for:
– average growth in the number of VET students of 0.98% per annum; and
– average growth in the number of VET hours of 1.08% per annum.
That is faster growth for student numbers than has been achieved recently, and faster than expected employment growth, but notably slower than VET activity growth over the 1990s.
A declining trend in overall employment growth is the key driver of more moderate VET demand over time. In addition, a cyclical downturn in demand growth for trade skills over the short term is another negative.
Projections for the composition of VET activity are for a shift towards continuing training and catering for re-entrants, at the expense of New Apprenticeships. Relatively little workforce growth means relatively less need for the latter. That also means the age profile of VET students will change over time. Overall, some 39% of VET students are projected to be under 25 in 2025, compared with 44% in 2004.
This chapter reports projected VET activity under the baseline or IGR scenario. The primary focus is on projections for New South Wales, with projections for Australia as a whole shown as a point of comparison in some cases.
Chart 20 shows projected growth in the number of VET students over time in terms of five year average growth rates. The period to 2005 is historical (though an Access Economics estimate for activity in 2005 is used, as VET activity data for 2005 was not released at the time of preparing this anaysis).
Even with some recovery in VET student numbers factored in for 2005, the five year average growth rate for New South Wales is still a notable negative.
The forecasts suggest the period to 2010 may also be a modest one in terms of growth in the number of VET students in New South Wales. In large part, that reflects 2005 (as the starting point for this period) being a cyclical high point in terms of overall employment growth, with the rate of employment growth a key driver of overall VET demand. For VET demand, the moderation now underway in housing construction from a cyclical high in late 2004 is also a negative in the early part of the forecast period.
Beyond the initial downturn in the forecast period, employment growth and VET demand recover but then gradually moderate over time. That gradual decline is consistent with the profile shown in Chart 11 earlier of moderating employment growth over time.
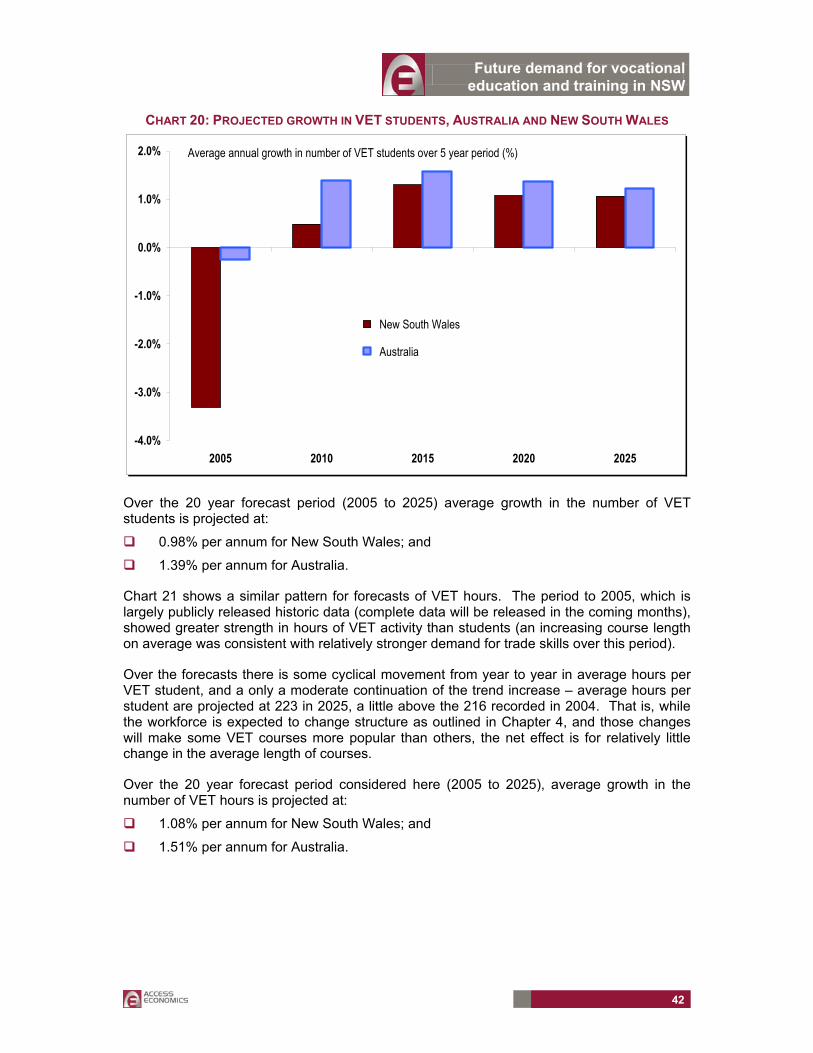
Future demand for vocational education and training in NSW
42
CHART 20: PROJECTED GROWTH IN VET STUDENTS, AUSTRALIA AND NEW SOUTH WALES
-4.0%
-3.0%
-2.0%
-1.0%
0.0%
1.0%
2.0%
2005 2010 2015 2020 2025
New South Wales
Australia
Average annual growth in number of VET students over 5 year period (%)
Over the 20 year forecast period (2005 to 2025) average growth in the number of VET students is projected at:
0.98% per annum for New South Wales; and
1.39% per annum for Australia.
Chart 21 shows a similar pattern for forecasts of VET hours. The period to 2005, which is largely publicly released historic data (complete data will be released in the coming months), showed greater strength in hours of VET activity than students (an increasing course length on average was consistent with relatively stronger demand for trade skills over this period).
Over the forecasts there is some cyclical movement from year to year in average hours per VET student, and a only a moderate continuation of the trend increase – average hours per student are projected at 223 in 2025, a little above the 216 recorded in 2004. That is, while the workforce is expected to change structure as outlined in Chapter 4, and those changes will make some VET courses more popular than others, the net effect is for relatively little change in the average length of courses.
Over the 20 year forecast period considered here (2005 to 2025), average growth in the number of VET hours is projected at:
1.08% per annum for New South Wales; and
1.51% per annum for Australia.
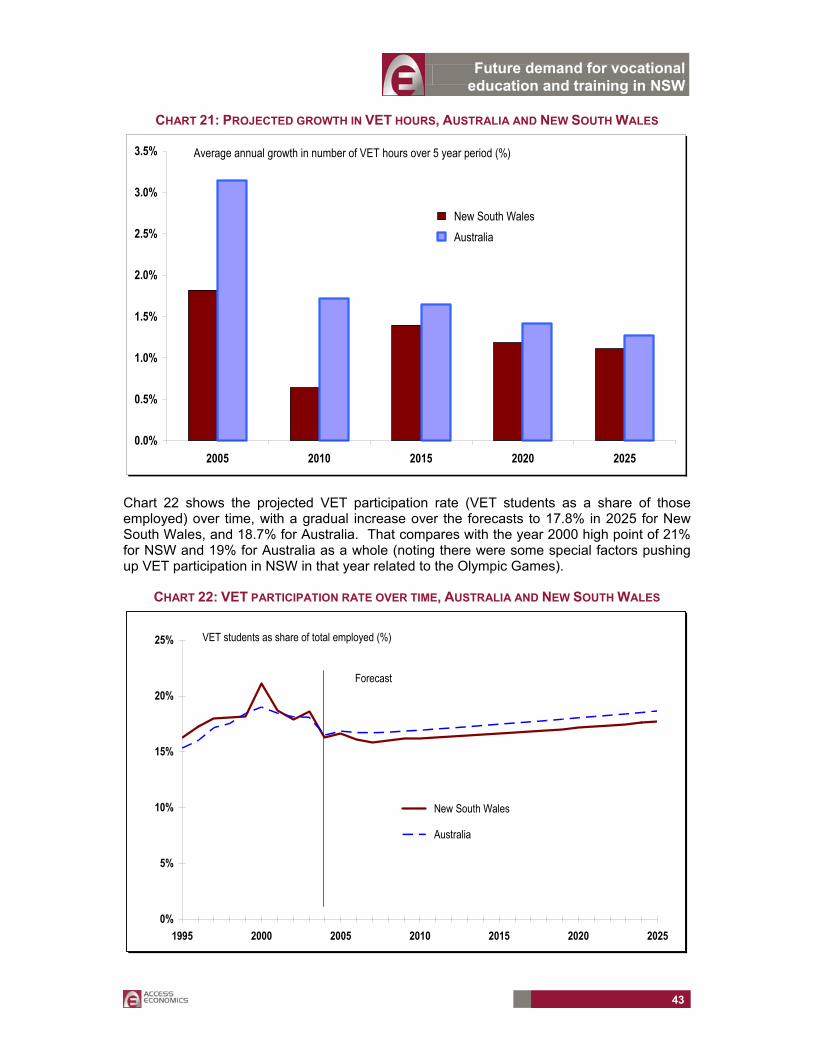
Future demand for vocational education and training in NSW
43
CHART 21: PROJECTED GROWTH IN VET HOURS, AUSTRALIA AND NEW SOUTH WALES
0.0%
0.5%
1.0%
1.5%
2.0%
2.5%
3.0%
3.5%
2005 2010 2015 2020 2025
New South Wales Australia
Average annual growth in number of VET hours over 5 year period (%)
Chart 22 shows the projected VET participation rate (VET students as a share of those employed) over time, with a gradual increase over the forecasts to 17.8% in 2025 for New South Wales, and 18.7% for Australia. That compares with the year 2000 high point of 21% for NSW and 19% for Australia as a whole (noting there were some special factors pushing up VET participation in NSW in that year related to the Olympic Games).
CHART 22: VET PARTICIPATION RATE OVER TIME, AUSTRALIA AND NEW SOUTH WALES
0%
5%
10%
15%
20%
25%
1995 2000 2005 2010 2015 2020 2025
New South Wales
Australia
VET students as share of total employed (%)
Forecast
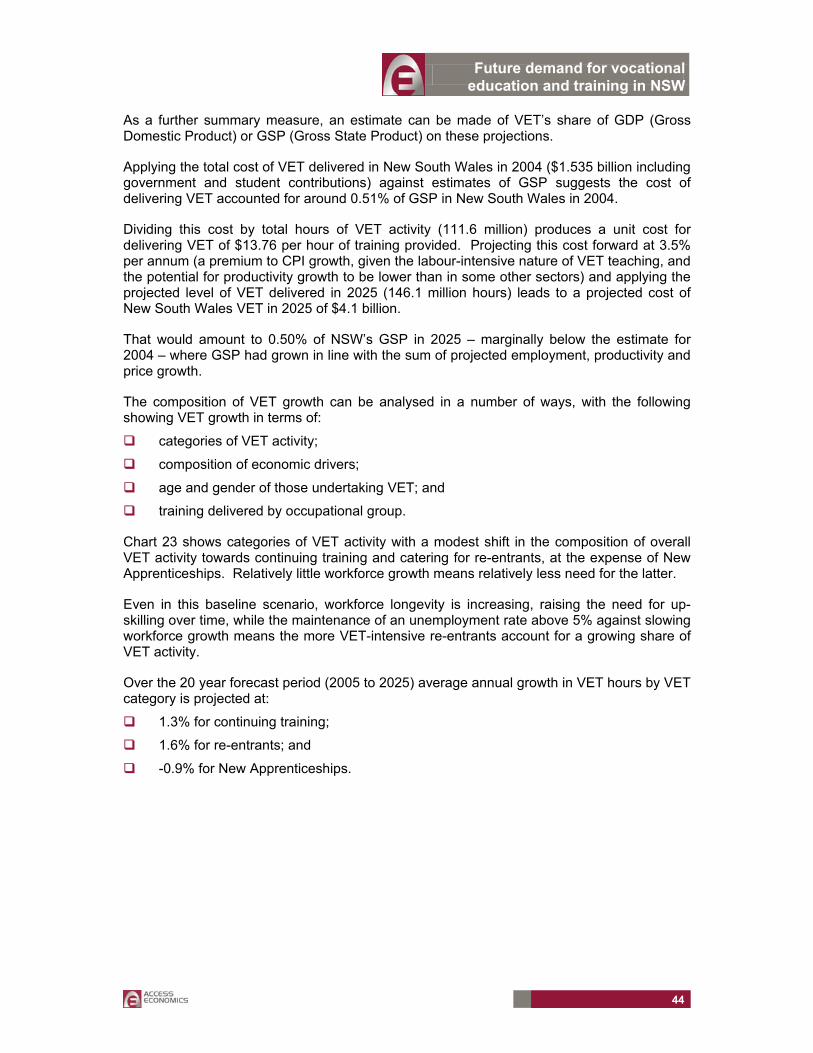
Future demand for vocational education and training in NSW
44
As a further summary measure, an estimate can be made of VET’s share of GDP (Gross Domestic Product) or GSP (Gross State Product) on these projections.
Applying the total cost of VET delivered in New South Wales in 2004 ($1.535 billion including government and student contributions) against estimates of GSP suggests the cost of delivering VET accounted for around 0.51% of GSP in New South Wales in 2004.
Dividing this cost by total hours of VET activity (111.6 million) produces a unit cost for delivering VET of $13.76 per hour of training provided. Projecting this cost forward at 3.5% per annum (a premium to CPI growth, given the labour-intensive nature of VET teaching, and the potential for productivity growth to be lower than in some other sectors) and applying the projected level of VET delivered in 2025 (146.1 million hours) leads to a projected cost of New South Wales VET in 2025 of $4.1 billion.
That would amount to 0.50% of NSW’s GSP in 2025 – marginally below the estimate for 2004 – where GSP had grown in line with the sum of projected employment, productivity and price growth.
The composition of VET growth can be analysed in a number of ways, with the following showing VET growth in terms of:
categories of VET activity;
composition of economic drivers;
age and gender of those undertaking VET; and
training delivered by occupational group.
Chart 23 shows categories of VET activity with a modest shift in the composition of overall VET activity towards continuing training and catering for re-entrants, at the expense of New Apprenticeships. Relatively little workforce growth means relatively less need for the latter.
Even in this baseline scenario, workforce longevity is increasing, raising the need for up-skilling over time, while the maintenance of an unemployment rate above 5% against slowing workforce growth means the more VET-intensive re-entrants account for a growing share of VET activity.
Over the 20 year forecast period (2005 to 2025) average annual growth in VET hours by VET category is projected at:
1.3% for continuing training;
1.6% for re-entrants; and
-0.9% for New Apprenticeships.
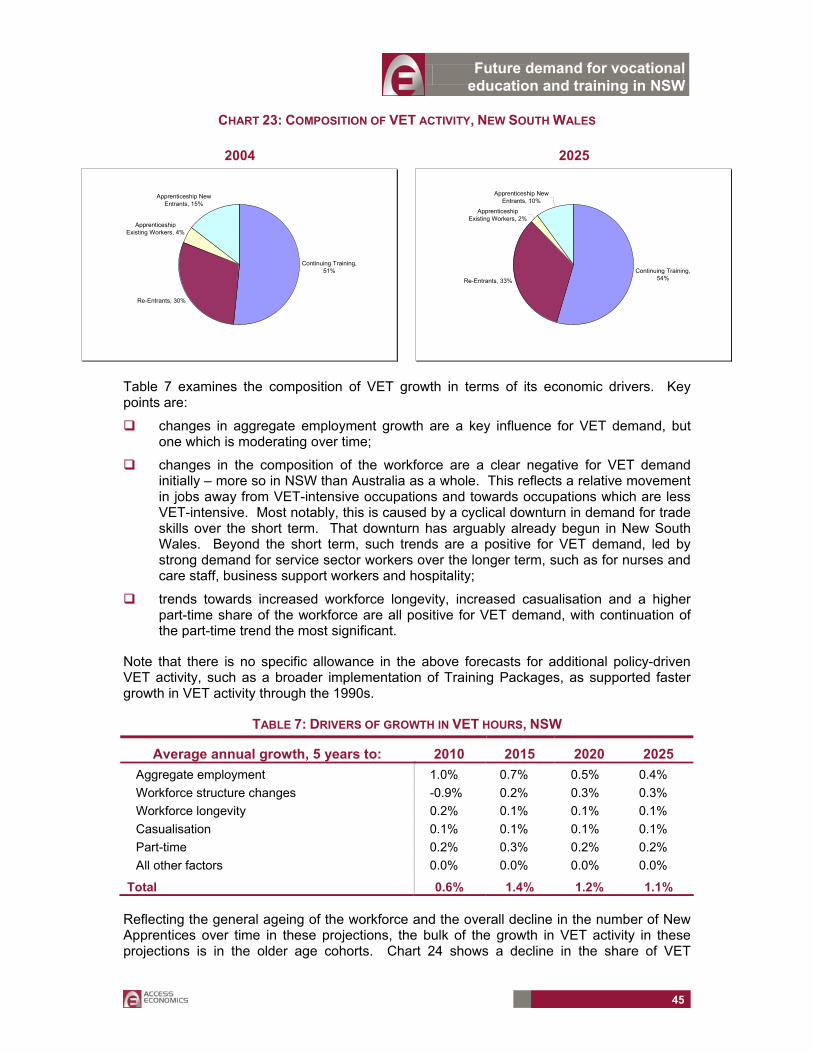
Future demand for vocational education and training in NSW
45
CHART 23: COMPOSITION OF VET ACTIVITY, NEW SOUTH WALES
Table 7 examines the composition of VET growth in terms of its economic drivers. Key points are:
changes in aggregate employment growth are a key influence for VET demand, but one which is moderating over time;
changes in the composition of the workforce are a clear negative for VET demand initially – more so in NSW than Australia as a whole. This reflects a relative movement in jobs away from VET-intensive occupations and towards occupations which are less VET-intensive. Most notably, this is caused by a cyclical downturn in demand for trade skills over the short term. That downturn has arguably already begun in New South Wales. Beyond the short term, such trends are a positive for VET demand, led by strong demand for service sector workers over the longer term, such as for nurses and care staff, business support workers and hospitality;
trends towards increased workforce longevity, increased casualisation and a higher part-time share of the workforce are all positive for VET demand, with continuation of the part-time trend the most significant.
Note that there is no specific allowance in the above forecasts for additional policy-driven VET activity, such as a broader implementation of Training Packages, as supported faster growth in VET activity through the 1990s.
TABLE 7: DRIVERS OF GROWTH IN VET HOURS, NSW
Average annual growth, 5 years to: 2010 2015 2020 2025 Aggregate employment 1.0% 0.7% 0.5% 0.4% Workforce structure changes -0.9% 0.2% 0.3% 0.3% Workforce longevity 0.2% 0.1% 0.1% 0.1% Casualisation 0.1% 0.1% 0.1% 0.1% Part-time 0.2% 0.3% 0.2% 0.2% All other factors 0.0% 0.0% 0.0% 0.0%
Total 0.6% 1.4% 1.2% 1.1%
Reflecting the general ageing of the workforce and the overall decline in the number of New Apprentices over time in these projections, the bulk of the growth in VET activity in these projections is in the older age cohorts. Chart 24 shows a decline in the share of VET
2004
Continuing Training, 51%
Re-Entrants, 30%
Apprenticeship Existing Workers, 4%
Apprenticeship New Entrants, 15%
2025
Continuing Training, 54%Re-Entrants, 33%
Apprenticeship Existing Workers, 2%
Apprenticeship New Entrants, 10%
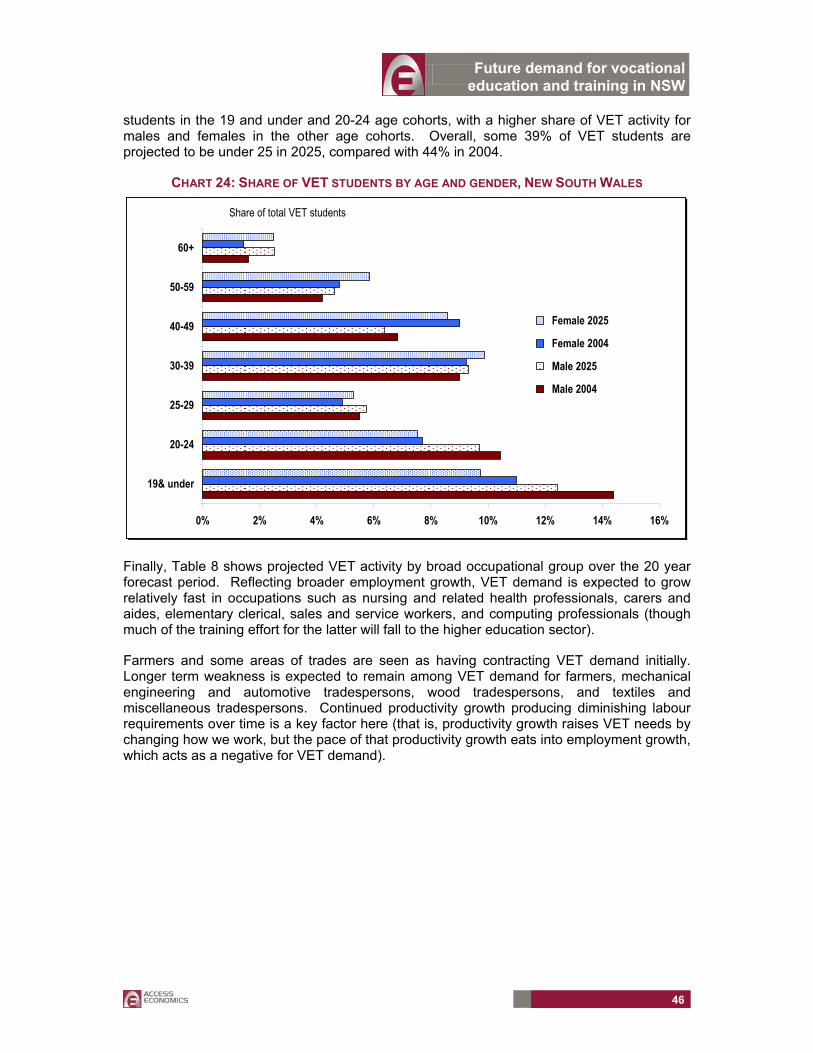
Future demand for vocational education and training in NSW
46
students in the 19 and under and 20-24 age cohorts, with a higher share of VET activity for males and females in the other age cohorts. Overall, some 39% of VET students are projected to be under 25 in 2025, compared with 44% in 2004.
CHART 24: SHARE OF VET STUDENTS BY AGE AND GENDER, NEW SOUTH WALES
0% 2% 4% 6% 8% 10% 12% 14% 16%
19& under
20-24
25-29
30-39
40-49
50-59
60+
Female 2025
Female 2004
Male 2025
Male 2004
Share of total VET students
Finally, Table 8 shows projected VET activity by broad occupational group over the 20 year forecast period. Reflecting broader employment growth, VET demand is expected to grow relatively fast in occupations such as nursing and related health professionals, carers and aides, elementary clerical, sales and service workers, and computing professionals (though much of the training effort for the latter will fall to the higher education sector).
Farmers and some areas of trades are seen as having contracting VET demand initially. Longer term weakness is expected to remain among VET demand for farmers, mechanical engineering and automotive tradespersons, wood tradespersons, and textiles and miscellaneous tradespersons. Continued productivity growth producing diminishing labour requirements over time is a key factor here (that is, productivity growth raises VET needs by changing how we work, but the pace of that productivity growth eats into employment growth, which acts as a negative for VET demand).
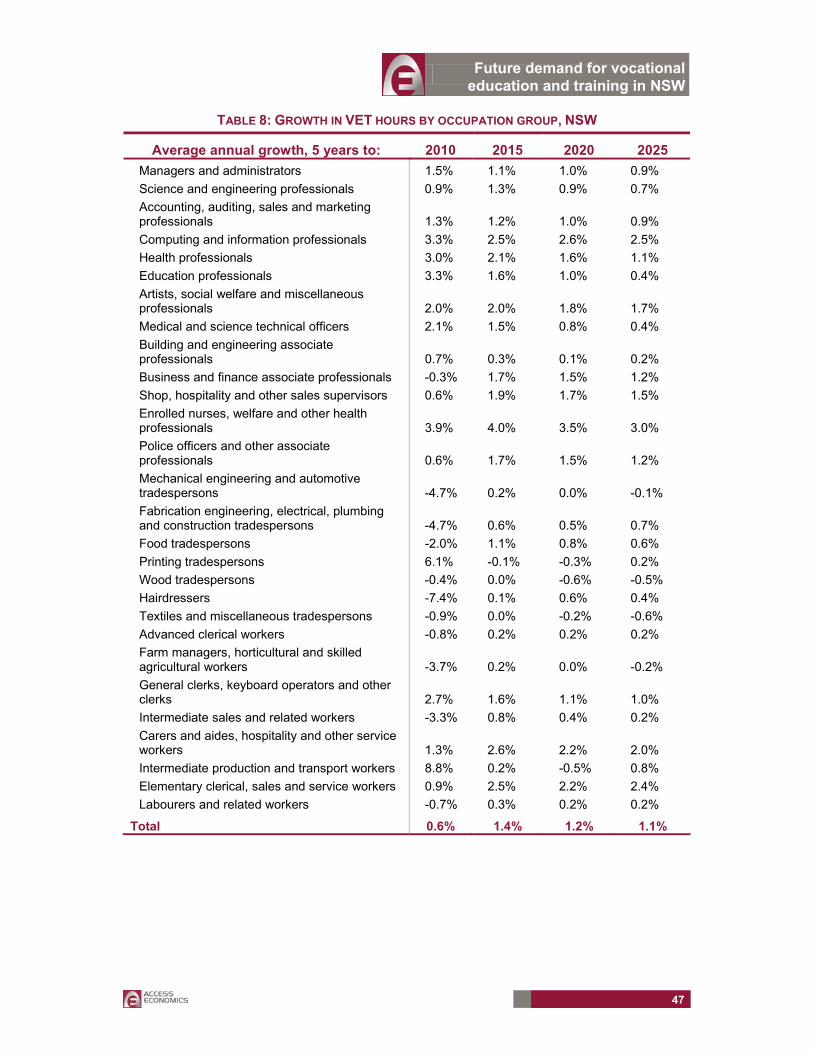
Future demand for vocational education and training in NSW
47
TABLE 8: GROWTH IN VET HOURS BY OCCUPATION GROUP, NSW
Average annual growth, 5 years to: 2010 2015 2020 2025 Managers and administrators 1.5% 1.1% 1.0% 0.9% Science and engineering professionals 0.9% 1.3% 0.9% 0.7% Accounting, auditing, sales and marketing professionals 1.3% 1.2% 1.0% 0.9% Computing and information professionals 3.3% 2.5% 2.6% 2.5% Health professionals 3.0% 2.1% 1.6% 1.1% Education professionals 3.3% 1.6% 1.0% 0.4% Artists, social welfare and miscellaneous professionals 2.0% 2.0% 1.8% 1.7% Medical and science technical officers 2.1% 1.5% 0.8% 0.4% Building and engineering associate professionals 0.7% 0.3% 0.1% 0.2% Business and finance associate professionals -0.3% 1.7% 1.5% 1.2% Shop, hospitality and other sales supervisors 0.6% 1.9% 1.7% 1.5% Enrolled nurses, welfare and other health professionals 3.9% 4.0% 3.5% 3.0% Police officers and other associate professionals 0.6% 1.7% 1.5% 1.2% Mechanical engineering and automotive tradespersons -4.7% 0.2% 0.0% -0.1% Fabrication engineering, electrical, plumbing and construction tradespersons -4.7% 0.6% 0.5% 0.7% Food tradespersons -2.0% 1.1% 0.8% 0.6% Printing tradespersons 6.1% -0.1% -0.3% 0.2% Wood tradespersons -0.4% 0.0% -0.6% -0.5% Hairdressers -7.4% 0.1% 0.6% 0.4% Textiles and miscellaneous tradespersons -0.9% 0.0% -0.2% -0.6% Advanced clerical workers -0.8% 0.2% 0.2% 0.2% Farm managers, horticultural and skilled agricultural workers -3.7% 0.2% 0.0% -0.2% General clerks, keyboard operators and other clerks 2.7% 1.6% 1.1% 1.0% Intermediate sales and related workers -3.3% 0.8% 0.4% 0.2% Carers and aides, hospitality and other service workers 1.3% 2.6% 2.2% 2.0% Intermediate production and transport workers 8.8% 0.2% -0.5% 0.8% Elementary clerical, sales and service workers 0.9% 2.5% 2.2% 2.4% Labourers and related workers -0.7% 0.3% 0.2% 0.2%
Total 0.6% 1.4% 1.2% 1.1%

Future demand for vocational education and training in NSW
48
7. SPECIFYING THE TARGET SCENARIO
The baseline projections in this report can be compared with VET demand under a ‘target’ scenario.
The target scenario is one of economic success – the national employment to population ratio is achieved in NSW and then maintained, rather than falling as the population ages and the boomers retire. A substantial lift in labour force participation rates by age cohort (especially among older workers, but also among women) is required to achieve this.
The result is a much faster rate of employment growth over the next 20 years: 1.1% per annum on average for the target scenario compared with 0.6% per annum for the baseline scenario. The target scenario also has faster productivity growth and achieves a 3% unemployment rate by 2020.
The target scenario also factors in additional training initiatives. These take place to help achieve the economic outcomes for this scenario. There is additional training for those currently not in the workforce or unemployed to make the leap to employment, re-fresher training for some whose skills have atrophied, a higher rate of continuing training for those employed to help prevent premature retirement, and a faster rate of casualisation, consistent with attracting more people who would otherwise be marginally attached to the labour force back into it. These measures can be seen as additional ‘exogenous’ training, as opposed to the employment-driven training response of a stronger economy.
7.1 LABOUR MARKET PROJECTIONS
The target scenario as defined shows what employer demand would be if policies succeed in raising labour force participation to the extent that the current national ratio of the employed to the civilian (15+) population is achieved and maintained – essentially maintaining a constant ability to service the ageing population. It is presented in this report not as a forecast, but as a scenario which policymakers may see as a goal. The aim here is to tease out the VET implications of such a scenario.
The target scenario would be achieved via a range of policy initiatives, of which an increase in skills development would be only one. Other elements may include various factors, potentially including the likes of further tax reform, changes to eligibility ages for the age pension and superannuation preservation, greater promotion of competition policy and better application of leading edge technology by the private sector.
As such, while the lift in VET participation shown in the target scenario may be necessary for future economic success as portrayed in the target scenario, it is far from a sufficient condition – many other developments would need to fall into place.
As defined, the target scenario involves a significant shift up in the rate of employment growth over time, as shown in Chart 25.
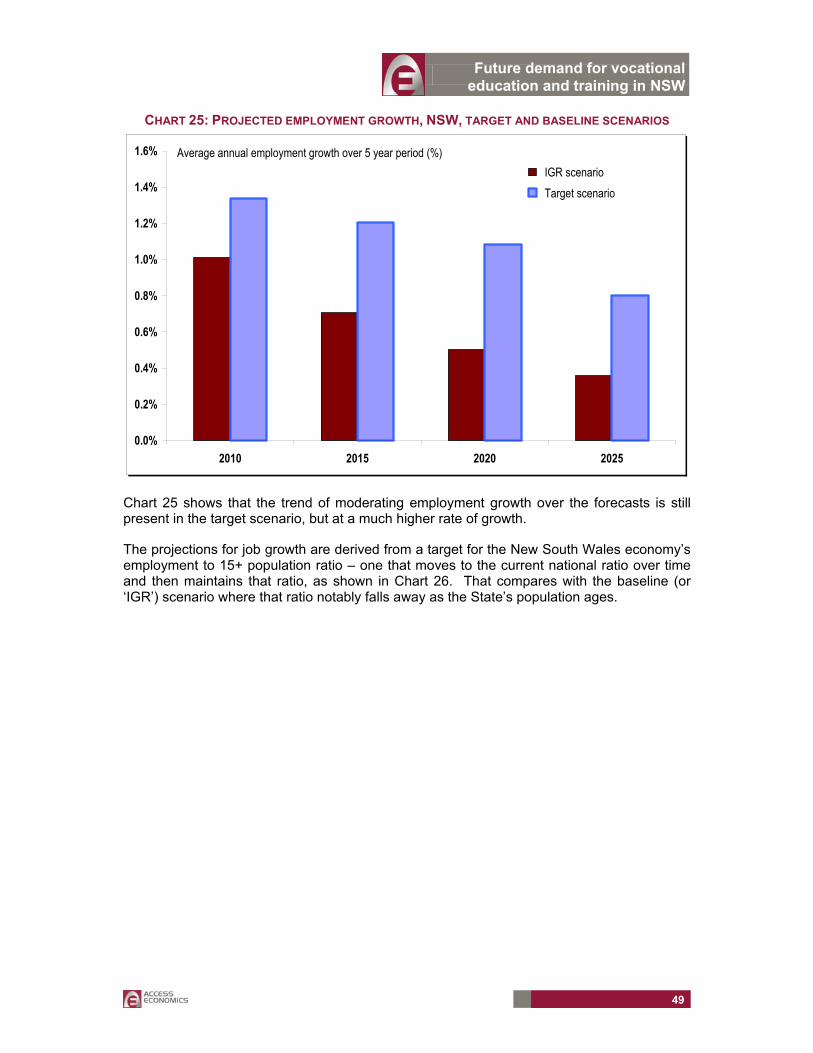
Future demand for vocational education and training in NSW
49
CHART 25: PROJECTED EMPLOYMENT GROWTH, NSW, TARGET AND BASELINE SCENARIOS
0.0%
0.2%
0.4%
0.6%
0.8%
1.0%
1.2%
1.4%
1.6%
2010 2015 2020 2025
IGR scenario Target scenario
Average annual employment growth over 5 year period (%)
Chart 25 shows that the trend of moderating employment growth over the forecasts is still present in the target scenario, but at a much higher rate of growth.
The projections for job growth are derived from a target for the New South Wales economy’s employment to 15+ population ratio – one that moves to the current national ratio over time and then maintains that ratio, as shown in Chart 26. That compares with the baseline (or ‘IGR’) scenario where that ratio notably falls away as the State’s population ages.
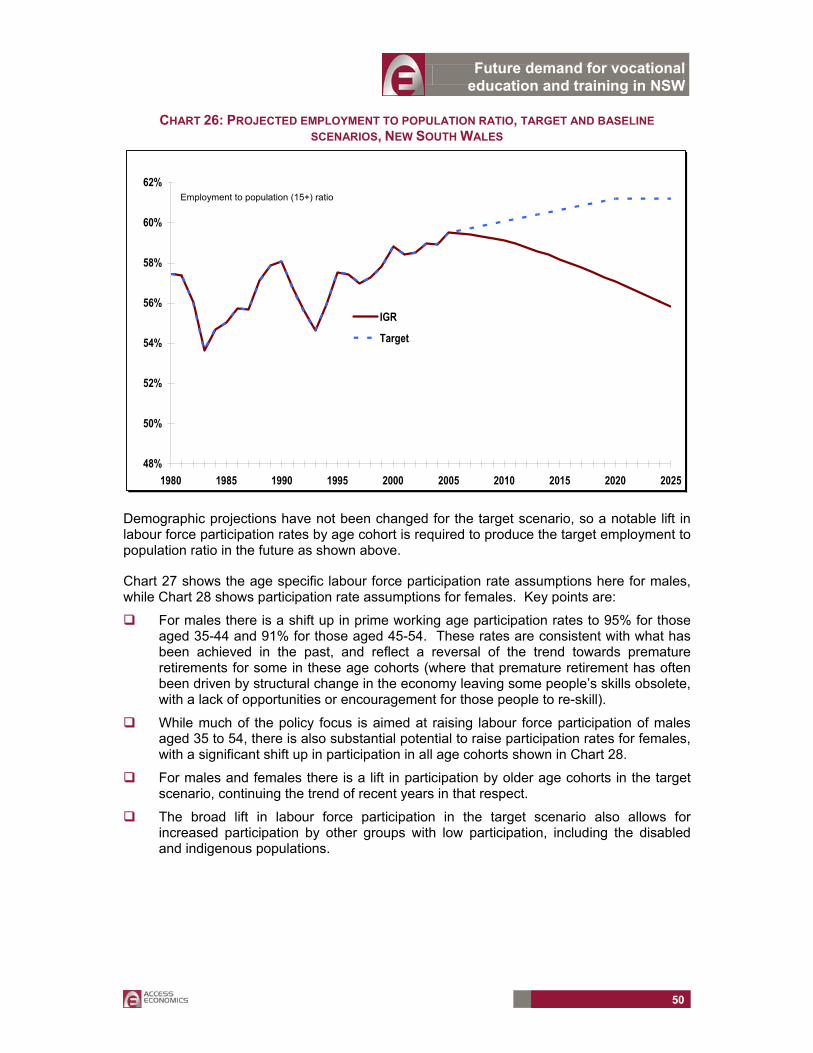
Future demand for vocational education and training in NSW
50
CHART 26: PROJECTED EMPLOYMENT TO POPULATION RATIO, TARGET AND BASELINE SCENARIOS, NEW SOUTH WALES
48%
50%
52%
54%
56%
58%
60%
62%
1980 1985 1990 1995 2000 2005 2010 2015 2020 2025
IGR
Target
Employment to population (15+) ratio
Demographic projections have not been changed for the target scenario, so a notable lift in labour force participation rates by age cohort is required to produce the target employment to population ratio in the future as shown above.
Chart 27 shows the age specific labour force participation rate assumptions here for males, while Chart 28 shows participation rate assumptions for females. Key points are:
For males there is a shift up in prime working age participation rates to 95% for those aged 35-44 and 91% for those aged 45-54. These rates are consistent with what has been achieved in the past, and reflect a reversal of the trend towards premature retirements for some in these age cohorts (where that premature retirement has often been driven by structural change in the economy leaving some people’s skills obsolete, with a lack of opportunities or encouragement for those people to re-skill).
While much of the policy focus is aimed at raising labour force participation of males aged 35 to 54, there is also substantial potential to raise participation rates for females, with a significant shift up in participation in all age cohorts shown in Chart 28.
For males and females there is a lift in participation by older age cohorts in the target scenario, continuing the trend of recent years in that respect.
The broad lift in labour force participation in the target scenario also allows for increased participation by other groups with low participation, including the disabled and indigenous populations.
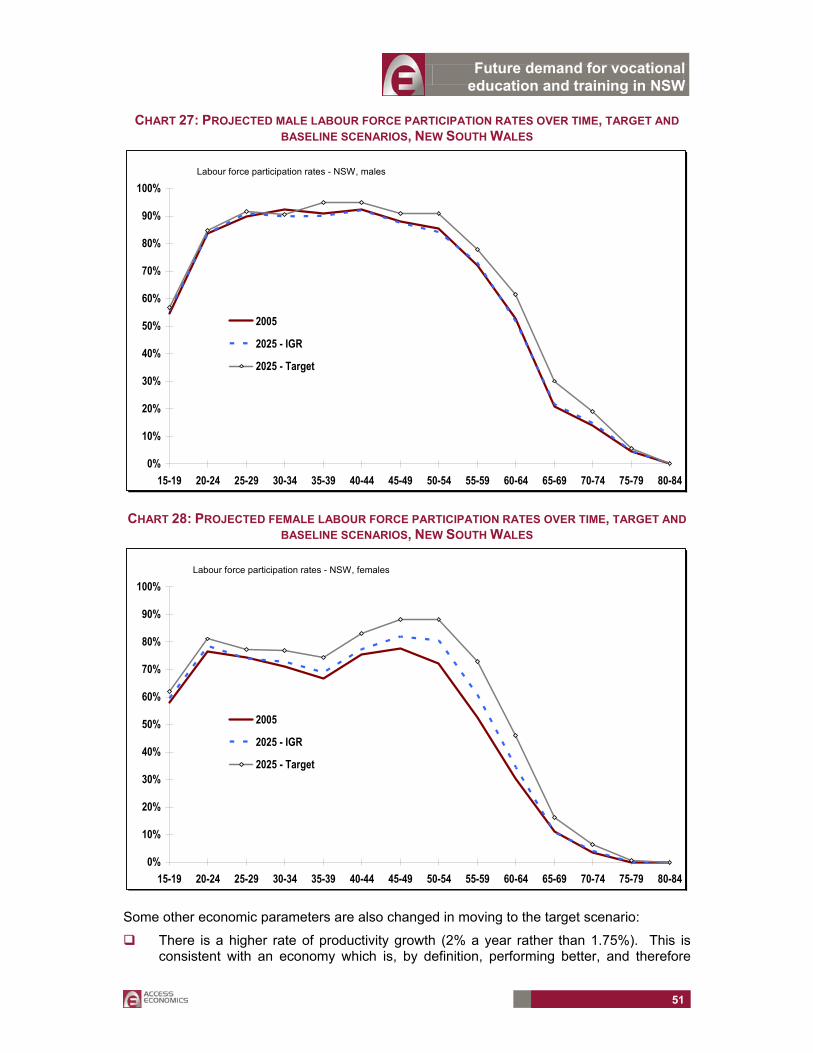
Future demand for vocational education and training in NSW
51
CHART 27: PROJECTED MALE LABOUR FORCE PARTICIPATION RATES OVER TIME, TARGET AND BASELINE SCENARIOS, NEW SOUTH WALES
0%
10%
20%
30%
40%
50%
60%
70%
80%
90%
100%
15-19 20-24 25-29 30-34 35-39 40-44 45-49 50-54 55-59 60-64 65-69 70-74 75-79 80-84
2005
2025 - IGR
2025 - Target
Labour force participation rates - NSW, males
CHART 28: PROJECTED FEMALE LABOUR FORCE PARTICIPATION RATES OVER TIME, TARGET AND
BASELINE SCENARIOS, NEW SOUTH WALES
0%
10%
20%
30%
40%
50%
60%
70%
80%
90%
100%
15-19 20-24 25-29 30-34 35-39 40-44 45-49 50-54 55-59 60-64 65-69 70-74 75-79 80-84
2005
2025 - IGR
2025 - Target
Labour force participation rates - NSW, females
Some other economic parameters are also changed in moving to the target scenario:
There is a higher rate of productivity growth (2% a year rather than 1.75%). This is consistent with an economy which is, by definition, performing better, and therefore
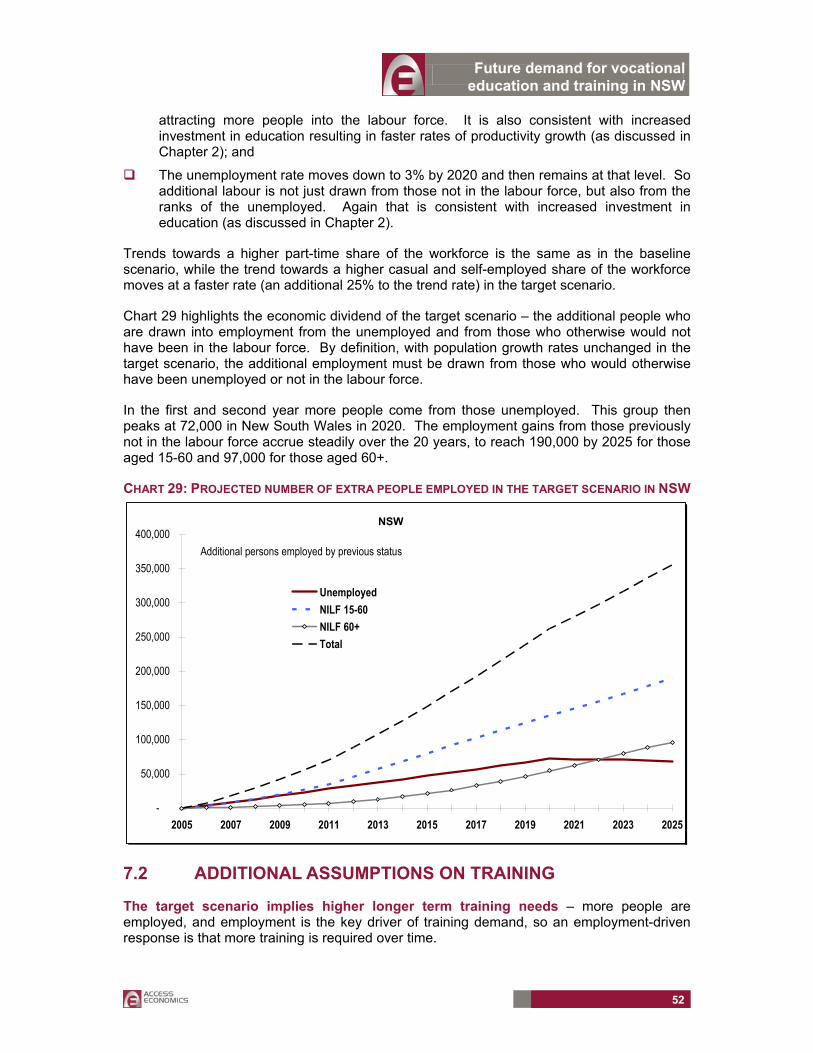
Future demand for vocational education and training in NSW
52
attracting more people into the labour force. It is also consistent with increased investment in education resulting in faster rates of productivity growth (as discussed in Chapter 2); and
The unemployment rate moves down to 3% by 2020 and then remains at that level. So additional labour is not just drawn from those not in the labour force, but also from the ranks of the unemployed. Again that is consistent with increased investment in education (as discussed in Chapter 2).
Trends towards a higher part-time share of the workforce is the same as in the baseline scenario, while the trend towards a higher casual and self-employed share of the workforce moves at a faster rate (an additional 25% to the trend rate) in the target scenario.
Chart 29 highlights the economic dividend of the target scenario – the additional people who are drawn into employment from the unemployed and from those who otherwise would not have been in the labour force. By definition, with population growth rates unchanged in the target scenario, the additional employment must be drawn from those who would otherwise have been unemployed or not in the labour force.
In the first and second year more people come from those unemployed. This group then peaks at 72,000 in New South Wales in 2020. The employment gains from those previously not in the labour force accrue steadily over the 20 years, to reach 190,000 by 2025 for those aged 15-60 and 97,000 for those aged 60+.
CHART 29: PROJECTED NUMBER OF EXTRA PEOPLE EMPLOYED IN THE TARGET SCENARIO IN NSW
-
50,000
100,000
150,000
200,000
250,000
300,000
350,000
400,000
2005 2007 2009 2011 2013 2015 2017 2019 2021 2023 2025
UnemployedNILF 15-60NILF 60+Total
Additional persons employed by previous status
NSW
7.2 ADDITIONAL ASSUMPTIONS ON TRAINING
The target scenario implies higher longer term training needs – more people are employed, and employment is the key driver of training demand, so an employment-driven response is that more training is required over time.
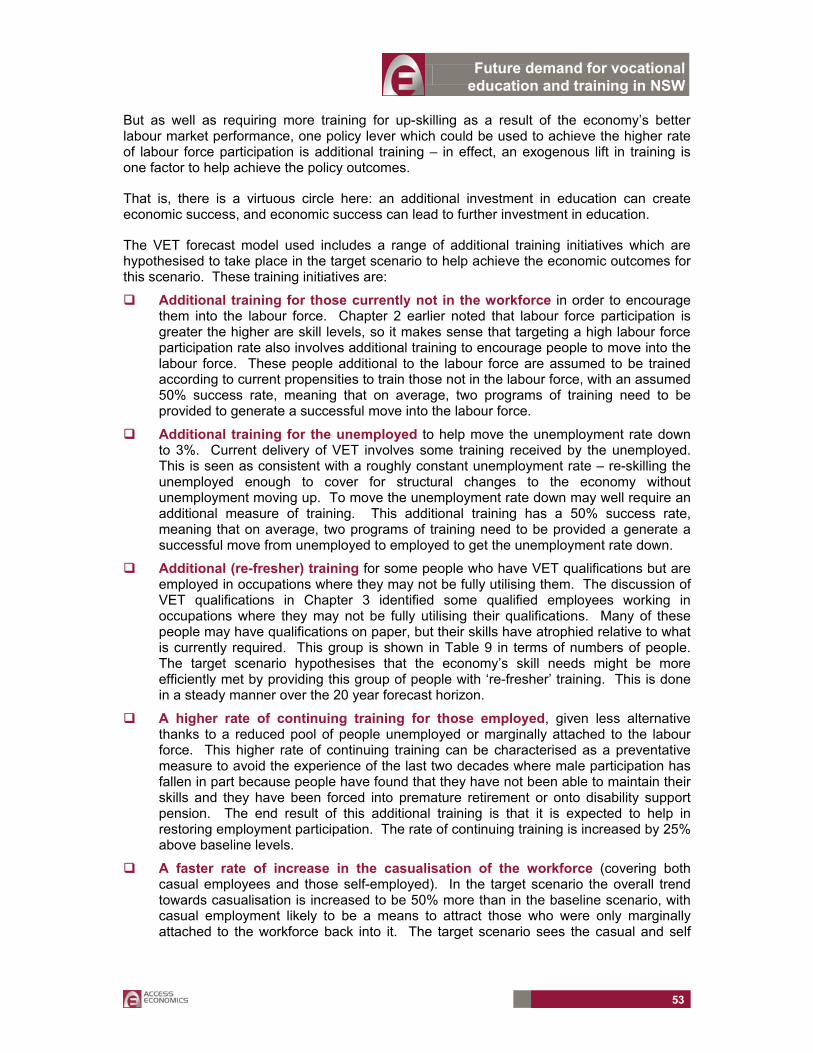
Future demand for vocational education and training in NSW
53
But as well as requiring more training for up-skilling as a result of the economy’s better labour market performance, one policy lever which could be used to achieve the higher rate of labour force participation is additional training – in effect, an exogenous lift in training is one factor to help achieve the policy outcomes.
That is, there is a virtuous circle here: an additional investment in education can create economic success, and economic success can lead to further investment in education.
The VET forecast model used includes a range of additional training initiatives which are hypothesised to take place in the target scenario to help achieve the economic outcomes for this scenario. These training initiatives are:
Additional training for those currently not in the workforce in order to encourage them into the labour force. Chapter 2 earlier noted that labour force participation is greater the higher are skill levels, so it makes sense that targeting a high labour force participation rate also involves additional training to encourage people to move into the labour force. These people additional to the labour force are assumed to be trained according to current propensities to train those not in the labour force, with an assumed 50% success rate, meaning that on average, two programs of training need to be provided to generate a successful move into the labour force.
Additional training for the unemployed to help move the unemployment rate down to 3%. Current delivery of VET involves some training received by the unemployed. This is seen as consistent with a roughly constant unemployment rate – re-skilling the unemployed enough to cover for structural changes to the economy without unemployment moving up. To move the unemployment rate down may well require an additional measure of training. This additional training has a 50% success rate, meaning that on average, two programs of training need to be provided a generate a successful move from unemployed to employed to get the unemployment rate down.
Additional (re-fresher) training for some people who have VET qualifications but are employed in occupations where they may not be fully utilising them. The discussion of VET qualifications in Chapter 3 identified some qualified employees working in occupations where they may not be fully utilising their qualifications. Many of these people may have qualifications on paper, but their skills have atrophied relative to what is currently required. This group is shown in Table 9 in terms of numbers of people. The target scenario hypothesises that the economy’s skill needs might be more efficiently met by providing this group of people with ‘re-fresher’ training. This is done in a steady manner over the 20 year forecast horizon.
A higher rate of continuing training for those employed, given less alternative thanks to a reduced pool of people unemployed or marginally attached to the labour force. This higher rate of continuing training can be characterised as a preventative measure to avoid the experience of the last two decades where male participation has fallen in part because people have found that they have not been able to maintain their skills and they have been forced into premature retirement or onto disability support pension. The end result of this additional training is that it is expected to help in restoring employment participation. The rate of continuing training is increased by 25% above baseline levels.
A faster rate of increase in the casualisation of the workforce (covering both casual employees and those self-employed). In the target scenario the overall trend towards casualisation is increased to be 50% more than in the baseline scenario, with casual employment likely to be a means to attract those who were only marginally attached to the workforce back into it. The target scenario sees the casual and self
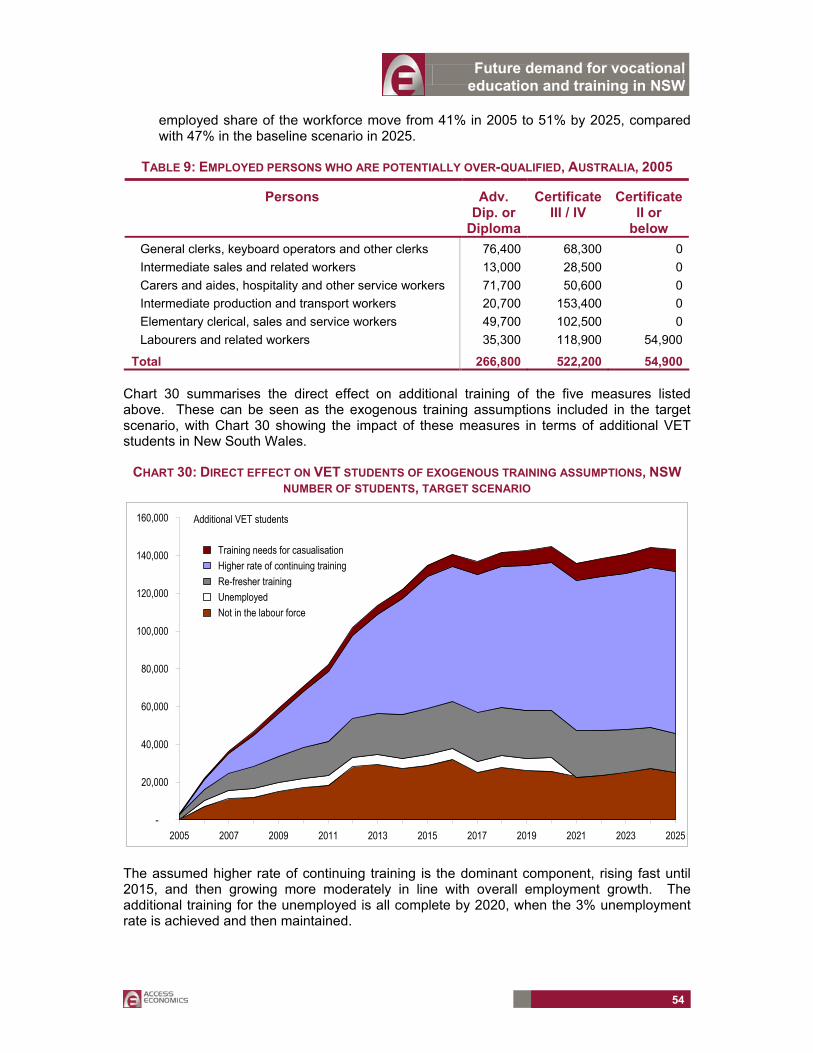
Future demand for vocational education and training in NSW
54
employed share of the workforce move from 41% in 2005 to 51% by 2025, compared with 47% in the baseline scenario in 2025.
TABLE 9: EMPLOYED PERSONS WHO ARE POTENTIALLY OVER-QUALIFIED, AUSTRALIA, 2005
Persons Adv. Dip. or
Diploma
Certificate III / IV
Certificate II or
below General clerks, keyboard operators and other clerks 76,400 68,300 0Intermediate sales and related workers 13,000 28,500 0Carers and aides, hospitality and other service workers 71,700 50,600 0Intermediate production and transport workers 20,700 153,400 0Elementary clerical, sales and service workers 49,700 102,500 0Labourers and related workers 35,300 118,900 54,900
Total 266,800 522,200 54,900
Chart 30 summarises the direct effect on additional training of the five measures listed above. These can be seen as the exogenous training assumptions included in the target scenario, with Chart 30 showing the impact of these measures in terms of additional VET students in New South Wales.
CHART 30: DIRECT EFFECT ON VET STUDENTS OF EXOGENOUS TRAINING ASSUMPTIONS, NSW NUMBER OF STUDENTS, TARGET SCENARIO
-
20,000
40,000
60,000
80,000
100,000
120,000
140,000
160,000
2005 2007 2009 2011 2013 2015 2017 2019 2021 2023 2025
Training needs for casualisation Higher rate of continuing training Re-fresher training Unemployed Not in the labour force
Additional VET students
The assumed higher rate of continuing training is the dominant component, rising fast until 2015, and then growing more moderately in line with overall employment growth. The additional training for the unemployed is all complete by 2020, when the 3% unemployment rate is achieved and then maintained.
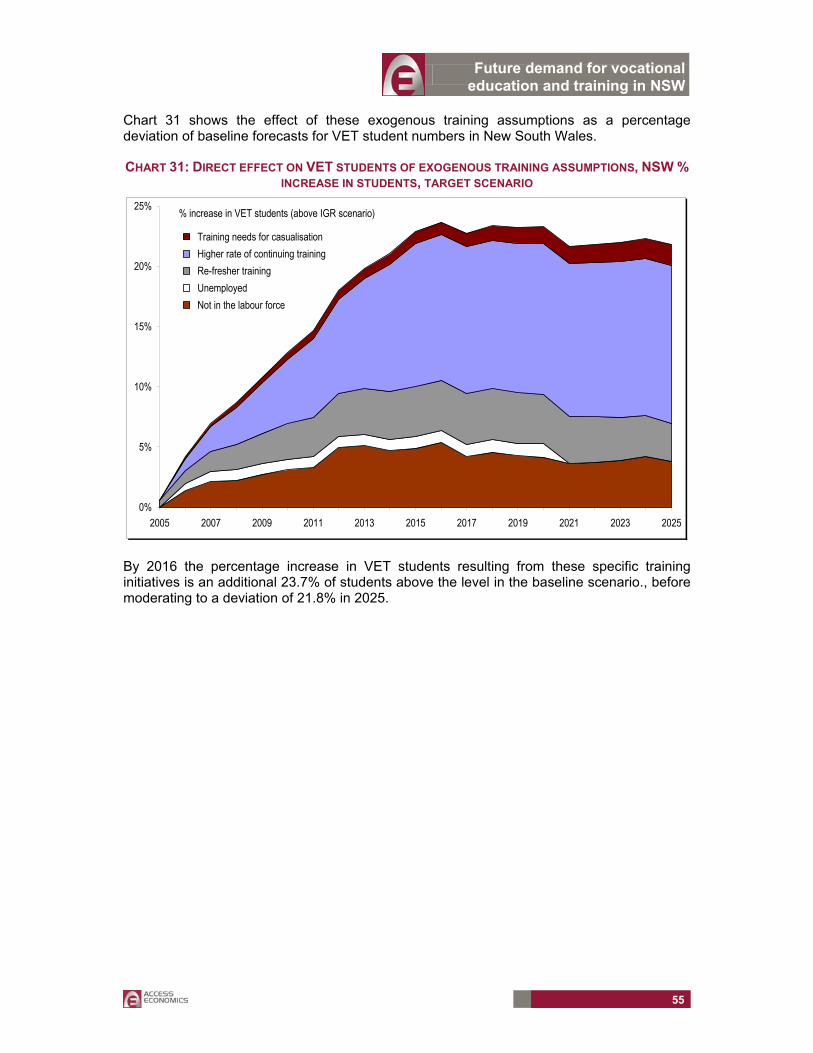
Future demand for vocational education and training in NSW
55
Chart 31 shows the effect of these exogenous training assumptions as a percentage deviation of baseline forecasts for VET student numbers in New South Wales.
CHART 31: DIRECT EFFECT ON VET STUDENTS OF EXOGENOUS TRAINING ASSUMPTIONS, NSW % INCREASE IN STUDENTS, TARGET SCENARIO
0%
5%
10%
15%
20%
25%
2005 2007 2009 2011 2013 2015 2017 2019 2021 2023 2025
Training needs for casualisation Higher rate of continuing training Re-fresher training Unemployed Not in the labour force
% increase in VET students (above IGR scenario)
By 2016 the percentage increase in VET students resulting from these specific training initiatives is an additional 23.7% of students above the level in the baseline scenario., before moderating to a deviation of 21.8% in 2025.
Future demand for vocational education and training in NSW
56
8. TARGET SCENARIO – PROJECTED VET ACTIVITY
The projections for VET activity in the target scenario are for considerable strength in demand. Over the 20 year period (2005 to 2025) the projections for New South Wales are for:
– average growth in the number of VET students of 2.28% per annum; and
– average growth in the number of VET hours of 2.61% per annum.
Those rates are much faster than in the baseline scenario.
VET participation in the target scenario reaches 21.1% of employed persons by 2025, compared with 17.8% in the baseline scenario. Some 81% of this lift in VET participation can be ascribed to exogenous training initiatives designed to help achieve the target scenario. The other 19% of additional training is an employment-driven response of demand for higher skills given a stronger performing economy (a higher employment level and higher productivity growth).
In the target scenario the cost of VET would amount to 0.60% of GSP in NSW in 2025 – a moderate increase on current levels of 0.51% of GSP. Note that in the target scenario not only is the estimated cost of VET higher, but the level of GSP is also higher than in the baseline, with additional employment and productivity growth translating into a faster growing economy. Or, in other words, part of the considerable increase in cost has been met by an almost as large an increase in the economy’s size (and therefore capacity to pay).
8.1 SCENARIO RESULTS
This chapter reports projected VET activity under the target scenario. Results are presented for New South Wales projections (Australia wide projections have also been developed). Projections under the baseline or IGR scenario are used as the point of comparison.
Chart 32 shows much faster growth in the number of VET students in the target scenario than the baseline, particularly through the first five years of the forecasts. The unemployment rate starts to fall over that period, and the ‘exogenous’ training initiatives described in the previous chapter are being put into place.
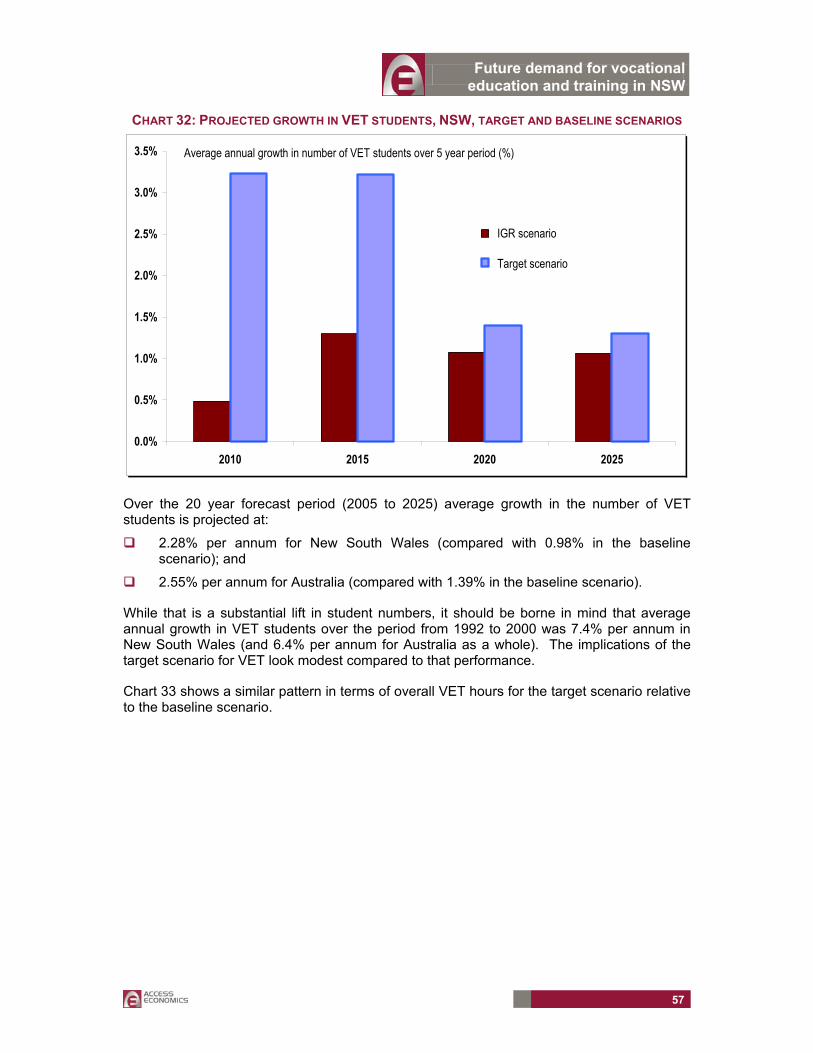
Future demand for vocational education and training in NSW
57
CHART 32: PROJECTED GROWTH IN VET STUDENTS, NSW, TARGET AND BASELINE SCENARIOS
0.0%
0.5%
1.0%
1.5%
2.0%
2.5%
3.0%
3.5%
2010 2015 2020 2025
IGR scenario
Target scenario
Average annual growth in number of VET students over 5 year period (%)
Over the 20 year forecast period (2005 to 2025) average growth in the number of VET students is projected at:
2.28% per annum for New South Wales (compared with 0.98% in the baseline scenario); and
2.55% per annum for Australia (compared with 1.39% in the baseline scenario).
While that is a substantial lift in student numbers, it should be borne in mind that average annual growth in VET students over the period from 1992 to 2000 was 7.4% per annum in New South Wales (and 6.4% per annum for Australia as a whole). The implications of the target scenario for VET look modest compared to that performance.
Chart 33 shows a similar pattern in terms of overall VET hours for the target scenario relative to the baseline scenario.
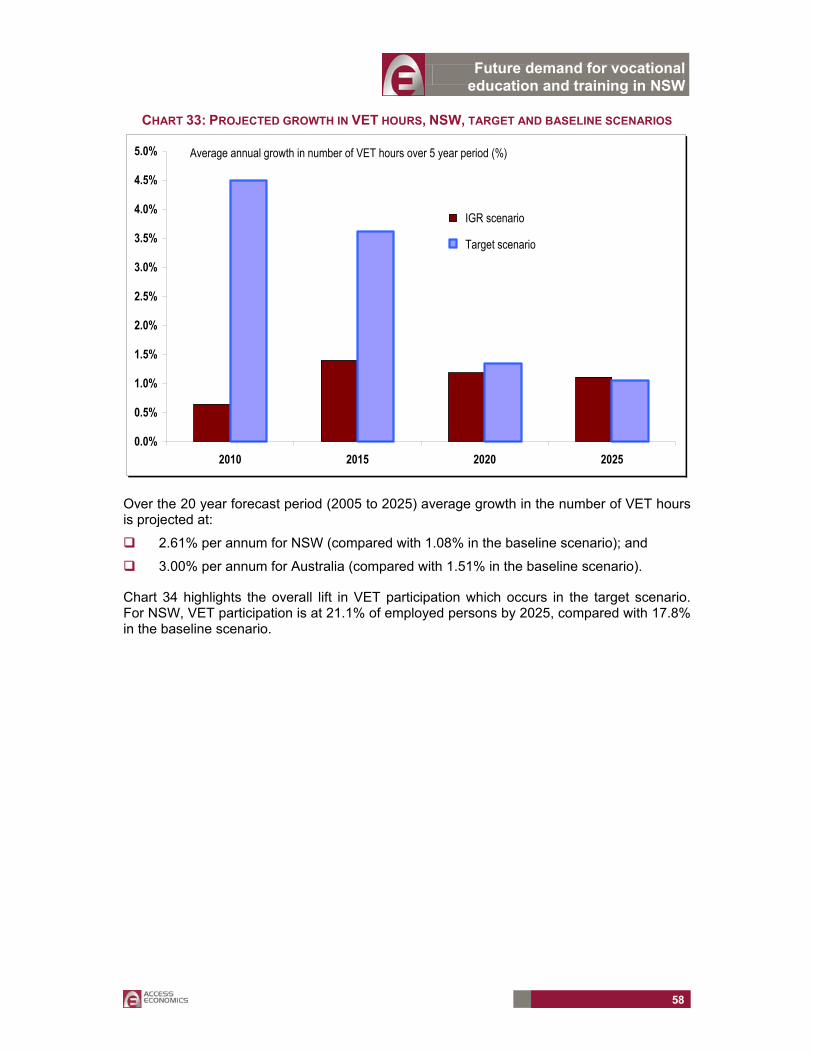
Future demand for vocational education and training in NSW
58
CHART 33: PROJECTED GROWTH IN VET HOURS, NSW, TARGET AND BASELINE SCENARIOS
0.0%
0.5%
1.0%
1.5%
2.0%
2.5%
3.0%
3.5%
4.0%
4.5%
5.0%
2010 2015 2020 2025
IGR scenario
Target scenario
Average annual growth in number of VET hours over 5 year period (%)
Over the 20 year forecast period (2005 to 2025) average growth in the number of VET hours is projected at:
2.61% per annum for NSW (compared with 1.08% in the baseline scenario); and
3.00% per annum for Australia (compared with 1.51% in the baseline scenario).
Chart 34 highlights the overall lift in VET participation which occurs in the target scenario. For NSW, VET participation is at 21.1% of employed persons by 2025, compared with 17.8% in the baseline scenario.
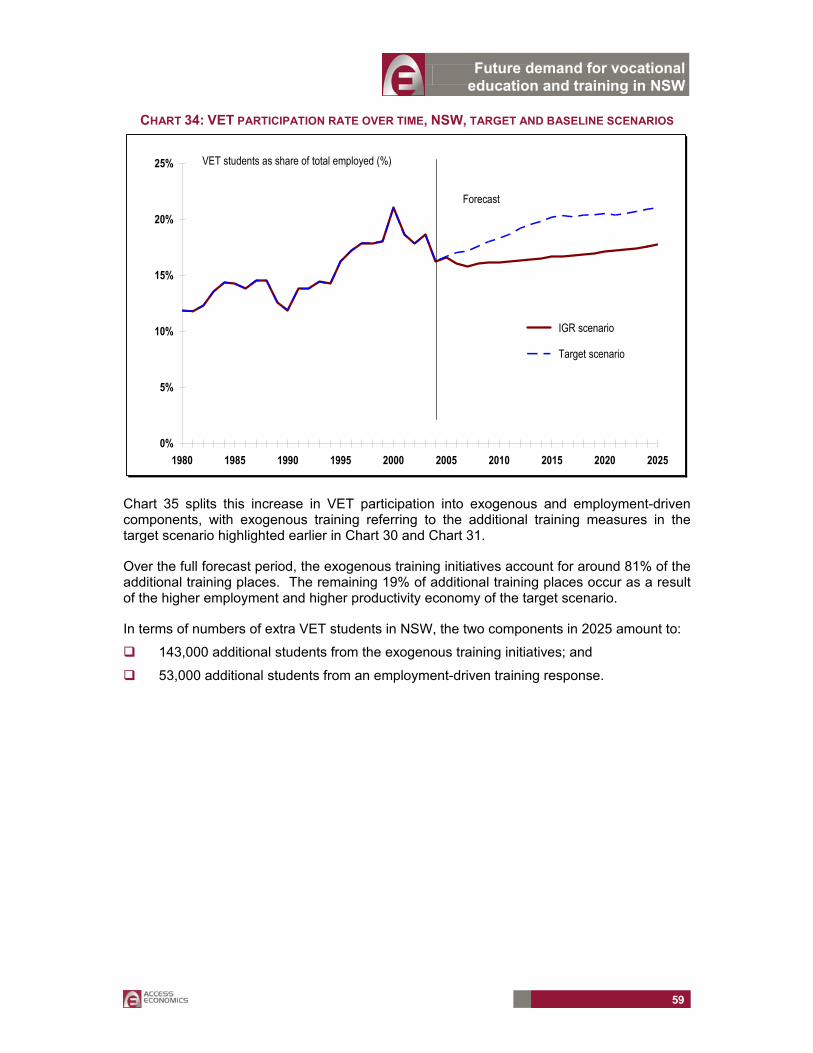
Future demand for vocational education and training in NSW
59
CHART 34: VET PARTICIPATION RATE OVER TIME, NSW, TARGET AND BASELINE SCENARIOS
0%
5%
10%
15%
20%
25%
1980 1985 1990 1995 2000 2005 2010 2015 2020 2025
IGR scenario
Target scenario
VET students as share of total employed (%)
Forecast
Chart 35 splits this increase in VET participation into exogenous and employment-driven components, with exogenous training referring to the additional training measures in the target scenario highlighted earlier in Chart 30 and Chart 31.
Over the full forecast period, the exogenous training initiatives account for around 81% of the additional training places. The remaining 19% of additional training places occur as a result of the higher employment and higher productivity economy of the target scenario.
In terms of numbers of extra VET students in NSW, the two components in 2025 amount to:
143,000 additional students from the exogenous training initiatives; and
53,000 additional students from an employment-driven training response.
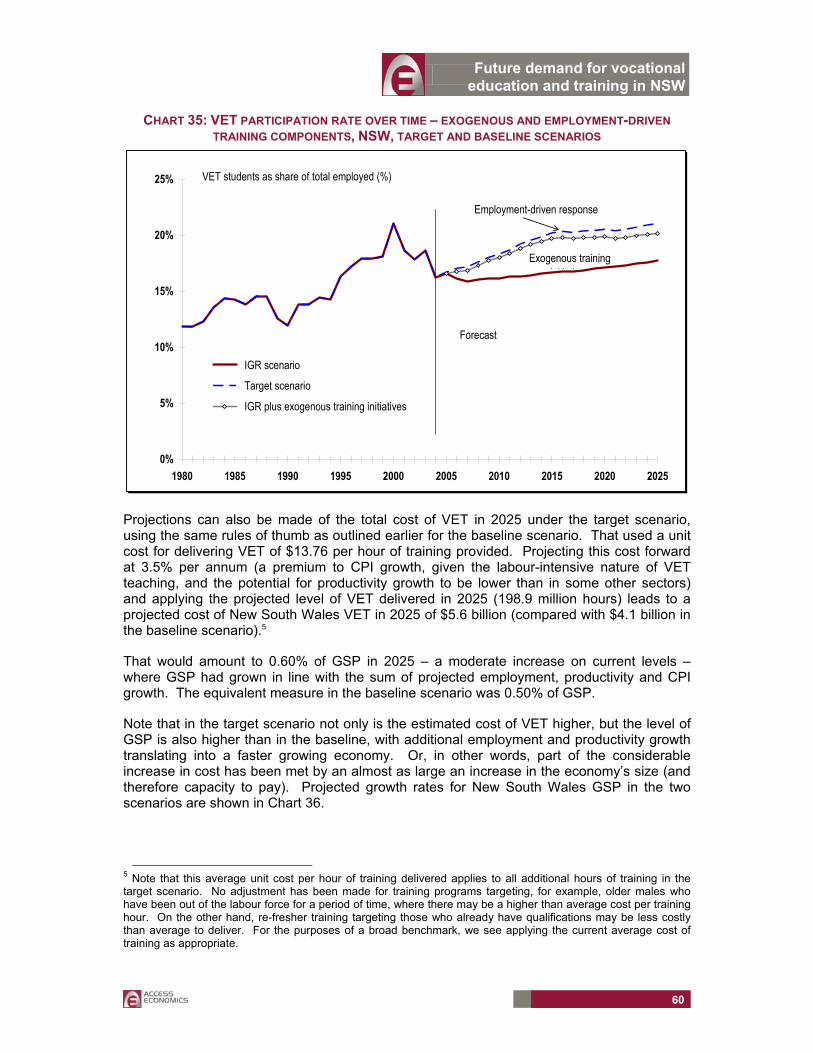
Future demand for vocational education and training in NSW
60
CHART 35: VET PARTICIPATION RATE OVER TIME – EXOGENOUS AND EMPLOYMENT-DRIVEN TRAINING COMPONENTS, NSW, TARGET AND BASELINE SCENARIOS
0%
5%
10%
15%
20%
25%
1980 1985 1990 1995 2000 2005 2010 2015 2020 2025
IGR scenario
Target scenario
IGR plus exogenous training initiatives
VET students as share of total employed (%)
Forecast
Exogenous training i iti ti
Employment-driven response
Projections can also be made of the total cost of VET in 2025 under the target scenario, using the same rules of thumb as outlined earlier for the baseline scenario. That used a unit cost for delivering VET of $13.76 per hour of training provided. Projecting this cost forward at 3.5% per annum (a premium to CPI growth, given the labour-intensive nature of VET teaching, and the potential for productivity growth to be lower than in some other sectors) and applying the projected level of VET delivered in 2025 (198.9 million hours) leads to a projected cost of New South Wales VET in 2025 of $5.6 billion (compared with $4.1 billion in the baseline scenario).5
That would amount to 0.60% of GSP in 2025 – a moderate increase on current levels – where GSP had grown in line with the sum of projected employment, productivity and CPI growth. The equivalent measure in the baseline scenario was 0.50% of GSP.
Note that in the target scenario not only is the estimated cost of VET higher, but the level of GSP is also higher than in the baseline, with additional employment and productivity growth translating into a faster growing economy. Or, in other words, part of the considerable increase in cost has been met by an almost as large an increase in the economy’s size (and therefore capacity to pay). Projected growth rates for New South Wales GSP in the two scenarios are shown in Chart 36.
5 Note that this average unit cost per hour of training delivered applies to all additional hours of training in the target scenario. No adjustment has been made for training programs targeting, for example, older males who have been out of the labour force for a period of time, where there may be a higher than average cost per training hour. On the other hand, re-fresher training targeting those who already have qualifications may be less costly than average to deliver. For the purposes of a broad benchmark, we see applying the current average cost of training as appropriate.
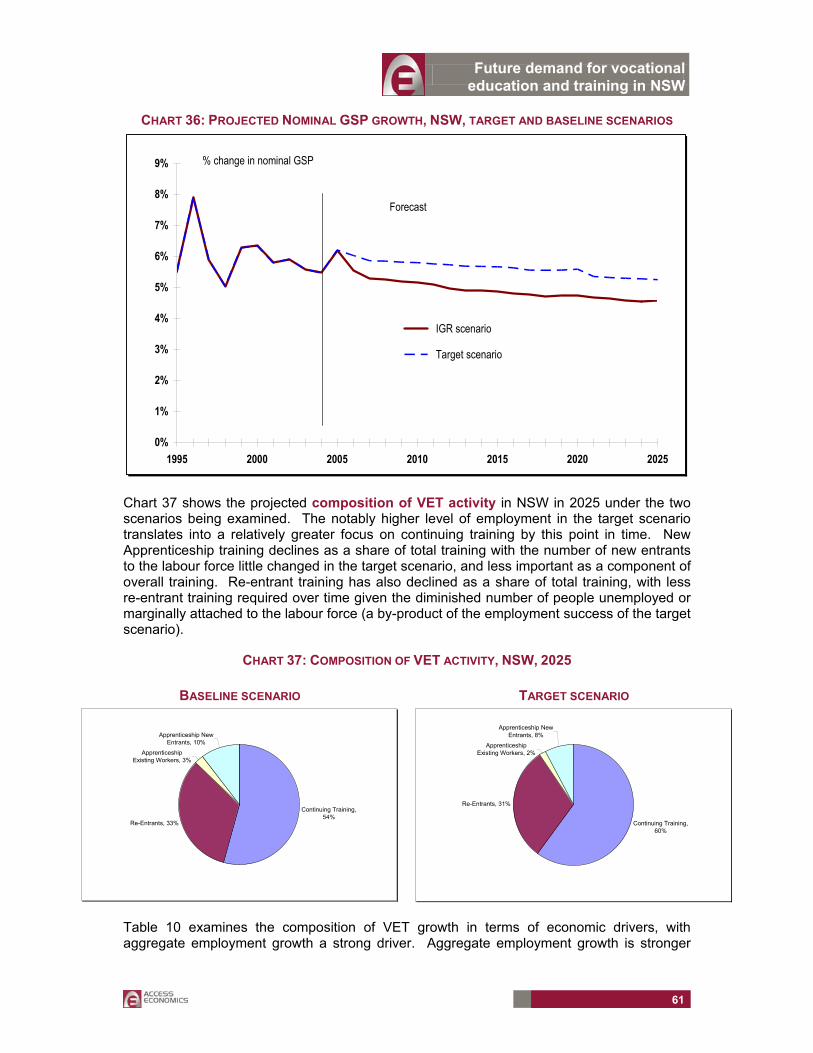
Future demand for vocational education and training in NSW
61
CHART 36: PROJECTED NOMINAL GSP GROWTH, NSW, TARGET AND BASELINE SCENARIOS
0%
1%
2%
3%
4%
5%
6%
7%
8%
9%
1995 2000 2005 2010 2015 2020 2025
IGR scenario
Target scenario
% change in nominal GSP
Forecast
Chart 37 shows the projected composition of VET activity in NSW in 2025 under the two scenarios being examined. The notably higher level of employment in the target scenario translates into a relatively greater focus on continuing training by this point in time. New Apprenticeship training declines as a share of total training with the number of new entrants to the labour force little changed in the target scenario, and less important as a component of overall training. Re-entrant training has also declined as a share of total training, with less re-entrant training required over time given the diminished number of people unemployed or marginally attached to the labour force (a by-product of the employment success of the target scenario).
CHART 37: COMPOSITION OF VET ACTIVITY, NSW, 2025
Table 10 examines the composition of VET growth in terms of economic drivers, with aggregate employment growth a strong driver. Aggregate employment growth is stronger
BASELINE SCENARIO
Continuing Training, 54%
Re-Entrants, 33%
Apprenticeship Existing Workers, 3%
Apprenticeship New Entrants, 10%
TARGET SCENARIO
Continuing Training, 60%
Re-Entrants, 31%
Apprenticeship Existing Workers, 2%
Apprenticeship New Entrants, 8%
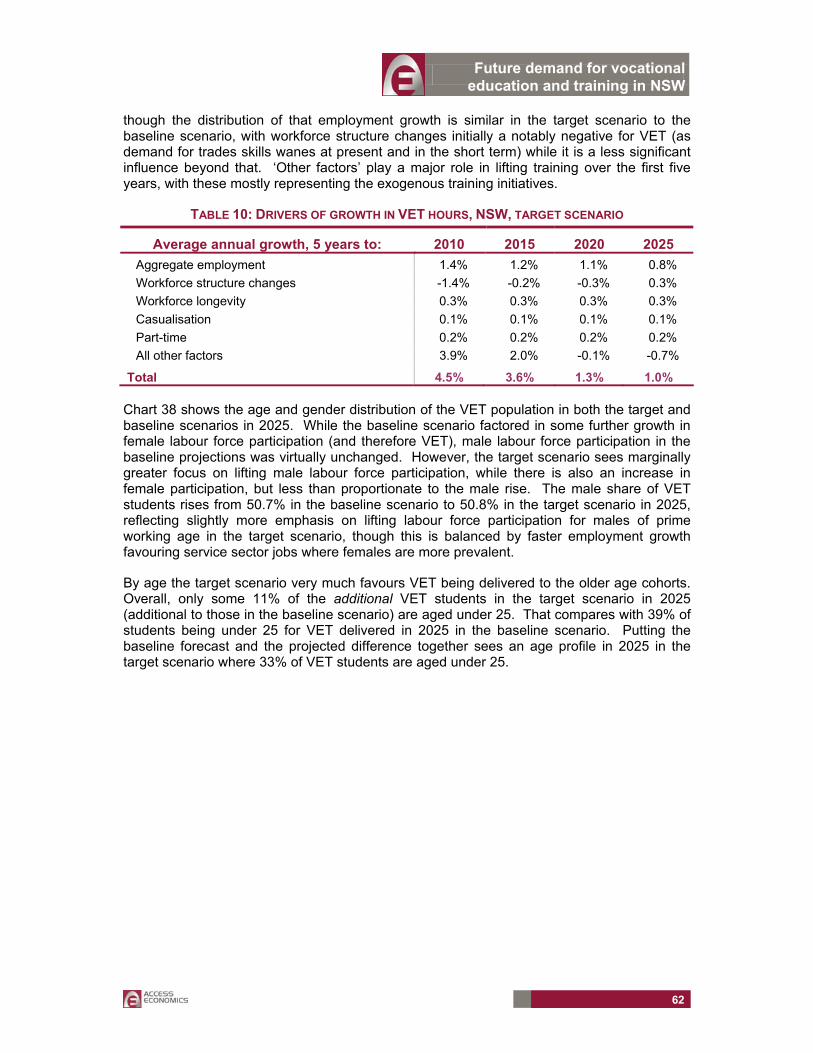
Future demand for vocational education and training in NSW
62
though the distribution of that employment growth is similar in the target scenario to the baseline scenario, with workforce structure changes initially a notably negative for VET (as demand for trades skills wanes at present and in the short term) while it is a less significant influence beyond that. ‘Other factors’ play a major role in lifting training over the first five years, with these mostly representing the exogenous training initiatives.
TABLE 10: DRIVERS OF GROWTH IN VET HOURS, NSW, TARGET SCENARIO
Average annual growth, 5 years to: 2010 2015 2020 2025 Aggregate employment 1.4% 1.2% 1.1% 0.8% Workforce structure changes -1.4% -0.2% -0.3% 0.3% Workforce longevity 0.3% 0.3% 0.3% 0.3% Casualisation 0.1% 0.1% 0.1% 0.1% Part-time 0.2% 0.2% 0.2% 0.2% All other factors 3.9% 2.0% -0.1% -0.7%
Total 4.5% 3.6% 1.3% 1.0%
Chart 38 shows the age and gender distribution of the VET population in both the target and baseline scenarios in 2025. While the baseline scenario factored in some further growth in female labour force participation (and therefore VET), male labour force participation in the baseline projections was virtually unchanged. However, the target scenario sees marginally greater focus on lifting male labour force participation, while there is also an increase in female participation, but less than proportionate to the male rise. The male share of VET students rises from 50.7% in the baseline scenario to 50.8% in the target scenario in 2025, reflecting slightly more emphasis on lifting labour force participation for males of prime working age in the target scenario, though this is balanced by faster employment growth favouring service sector jobs where females are more prevalent.
By age the target scenario very much favours VET being delivered to the older age cohorts. Overall, only some 11% of the additional VET students in the target scenario in 2025 (additional to those in the baseline scenario) are aged under 25. That compares with 39% of students being under 25 for VET delivered in 2025 in the baseline scenario. Putting the baseline forecast and the projected difference together sees an age profile in 2025 in the target scenario where 33% of VET students are aged under 25.
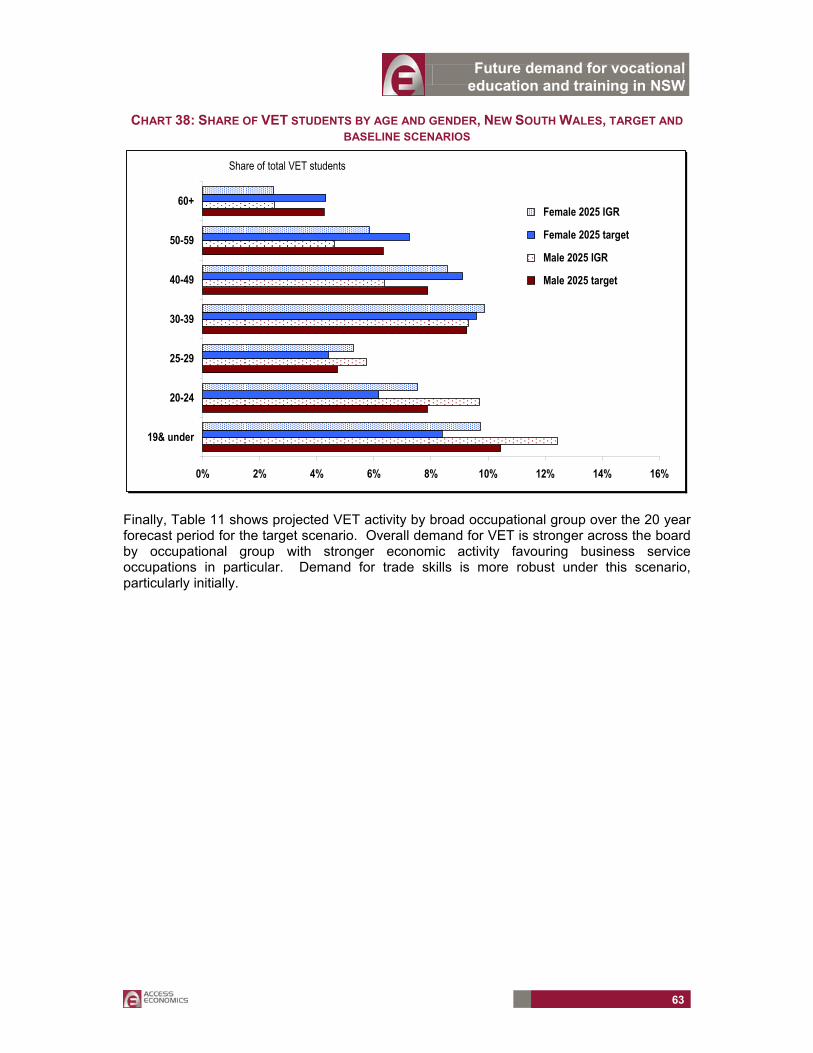
Future demand for vocational education and training in NSW
63
CHART 38: SHARE OF VET STUDENTS BY AGE AND GENDER, NEW SOUTH WALES, TARGET AND BASELINE SCENARIOS
0% 2% 4% 6% 8% 10% 12% 14% 16%
19& under
20-24
25-29
30-39
40-49
50-59
60+ Female 2025 IGR
Female 2025 target
Male 2025 IGR
Male 2025 target
Share of total VET students
Finally, Table 11 shows projected VET activity by broad occupational group over the 20 year forecast period for the target scenario. Overall demand for VET is stronger across the board by occupational group with stronger economic activity favouring business service occupations in particular. Demand for trade skills is more robust under this scenario, particularly initially.
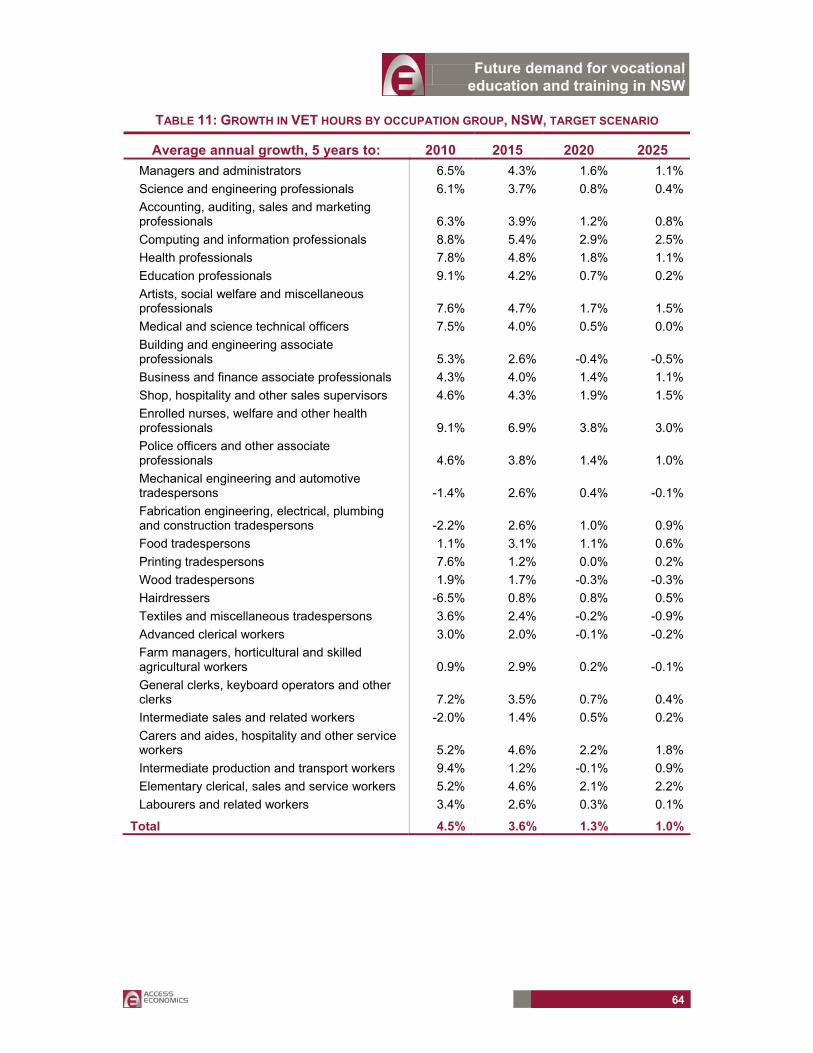
Future demand for vocational education and training in NSW
64
TABLE 11: GROWTH IN VET HOURS BY OCCUPATION GROUP, NSW, TARGET SCENARIO
Average annual growth, 5 years to: 2010 2015 2020 2025 Managers and administrators 6.5% 4.3% 1.6% 1.1%Science and engineering professionals 6.1% 3.7% 0.8% 0.4%Accounting, auditing, sales and marketing professionals 6.3% 3.9% 1.2% 0.8%Computing and information professionals 8.8% 5.4% 2.9% 2.5%Health professionals 7.8% 4.8% 1.8% 1.1%Education professionals 9.1% 4.2% 0.7% 0.2%Artists, social welfare and miscellaneous professionals 7.6% 4.7% 1.7% 1.5%Medical and science technical officers 7.5% 4.0% 0.5% 0.0%Building and engineering associate professionals 5.3% 2.6% -0.4% -0.5%Business and finance associate professionals 4.3% 4.0% 1.4% 1.1%Shop, hospitality and other sales supervisors 4.6% 4.3% 1.9% 1.5%Enrolled nurses, welfare and other health professionals 9.1% 6.9% 3.8% 3.0%Police officers and other associate professionals 4.6% 3.8% 1.4% 1.0%Mechanical engineering and automotive tradespersons -1.4% 2.6% 0.4% -0.1%Fabrication engineering, electrical, plumbing and construction tradespersons -2.2% 2.6% 1.0% 0.9%Food tradespersons 1.1% 3.1% 1.1% 0.6%Printing tradespersons 7.6% 1.2% 0.0% 0.2%Wood tradespersons 1.9% 1.7% -0.3% -0.3%Hairdressers -6.5% 0.8% 0.8% 0.5%Textiles and miscellaneous tradespersons 3.6% 2.4% -0.2% -0.9%Advanced clerical workers 3.0% 2.0% -0.1% -0.2%Farm managers, horticultural and skilled agricultural workers 0.9% 2.9% 0.2% -0.1%General clerks, keyboard operators and other clerks 7.2% 3.5% 0.7% 0.4%Intermediate sales and related workers -2.0% 1.4% 0.5% 0.2%Carers and aides, hospitality and other service workers 5.2% 4.6% 2.2% 1.8%Intermediate production and transport workers 9.4% 1.2% -0.1% 0.9%Elementary clerical, sales and service workers 5.2% 4.6% 2.1% 2.2%Labourers and related workers 3.4% 2.6% 0.3% 0.1%
Total 4.5% 3.6% 1.3% 1.0%
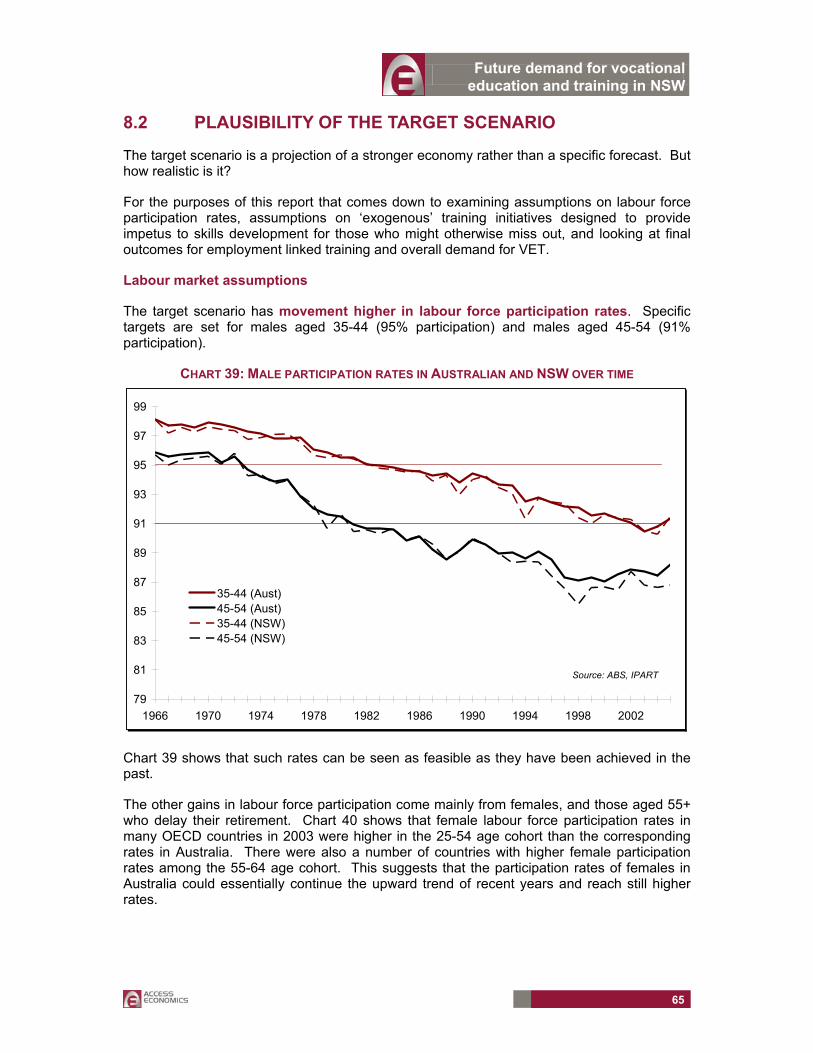
Future demand for vocational education and training in NSW
65
8.2 PLAUSIBILITY OF THE TARGET SCENARIO
The target scenario is a projection of a stronger economy rather than a specific forecast. But how realistic is it?
For the purposes of this report that comes down to examining assumptions on labour force participation rates, assumptions on ‘exogenous’ training initiatives designed to provide impetus to skills development for those who might otherwise miss out, and looking at final outcomes for employment linked training and overall demand for VET.
Labour market assumptions
The target scenario has movement higher in labour force participation rates. Specific targets are set for males aged 35-44 (95% participation) and males aged 45-54 (91% participation).
CHART 39: MALE PARTICIPATION RATES IN AUSTRALIAN AND NSW OVER TIME
79
81
83
85
87
89
91
93
95
97
99
1966 1970 1974 1978 1982 1986 1990 1994 1998 2002
35-44 (Aust)45-54 (Aust)35-44 (NSW)45-54 (NSW)
Source: ABS, IPART
Chart 39 shows that such rates can be seen as feasible as they have been achieved in the past.
The other gains in labour force participation come mainly from females, and those aged 55+ who delay their retirement. Chart 40 shows that female labour force participation rates in many OECD countries in 2003 were higher in the 25-54 age cohort than the corresponding rates in Australia. There were also a number of countries with higher female participation rates among the 55-64 age cohort. This suggests that the participation rates of females in Australia could essentially continue the upward trend of recent years and reach still higher rates.
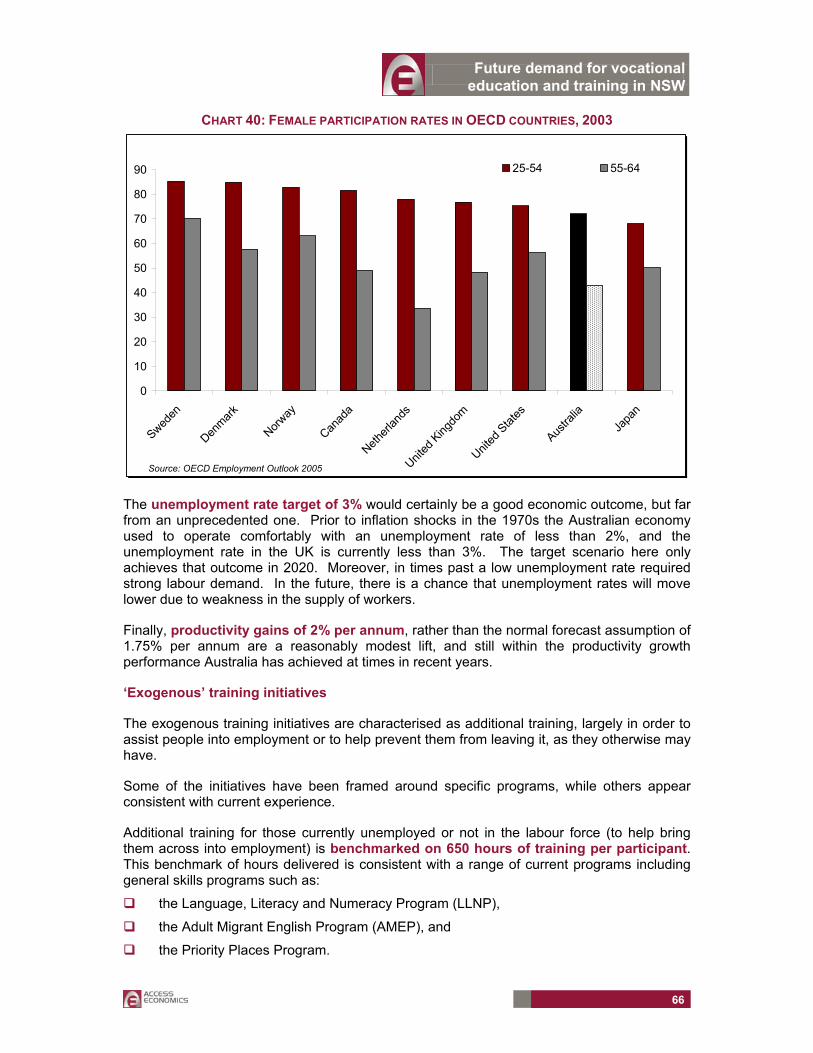
Future demand for vocational education and training in NSW
66
CHART 40: FEMALE PARTICIPATION RATES IN OECD COUNTRIES, 2003
0
10
20
30
40
50
60
70
80
90
Sweden
Denmark
Norway
Canad
a
Netherl
ands
United
Kingdo
m
United
States
Austra
liaJa
pan
25-54 55-64
Source: OECD Employment Outlook 2005
The unemployment rate target of 3% would certainly be a good economic outcome, but far from an unprecedented one. Prior to inflation shocks in the 1970s the Australian economy used to operate comfortably with an unemployment rate of less than 2%, and the unemployment rate in the UK is currently less than 3%. The target scenario here only achieves that outcome in 2020. Moreover, in times past a low unemployment rate required strong labour demand. In the future, there is a chance that unemployment rates will move lower due to weakness in the supply of workers.
Finally, productivity gains of 2% per annum, rather than the normal forecast assumption of 1.75% per annum are a reasonably modest lift, and still within the productivity growth performance Australia has achieved at times in recent years.
‘Exogenous’ training initiatives
The exogenous training initiatives are characterised as additional training, largely in order to assist people into employment or to help prevent them from leaving it, as they otherwise may have.
Some of the initiatives have been framed around specific programs, while others appear consistent with current experience.
Additional training for those currently unemployed or not in the labour force (to help bring them across into employment) is benchmarked on 650 hours of training per participant. This benchmark of hours delivered is consistent with a range of current programs including general skills programs such as:
the Language, Literacy and Numeracy Program (LLNP),
the Adult Migrant English Program (AMEP), and
the Priority Places Program.
Future demand for vocational education and training in NSW
67
The LLNP provides basic language, literacy and numeracy training for eligible job seekers whose skills are below the level considered necessary to secure sustainable employment or pursue further education and training. It is designed to help remove a major barrier to employment and improve participants’ daily lives. Participants in the program undertake up to five blocks of training where each block consists of 160 hours contact (thereby totally up to 800 hours of training, though most participants will not complete 5 entire blocks). A benchmark of 650 hours of training would be supported by the LLNP experience with helping participants rejoin the workforce.
The AMEP provides up to 510 hours of basic English language tuition to migrants and refugees from non-English speaking backgrounds. Up to an additional 100 hours is also available to refugees and humanitarian entrants through the Special Preparatory Program. The aim of the program is to help newly arrived migrants and humanitarian entrants to settle in Australia, including the attainment of employment. The 650 hour benchmark is consistent with the Department of Immigration and Multicultural Affairs assessment of the hours required to enhance the skills of newly arrived migrants.
The Commonwealth Department of Education, Science and Training (DEST) previously ran a Priority Places Program which targeted mature aged people (45+) or disabled people or parents re-entering the workforce. Benchmark hours provided varied by course, including:
671 – 820 hours for Certificate III in Automotive;
371 – 620 hours for Certificate III in Community services;
521 – 860 hours for Certificate III in Food industry; and
771 – 860 hours for Certificate III in Retail wholesale.
The benchmark of 650 hours used for the modelling here is within the range for many of these courses.
This additional training for those unemployed or not in the labour force is benchmarked on a 50% success rate, meaning that on average, two programs of training need to be provided to generate a successful move into the labour force. The 50% success rate is supported by outcomes from programs such as
the Outreach Australians Working Together program,
the Get Skilled program, and
the Helping Young People at Risk program (targeting disadvantaged youth).
The Outreach Australians Working Together program was aimed at people aged 40-65 who were mainly long term unemployed. This group faced a range of barriers to accessing vocational education and training. The courses offered under the program were typically less than a single semester in duration and often led to further study for participants. In 2004, 15% of the participants were surveyed six months after they had completed the course. Of this cohort, it was found that 40% were in paid work and a further 30% were engaged in voluntary work. An assumption of 50% success rate is supported by the results of the Outreach program.
The Get Skilled program is aimed at long term unemployed people. Courses are tailored to the needs of disadvantaged unemployed participants from diverse backgrounds such as overseas trained professionals, youth at risk, women and people with a disability. They are designed as pre-employment courses aimed at leading to apprenticeships or traineeships. A
Future demand for vocational education and training in NSW
68
survey of outcomes found that 56% of the graduates went on to employment. Again this result is consistent with a 50% success rate assumption.
The Helping Young People at Risk program provides support to the most disadvantaged young people (aged 15 to 18) in the community. The program aims to re-engage them in education and training and provide pathways for them to undertake further education or gain employment. In 2003-04 it was found that 70% of students completed their course of study. Of this group, 74% continued with education and training programs. This amounts to around 52% of the starting cohort for whom the course could be labelled a success.
Data from NCVER Student Outcomes surveys also supports a 50% success rate assumption:
the share of TAFE graduates who were not employed before training being employed after training varied from 40% to 52% over the period from 1995 to 2005; and
information from an equity group of students (comprising Indigenous, non-English speaking background and disability students) showed a 44% success rate in finding employment after training, with that figure 56% for the 20-24 age cohort.
By far the most significant ‘additional’ training initiative is the one which sees rates of continuing training increase by 25% above their current level. This is characterised as a preventative measure to avoid the experience of the last two decades where male participation has fallen as people have found that they have not been able to maintain their skills and they have been forced into premature retirement.
‘Normal’ rates of continuing training in New South Wales are benchmarked on recent experience for hours of training relevant to the specific occupation compared with employment in that occupation. These rates are held constant in the baseline forecasts. How plausible then is a 25% increase?
We examined 2004 data to produce the equivalent ratios for the five largest States (New South Wales, Victoria, Queensland, South Australia and Western Australia) for each occupation (at the 3 digit ASCO level) – some States provide a more intensive level of VET per occupation than others.6 Some examples of where VET delivery in New South Wales is below the maximum benchmark follow:
for every person employed in the occupation ‘general clerks’ in New South Wales currently 52 hours of VET are delivered, but the maximum benchmark across the top five States is 71 hours of VET per general clerk employed in Victoria;
for every person employed in the occupation ‘hairdressers’ in New South Wales currently 40 hours of VET are delivered, but the maximum benchmark across the top five States is 99 hours of VET per hairdresser employed in Queensland; and
for every person employed in the occupation ‘process workers’ in New South Wales currently 11 hours of VET are delivered, but the maximum benchmark across the top five States is 40 hours of VET per process worker employed in South Australia.
If one applied the highest rate of continuing training per occupation (selected across the five States) to current New South Wales employment, then current continuing training would be
6 It was not possible for this example to separate out New Apprenticeship hours, so they were included within the continuing training comparison across States.
Future demand for vocational education and training in NSW
69
some 75% higher. That suggests the target chosen (of a 25% increase across the board) is well within what is currently being delivered as a maximum benchmark across States.
Final outcomes for training
Apart from assumptions on additional ‘exogenous’ training, the forecasts include an ‘employment-driven’ component – additional training delivered consistent with the higher employment levels. This additional training is far from controversial – it is benchmarked on, and therefore entirely consistent with, current experience.
Finally, a test of sensibility comes from the final outcomes of the target scenario which certainly seem to be within the plausible range:
VET participation (students as a share of employment) in the target scenario in New South Wales rises to 21.1% in 2025, which is the same as was achieved in 2000.
Average annual growth in the number of NSW VET students over the 20 year projection in the target scenario is 2.28% per annum, which is up on recent levels, but well below the 7.4% per annum lift achieved from 1992 to 2000.
The cost of VET as a share of GSP is projected to rise in the target scenario, but only to 0.60% of GSP in 2025, up from the 2004 estimate of 0.51% of GSP.
Future demand for vocational education and training in NSW
70
9. REFERENCES Ashenfelter, O. and Krueger, A (revised 1993) Estimates of the Economic Return to
Schooling from a New Sample of Twins, Working Paper #304 Industrial Relations Section Princeton University July, 1992.
Bassanini, A, Scarpetta, S and Hemmings, P (2001), OECD Economics Department, Working Paper No. 283, OECD website, http://www.oecd.org/htm/M00034000/M00034866.htm – 2001
Borland, J. (1997), Changes in the Supply of Labour in Australia, in Changing Labour Markets, Productivity Commission, AGPS, Melbourne, pp. 19–44.
Borland, J. and Kennedy, S. (1998), Dimensions, Structure and History of Australian Unemployment, in Unemployment and the Australian Labour Market, Proceedings of a Conference, Reserve Bank of Australia, 1998.
Cully, M (2005), What it’s worth; Establishing the value of vocational qualifications to employers, NCVER
Davis, G. and Ewing, R, (2005) Why has Australia done better than New Zealand? Good luck or good management? Treasury Working Paper, 2005 — 01, January 2005.
Dowrick, S and Rogers, M (2001) Classical and Technological Convergence: beyond the Solow-Swan growth model, School of Economics, Australian National University and Harris Manchester College, Oxford University
Federal Treasury (2003), A Note on Educational Attainment and Labour Force Participation in Australia, Treasury Working Paper 2003-03.
Hamermesh, D. (1993), Labor Demand, Princeton University Press, Princeton, New Jersey.
Henry, K., Treasury Secretary (2004), Policy Strategies for Future Growth, speech on 9 August 2004
Hughes, B. (2000), How fast can Australia grow? Mark II¸ Australian Industry Group, December.
Kennedy, S and Hedley, D, (2003), A Note on Educational Attainment and Labour Force Participation in Australia, Treasury Working Paper 2003-03.
Lamb, S., Davies, M., Polesel, J., and Teese, R. (2003), International indicators for vocational education and training: an Australian perspective, NCVER
Mangan, J. and Williams, C. (1999), Casual Employment in Australia; A Further Analysis, Australian Economic Papers
Miller, P., Mulvey C., Martin, N.G (1995), What do twins tell us about the economic returns to education ? A comparison of Australian and US findings? American Economic Review 85:586-599, 1995. http://genepi.qimr.edu.au/staff/nick_pdf/CV154.pdf
OECD (2003), The Sources of Economic Growth in OECD Countries, OECD, Paris.
Future demand for vocational education and training in NSW
71
Productivity Commission (2005), Economic Implications of an Ageing Australia, Research Report, Productivity Commission, Canberra.
Richardson, S. and Liu, P. (2005), Changing Forms of Employment and Their Implications for the Development of Skills, National Institute of Labour Studies, Flinders University
Treasury (2002), Intergenerational Report, Budget Paper No. 5, 2002.
Wyatt, T. (2004), International benchmarking of vocational education and training, NCVER