Embed Size (px)
Citation preview

Future Climate Scenarios for Kenya’s Tea Growing Areas
Final report
Cali, Managua: April, 2011

I
Table of Contents 1 Authors and contact details ............................................................................................................. 1
2 Executive summary .......................................................................................................................... 1
3 Project Background and Objectives .................................................................................................. 2
4 Key objectives .................................................................................................................................. 3
5 Methodology ................................................................................................................................... 3
5.a Current climate ........................................................................................................................ 3
Bioclimatic variables ........................................................................................................................ 4
5.b Future climate .......................................................................................................................... 5
Global circulation models................................................................................................................. 5
Generation of predictions for future climate .................................................................................... 5
5.c Crop prediction ........................................................................................................................ 6
Maximum Entropy ........................................................................................................................... 6
Ecocrop ........................................................................................................................................... 6
5.d Measure of confidence............................................................................................................. 6
5.e Environmental factors driving change in suitability ................................................................... 7
6 Result I: Climate change summary of tea production sites................................................................ 7
6.a The summary climate characteristics for all tea factory sites in Kenya ...................................... 7
General climatic characteristics........................................................................................................ 7
Extreme conditions .......................................................................................................................... 8
Climate Seasonality .......................................................................................................................... 8
Variability between models ............................................................................................................. 8
6.b Regional changes in the mean annual precipitation (2020) ....................................................... 8
6.c Regional changes in the mean annual precipitation (2050) ....................................................... 9
6.d Regional changes in the mean annual temperature (2020) ....................................................... 9
6.e Regional changes in the mean annual temperature (2050) ..................................................... 10
7 Result II: Suitability maps of tea production areas .......................................................................... 11
7.a Current suitability of tea production areas ............................................................................. 11
7.b Future suitability of tea production areas ............................................................................... 12
7.c Suitability change of tea production areas .............................................................................. 13
8 Result III: Environmental factors which drive the suitability of tea.................................................. 16
9 Result IV: Indications of adaptation strategies................................................................................ 17

II
9.a Identification of potential diversification strategies ................................................................ 17
9.b Suitability of potential diversification crops ............................................................................ 18
Suitability of Coffee (Arabica and Robusta) .................................................................................... 18
Suitability of Maize ........................................................................................................................ 19
Suitability of Pea ............................................................................................................................ 19
Suitability of Cabbage .................................................................................................................... 20
Suitability of Banana ...................................................................................................................... 20
Suitability of Passion fruit .............................................................................................................. 20
10 Conclusions................................................................................................................................ 22
11 References ................................................................................................................................. 22
Annex I: Suitability maps of Gianchore Tea Estate.................................................................................. 23
Annex II: Suitability maps of Imenti Tea Factory ..................................................................................... 24
Annex III: Suitability maps of Kaisugu Tea Estate .................................................................................... 25
Annex IV: Suitability maps of Karirana Tea Estate .................................................................................. 26
Annex V: Suitability maps of Mudete Tea Factory .................................................................................. 27

III
Table of figures
Figure 1: Study zone and Kenya’s tea growing areas ......................................................................................................3
Figure 2: Climate trend summary 2020 and 2050 for sample sites ........................................................................7
Figure 3: Mean annual precipitation change by 2020 for 16 tea-growing districts of Kenya. ..................8
Figure 4: Mean annual precipitation change by 2050 for 16 tea-growing districts of Kenya. ..................9
Figure 5: Mean annual temperature change by 2020 for 16 tea-growing districts of Kenya. ...................9
Figure 6: Mean annual temperature change by 2050 for 16 tea-growing districts of Kenya. ................ 10
Figure 7: Current suitability for tea production within tea-growing districts of Kenya. .......................... 11
Figure 8: Suitability for tea production in 2020. ............................................................................................................ 12
Figure 9: Suitability for tea production in 2050. ............................................................................................................ 12
Figure 10: Mean coefficient of variance of bioclimatic variables in 2020 and 2050. .................................. 13
Figure 11: Suitability change for tea production in 2020......................................................................................... 13
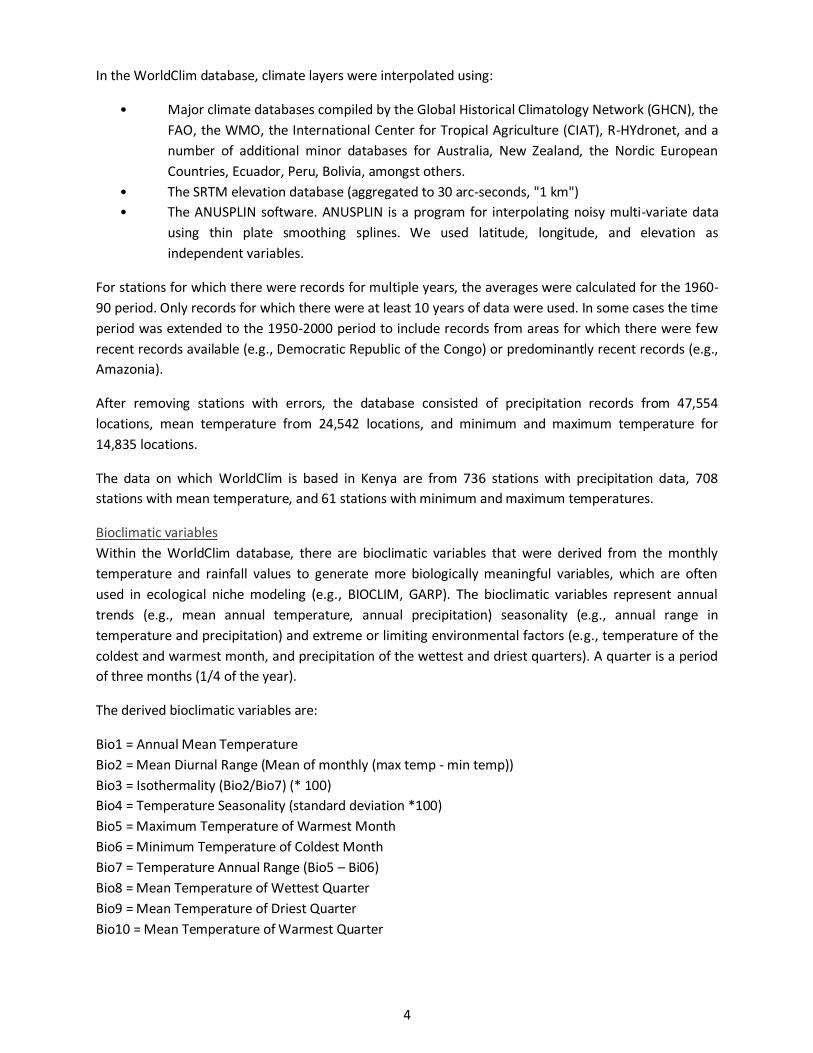
Figure 12: Suitability change for tea production in 2050. ......................................................................................... 14
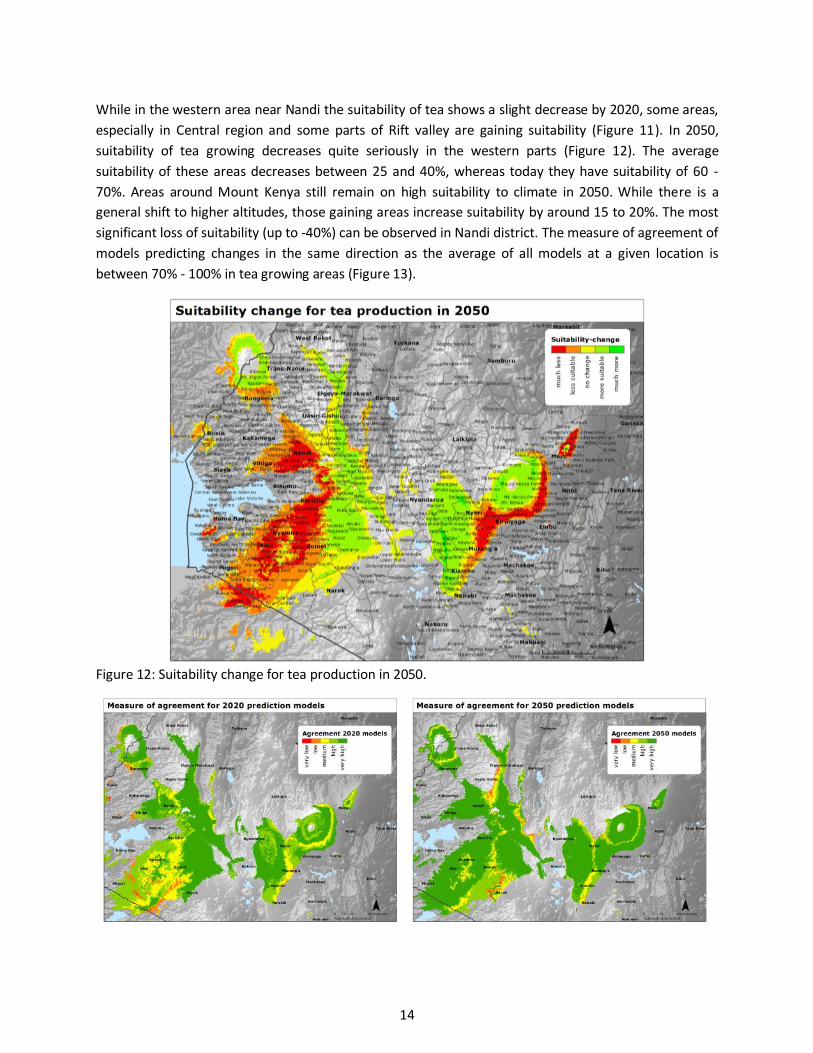
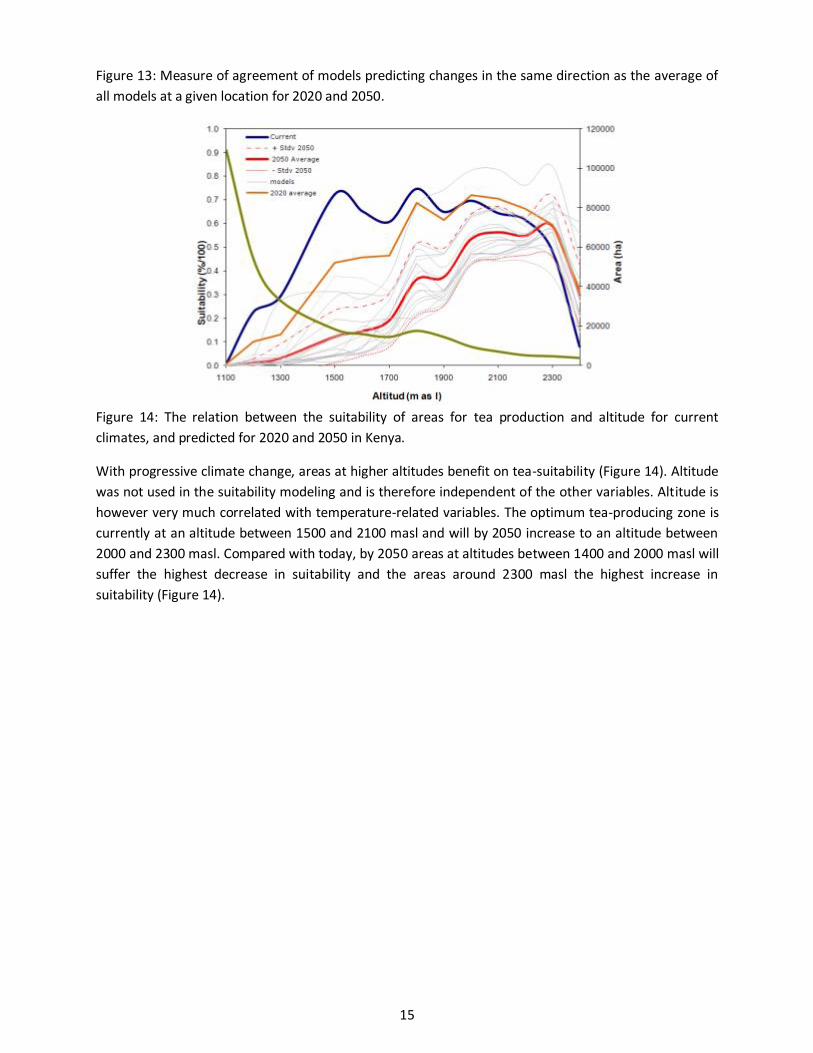
Figure 13: Measure of agreement of models predicting changes in the same direction as the average of all models at a given location for 2020 and 2050..................................................................................................... 15
Figure 14: The relation between the suitability of areas for tea production and altitude for current climates, and predicted for 2020 and 2050 in Kenya. ................................................................................................. 15
Figure 15: Suitability change of Arabica coffee. .............................................................................................................. 18
Figure 16: Suitability change of Robusta coffee. ............................................................................................................. 18
Figure 17: Suitability change of maize. ................................................................................................................................ 19
Figure 18: Suitability change of pea. ..................................................................................................................................... 19
Figure 19: Suitability change of cabbage. ........................................................................................................................... 20
Figure 20: Suitability change of banana. ............................................................................................................................. 20
Figure 21: Suitability change of passion fruit. ................................................................................................................. 20

IV
Table of tables
Table 1: Contribution of different bioclimatic variables to the predicted shift in suitability for tea in Kenya, between the present and the 2020s, separating locations with decreasing and increasing suitabilitya ........................................................................................................................................................................................... 16
Table 2: Contribution of different bioclimatic variables to the predicted shift in suitability for tea in Kenya, between the present and the 2050s, separating locations with decreasing and increasing suitabilitya. .......................................................................................................................................................................................... 17
Table 3: Comparison of suitability change of tea and diversification crops on 85 tea growing factories in Kenya ........................................................................................................................................................................... 21

V
Index of Acronyms
BIOCLIM Bioclimatic Analysis and Prediction System
CIAT International Center for Tropical Agriculture
CV Coefficient of Variation
DAPA Decision and Policy Analysis
ECOCROP The Crop Environmental Requirements Database
ESG Earth System Grid
ETP Ethical Tea Partnership
FAO Food and Agriculture Organization
GARP Genetic Algorithm for Rule-set Production
GBIF Global Biodiversity Information Facility
GCM Global Circulation Model
GHCN Global Historical Climatology Network
GIZ German International Cooperation
GPS Global Position System
IPCC Inter-governmental Panel on Climate Change
Masl Meters above Sea Level
Maxent Maximum entropy
NWP Numerical Weather Prediction
R-HYdroNET A Regional, Electronic Hydrmeteorological Data Network (for Latin America and the
Caribbean)
SPAM Spatial Production Allocation Model
SRES Special Report on Emissions Scenarios
SRTM Shuttle Radar Topographic Mission
WMO World Meteorological Organization
1
1 Authors and contact details
The analyses presented here were conducted by the Decision and Policy Analyses group (DAPA) at CIAT
under the leadership of Anton Eitzinger, with the collaboration of Peter Läderach, Audberto Quiroga,
Antonio Pantoja and Jason Gordon.
For further information please contact:
Dr. Peter Laderach or Anton Eitzinger
International Center for Tropical Agriculture (CIAT)
A.A. 6713, Cali
Colombia
Email: [email protected] and [email protected]
2 Executive summary
This document reports on the methods and results of a consultancy with the title “Future Climate
Scenarios for Kenya’s Tea Growing Areas” conducted for the Ethical Tea Partnership (ETP) and German
International Cooperation GIZ.
The methodology applied was based on the combination of current climate data with future climate
change predictions from 20 models for 2020 and 2050. The data of the current climate and the climate
change was used as input to Maxent, a crop prediction model. The evidence data used for Maxent were
collected by GPS through field work in Kenya.
The analysis focused on the specific municipalities that were of interest to the client and provided
predictions of the future climate and predictions of the suitability of current tea-growing areas to
continue growing tea by 2020 and 2050. The results show that the change in suitability as climate
change occurs is site-specific. There will be areas that become unsuitable for tea (Nandi, Kericho,
Gucha), where farmers will need to identify alternative crops. There will be areas that remain suitable
for tea (Bomet, Kisii, Nyamira), but only when the farmers adapt their agronomic management to the
new conditions the area will experience. There will be areas where suitability of tea increases (Meru,
Embu, Kirinyaga, Nyeri, Murangá, Kiambu). Finally, there will be areas where today no tea is grown but
which in the future will become suitable (especially higher altitudes around Mount Kenya). However
many of these latter areas are usually protected areas and it is not recommended to clear forest or
invade protected areas in order to produce tea. Climate change brings not only bad news but also a lot
of potential. The winners will be those who are prepared for change and know how to adapt.
In Kenya the yearly and monthly rainfall will increase and the yearly and monthly minimum and
maximum temperatures will increase moderately by 2020 and will continue to increase by progressively
2050. The overall climate will become less seasonal in terms of variation throughout the year with
temperature in specific districts increasing by about 1 ºC by 2020 and 2.3 ºC by 2050 and more seasonal
in precipitation with the maximum number of cumulative dry month staying constant at 3 months. The
implications are that the distribution of suitability’s within the current tea-growing areas in Kenya for

2
tea production in general will decrease quite seriously by 2050. The suitable areas will migrate up the
altitudinal gradient. Areas that retain some suitability will see decreases to between 35 and 55%,
compared with today’s suitability of 60 - 80%.
The optimum tea-producing zone is currently at an altitude between 1500 - 2100 meters above sea level
(masl) and, by 2050, will increase to an altitude between 2000 - 2300 masl. Increasing altitude
compensates for the increase in temperature. Compared with today, by 2050 areas at altitudes between
1400 - 2000 masl will suffer the highest decrease in suitability and the areas around 2300 masl the
highest increase in suitability.
A comparison of potential diversification crops recommended by the project show that coffee performs
similar to tea and would not be a good alternative crop. For more than 90% of these sites maize and
cabbage will remain constant and pea will be much more suitable on 97% of this sites. Passion fruit will
be much more suitable on 51% of these sites and banana on 14% of these sites more suitable for 2050.
3 Project Background and Objectives
The Ethical Tea Partnership (ETP) and the German International Cooperation (GIZ) aim to increase
Kenyan tea producers’ resilience to climate change, to secure their future livelihoods and make these
livelihoods more environmentally and economically sustainable. In order to achieve this, the two
partners have formed a 3-year Public-Private Partnership, which will train approximately 10,000
vulnerable Kenyan farmers on the most appropriate adaptation techniques.
The objectives of this study is to develop future climate scenarios indicating the adaptability/suitability
of tea under changing climatic conditions for Kenya’s tea growing zones, and indicating potentials for
alternative crops suitable under predicted climate change.
Currently the tea growing areas in Kenya are in the following districts: Bomet, Embu, Kakamega, Kericho,
Kiambu, Kirinyaga, Kisii, Meru, Murang'a, Nakuru, Nandi, Nithi, Nyamira, Nyeri, Trans-Nzoia and Vihiga

3
Figure 1: Study zone and Kenya’s tea growing areas
4 Key objectives
To predict the change in climate for tea growing areas in Kenya
To predict the impact of progressive climate change on tea suitability in Kenya
To predict the impact of progressive climatic change on the most important diversification crops.
5 Methodology
5.a Current climate
As current climate (baseline) we used historical climate data from www.worldclim.org database
(Hijmans et al., 2005). The WorldClim data are generated through interpolation of average monthly
climate data from weather stations on a 30 arc-second resolution grid (often referred to as "1 km"
resolution). Variables included are monthly total precipitation, and monthly mean, minimum and
maximum temperature, and 19 bioclimatic variables (Hijmans et al., 2005a).
4
In the WorldClim database, climate layers were interpolated using:
• Major climate databases compiled by the Global Historical Climatology Network (GHCN), the
FAO, the WMO, the International Center for Tropical Agriculture (CIAT), R-HYdronet, and a
number of additional minor databases for Australia, New Zealand, the Nordic European
Countries, Ecuador, Peru, Bolivia, amongst others.
• The SRTM elevation database (aggregated to 30 arc-seconds, "1 km")
• The ANUSPLIN software. ANUSPLIN is a program for interpolating noisy multi-variate data
using thin plate smoothing splines. We used latitude, longitude, and elevation as
independent variables.
For stations for which there were records for multiple years, the averages were calculated for the 1960-
90 period. Only records for which there were at least 10 years of data were used. In some cases the time
period was extended to the 1950-2000 period to include records from areas for which there were few
recent records available (e.g., Democratic Republic of the Congo) or predominantly recent records (e.g.,
Amazonia).
After removing stations with errors, the database consisted of precipitation records from 47,554
locations, mean temperature from 24,542 locations, and minimum and maximum temperature for
14,835 locations.
The data on which WorldClim is based in Kenya are from 736 stations with precipitation data, 708
stations with mean temperature, and 61 stations with minimum and maximum temperatures.
Bioclimatic variables
Within the WorldClim database, there are bioclimatic variables that were derived from the monthly
temperature and rainfall values to generate more biologically meaningful variables, which are often
used in ecological niche modeling (e.g., BIOCLIM, GARP). The bioclimatic variables represent annual
trends (e.g., mean annual temperature, annual precipitation) seasonality (e.g., annual range in
temperature and precipitation) and extreme or limiting environmental factors (e.g., temperature of the
coldest and warmest month, and precipitation of the wettest and driest quarters). A quarter is a period
of three months (1/4 of the year).
The derived bioclimatic variables are:
Bio1 = Annual Mean Temperature
Bio2 = Mean Diurnal Range (Mean of monthly (max temp - min temp))
Bio3 = Isothermality (Bio2/Bio7) (* 100)
Bio4 = Temperature Seasonality (standard deviation *100)
Bio5 = Maximum Temperature of Warmest Month
Bio6 = Minimum Temperature of Coldest Month
Bio7 = Temperature Annual Range (Bio5 – Bi06)
Bio8 = Mean Temperature of Wettest Quarter
Bio9 = Mean Temperature of Driest Quarter
Bio10 = Mean Temperature of Warmest Quarter

5
Bio11 = Mean Temperature of Coldest Quarter
Bio12 = Annual Precipitation
Bio13 = Precipitation of Wettest Month
Bio14 = Precipitation of Driest Month
Bio15 = Precipitation Seasonality (Coefficient of Variation)
Bio16 = Precipitation of Wettest Quarter
Bio17 = Precipitation of Driest Quarter
Bio18 = Precipitation of Warmest Quarter
Bio19 = Precipitation of Coldest Quarter
5.b Future climate
Global circulation models
A global circulation model (GCM) is a computer-based model that calculates and predicts what climate
patterns will be in a number of years in the future. GCMs use equations of motion as a numerical
weather prediction (NWP) model, with the purpose of numerically simulating changes in the climate as a
result of slow changes in some boundary conditions (such as the solar constant) or physical parameters
(such as the concentration of greenhouse gases). The model focuses on each grid cell and the transfer of
energy between grid cells. Once the simulation is calculated a number of climate patterns can be
determined; from ocean and wind currents to patterns in precipitation and rates of evaporation that
affect, for example, lake-levels and growth of agricultural plants. The GCMs are run in a number of
specialized computer laboratories around the world. We used data in our analyses from these
laboratories.
Generation of predictions for future climate
The Intergovernmental Panel on Climate Change (IPCC) Fourth Assessment Report was based on the
results of 21 global climate models (GCMs), data for which are available through an IPCC interface, or
directly from the institutions that developed each individual model. The spatial resolution of the GCM
results is inappropriate for analyzing the impacts on agriculture as in almost all cases the grid cells
measure more than 100 km a side. This is especially a problem in heterogeneous landscapes such as
highly mountainous areas, where, in some places, one cell can cover the entire width of the range.
Downscaling is therefore needed to provide higher-resolution surfaces of expected future climates if the
likely impacts of climate change on agriculture are to be more accurately forecast.
We used a simple downscaling method (named delta method), based on the sum of interpolated
anomalies to high resolution monthly climate surfaces from WorldClim (Hijmans et al., 2005a). The
method, basically, produces a smoothed (interpolated) surface of changes in climates (deltas or
anomalies) and then applies this interpolated surface to the baseline climate (from WorldClim), taking
into account the possible bias due to the difference in baselines. The method assumes that changes in
climates are only relevant at coarse scales, and that relationships between variables are maintained
towards the future (Ramirez and Jarvis, 2010).
CIAT downloaded the data from the Earth System Grid (ESG) data portal and applied the downscaling
method on over 19 GCMs from the IPCC Fourth Assessment Report (2007) for the emission scenario

6
SRES-A2 and for 2 different 30 year running mean periods (i.e. 2010-2039 [2020s], 2040-2069 [2050s]).
Each dataset (SRES scenario – GCM – time slice) comprises 4 variables at a monthly time-step (mean,
maximum, minimum temperature, and total precipitation), on a spatial resolution of 30 arc-seconds
(Ramirez and Jarvis, 2010).
5.c Crop prediction
Maximum Entropy
Maximum entropy (MAXENT) is a general-purpose method for making predictions or inferences from
incomplete information. The idea is to estimate a target probability distribution by finding the
probability distribution of maximum entropy, subject to a set of constraints that represent (one’s)
incomplete information about the target distribution. The information available about the target
distribution often presents itself as a set of real-valued variables, called ‘features’, and the constraints
are that the expected value of each feature should match its empirical average -“average value for a set
of sample points taken from the target distribution”(Phillips et al., 2006 pg234). Similar to logistic
regression, MAXENT weights each environmental variable by a constant. The probability distribution is
the sum of each weighed variable divided by a scaling constant to ensure that the probability value
ranges from 0 to 1. The program starts with a uniform probability distribution and iteratively alters one
weight at a time to maximize the likelihood of reaching the optimum probability distribution.
MAXENT is generally considered to be the most accurate model (Elith et al., 2006).
Ecocrop
For most of the crops that are not staples or commodity crops there is a lack of detailed information.
Hijmans et al., (2005b) have developed a mechanistic model based on the Ecocrop database (FAO, 1998
available at http://ecocrop.fao.org/ecocrop/srv/en/home) to spatially predict crop suitability without
having prior knowledge or data available. The model essentially uses minimum, maximum, and mean
monthly temperatures, and total monthly rainfall to determine a suitability index based on each
parameter separately (i.e. temperature, rainfall), to finally determine an overall suitability rating (from 0
to 100) by multiplying both temperature and rainfall indices. Ecocorp does not require any coordinates
or ground data and is therefore rather generic. To improve the results we use existing knowledge of
geographic crop distribution such as the Spatial Production Allocation Model (SPAM), the Global
Biodiversity Information Facility (GBIF), CIAT own databases and expert knowledge gathered on the
ground. With a minimum of 60-100 geo-referenced sample sites gathered across the different sources
we re-calculated the environmental factor ranges to improve the model. GPS-coordinates of the Kenyan
tea growing sample sites are supplied by the project partners.
5.d Measure of confidence
Future crop suitability is predicted using each of the GCM models via Ecocrop algorithms described
above. Two measurements of uncertainty are computed: (1) the agreement among models calculated as
percentage of models predicting changes in the same direction as the average of all models at a given
location and (2) the coefficient of variation (CV) among models. After initial runs, models that are
significantly different from those of the other models according to Tukey’s (1977) outlier test will be
removed from further analysis.

7
5.e Environmental factors driving change in suitability
In order to understand the relative importance of different climatic drivers, we then carried out a
forward, step-wise regression analysis with the suitability shift per data point as the dependent variable
and the model-average changes in the bioclimatic variables between the present and future as the
independent variables, and calculating the relative contribution of each variable to the total predicted
suitability shift in terms of the proportion of R-square explained when adding each variable to the linear
regression model. This analysis was carried out separately for the data points showing positive and
negative shifts in suitability.
6 Result I: Climate change summary of tea production sites
6.a The summary climate characteristics for all tea factory sites in Kenya
Figure 2: Climate trend summary 2020 and 2050 for sample sites
General climatic characteristics
• Rainfall increases from 1658 millimeters to 1732 millimeters in 2050 passing through 1694
in 2020
• Temperatures increase and the average increase is 2.3 ºC passing through an increment of
1.0 ºC in 2020
• The mean daily temperature range keeps constant on 14.8 ºC in 2050
• The maximum number of cumulative dry months keep constant in 3 months

8
Extreme conditions
• The maximum temperature of the year increases from 26.6 ºC to 29 ºC while the warmest
quarter gets hotter by 2.3 ºC in 2050
• The minimum temperature of the year increases from 8.9 ºC to 11.1 ºC while the coldest
quarter gets hotter by 2.5 ºC in 2050
• The wettest month gets wetter with 308 millimeters instead of 304 millimeters, while the
wettest quarter gets wetter by 20 mm in 2050
• The driest month stays constant with around 58 millimeters while the driest quarter gets
wetter by 13 mm in 2050
Climate Seasonality
• Overall this climate becomes less seasonal as it relates to temperature and precipitation
variability through-out the year
Variability between models
• The coefficient of variation of temperature predictions between models is 5%
• Temperature predictions were uniform between models and thus no outliers were detected
• The coefficient of variation of precipitation predictions between models is 4.6%
• Precipitation predictions were uniform between models and thus no outliers were detected
6.b Regional changes in the mean annual precipitation (2020)
Figure 3: Mean annual precipitation change by 2020 for 16 tea-growing districts of Kenya.
The edges of the boxes indicate the mean maximum and mean minimum values and the ends of the line
the maximum and minimum values. The mean maximum and mean minimum values are defined by the
mean + or – the standard deviation.
The mean annual precipitation increases in 2020 on average by 36 mm and in 2050 by 74 mm. In 2020
the districts Meru and Nithi will have larger increase in precipitation than others (Figure 3) and in 2050

9
Kisii and Nyamira will have the largest increase (Figure 4). We observed the smallest increase in
precipitation for 2020 in Kakamega and in 2050 in Embu, Meru, Kirinyaga and Nithi.
6.c Regional changes in the mean annual precipitation (2050)
Figure 4: Mean annual precipitation change by 2050 for 16 tea-growing districts of Kenya.
The edges of the boxes indicate the mean maximum and mean minimum values and the ends of the line
the maximum and minimum values. The mean maximum and mean minimum values are defined by the
mean + or – the standard deviation.
6.d Regional changes in the mean annual temperature (2020)
Figure 5: Mean annual temperature change by 2020 for 16 tea-growing districts of Kenya.

10
The edges of the boxes indicate the mean maximum and mean minimum values and the ends of the line
the maximum and minimum values. The mean maximum and mean minimum values are defined by the
mean + or – the standard deviation.
The mean annual temperature will increase progressively. The increase by 2050 is between 2.1 and 2.2
ºC (Figures 6) and for 2020 between 0.7 and 0.9 ºC (Figures 5).
6.e Regional changes in the mean annual temperature (2050)
Figure 6: Mean annual temperature change by 2050 for 16 tea-growing districts of Kenya.
The edges of the boxes indicate the mean maximum and mean minimum values and the ends of the line
the maximum and minimum values. The mean maximum and mean minimum values are defined by the
mean + or – the standard deviation.

11
7 Result II: Suitability maps of tea production areas
7.a Current suitability of tea production areas
Figure 7: Current suitability for tea production within tea-growing districts of Kenya.
Currently, the main tea-producing areas in Kenya are located in the central region around Mount Kenya
and between the Rift Valley and Nyanza in the west (Figure 7). According to the MAXENT model, the
most suitable of them are concentrated in the higher areas of districts: Meru, Embu, Kirinyaga, Nyeri,
Murangá, Kiambu, Kisii, Nyamira, Kericho, Bomet, Narok, Migori. The remaining districts are in general
rather less suitable.
Find more detailed maps of current and future tea suitability in focal regions in Annex I to V.

12
7.b Future suitability of tea production areas
Figure 8: Suitability for tea production in 2020.
Figure 9: Suitability for tea production in 2050.

13
In 2020 suitable areas start shifting but the average suitability in all districts remains nearly constant
(Figure 8). We assume that most areas will still be suitable enough to grow tea under similar climate
conditions. In 2050 tea production according to its climate-suitability is predicted to be more
concentrated in Central Kenya (Figure 9). In this region, areas with high suitable will expand. The
western region in general is anticipated to have a lower suitability level. The coefficient of variance (CV)
for 2020 and 2050 bioclimatic variables ranges between 0 and 15%, even lower for tea-growing areas
and may therefore be accepted as reliable (Figure 10).
Figure 10: Mean coefficient of variance of bioclimatic variables in 2020 and 2050.
7.c Suitability change of tea production areas
Figure 11: Suitability change for tea production in 2020.
14
While in the western area near Nandi the suitability of tea shows a slight decrease by 2020, some areas,
especially in Central region and some parts of Rift valley are gaining suitability (Figure 11). In 2050,
suitability of tea growing decreases quite seriously in the western parts (Figure 12). The average
suitability of these areas decreases between 25 and 40%, whereas today they have suitability of 60 -
70%. Areas around Mount Kenya still remain on high suitability to climate in 2050. While there is a
general shift to higher altitudes, those gaining areas increase suitability by around 15 to 20%. The most
significant loss of suitability (up to -40%) can be observed in Nandi district. The measure of agreement of
models predicting changes in the same direction as the average of all models at a given location is
between 70% - 100% in tea growing areas (Figure 13).
Figure 12: Suitability change for tea production in 2050.
15
Figure 13: Measure of agreement of models predicting changes in the same direction as the average of
all models at a given location for 2020 and 2050.
Figure 14: The relation between the suitability of areas for tea production and altitude for current
climates, and predicted for 2020 and 2050 in Kenya.
With progressive climate change, areas at higher altitudes benefit on tea-suitability (Figure 14). Altitude
was not used in the suitability modeling and is therefore independent of the other variables. Altitude is
however very much correlated with temperature-related variables. The optimum tea-producing zone is
currently at an altitude between 1500 and 2100 masl and will by 2050 increase to an altitude between
2000 and 2300 masl. Compared with today, by 2050 areas at altitudes between 1400 and 2000 masl will
suffer the highest decrease in suitability and the areas around 2300 masl the highest increase in
suitability (Figure 14).

16
8 Result III: Environmental factors which drive the suitability of tea
The regression analysis identifies primarily the bioclimatic variables related to precipitation increase and
general increasing temperature as drivers of the predicted suitability shifts.
The increases of precipitation and min temperature during the cold season together with Isothermality
(quantification of how large the day-to-night temperature oscillation is in comparison to the summer-to-
winter oscillation) explain 97.5% of decreasing suitability for 2020.
The 45% of observed locations with increasing suitability for 2020 are influenced by increasing
precipitation during the wet season and a general annual and precipitation increase (Table 1).
Table 1: Contribution of different bioclimatic variables to the predicted shift in suitability for tea in Kenya, between the present and the 2020s, separating locations with decreasing and increasing suitabilitya
Variable Adjusted R2
R2 due to variable
% of total variability
Present mean
Change by 2020s
Locations with decreasing suitability (n=61, 55 % of all observations)
BIO 19 – Precipitation of coldest quarter 0.6176 0.6176 76.4 295 mm + 31 mm
BIO 03 – Isothermality 0.7314 0.1138 14.1 85 - 2
BIO 06 – Min temperature of coldest month 0.7876 0.0562 7.0 10.0 °C + 1.0 °C
others - - 2.5
Locations with constant or increasing suitability (n=50, 45 % of all observations)
BIO 16 – Precipitation of wettest quarter 0.2897 0.1298 31.1 706 mm + 12 mm
BIO 12 – Annual precipitation 0.1042 0.1042 25.0 1620 mm + 41 mm
BIO 01 – Annual mean temperature 0.1577 0.0535 12.8 16.9 °C + 0.8 °C
BIO 17 – Precipitation of driest quarter 0.3759 0.0519 12.4 192 mm + 5 mm
BIO 19 – Precipitation of coldest quarter 0.4170 0.0411 9.9 263 mm + 1 mm
BIO 08 – Mean temperature of wettest quarter 0.3240 0.0343 8.2 17.4 °C + 0.7 °C
others - - 0.6
aVariables explaining less than 4% of total variability are not listed.
The regression analysis for changes in suitability on observed sample points for 2050 describes
temperature seasonality as main driving factor for negative suitability change (Table 2). Increasing
precipitations explain 89.9% of positive suitability change for 22.5% of observed points.

17
Table 2: Contribution of different bioclimatic variables to the predicted shift in suitability for tea in Kenya, between the present and the 2050s, separating locations with decreasing and increasing suitabilitya
.
Variable Adjusted R2
R2 due to variable
% of total variability
Present mean
Change by 2050s
Locations with decreasing suitability (n=86, 77.5% of all observations)
BIO 04 – Temperature seasonality 0.3308 0.3308 55.1 680 - 20
BIO 16 – Precipitation of wettest quarter 0.3804 0.0496 8.3 605 mm + 24 mm
BIO 18 – Precipitation of warmest quarter 0.5497 0.0360 6.0 374 mm + 35 mm
BIO 03 – Isothermality 0.4153 0.0349 5.8 84.6 - 1.5
BIO 19 – Precipitation of coldest quarter 0.4726 0.0292 4.9 307 mm + 47 mm
BIO 09 – Mean temperature od friest quarter 0.4434 0.0281 4.7 18.7 °C + 2.1 °C
BIO 13 – Precipitation of wettest month 0.5003 0.0277 4.6 253 mm + 7 mm
others - - 10.6
Locations with constant or increasing suitability (n=25, 22.5% of all observations)
BIO 18 – Precipitation of warmest quarter 0.5459 0.5459 66.6 542 mm + 7 mm
BIO 12 – Annual precipitation 0.8194 0.1909 23.3 1635 mm + 69 mm
BIO 01 – Annual mean temperature 0.6285 0.0485 5.9 15.9 °C + 2.1°C
BIO 03 – Isothermality 0.5800 0.0341 4.2 79 - 1.2
others - - 0
aVariables explaining less than 4% of total variability are not listed.
9 Result IV: Indications of adaptation strategies
9.a Identification of potential diversification strategies
To address potential diversification strategies for tea farms affected by progressive climate change on
their tea production we identified six crops1:
- Maize
- Pea (pigeon variety)
- Cabbage
1 In this work just crops were analyzed. Beyond that, dairy cow and dairy goats are potential diversification enterprises for tea
farmers in Kenya.

18
- Banana
- Passion fruit
- Coffee (Arabica and Robusta)
Because of a lack of detailed information from GPS ground data suitability of alternative crops,
except coffee, were calculated using a mechanistic model based on the Ecocrop database. We
improved the model by using existing knowledge of geographic crop distribution and calibrated the
input-values on a regional scale. Suitability for coffee comes from previous CIAT work in Kenya,
“Climate Change Adaptation and Mitigation in the Kenyan Coffee Sector” (Laderach et al., 2010),
and was calculated same as tea by using the MaxEnt approach.
9.b Suitability of potential diversification crops
Suitability of Coffee (Arabica and Robusta)
Figure 15: Suitability change of Arabica coffee.
Figure 16: Suitability change of Robusta coffee.
Robusta coffee has its suitable areas in lower altitudes than tea and therefore would not be a
diversification crop. Therefore we analyzed Arabica coffee.

19
Suitability of Maize
Figure 17: Suitability change of maize.
While suitability of maize (Figure 16) and cabbage (Figure 18) remains constant, Arabica coffee is losing
most of its suitability in the same areas as tea by 2050 (Figure 15). Pea performs quite well on predicted
changes (Figure 17) in general but especially in tea-growing regions, whereas banana has its suitable
areas in lower altitudes than tea (Figure 19) and results of increasing passion-fruit suitability-change
match with areas where tea is losing its suitability (Figure 20).
Suitability of Pea
Figure 18: Suitability change of pea.

20
Suitability of Cabbage
Figure 19: Suitability change of cabbage.
Suitability of Banana
Figure 20: Suitability change of banana.
Suitability of Passion fruit
Figure 21: Suitability change of passion fruit.

21
Table 3: Comparison of suitability change of tea and diversification crops on 85 tea growing factories in
Kenya
Table 3 compares suitability change for tea growing factories and their potential for diversification into
other crops. As mentioned above coffee (arabica) performs similar (even worse) to tea and would not be
a good alternative crop to tea. While on 42% of all tea factory sites suitability of tea is predicted to be
much less for 2050, on 97% of these sites suitability of coffee will be also much less, for more than 90%
of these sites maize and cabbage will remain constant and pea will be much more suitable on 97% of
this sites. Passion-fruit will be much more suitable on 51% of these sites and banana on 14% of these
sites more suitable for 2050.

22
10 Conclusions
In Kenya the yearly and monthly rainfall will increase and the yearly and monthly minimum and
maximum temperatures will increase by 2020 and will continue to increase progressively by
2050.
The implications are that the distribution of suitability within the current tea-growing areas in
Kenya for tea production in general will decrease quite seriously by 2050.
The optimum tea-producing zone is currently at an altitude between 1500 and 2100 masl and
will by 2050 increase to an altitude between 2000 and 2300 masl.
Compared with today, by 2050 areas at altitudes between 1400 and 2000 masl will suffer the
highest decrease in suitability and the areas around 2300 masl the highest increase in suitability.
A comparison of potential diversification crops recommended by the project shows that coffee
performs similar to tea and would not be a good alternative crop. For more than 90% of these
sites maize and cabbage will remain constant and pea will be much more suitable on 97% of
these sites. Passion fruit will be much more suitable on 51% of these sites and banana will be
more suitable on 14% of these sites for 2050.
11 References
Elith, J., Graham, C.H., Anderson, R.P., Dudík, M., Ferrier, S., Guisan, A., Hijmans, R.J., Huettmann, F., Leathwick, R., Lehmann,
A., Li, J., Lohmann, L.G., Loiselle, B.A., Manion, G., Moritz, C., Nakamura, M., Nakazawa,Y., Overton, J.McC., Peterson, A.T., Phillips, J., Richardson, K., Scachetti-Pereira, R., Schapire, E., Soberon, J., Williams, S., Wisz, M., Zimmermann, E. 2006. Novel methods improve prediction of species' distributions from occurrence data. Ecography 29:129-151.
Hijmans, R.J., S.E. Cameron, J.L. Parra, P.G. Jones, and A. Jarvis. 2005a. Very high resolution interpolated climate surfaces
for global land areas. International Journal of Climatology 25:1965. Hijmans, R.J., L. Guarino, A. Jarvis, R. O'Brien, P. Mathur, C. Bussink, M. Cruz, I. Barrantes, and E. Rojas. 2005b. DIVA-GIS
Version 5.2, Manual. Laderach, P., A. Eitzinger, O. Ovalle, J. Ramírez and A. Jarvis. 2010. Climate Change Adaptation and Mitigation in the
Kenyan Coffee. Final report. Phillips, S.J., R.P. Anderson, and R.E. Schapire. 2006. Maximum entropy modeling of species geographic distributions.
Ecological Modelling 190:231-259. Ramirez & Jarvis. 2010. Disaggregation of Global Circulation Model Outputs. Disaggregation of Global Circulation Model
Outputs. http://gisweb.ciat.cgiar.org/GCMPage/ Tukey J.W. (1977) Exploratory data analysis. Addison-Wesley Publishing Co., Reading, MA.

23
Annex I: Suitability maps of Gianchore Tea Estate
24
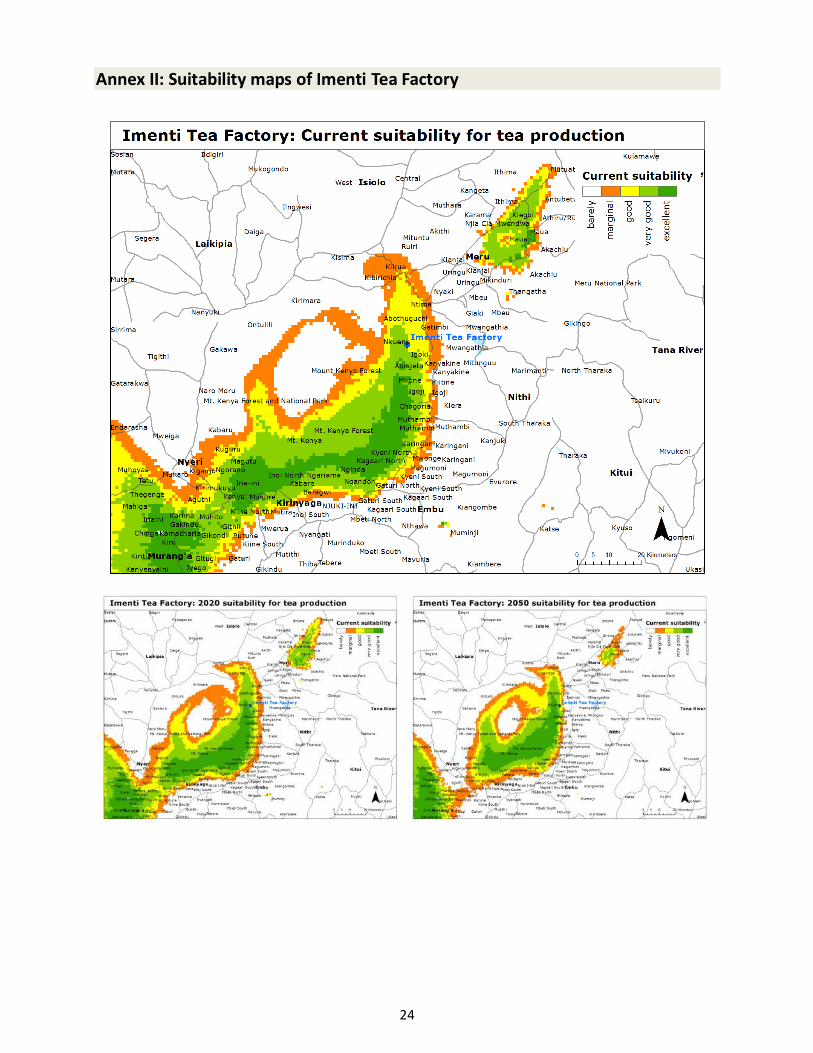
Annex II: Suitability maps of Imenti Tea Factory

25
Annex III: Suitability maps of Kaisugu Tea Estate

26
Annex IV: Suitability maps of Karirana Tea Estate

27
Annex V: Suitability maps of Mudete Tea Factory