Embed Size (px)
Citation preview

Fusion Analysis: Integrating Neurally Enhanced
Fundamental Analysis, Technical Analysis and Corporate
Governance in the Context of a Stock Market Trading System
Safwan Mohd Nor DiA (UiTM), BA (Hons) AFS (UCLan), MFA (LTU), CFTP
Thesis submitted in fulfilment of the requirements for the degree of
Doctor of Philosophy
Finance and Financial Services Discipline Group
College of Business
Victoria University, Melbourne
2014

ii
Abstract
This thesis examines the trading performance of a novel fusion strategy that amalgamates
neurally enhanced financial statement analysis (traditional fundamental analysis),
corporate governance analysis (new fundamental research) and technical analysis in the
context of a full-fledged stock market trading system. In doing so, we build and
investigate the trading ability of five mechanical trading systems: (1) (traditional)
fundamental analysis; (2) corporate governance analysis; (3) technical analysis; (4)
classical fusion analysis (a hybrid of only fundamental and technical rules) and (5) novel
fusion analysis (a hybrid of fundamental, corporate governance and technical rules) in an
emerging stock market, the Bursa Malaysia. To construct the full-fledged trading systems,
we employ a backpropagation algorithm in enhancing buy/sell rules, and also include
anti-Martingale (position sizing) and stop loss (risk management) strategies.
In providing valid empirical results, we compare the trading performance of each
trading system using out-of-sample analysis in the presence of a realistic budget, sample
portfolio, short selling restriction, round lot constraint and transaction cost. The effects
of data snooping, survivorship and look-ahead biases are also addressed and mitigated.
The results show that all the trading systems produce significant returns and are able to
outperform the benchmark buy-and-hold strategy. The classical fusion strategy yields
the greatest dollar returns over any other strategies and better risk-return tradeoffs over
the constituent trading systems. As expected, the novel fusion approach, which uses
governance information to complement the classical fusion strategy, yields the best
performance. It produces the best key metrics—for example, the highest Sharpe and
Sortino ratios, and the lowest maximum percentage drawdown and ulcer index—
compared to all other trading systems. The evidence supports the superiority of this
novel fusion approach. Overall, the results are in line with the castle in the air and firm
foundation theories and are thus inconsistent with the weak and semi-strong forms of
the efficient market hypothesis.

iii
Student�Declaration�
I, Safwan Mohd Nor, declare that the PhD thesis entitled Fusion Analysis: Integrating
Neurally Enhanced Fundamental Analysis, Technical Analysis and Corporate
Governance in the Context of a Stock Market Trading System is no more than 100,000
words in length including quotes and exclusive of tables, figures, appendices, references
and footnotes. This thesis contains no material that has been submitted previously, in
whole or in part, for the award of any other academic degree or diploma. Except where
otherwise indicated, this thesis is my own work.
March 2014
Signature Date
Signature

iv
Acknowledgments
This thesis would not have been possible without the support of numerous people. First
and foremost, I would like to express my gratitude to my supervisors, Professor
Terrence Hallahan and Dr Guneratne Wickremasinghe, for their advice, guidance and
support. I also thank Professor Peter Sheehan and Professor Sardar Islam for their
comments, suggestions, and for affording me the opportunity to work as a research
assistant at the Centre for Strategic Economic Studies. I am grateful to Ms Tina Jeggo
for her help in facilitating this study. Thanks also to my fellow PhD students,
particularly Dr Siti Nuryanah (who also acts as the university Research Ambassador),
for their friendship and the collaborative learning experience.
This thesis benefits from my several years of experience as a Bursa Malaysia dealer,
where I was licensed by the Securities Commission of Malaysia (SC). I am thankful to
Dr Nordin Ngadimun, Manager at the SC and an old acquaintance, who was instrumental
in helping me confirm my decision to embark on my career in the finance industry. My
appreciation goes to my former employer, Kuala Lumpur City Securities (now Alliance
Investment Bank), for whom I had the opportunity to give investment advice and execute
trading transactions. Some of the strategies presented in this study were contributed by
this experience, and the study itself was partly inspired by research insights provided by
our research division and its research partner, Merrill Lynch.
The next chapter of my career brought me to the world of academia. I am particularly
grateful to Associate Professor Fauziah Abu Hasan and Mrs Fatimah Shahman for
successfully persuading me to join the University of Malaysia Terengganu (UMT). This
is truly a right career choice, providing me with the lifelong dream to pursue my PhD
and with avenues to undertake research in the area of finance. My thanks go to the
Ministry of Higher Education, Malaysia, and UMT for their financial support and for
giving me the opportunity to further my education at Victoria University, Melbourne,
Australia. I also appreciate the help and support from my current and former deans and
heads of department at UMT.

v
The greatest support undeniably comes from my family. I thank my parents for instilling
in me the value of knowledge, their continuous support during my study, and their
prayers for my success. I am also grateful to my siblings who have supported me in many
ways. Special thanks to my wife, Nur Haiza, who has unfailingly stood by me throughout
this long journey with love and patience, and for her numerous contributions to the
success of this project, including her constant encouragement and feedback. It is very
challenging, but equally rewarding, for us both to be doing our PhDs at the same time.
Finally, thanks to my daughter, Alia Zulaikha, to whom this thesis is dedicated, who
brings so much happiness and joy to our lives.
This thesis was edited by Elite Editing, and editorial intervention was restricted to
Standards D and E of the Australian Standards for Editing Practice.

vi
Table of Contents
Abstract ............................................................................................................................. ii
Student Declaration ......................................................................................................... iii
Acknowledgments ............................................................................................................iv
Table of Contents .............................................................................................................vi
List of Tables ....................................................................................................................xi
List of Figures ................................................................................................................ xiii
List of Abbreviations ......................................................................................................xiv
Chapter 1: Introduction .................................................................................................. 1
1.1 Introduction ......................................................................................................... 1
1.2 Background and Motivation ............................................................................... 2
1.3 Market Efficiency ............................................................................................... 5
1.4 Research Objectives ............................................................................................ 8
1.5 Overview of the Research ................................................................................... 9
1.5.1 List of Trading Systems ............................................................................... 9
1.5.2 Data and Methodology .............................................................................. 10
1.5.3 Context of the Study .................................................................................. 11
1.5.4 Empirical Results ....................................................................................... 12
1.5.5 Contribution and Significance of the Study .............................................. 13
1.6 Structure of the Thesis ...................................................................................... 14
Chapter 2: Literature Review ...................................................................................... 16
2.1 Introduction ....................................................................................................... 16
2.2 Major Trading Strategies .................................................................................. 17
2.2.1 Fundamental Analysis ............................................................................... 18
2.2.1.1 Definition ........................................................................................... 18
2.2.1.2 Strategy in Practice ............................................................................ 19
2.2.1.3 Existing Literature .............................................................................. 19
2.2.2 Corporate Governance Analysis ................................................................ 27
2.2.2.1 Definition ........................................................................................... 27
2.2.2.2 Strategy in Practice ............................................................................ 28
2.2.2.3 Existing Literature .............................................................................. 29
2.2.3 Technical Analysis .................................................................................... 33
2.2.3.1 Definition ........................................................................................... 33

vii
2.2.3.2 Strategy in Practice ............................................................................ 34
2.2.3.3 Existing Literature .............................................................................. 36
2.2.4 Fusion Analysis ......................................................................................... 43
2.2.4.1 Definition ........................................................................................... 43
2.2.4.2 Strategy in Practice ............................................................................ 44
2.2.4.3 Existing Literature .............................................................................. 45
2.3 Research Contributions ..................................................................................... 51
2.3.1 Limitations and Knowledge Gap ............................................................... 51
2.3.2 Contributions of the Study ......................................................................... 54
2.4 Conclusion ........................................................................................................ 55
Chapter 3: Conceptual Framework and Research Methodology ............................. 56
3.1 Introduction ....................................................................................................... 56
3.2 Conceptual Framework ..................................................................................... 57
3.2.1 Elements of the Framework ....................................................................... 57
3.2.2 Propositions and Hypotheses ..................................................................... 61
3.3 Data ................................................................................................................... 66
3.3.1 Sample and Timeframe .............................................................................. 66
3.3.2 Data Source ............................................................................................... 67
3.3.3 Dataset Constructions ................................................................................ 68
3.3.4 Data Partitioning ........................................................................................ 69
3.4 Software and Hardware..................................................................................... 70
3.5 Neural Network Modelling ............................................................................... 70
3.5.1 Inputs ......................................................................................................... 70
3.5.1.1 Fundamental Indicators ...................................................................... 71
3.5.1.2 Corporate Governance Indicators....................................................... 72
3.5.1.3 Technical Indicators ........................................................................... 74
3.5.2 Network Process and Architecture ............................................................ 76
3.5.3 Output ........................................................................................................ 78
3.6 Full-fledged Trading Systems ........................................................................... 79
3.6.1 Entry and Exit Rules .................................................................................. 79
3.6.1.1 Individual Trading Systems ............................................................... 80
3.6.1.2 Fusion Trading Systems ..................................................................... 80
3.6.2 Position Sizing ........................................................................................... 83
3.6.3 Risk Control ............................................................................................... 83
3.7 Realistic Settings and Constraints ..................................................................... 85
3.8 Performance Evaluation .................................................................................... 86

viii
3.8.1 Buy-and-Hold ............................................................................................ 87
3.8.2 Trading Metrics ......................................................................................... 87
3.8.2.1 General Trading Metrics .................................................................... 88
3.8.2.2 Key Trading Metrics .......................................................................... 89
3.8.3 Statistical Analysis .................................................................................... 92
3.9 Conclusions ....................................................................................................... 94
Chapter 4: Trading Performance of Fundamental, Corporate Governance and
Technical Analysis ......................................................................................................... 96
4.1 Introduction ....................................................................................................... 96
4.2 Fundamental Analysis ....................................................................................... 97
4.2.1 Model Design ............................................................................................ 97
4.2.1.1 Training Data ..................................................................................... 97
4.2.1.2 Training Process ................................................................................. 99
4.2.1.3 Trading Rules ................................................................................... 100
4.2.2 Empirical Results ..................................................................................... 102
4.2.2.1 Statistical Analysis ........................................................................... 104
4.2.2.2 Trading Metrics ................................................................................ 107
4.3 Corporate Governance Analysis ..................................................................... 110
4.3.1 Model Design .......................................................................................... 110
4.3.1.1 Training Data ................................................................................... 110
4.3.1.2 Training Process ............................................................................... 112
4.3.1.3 Trading Rules ................................................................................... 113
4.3.2 Empirical Results ..................................................................................... 115
4.3.2.1 Statistical Analysis ........................................................................... 117
4.3.2.2 Trading Metrics ................................................................................ 119
4.4 Technical Analysis .......................................................................................... 120
4.4.1 Model Design .......................................................................................... 121
4.4.1.1 Training Data ................................................................................... 121
4.4.1.2 Training Process ............................................................................... 123
4.4.1.3 Trading Rules ................................................................................... 124
4.4.2 Empirical Results ..................................................................................... 125
4.4.2.1 Statistical Analysis ........................................................................... 127
4.4.2.2 Trading Metrics ................................................................................ 129
4.5 Discussion of Results ...................................................................................... 130
4.6 Conclusion ...................................................................................................... 135

ix
Chapter 5: Trading Performance of Classical and Novel Fusion Analysis ............ 136
5.1 Introduction ..................................................................................................... 136
5.2 Classical Fusion Analysis ............................................................................... 136
5.2.1 Model Design .......................................................................................... 137
5.2.1.1 Merging Neural Networks ................................................................ 137
5.2.1.2 Trading Rules ................................................................................... 137
5.2.2 Empirical Results ..................................................................................... 138
5.2.2.1 Statistical Analysis ........................................................................... 140
5.2.2.2 Trading Metrics ................................................................................ 142
5.3 Novel Fusion Analysis .................................................................................... 143
5.3.1 Model Design .......................................................................................... 144
5.3.1.1 Merging Neural Networks ................................................................ 144
5.3.1.2 Trading Rules ................................................................................... 144
5.3.2 Empirical Results ..................................................................................... 146
5.3.2.1 Statistical Analysis ........................................................................... 148
5.3.2.2 Trading Metrics ................................................................................ 150
5.4 Discussion and Performance Comparison ...................................................... 152
5.5 Additional Comments and Comparison .......................................................... 159
5.6 Conclusion ...................................................................................................... 162
Chapter 6: Conclusion and Implications ................................................................... 163
6.1 Introduction ..................................................................................................... 163
6.2 Summary of Results ........................................................................................ 163
6.2.1 Fundamental Analysis ............................................................................. 164
6.2.2 Corporate Governance Analysis .............................................................. 164
6.2.3 Technical Analysis .................................................................................. 165
6.2.4 Classical Fusion Analysis ........................................................................ 165
6.2.5 Novel Fusion Analysis ............................................................................ 166
6.3 Implications of the Study ................................................................................ 167
6.3.1 Implications for Theory ........................................................................... 167
6.3.2 Implications for Practice .......................................................................... 169
6.3.3 Implications for Public Policy ................................................................. 171
6.4 Limitations of the Study ................................................................................. 174
6.5 Suggestions for Future Research .................................................................... 175
References ..................................................................................................................... 179

x
Appendix ....................................................................................................................... 198
Appendix I: FA-NNTS Returns Distributions ........................................................... 198
Appendix II: CG-NNTS Returns Distributions ......................................................... 199
Appendix III: TA-NNTS Returns Distributions ........................................................ 200
Appendix IV: CFUS-NNTS Returns Distributions ................................................... 201
Appendix V: FUSION-NNTS Returns Distributions ................................................ 202

xi
List of Tables
Table 1.1 Summary of Neurally Enhanced Stock Market Trading Systems and the
Benchmark Strategy ........................................................................................ 9
Table 3.1 Summary of Propositions and Hypotheses ..................................................... 62
Table 3.2 FA-NN Input Indicators ................................................................................. 71
Table 3.3 CG-NN Input Indicators ................................................................................. 73
Table 3.4 TA-NN Input Indicators ................................................................................. 75
Table 3.5 Key Trading Metrics ...................................................................................... 91
Table 4.1 Descriptive Statistics of Fundamental Variables ............................................ 97
Table 4.2 Descriptive Statistics of FA-NN Input Variables ........................................... 98
Table 4.3 Descriptive Statistics of FA-NN Target Variable .......................................... 98
Table 4.4 FA-NN Performance Evaluation .................................................................. 100
Table 4.5 FA-NNTS Out-of-sample Performance ....................................................... 103
Table 4.6 FA-NNTS Test for Normality ...................................................................... 104
Table 4.7 FA-NNTS Test for Serial Independence ...................................................... 105
Table 4.8 FA-NNTS Statistical Results ........................................................................ 106
Table 4.9 Descriptive Statistics of Corporate Governance Variables .......................... 111
Table 4.10 Descriptive Statistics of CG-NN Input Variables ...................................... 112
Table 4.11 Descriptive Statistics of CG-NN Target Variable ...................................... 112
Table 4.12 CG-NN Performance Evaluation ................................................................ 114
Table 4.13 CG-NNTS Out-of-sample Performance ..................................................... 116
Table 4.14 CG-NNTS Test for Normality .................................................................... 117
Table 4.15 CG-NNTS Test for Serial Independence .................................................... 118
Table 4.16 CG-NNTS Statistical Results ..................................................................... 118
Table 4.17 Descriptive Statistics of Technical Variables ............................................. 121
Table 4.18 Descriptive Statistics of TA-NN Input Variables ....................................... 122
Table 4.19 Descriptive Statistics of TA-NN Target Variable ...................................... 123
Table 4.20 TA-NN Performance Evaluation ................................................................ 124
Table 4.21 TA-NNTS Out-of-sample Performance ..................................................... 126
Table 4.22 TA-NNTS Test for Serial Independence .................................................... 127
Table 4.23 TA-NNTS Statistical Results ..................................................................... 128
Table 5.1 CFUS-NNTS Out-of-sample Performance .................................................. 139

xii
Table 5.2 CFUS-NNTS Test for Serial Independence ................................................. 140
Table 5.3 CFUS-NNTS Statistical Results ................................................................... 141
Table 5.4 FUSION-NNTS Out-of-sample Performance .............................................. 147
Table 5.5 FUSION-NNTS Test for Normality ............................................................. 148
Table 5.6 FUSION-NNTS Test for Serial Independence ............................................. 149
Table 5.7 FUSION-NNTS Statistical Results .............................................................. 149
Table 5.8 Summary Performance of the Trading Systems ........................................... 153
Table 5.9 Summary Performance of the FTSE Bursa Malaysia and Dow Jones
Indices versus the Best and the Least Performing Trading Systems ........... 161

xiii
List of Figures
Figure 3.1 Conceptual Framework for the Neurally Enhanced Full-Fledged Trading
Systems and the Construction of the Novel Fusion Approach ...................... 59
Figure 3.2 Propositions and Hypotheses: Comparing Trading Systems ........................ 65
Figure 3.3 Neural Network Architecture ........................................................................ 77
Figure 3.4 Blueprint for the Individual Trading Rules ................................................... 80
Figure 3.5 Blueprint for the CFUS-NN Trading Rule .................................................... 81
Figure 3.6 Blueprint for the FUSION-NN Trading Rule ............................................... 82
Figure 4.1 FA-NN Training Error .................................................................................. 99
Figure 4.2 Pseudo Code for the FA-NN Trading Rule ................................................. 101
Figure 4.3 FA-NNTS Drawdown Curve (Underwater Equity Curve) ......................... 109
Figure 4.4 CG-NN Training Error ................................................................................ 113
Figure 4.5 Pseudo Code for the CG-NN Trading Rule ................................................ 115
Figure 4.6 CG-NNTS Drawdown Curve (Underwater Equity Curve) ......................... 120
Figure 4.7 TA-NN Training Error ................................................................................ 123
Figure 4.8 Pseudo Code for the TA-NN Trading Rule ................................................ 125
Figure 4.9 TA-NNTS Drawdown Curve (Underwater Equity Curve) ......................... 129
Figure 4.10 MAEs of Individual Trading Systems....................................................... 134
Figure 5.1 Pseudo Code for the CFUS-NN Trading Rule ............................................ 138
Figure 5.2 CFUS-NNTS Drawdown Curve (Underwater Equity Curve) .................... 142
Figure 5.3 Pseudo Code for the FUSION-NN Trading Rule ....................................... 145
Figure 5.4 FUSION-NNTS Drawdown Curve (Underwater Equity Curve) ................ 151
Figure 5.5 MAEs of Fusion Trading Systems .............................................................. 158

xiv
List of Abbreviations
%B Percent Bollinger
ABDC Australian Business Dean Council
ABS Absolute Value
ADX Average Directional Movement Index
AMEX American Stock Exchange
ANFIS Adaptive Neuro-Fuzzy Inference System
ANN Artificial Neural Network
APR Annual Percentage Return
APT Arbitrage Pricing Theory
AR Autoregressive Model
ARIMA Autoregressive Integrated Moving Average
ASE Athens Stock Exchange
ASEAN Association of Southeast Asian Nations
ASX Australian Stock Exchange
ATR Average True Range
B&H Buy-and-Hold
BIGN Big N Accounting Firms
BSIZE Board Size
BV Book Value per Share
CAGR Compounded Annual Growth Rate
CAPM Capital Asset Pricing Model
CEO Chief Executive Officer
CFA Chartered Financial Analyst
CFUS-NN Classical Fusion Neural Network
CFUS-NNTS Neurally Enhanced Classical Fusion Trading System
CG-NN Corporate Governance Neural Network
CG-NNTS Neurally Enhanced Corporate Governance Trading System
CGR Corporate Governance Rating
CMT Chartered Market Technician
CORE Operating Income (or Core Earnings)
CPE Continuing Professional Education

xv
CPU Central Processing Unit
CRSP Center for Research in Security Prices
D Fractal Dimension
DAX 30 Deutscher Aktien Index
DJIA Dow Jones Industrial Average
DJMY 25 Dow Jones Islamic Market Malaysia Titans 25
DPR Dividend Payout Ratio
DPS Dividend per Share
DUAL CEO Duality
EGARCH Exponential GARCH (see GARCH)
EMH Efficient Market Hypothesis
EMU European Monetary Union
EPS Earnings per Share
FA-NN Fundamental Neural Network
FA-NNTS Neurally Enhanced Fundamental Trading System
FBM 100 FTSE Bursa Malaysia Top 100
FBM 30 FTSE Bursa Malaysia Large 30
FBM 70 FTSE Bursa Malaysia Mid 70
FBM EMAS FTSE Bursa Malaysia Emas
FBM KLCI FTSE Bursa Malaysia KLCI (see KLCI)
FBM S FTSE Bursa Malaysia Emas Shariah
FBM SC FTSE Bursa Malaysia Small Cap
FMA Fixed Moving Average
FRNID Floating Rate Negotiable Instruments of Deposit
FT30 Financial Times Institute of Actuaries 30
FTSE Financial Times Stock Exchange
FUSION-NN Fusion Neural Network
FUSION-NNTS Neurally Enhanced Fusion Trading System
GARCH Generalised Autoregressive Conditional Heteroskedasticity
GARCH-M GARCH-in-Mean (see GARCH)
GDP Gross Domestic Product
GGAP-RBF General Growing and Pruning Radial Basis Function
GMI GovernanceMetrics International
GOVN Government Ownership

xvi
IBD Investor’s Business Daily
ICAPM Intertemporal Capital Asset Pricing Model
INST Institutional Ownership
IRRC Investor Responsibility Research Center
ISS Institutional Shareholder Services
KLCI Kuala Lumpur Composite Index
KLSE Kuala Lumpur Stock Exchange
MA Moving Average
MACD Moving Average Convergence Divergence
MAE Maximum Adverse Excursion
MCCG Malaysian Code of Corporate Governance
MD% Maximum Drawdown % (Maximum Percentage Drawdown)
MLP Multi-Layer Perceptrons
MLR Multiple Linear Regression
MP Market Price per Share
MSE Mean Squared Error
NASDAQ NASDAQ Stock Market
NCE Non-Core Earnings
NYIF New York Institute of Finance
NYSE New York Stock Exchange
OLS Ordinary Least Squares
P&F Point and Figure
PBV Price to Book Value Ratio
PER Price Earnings Ratio
PF Profit Factor
PR Payoff Ratio
PRI Principles for Responsible Investment
RAM Random Access Memory
RMSE Root Mean Squared Error
R2 R-Squared
RF Recovery Factor
RO Research Objective
ROE Return on Equity
RSI Relative Strength Index

xvii
RSS Regulated Short Selling
S&P 500 Standards & Poor 500
SESALL Singapore All Equities Index
SIDC Securities Industry Development Corporation
SMA Simple Moving Average
SMAX Small Cap Exchange
SR Sharpe Ratio
SRI Socially Responsible Investment
ST Sortino Ratio
STII Singapore Straits Times Industrial Index
TA-NN Technical Neural Network
TA-NNTS Neurally Enhanced Technical Trading System
TCL The Corporate Library
TRB Trading Range Breakout
UI Ulcer Index
UK United Kingdom
UN United Nations
UNPRI United Nations Principles for Responsible Investment
US United States
VMA Variable Moving Average
WFE World Federation of Exchanges

1
CHAPTER 1
Introduction
‘I can calculate the movement of the stars, but not the madness of men’1
Sir Isaac Newton Mathematician, Physicist, Scientist
1.1 Introduction
Forecasting stock prices (returns) is a topical issue that remains an active aim for traders
and brokerage firms, and a fascinating subject for academics. Academics attempt to
explain whether prices can indeed be predicted. In fact, a myriad of studies are still
being published in top/leading journals2 that attempt to investigate whether some form
of trading strategy3 can yield (abnormal) returns. From the academic point of view, this
issue is crucial as the superiority of trading systems (over the market) is a direct
violation of the mainstream theory of an efficient stock market, as postulated by Fama
(1965; 1970). From the practical viewpoint, active traders persistently attempt to
outperform the market as it offers potential for lucrative returns.4 The ability to design
profitable stock market trading systems, therefore, has serious theoretical, practical and
policy implications.
1 Newton lost vast wealth (about £20,000, which is approximately USD$5 million in today’s terms) in the South Sea Bubble when he was heard giving the quotation. 2 In this thesis, we define top/leading academic journals as those with the ratings of A or A* as listed in the Australian Business Dean Council (ABDC) journals rating list (updated in 2010). For the complete ranking, see ABDC (2010). Some examples of journals that publish recent research in trading strategies are Applied Economics, Journal of Banking and Finance, Journal of Business Finance and Accounting, Journal of Corporate Finance, Journal of Financial Economics and Review of Financial Studies, which include articles such as Bebchuk, Cohen and Wang (2013), Bhagat and Bolton (2008), Bonenkamp, Homburg and Kempf (2011), Johnson, Moorman and Sorescu (2009), Metghalchi, Marcucci and Chang (2012), Piotroski and So (2012), Renneboog, Ter Horst and Zhang (2008) and Rosillo, de la Fuente and Brugos (2013). 3 Consistent with Achelis (2001) and Bonenkamp (2010), we use the terms investing and trading interchangeably. 4 The likes of famous investors, such as Warren Buffett, John Maynard Keynes, Peter Lynch, William O’Neil and John Palicka, who have made millions (or billions) for themselves, add gravity to this claim.

2
This thesis seeks to build and examine a novel fusion trading system, which is a
composite of a neurally enhanced financial statement analysis (that is, traditional
fundamental analysis), corporate governance analysis (new fundamental research) and
technical analysis, in the context of a full-fledged stock market trading system. In doing
so, we build and investigate the trading ability of five mechanical trading systems: (1)
(traditional) fundamental analysis; (2) corporate governance analysis; (3) technical
analysis; (4) classical fusion analysis (a hybrid of only fundamental and technical rules)
and (5) novel fusion analysis (a hybrid of fundamental, corporate governance and
technical rules) in an emerging stock market, the Bursa Malaysia.
The remainder of this introductory chapter is structured as follows. Section 1.2 offers a
brief background and motivation for the current study. Section 1.3 overviews the
concept of market efficiency, and how it relates to the present study. Section 1.4
presents the research objectives. Section 1.5 outlines the research, including the list of
trading systems built and investigated in this thesis, the data and methodology, research
setting, overall results and significance of the study. Section 1.6 concludes by
presenting the organisation of this thesis.
1.2 Background and Motivation
Since the early existence of financial markets, traders have turned to various trading
methods to make profit and this continues today. To an extreme, Malkiel (2007, p. 101)
argues ‘[t]here are people today who forecast future stock prices by measuring sunspots,
looking at the phases of the moon, or measuring the vibrations along the San Andreas
Fault’. In general, however, there are two forms of trading systems that dominate the
stock market: (1) fundamental analysis and (2) technical analysis (Fama 1965; Malkiel
2007; Sharpe, Alexander & Bailey 1999). In short, traditional fundamental analysis, as
termed in Fabozzi and Markowitz (2002) and Ou and Penman (1989), deals with the use
of financial statement information to identify undervalued (overvalued) stocks to signal
buying (selling) of trades. Conversely, technical analysis refers to the use of market
information, such as prices and volumes, to emit entry and exit signals.

3
In light of the recent corporate failures, the importance of good corporate governance
brings forth a new form of (non-financial) fundamental strategy, which is built on the
basis of corporate governance information.5 This new fundamental research (as defined
by Hynes 2005) is deemed by investors as the most vital socially responsible investment
(SRI) factor (Mercer 2006), and equal in importance to the traditional form of
fundamental analysis using accounting information (McKinsey & Company 2002).
In building trading strategies, however, it is crucial to use an appropriate modelling
technique so that the relationship between independent (e.g., financial ratios) and
dependant (e.g., stock returns) variables can be correctly mapped. It is generally
accepted that the financial market is a complex system. Traditional statistical
techniques, for instance, have reached their limitations in dealing with non-linear data
(Vanstone 2006). Due to market volatility, complexity and noisy environment, the
artificial neural network (ANN) is considered the prime technique for forecasting
financial time series (Yao & Tan 2002) and has become a powerful alternative for
solving various domains of convoluted financial problems.
This thesis is concerned with building and examining the efficacies of five sophisticated
full-fledged trading systems, enhanced by ANNs. To all intents and purposes, we define a
stock market trading system as a full-fledged system that incorporates all three major
functions of a trading strategy as defined by Chande (1997) and Pardo (2008). These
include: (1) entry and exit rules, (2) position sizing and (3) risk management. To construct
the systems, we utilise a backpropagation algorithm in enhancing buy/sell rules, and
incorporate anti-Martingale (position sizing) and stop loss (risk management) strategies.
The main focus of this study, the novel fusion analysis, merges financial statements,
corporate governance and technical rules. The remaining four mechanical trading
systems are (1) (traditional) fundamental analysis, (2) corporate governance analysis,
5 The collapses in large conglomerates, as well as the Asian and global financial crises in 1997 and 2008, respectively, have generally been blamed on the lack of good corporate governance. These include major collapses of large corporations such as Lehman Brothers, Bear Stearns, Enron and WorldCom. In Malaysia, several large conglomerates, including Renong, Perwaja Steel and the Malaysian Airlines System, were also badly affected.

4
(3) technical analysis, and (4) classical fusion analysis (a hybrid of only fundamental
and technical rules).
The fusion of fundamental, corporate governance and technical rules is a novel
framework. To our knowledge, this hybrid approach is introduced for the first time in
this thesis. Extant literature typically explores each trading strategy in isolation. For
example, Aby, Briscoe, Elliott et al. (2001), Basu (1977), Fama and French (1992),
Piotroski (2000) and Quah (2008) only examine financial statement analysis. Brock,
Lakonishok and LeBaron (1992), Fama and Blume (1966), Lai, Balachandher and Nor
(2007) and Metghalchi, Marcucci and Chang (2012) only explore technical analysis.
Aman and Nguyen (2008), Bebchuk, Cohen and Wang (2013), Drobetz, Schillhofer and
Zimmermann (2004) and Gompers, Ishii and Metrick (2003) only investigate trading
strategies based on corporate governance information.
Interestingly, despite the fact that practitioners often combine fundamental and technical
rules (Maditinos, Šević & Theriou 2007; Taylor & Allen 1992), and the numerous
attempts to investigate the profitability of each individual strategy, there is a dearth of
research exploring the performance of combination strategies. Some progress has been
made towards exploring the efficacies of hybrid systems, for example, Bonenkamp,
Homburg and Kempf (2011), Lam (2004), Quah and Srinivasan (1999) and Reinganum
(1988). Nevertheless, these studies only investigate the classical fusion of traditional
fundamental and technical analysis. There is no study to date that incorporates corporate
governance information into the fusion system. Moreover, the major functions of a
stock market trading system, as well as many realistic settings and constraints (such as
limited trading capital and round lot), are often ignored.
If the use of fundamental, corporate governance and technical information offers the
capability to discern the underlying patterns to generate abnormal returns, it is highly
possible that traders will benefit by merging these factors. More specifically, it can be
expected that merging different trading strategies can produce superior performance, as
it allows the system to be responsive to multiple trading signals (Bernstein 1998).
Further, the strengths of each system can offset the weaknesses of the other (Brady
1975). Research in general supports the idea that merging forecasting models can

5
improve accuracy (see for example Clemen 1989), although accuracy itself is not an
appropriate measure and may not translate into higher profitability.
The use of appropriate benchmarks for evaluating trading systems is crucial.
Traditionally, economists, for example, are generally concerned with how well certain
models fit or explain prices. Classical forecasting measures, such as the mean squared
error (MSE), root mean squared error (RMSE) or R-squared (R2) are often used to
evaluate performance. Nonetheless, in the context of testing trading systems, several
studies have shown that these measures of forecast error are not appropriate. For
example, Leitch and Tanner (1991) find that these statistics are not strongly correlated
with profits. Pesaran and Timmermann (1995) claim that prediction accuracy may not
be useful in building profitable strategy. In the context of the ANN trading system,
Azoff (1994) argues that forecasting error is not a useful measure of performance.
Likewise, Olson and Mossman (2003) assert that trading results should be gauged on
the basis of important metrics for market participants, such as profits.
Building upon the above issues and limitations, this thesis attempts to address these
research topics. This will be discussed briefly in the following sections.
1.3 Market Efficiency
The concept of market efficiency cannot be separated from studies in trading strategies.
As argued by Beechey, Gruen and Vickery (2000), it is the right place to start for
research related to price formations. Stock prices are a function of demand and supply,
which is influenced by many factors. Fundamental, corporate governance, technical and
fusion trading systems are employed to process these relevant factors to signal buy/sell
trades in order to gain abnormal returns. The central assumption of these models is that
the stock market is not information efficient. This is in direct contrast to the efficient
market hypothesis (EMH) as postulated by Bachelier (1900) and stated formally by
Fama (1965; 1970) and Samuelson (1965).

6
Beginning with the work by Fama (1970), the EMH can be formally described in terms
of the three forms of efficiencies (Cuthbertson & Nitzsche 2004; Fama 1970; Jensen
1978; Malkiel 2007; Reilly & Brown 2003): (1) weak form, (2) semi-strong form and
(3) strong form. In weak-form efficiency, stock prices fully reflect all historical market
information. Thus, no trading strategy using past prices can beat the market. In semi-
strong EMH, prices already reflect all publicly available information. This encompasses
weak-form efficiency. Therefore, neither past prices nor publicly available data
(financial or corporate governance) will be useful. In strong form efficiency, stock
prices fully reflect all public and private information. This also incorporates both the
semi-strong and weak-form efficiencies. Accordingly, no trading strategies can be
expected to benefit the traders.
The EMH is one of the most important theories in finance, and there are perhaps equally
as many people who are against it, as well as who support it.6 The theory dictates that as
prices move in random, stock prices (returns) are not predictable. More specifically,
since information is assumed to arrive in a random, independent and unpredictable
manner, these prices adjust rapidly to new information due to the combined forces of
demand and supply by the market players (Reilly & Brown 2003). This casts doubt on
the validity of trading systems to beat the market. Put another way, trading strategies
using historical and publicly available data cannot generate returns that are superior to
the returns generated by the simple buy-and-hold (B&H) strategy, after adjusting for
risk and costs (Jensen 1978; Malkiel 2007; Vanstone 2006). Therefore, if the market is
efficient, the best trading strategy is to buy and hold. Accordingly, in testing the
performance of our trading systems, the EMH (B&H) serves as the benchmark theory
(trading strategy).
Market efficiency has crucial implications to our study. Naturally, the trading systems
explored in this thesis are based on the tenets of two mainstream investment theories
dominating the market, which contradict the principles of an efficient market: (1) firm
6 According to Lo (2008, Article, para. 1), the efficient market hypothesis is ‘one of the most hotly contested propositions in all the social sciences’. He further adds that ‘it is disarmingly simple to state, has far-reaching consequences for academic theories and business practice, and yet is surprisingly resilient to empirical proof or refutation’ (Lo 2008, Article, para. 1). Despite the many criticisms it receives, Yen and Lee (2008, p. 305) argue that ‘the EMH is here to stay and will continue to play an important role in modern finance for years to come’.

7
foundation theory and (2) castle in the air theory. The first theory gives the groundwork
for both financial statement and corporate governance analysis, while the second theory
underpins the utilisation of technical analysis. The fusion trading systems, therefore,
amalgamate the principles of both of these investment theories.
The firm foundation theory (Graham & Dodd 1934; Guild 1931; Williams 1938) provides
the scientific foundation for fundamental analysis. The theory establishes the intrinsic
(fundamental) value of an investment, and this value can be determined or inferred by
analysing financial and/or non-financial information of the firm. By comparing this
value to the market price, a trader can exploit market inefficiency in processing relevant
information by buying (selling) the stock when the stock price is temporarily lower
(higher) than its intrinsic value (Malkiel 2007). The trader will gain when the divergence
between value and price is eventually corrected by the forces of demand and supply in
the market (Malkiel 2007; Ou & Penman 1989). Accordingly, the acceptance of firm
foundation theory reflects the rejection of market efficiency at the semi-strong form.
Instead of computing the intrinsic value of a stock, the castle in the air theory focuses on
the behavioural forces in the market (Malkiel 2007). The theory, which is attributed to
Keynes (1936), endorses technical analysis and argues that the value of a stock is only
worth what the market is willing to pay it for (Malkiel 2007). Based on this principle,
the theory utilises mass psychology to ascertain the future direction of the stock market.
By analysing historical market data, a trader can exploit market inefficiency by timing
his/her entry (exit) points to buy (sell) the stock at a lower (higher) price. Accordingly,
the castle in the air theory is in direct contrast to the weak-form efficient market.
The literature has documented that emerging markets are generally not (or less) efficient
in both weak and semi-strong forms (e.g. Alexakis, Patra & Poshakwale 2010; Chen,
Firth & Gao 2011; Dorantes 2013; Fama & French 1998; Gunasekarage & Power 2001;
Lai, Balachandher & Nor 2007). As a result, it can be expected that the fusion strategies
can be much more profitable in these markets. Nonetheless, as noted earlier, previous
studies often ignore practical settings and constraints, which means that the apparent
mispricing might not have been exploitable. Therefore, it remains to be seen if the novel
fusion approach can offer superior trading performance in such markets.

8
1.4 Research Objectives
The above discussion brings about a motivating research question. If individual strategies
of fundamental, technical and corporate governance analysis can produce significant
returns and outperform the B&H policy (and thus exploit market inefficiency), will a
hybrid of the three trading rules produce an even superior performance?
Accordingly, the central aim of this thesis is to build and examine the neurally enhanced
novel fusion trading system, which merges the ternion of trading rules above. In so
doing, we also develop and investigate the efficacies of the three constituent trading
systems (fundamental, corporate governance and technical analysis) and the classical
fusion strategy (the hybrid of traditional fundamental and technical rules).
Formally, the central research objectives of this thesis can be described as follows:
1) To investigate whether trading on the basis of a novel fusion (hybrid of
fundamental, corporate governance and technical rules) trading system is able to
yield economically significant profit and outperform the B&H policy.
2) To determine whether trading on the basis of a novel fusion trading system is
capable of outperforming the classical fusion approach and its constituent
(fundamental, corporate governance and technical, separately) trading systems.
In addition, this study seeks to address the following secondary research objectives:
3) To analyse whether trading based on the classical fusion (hybrid of fundamental
and technical rules) trading system is capable of generating economically
significant profit and outperform the B&H policy.
4) To investigate whether trading based on the classical fusion trading system is
capable of outperforming its constituent (fundamental and technical, separately)
trading systems.
5) To examine whether trading on the basis of the individual (fundamental,
corporate governance and technical, in isolation) trading systems is able to yield
economically significant profit and outperform the B&H strategy.
9
The findings associated with the above research objectives offer significant implications
for academic theories, active traders, brokerage firms, analysts and policy makers,
among others.
1.5 Overview of the Research
1.5.1 List of Trading Systems
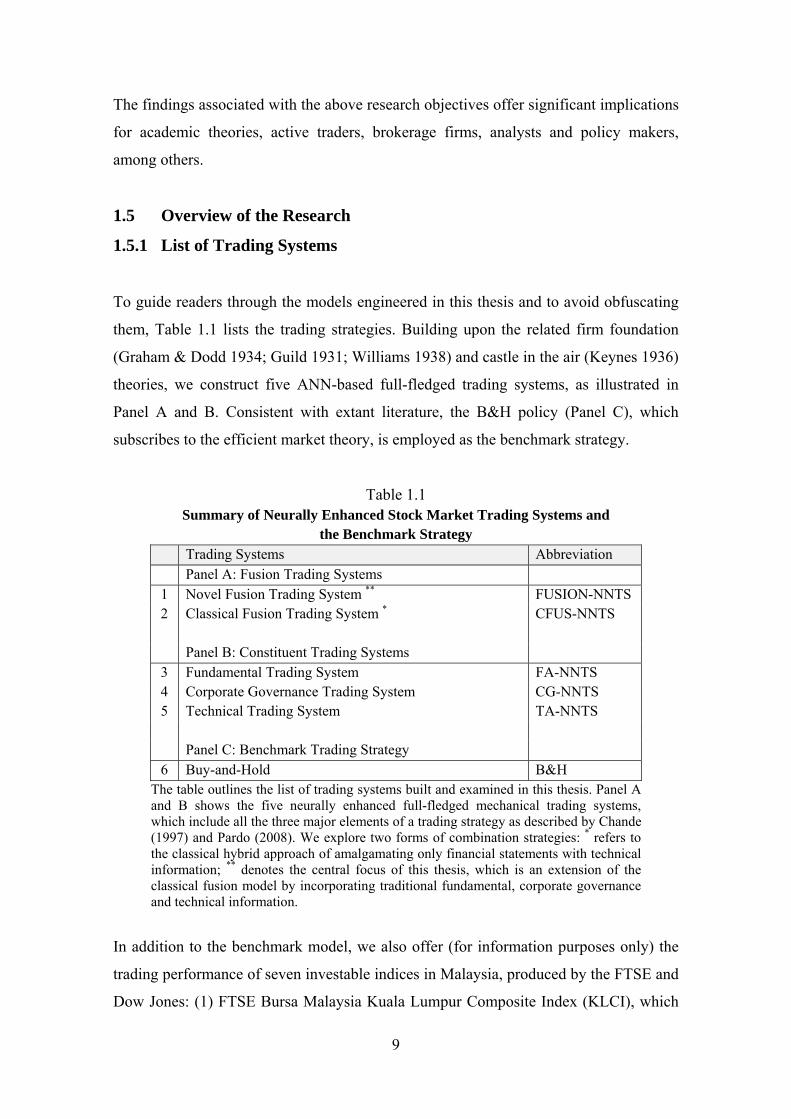
To guide readers through the models engineered in this thesis and to avoid obfuscating
them, Table 1.1 lists the trading strategies. Building upon the related firm foundation
(Graham & Dodd 1934; Guild 1931; Williams 1938) and castle in the air (Keynes 1936)
theories, we construct five ANN-based full-fledged trading systems, as illustrated in
Panel A and B. Consistent with extant literature, the B&H policy (Panel C), which
subscribes to the efficient market theory, is employed as the benchmark strategy.
Table 1.1 Summary of Neurally Enhanced Stock Market Trading Systems and
the Benchmark Strategy Trading Systems Abbreviation Panel A: Fusion Trading Systems
1 Novel Fusion Trading System ** FUSION-NNTS 2 Classical Fusion Trading System * CFUS-NNTS Panel B: Constituent Trading Systems
3 Fundamental Trading System FA-NNTS 4 Corporate Governance Trading System CG-NNTS 5 Technical Trading System TA-NNTS Panel C: Benchmark Trading Strategy
6 Buy-and-Hold B&H The table outlines the list of trading systems built and examined in this thesis. Panel A and B shows the five neurally enhanced full-fledged mechanical trading systems, which include all the three major elements of a trading strategy as described by Chande (1997) and Pardo (2008). We explore two forms of combination strategies: * refers to the classical hybrid approach of amalgamating only financial statements with technical information; ** denotes the central focus of this thesis, which is an extension of the classical fusion model by incorporating traditional fundamental, corporate governance and technical information.
In addition to the benchmark model, we also offer (for information purposes only) the
trading performance of seven investable indices in Malaysia, produced by the FTSE and
Dow Jones: (1) FTSE Bursa Malaysia Kuala Lumpur Composite Index (KLCI), which

10
is the main market barometer); (2) FTSE Bursa Malaysia Top 100; (3) FTSE Bursa
Malaysia Mid 70; (4) FTSE Bursa Malaysia EMAS; (5) FTSE Bursa Malaysia Small
Cap Index; (6) FTSE Bursa Malaysia EMAS Shariah and (7) Dow Jones Islamic Market
Malaysia Titans 25. These allow us to further gauge the efficacies of the systems built
in this thesis against various segments of the Malaysian market.
1.5.2 Data and Methodology
This study explores a sample of 30 large firms (by market capitalisation) listed in the
FTSE Bursa Malaysia and covers a period of 1 July 2002 to 30 June 2011, which gives a
total of 61,861 daily observations (866,054 data points). The sample period is divided into
two, non-overlapping periods. The first in-sample period ranges from 1 July 2002 to 30
June 2008 and is used to train the networks to build the systems. The second, out-of-
sample period, ranges from 1 July 2008 to 30 June 2011, and is used for empirical
analysis.7 Historical stock market data and financial ratios are sourced from Thomson
Reuters DataStream, while pricing data on the FTSE and Dow Jones indices are gathered
from Bloomberg. For corporate governance data, we extract the information manually
from a total of 268 audited annual reports published in the Bursa Malaysia website.
In terms of research design, our research is in spirit closest to Vanstone (2006) and
Vanstone and Hahn (2010), although these studies only examine traditional fundamental
and technical analysis, in isolation.8 This thesis employs neural networks in training the
inputs (i.e., financial ratios, corporate governance factors or technical indicators) to
forecast the outputs (stock returns). These neurally enhanced entry and exit rules are
then placed inside full-fledged stock market trading systems, comprising position sizing
(anti-Martingale) and risk management (stop loss) strategies. For the hybrid rules,
appropriate networks are used simultaneously to emit buy (sell) signals. The new
approach for techno-fundamental, novel fusion trading system (FUSION-NNTS),
extends the existing literature on classical fusion analysis (which by itself is still
7 Detailed discussions on the sample period and partitioning ratio are in Chapter 3. 8 The contribution of this thesis is not restricted to building a well-defined methodology for the novel fusion (as well as classical and individual) trading system, but also, in benchmarking the strategies using numerous performance measures and within a valid empirical setting, much in the same way as the doctoral work by Vanstone (2006).

11
limited) by including corporate governance factors, and incorporating the three major
elements of a trading system.
In examining and comparing the efficacies of the trading systems, related trading
metrics (see Chande 1997; Rotella 1992; Ruggiero 1997; Sharpe 1966, 1994; Sortino &
Satchell 2001; Kaufman 1998; Vanstone 2006) and/or statistical tests (one sample and
independent samples t-tests) are used. In particular, the key metrics include the Sharpe
ratio (SR), Sortino ratio (ST), maximum percentage drawdown (MD%), payoff ratio
(PR), profit factor (PF), recovery factor (RF) and ulcer index (UI). To provide valid
empirical findings, the trading simulations consider realistic budget, sample portfolio,
short selling restriction, round lot constraint and transaction cost. The effects of data
snooping, survivorship and look-ahead biases are also addressed and mitigated.
1.5.3 Context of the Study
Bursa Malaysia offers a unique perspective for both researchers and practitioners.
Although studies on classical fusion analysis have recently gain prominence in the
academic literature, these rules are explored almost exclusively in the United States
(US) market. Therefore, the use of a different setting alleviates the possibility of data
snooping (see Marshall & Cahan 2005).9 Since emerging markets are generally less
efficient than the developed ones, they offer greater potentials to gain profits.
Nonetheless, a large number of developing markets has a small number of firms listed,
effectively limiting the ability to choose stocks. Bursa Malaysia, however, has the
largest stock market (in terms of the number of listed companies) among all other
countries in the ASEAN (Association of Southeast Asian Nations) region, as indicated
by the World Federation of Exchanges (WFE 2008, 2011), and thus offers traders a
large selection of equities for trading.
9 With respect to testing trading strategies, data snooping can occur when the trading rules are identified and tested on the same set of data.

12
Moreover, the Malaysian stock market is reasonably liquid. 10 Its market liquidity
compares favourably with, for example, the emerging markets of Brazil, Indonesia, Sri
Lanka and Thailand, and against some of the developed financial markets, including
Austria, Belgium, New Zealand and Portugal (World Bank 2009). Market liquidity is an
important factor for traders to easily buy and sell securities, which also helps to enhance
market efficiency. Bursa Malaysia also plays a very important role in the national
economy11 and is ranked among the top 10 in the world in terms of stock market
importance (WFE 2008).12 More recently, it sits among the top five in the global ranks,
behind only Hong Kong, Johannesburg, Singapore and SIX Swiss exchanges (WFE 2011).
Finally, with the introduction of the Malaysian Code of Corporate Governance (MCCG)
in 2000, and later the Kuala Lumpur Stock Exchange (KLSE) revamped listing
requirements in 2001, listed firms in Malaysia are required to disclose their corporate
governance practices (although compliance is voluntary) in annual reports. This enables
us to include corporate governance factors in building a full-fledged governance trading
system, and in extending the classical fusion rule by using this non-financial
fundamental indicator. Given the above points, it is intriguing to conduct the analysis in
this market. Nonetheless, the results of this study may also be generalised to other
emerging markets with similar characteristics.
1.5.4 Empirical Results
The first segment of analysis investigates the efficacies of three individual trading
systems, namely fundamental (FA-NNTS), corporate governance (CG-NNTS) and
technical (TA-NNTS) analysis. The results show that these systems can produce
significant returns and outperform the B&H policy. In all cases, the Sharpe ratios are
over 1 and beat the B&H rule (with only 0.65). The findings confirm the benefits of
using these strategies to yield superior returns per unit of risk, and suggest that the
Malaysian market is not efficient in both the weak and semi-strong senses. As expected,
10 As measured by the total value of stocks traded over the gross domestic product (GDP). 11 Stock market importance is computed as market capitalisation divided by the GDP. 12 This information is publicly available before the in-sample/out-of-sample window and thus alleviates potential look-ahead bias. Further information about how this thesis mitigates some of the well-known statistical biases is discussed in Chapter 3.

13
CG-NNTS produces the highest Sharpe (Sortino) ratio among all other individual
strategies with 1.27 (2.44), consistent with its position as a new fundamental research,
which makes it less likely (as compared to the widely used accounting and technical
information) to be efficiently absorbed by the market.
The second segment explores two forms of hybrid strategies. The classical fusion
trading system, which is a combination of only financial statements and technical rules,
produces the highest dollar gain over any other system, and far exceeds the net profit
obtained by the B&H. It produces a Sharpe (Sortino) ratio of 1.80 (3.79), which is
greater than its constituent strategies (FA-NNTS and TA-NNTS) and the passive B&H
policy. The results are also superior to the new fundamental analysis (CG-NNTS).
Ultimately, the central aim of this thesis, which is the novel fusion approach of
integrating fundamental, corporate governance and technical analysis (FUSION-
NNTS), produces the best results in all the key metrics tested. It yields the highest
Sharpe (1.95) and Sortino (4.81) ratios against all other trading systems and the B&H
policy. The results from both hybrid rules provide support to the complementary nature
of their cohort strategies, where the strengths of each constituent rule appear to be
successful in offsetting the weaknesses of the other. The findings lend credence to the
benefits of the combination rule, and in particular, the novel approach with further
augmentation of corporate governance information.
Overall, the five ANN-based trading systems built in this thesis not only outperform the
B&H policy, but also, the seven market indices in Malaysia produced by the FTSE and
Dow Jones, with FUSION-NNTS being the most powerful trading system.
1.5.5 Contribution and Significance of the Study
This thesis makes an original contribution to knowledge in several ways. First, to the
best of our knowledge, this study breaks new ground by amalgamating financial
statements, corporate governance and technical information into a fusion mechanical
trading system. Research in classical hybrid strategy alone is still limited, so this novel
framework makes a significant leap by augmenting the system with new fundamental

14
research. Second, the trading systems built in this thesis incorporate the major functions
of entry and exit rules, money management and risk control, which are still lacking in
existing studies. Third, the efficacies of the systems are evaluated within valid practical
contexts, such as consideration of costs, budget, short selling restriction and complex
round lot constraints. Finally, instead of benchmarking trading performance using
traditional measures of forecasting error, this thesis explores more sophisticated metrics
(such as maximum percentage drawdown, profit factor, Sharpe and Sortino ratios),
which provide insights into trading system behaviours.13
This study will be significant to academics, practitioners and policy makers. The novel
framework and the research design can be used by researchers to explore trading
performance and assess market efficiency. Institutional investors (buy-side) can use the
systems for their algorithmic trading. Sell-side analysts can use the systems built in this
study to offer ‘buy’, ‘hold’ or ‘sell’ recommendations. Skilful traders can employ the
strategies in an attempt to outperform the market. New funds can also be developed, for
example, on the basis of the hybrid rules. The findings from this thesis can also assist
policy makers to set new rules and policies. Using the full-fledged trading systems in
this thesis, the government may also act as arbitrageurs to eliminate mispricing (to some
extent) and enhance market efficiency.14
1.6 Structure of the Thesis
This thesis comprises six chapters. Having presented the background of this study in
this chapter, the remainder of this thesis is structured as follows. Chapter 2 outlines the
definition, practical application and previous literature in fundamental, corporate
governance, technical, and fusion analysis. The chapter also presents the limitations of
prior studies, and discusses how this thesis makes significant contribution to existing
knowledge. Chapter 3 provides the conceptual framework and research methodology. In
the chapter, the information about data, architecture and processing elements of the
13 For a detailed explanation of the limitation of prior research, as well as other contributions of the present study, see Chapter 2 (Section 2.3). 14 Short selling restriction and risk aversion may prevent successful arbitrage from taking place. We discuss the detail implications of the study in Chapter 6 (Section 6.3).

15
ANNs, entry and exit rules, money and risk managements, as well as performance
evaluation metrics, are presented.
The analysis chapters present the results on the basis of the trading metrics and statistical
analysis, which are divided into two segments. Chapter 4 first presents the results and
discussion for the trading performance of individual systems, namely fundamental,
corporate governance and technical analysis. This is followed by the analysis of the fusion
strategies (both the classical and novel approaches) in Chapter 5. Finally, Chapter 6
concludes by summarising the results of this thesis. The chapter also discusses the
implications of our findings for theory, practice and public policy. The limitations of this
thesis, as well as the recommendation for future research, are also provided.

16
CHAPTER 2
Literature Review
‘It is not easy to get rich in Las Vegas, at Churchill Downs, or at the local Merrill Lynch office’
Paul Samuelson Nobel Laureate, Economist
2.1 Introduction
Samuelson makes it clear that making a profit in the stock market, like gambling, is not
an easy task. Traders have endeavoured to amass wealth and beat the market perhaps
since the market first existed, thousands of years ago in ancient Babylonia (Lo &
Hasanhodzic 2010), and continue to do so today using varieties of forecasting
techniques, ranging from scientific to occult (Malkiel 2007). In this chapter, we
overview the major trading strategies dominating the stock market, which consequently
form the backbone for this thesis. This literature review helps provide background
information for this study, support our research objectives, establish the link with
existing research, and later (in Chapter 3), develop our novel conceptual framework.
In order to provide a systematic review, we structure the literature thematically
according to its research stream (trading disciplines). For each stream, we briefly
discuss the definition, practical applications and chronological account of existing
studies.15 The remainder of this chapter proceeds as follows. Section 2.2 reviews the
major strategies in the stock market, namely fundamental analysis, corporate
governance analysis, technical analysis and finally fusion analysis, which is the focal
point of our research. Section 2.3 discusses the limitations of prior literature and
knowledge gaps, and how this thesis makes significant contributions to knowledge.
Section 2.4 concludes.
15 Trading systems evolve through the advancements of technology, such as, cheaper, faster and more powerful computers, as well as the development of sophisticated modelling techniques, such as neural networks and genetic algorithms. However, extant literature also documents that the stock market is becoming more efficient over time. Therefore, a chronological review may offer insights into the evolution of the debate from both sides and the limitations of the methodology used. Other studies that have used a chronological literature review include Vanstone (2006) and Yen and Lee (2008).

17
2.2 Major Trading Strategies
Within the trading context, it is well established that both fundamental and technical
trading strategies dominate the stock market (Fama 1965; Leigh, Purvis & Ragusa 2002;
Malkiel 2007; Sharpe 1985; Sharpe, Alexander & Bailey 1999; Spritzer & Freitas 2006;
Sternberg & Lubart 1992; Thomsett 1998; Vanstone 2006). Moreover, the importance
of socially responsible investing has recently spawned a new area of fundamental
research (Hynes 2005). The analysis of governance as a trading strategy (for example,
Aman & Nguyen 2008; Gompers, Ishii & Metrick 2003), in particular, has received
much attention from both researchers and traders, and has emerged as one of the most
essential SRI screens (Renneboog, Ter Horst & Zhang 2008). Like traditional
fundamental and technical analysis, the use of this new, non-financial fundamental
strategy among traders and professionals, is pervasive. In a similar vein, many traders
combine both fundamental and technical trading rules (Bernstein 1998; Edwards,
Magee & Bassetti 2007).
The prevalent use of the above strategies can be supported by several surveys. For
example, the study by Arnold and Moizer (1984) and Taylor and Allen (1992) in the
United Kingdom (UK), Maditinos, Šević and Theriou in Greece (2007), Menkhoff
(2010) in the US, Germany, Switzerland, Italy and Thailand markets, and Mohamad and
Nassir (1997) and Saadouni and Simon (2004) in the Malaysian market, confirm that
traders and/or professionals mainly use fundamental and technical strategies over any
other strategy (such as portfolio analysis), with the former being the chief. In general,
technical rules prevail for the short-term horizon and the reverse is true when the trading
horizon increases. Market participants are not confined to either rule, and most deem
both strategies complementary. As well, traders are not limited to traditional
fundamentals. In fact, the survey by McKinsey and Company (2002) reveals that
institutional investors consider corporate governance as equally important as financial
indicators for making trading decisions, and most are willing to pay a premium for well-
governed firms. The rest of this section overviews each of the major strategies above.

18
2.2.1 Fundamental Analysis
2.2.1.1 Definition
Rotella (1992, p. 2) defines fundamental analysis as a strategy that focuses on the
‘underlying factors of supply and demand that affect the price of the commodity’. In
short, (traditional) fundamental analysis is a stock selection strategy that attempts to
screen for undervalued securities through the use of financial statement information.
Based on the firm foundation theory originated from Guild (1931), Williams (1938),
and in the influential work by Graham and Dodd (1934), a stock is considered
undervalued (overvalued) when its intrinsic value is higher (lower) than the prevailing
market price (MP). The intrinsic value (also known as fundamental, firm foundation or
fair value) can be computed using some valuation models, such as the dividend discount
model (Williams 1938). Alternatively, potential undervaluation (overvaluation) can be
implicitly inferred through the use of financial ratios (Aby, Briscoe, Elliott et al. 2001;
Graham & Zweig 2003; Vanstone 2006),16 and this is the more popular approach among
real life practitioners (Longo 1996). Given the fact that the strategy uses accounting
information from published financial statements, it is also termed financial statement
analysis (see for example Ou & Penman 1989; Piotroski 2000).
The logic of firm foundation theory is supported by the view that while fundamental
values reflect information in financial statements, stock prices at times diverge from
their intrinsic values and only move slowly towards them (Ou & Penman 1989).
Therefore, fundamental analysis allows a trader to ascertain fair values not yet
manifested in market prices (Ou & Penman 1989) and accordingly purchase the
securities for less than their true values (Graham & Dodd 2009). Because firm
foundation theory argues the ability of using publicly available accounting information
to yield above average returns, the theory is in direct contrast to the semi-strong market
efficiency (Fama 1970; Malkiel 2007; Oppenheimer & Schlarbaum 1981; Ou &
Penman 1989; Reilly & Brown 2003). From the trading point of view, a mechanical buy
(sell) signal is generated when the stock is undervalued (overvalued).
16 For example, a price to book value ratio (PBV) > 1 (< 1) may suggest over (under) valuation, while a PBV of 1 might imply that the stock is correctly valued (since the market price equals its intrinsic value) and therefore suggests that the market is (semi-strong) efficient.

19
2.2.1.2 Strategy in Practice
The development of the double entry system by Luca Pacioli in 1494 serves as the
precursor to financial statements. The transferability of stocks and the development of
the stock market led to the need for analysis of financial information for making
investment decisions. The use of financial statements, therefore, paves the development
of fundamental analysis based on accounting information, beginning with the work of
Graham and Dodd (1934). It is widely regarded as the prime technique for investment
appraisal among real life traders and professionals (see Maditinos, Šević & Theriou 2007;
Mohamad & Nassir 1997; Saadouni & Simon 2004). In fact, Malkiel (2007) suggests
that as high as 90% of security analysts in the US subscribe to this strategy.
Some notable advocates of fundamental analysis include Warren Buffett, Peter Lynch
and Sir John Templeton. Buffett, chairman of Berkshire Hathaway, is perhaps the most
famous value investor and one of the wealthiest men on the planet. The Sage (or Oracle)
of Omaha, as he is known, who is a student of Graham, has a net worth of $46 billion
(as of September 2012) (Forbes 2012). Managing the Fidelity Magellan Fun, Lynch grew
its assets from approximately $20 million to $14 billion in about 15 years. Templeton
focused on buying bargain stocks that had excellent long-term prospects. Making
himself a billionaire using the system, he argues that to succeed in the stock market, one
must follow fundamental strategy. All in all, the successes of these value investors in
the real world endorse the benefits of using fundamental analysis.
2.2.1.3 Existing Literature
The seminal works by Graham and Dodd (1934), Guild (1931) and Williams (1938) lay
the basis for fundamental investment analysis. Guild (1931) is the first to introduce the
concept of intrinsic value, whereas Williams (1938) devises a method for computing
firm foundation. Nonetheless, it is the authoritative piece by Graham and Dodd (1934)
that changes the investment landscape. The authors measure the intrinsic value of
individual firms and focus on, inter alia, low price-earnings ratio (PER) and PBV, to
spot underpriced securities, which effectively translate into trading opportunities. As

20
described by Malkiel (2007), their work galvanises Wall Street analysts to adopt
fundamental analysis as the main strategy.
The principles of Benjamin Graham’s stock selection criteria follow in a series of
subsequent, highly influential works known as The Intelligent Investor, which have
spanned several editions.17 This and the idea behind fundamental analysis also prompts
academic research to explore whether there is indeed exploitable mispricing of publicly
available accounting data. In a semi-strong efficient market, one would expect prices to
fully reflect available information in a rapid and unbiased fashion (Fama 1970). Thus,
according to this theory, financial statement analysis should not be able to produce
abnormal returns and consistently outperform the market.
Basu (1977) inspects if stocks with low PER outperform those with high PER. Using
data from the New York Stock Exchange (NYSE), the author finds that for the period
April 1957 to March 1971, the portfolio of firms with the lowest PER produces greater
mean returns, even after adjusting for risks, compared to the portfolio with high PER.
Contrary to the semi-strong EMH, the results indicate that PER is not efficiently priced
by the market. This allows traders the prospect of gaining abnormal returns by selecting
stocks on the basis of PER.
Oppenheimer and Schlarbaum (1981) examine the profitability of defensive stock
selection criteria18 proposed by Graham in the US market, during the year 1956 to 1975.
The authors find that even after deducting related costs, the simple fundamental
screening is still able to yield annual risk-adjusted returns of 2% to 2.5% greater than
the buy-and-hold policy. The findings support the use of fundamental analysis, which is
in contrast to market efficiency.
Using a large set of accounting ratios, Ou and Penman (1989) explore the efficacy of
financial statement analysis that attempts to forecast the sign of annual earnings changes
(instead of stock returns), and use this information to construct trading strategies. Based
on the sample of NYSE and American Stock Exchange (AMEX) listed firms, they 17 Warren Buffett claims that this work of Graham is the best book ever written for investing. 18 Defensive stock selection uses simple fundamental screening designed for less sophisticated investors. See Graham and Zweig (2003) and Oppenheimer and Schlarbaum (1981) for further details.

21
employ long-short zero-investment strategy during the period 1973 to 1983. Long
(short) position is executed for stocks with earnings increases (decreases). They observe
that this fundamental strategy yields 8.34% (14.53%) of mean market-adjusted returns for
a 12-month (24-month) holding period. The authors conclude that ‘financial statements
capture fundamentals that are not reflected in prices’ (Ou & Penman 1989, p. 328).
Holthausen and Larcker (1992) extend the study by Ou and Penman (1989) by
forecasting the excess returns directly. Using a logit model based on accounting ratios,
the authors utilise three forms of one-year excess returns, namely market-adjusted
returns, excess returns based on the capital asset pricing model (CAPM) and size-
adjusted returns, in the US market. Long (short) position is taken for stocks with
expected 12-month positive (negative) excess returns. Overall, the mean excess returns
from the above measures range from 4.3% to 9.5% during the 1978 to 1988 period.
They also examine the earnings prediction model of Ou and Penman (1989) and find
that the return prediction model dominates. The results appear to contest EMH.
In their seminal paper, Fama and French (1992) argue that if asset pricing model is
rational, then the observed anomalies associated with financial statement information
(size and PBV) are not a sign of market inefficiency. Instead, they conclude that these
systematic differences are ascribed to compensation for risks of financial distress.
Lakonishok, Shleifer and Vishny (1994) investigate the performance of value firms for
the period of April 1963 to April 1990 in the US market by looking at both their returns
and risks. The authors find that although value stocks have slightly higher standard
deviations (by 2.5%), they outperform glamour stocks by 10% to 11% per annum. Their
results show that value stocks are indeed underpriced, and traders can benefit by earning
abnormal returns on these investments. These findings cast doubt on the semi-strong
form of EMH and are not consistent with the risk-based explanation of Fama and
French (1992).
Mukherji, Dhatt and Kim (1997) explore the relationships between several fundamental
indicators and annual stock returns in Korea. Using data for the period 1982 to 1993, the
authors find that PBV has the strongest relationship with returns, followed by the sales-
price ratio, debt-equity ratios and market value. Although the correlation coefficients of

22
these indicators with stock returns are rather low, the results provide some support to
value investment in the emerging market.
Fama and French (1998) examine the returns on market, value and growth portfolios for
the US and 12 EAFE (Europe, Australia and the Far East) countries for the period of
1975 to 1995. They observe that value stocks tend to outperform growth stocks, and there
is also a value premium in the emerging markets. The authors conclude that these results
can be explained by a one-state-variable international intertemporal capital asset pricing
model (ICAPM) or a two-factor arbitrage pricing theory (APT) that explains returns with
the global market return and relative distress risk.
Investigating the relationship of stock returns with risk (beta) and fundamental variables
in five Pacific-Basin emerging markets, Chui and Wei (1998) observe that the returns in
Hong Kong, Korea, Malaysia, Taiwan and Thailand markets cannot be explained by
risk. Instead, the size effect is documented to be strong for all the markets, while PBV is
significantly related to the expected stock returns in Hong Kong, Korea and Malaysia.
Their findings appear to endorse the benefit of employing financial statement analysis
in these emerging capital markets.
Piotroski (2000) examines if a simple fundamental strategy can yield abnormal returns
and shifts the return distributions of value investors to the right. Using nine fundamental
signals associated with financial conditions, he builds an aggregate measure (called
FSCORE) to capture the financial strengths of the companies. Firms with high (low)
score indicate strong (weak) fundamentals and are expected to have good (bad) stock
performance. The study shows that screening on the basis of financially strong, low
PBV firms enhances the mean returns by no less than 7.5% annually. Further, a simple
long-short fundamental trading strategy that discriminates between strong and weak
fundamentals yields 23% annual return between the years 1976 and 1996. Overall, the
results suggest that the market slowly reacts to publicly available accounting information,
thereby supporting the benefits of financial statement analysis.
Using securities from the Value Line Investment Survey database, Aby, Briscoe, Jones
et al. (2001) investigate the ability of value investment to spot quality, undervalued
stocks relevant for retirement plans. In an attempt to produce a portfolio of value stocks,
23
they focus on two fundamental rules: (1) single-digit PER and (2) MP < book value per
share (BV) (or PBV < 1). This screening strategy reduces the population of about 6,000
stocks to only 57 (after eliminating three utility stocks). However, their strategy does
not beat either the Dow Jones Industrial Average (DJIA) or the S&P 500. The authors
propose some possible explanations, including excessive percentage of stocks that
underperform, as well as the possibility that their filtered firms actually represent a state
of decline and difficulty, rather than undervaluations.
In a later study, Aby, Briscoe, Elliott et al. (2001) extend the method in Aby, Briscoe,
Jones et al. (2001) above by adding two extra variables, return on equity (ROE) and
dividend payout ratio (DPR), in the same market during the same sample period. By
screening for undervalued stocks on the basis of PER < 10, PBV < 1, ROE > 12% and
DPR < 25%, the number of securities in the database is filtered from over 6,000 stocks
to only 14. They discover that their fundamental strategy outperforms all market proxies
and all combinations of sample portfolios. These 14 value stocks generate average
returns of 30.55% per annum, against only 19.07% yielded by the S&P 500. More
importantly, simultaneous use of the four fundamental indicators offers superior
approach for value investing. As well, ROE > 12% appears to be the threshold between
performing and non-performing stocks. In contrast to semi-strong EMH, the results
provide support for screening for value stocks on the basis of accounting information.
Thong (2002) investigates the trading performance of two criteria from Graham’s 10
stock selection rules on the KLSE, from the end of 1987 to March 2000. His
fundamental strategy screens for stocks with dividend yield at least two thirds of the
three-month Treasury Bill (in place of AAA bonds) and total debt less than book value.
He employs four variations of the strategy, where the stocks are held for two years or
until the price appreciates by 100%, 75%, 50% or 25%. The author finds that the first
two strategies are able to outperform the market, although only few with statistically
significant excess risk-adjusted returns. All in all, there is still exploitable inefficiency
in the Malaysian market.
A number of studies investigate the performance of neurally enhanced fundamental
trading strategies (for example, Eakins & Stansell 2003; Olson & Mossman 2003; Quah
2008; Vanstone 2006; Vanstone & Hahn 2010). Olson and Mossman (2003) inspect the

24
forecasting power of ANN against those produced by using ordinary least squares
(OLS) and logistic regression (logit) methods in the Canadian stock market. Inspired by
Ou and Penman (1989), they employ 61 ratios available for the Canadian market to
forecast annual returns. Examining a total of 2352 firms, Olson and Mossman (2003)
observe that, for the out-of-sample forecasting period of 1983 to 1993, neural network
dominates the best regression models for both point estimation, and high or low returns
classifications. Moreover, the ANN-based fundamental trading rule also yields superior
abnormal returns over the traditional statistical techniques.
Eakins and Stansell (2003) examine whether ANN-based fundamental strategy can
produce superior returns in the US. Using five variables associated with traditional
fundamental as inputs, and per cent total return from price appreciation plus dividends
as output, their study spans 1977 to 1996. The authors find that the neurally enhanced
strategy not only generates greater returns compared to the DJIA, S&P 500, and raw
fundamental screens, it also yields better risk-return tradeoffs as measured by the
Sharpe ratio. The study shows that ANN is capable of selecting superior stocks by using
value-based indicators as input and thus disconfirms the efficient capital market.
More closely related to this thesis, Vanstone (2006) builds ANN-based fundamental
trading systems in Australia by taking into account all three major functions of a trading
strategy as stated in Chande (1997).19 Using in-sample data (1994 to 2001) on the ASX
200 and ASX All Share, Vanstone (2006) trains two ANNs based on the fundamental
indicators used by Aby, Briscoe, Elliott et al. (2001) and Graham (as described by Lowe
1994) to build two trading systems, one for each market. He also incorporates trading
budget, a static 1% position sizing, and a stop loss rule with the threshold being identified
using maximum adverse excursion (MAE). He finds that out-of-sample (2002 to 2003),
both fundamental strategies outperform the B&H rules, with significant profit and greater
trading metrics, such as Sharpe ratios, profit factors and payoff ratios, even after 1% of
cost (one way). The results contest semi-strong efficiency and suggest that the use of
ANN trading strategies trained using accounting information as beneficial for traders.
19 As noted in Chapter 1, Vanstone (2006) also develops neurally enhanced technical trading systems. This will be discussed later.

25
Quah (2008) investigates three soft computing techniques for fundamental screening of
DJIA stocks. Using a sample of 1,630 firms for the period 1995 to 2004, he focuses on a
total of 11 variables drawn from Aby, Briscoe, Elliott et al. (2001) and Graham and
Dodd (1934). The multi-layer perceptrons (MLP) and adaptive neuro-fuzzy inference
systems (ANFIS) yield recall rates of 62.787% and 62.538%, respectively. Both models
outperform the market in the validation and test sets, with ANFIS producing the best
results. The third model, the general growing and pruning radial basis function (GGAP-
RBF), is not capable of beating the market. Nonetheless, the study is limited in terms of
practicality, and the author suggests that future research can examine the fundamental
model within realistic trading simulations.
Using more recent data, Vanstone and Hahn (2010) re-examine the trading performance
of fundamental-based ANN trading systems in Vanstone (2006) on ASX 200. Focusing
on the indicators used by Aby, Briscoe, Elliott et al. (2001) as inputs, Vanstone and
Hahn (2010) train the neural network in-sample (1994 to 2003) to forecast unseen out-
of-sample (2004 to 2008) data. The study also includes cost and budget, as well as the
effect of slippage. Their ANN trading system slightly outperforms the market, but not
the non-neurally enhanced rule. However, the restrictive nature of the non-ANN
strategy produces very limited trades (only two) for making valid statistical inferences
and for practical use. The authors conclude that the viability of using ANN-based
fundamental strategy ultimately depends on the trading metrics.
Alexakis, Patra and Poshakwale (2010) show that portfolios formed on the basis of
financial ratios yield greater than average returns. Investigating returns predictability in
the Athens Stock Exchange (ASE), the authors employ a set of 10 fundamental ratios in
building a dynamic panel data regression model (from 1993 to the year prior to portfolio
formation) to form winner and loser portfolios for the subsequent years (2004, 2005 and
2006). They demonstrate that a strategy that buys (sells) winner (loser) portfolios
generate a total excess returns of 74.36% for the three years. The finding indicates that
the Greek market is not semi-strong efficient, and that financial ratios contain
information capable of predicting stock returns.
Exploring the properties of accounting numbers in China, Chen, Firth and Gao (2011)
observe that operating income or core earnings (CORE) are more persistent than non-

26
core earnings (NCE) during the period of 1996 to 2008. The authors find that earnings
information is not fully incorporated into stock prices because the market seems to
undervalue (overvalue) CORE (NCE), especially among the state-controlled firms.
Accordingly, their hedge portfolio—which simultaneously longs the highest (lowest)
ΔCORE (ΔNCE) and shorts the highest (lowest) ΔNCE (ΔCORE)—produces a mean
abnormal return of 6.13%. The results indicate that traders can capitalise on the semi-
strong market inefficiency in China, which support the firm foundation theory.
Most recently, Piotroski and So (2012) investigate the performance of fundamental
strategy in the US for the period 1972 to 2010 on the portfolios of firms with high,
medium and low PBV. These three value/glamour portfolios are further divided into
three parts according to the strength of their fundamentals, as represented by the
FSCORE.20 The authors then explore value/glamour zero-investment strategy, which
long (short) high (low) FSCORE value (growth) firms. The strategy produces
significant and remarkably high 12-month (24-month) ahead size-adjusted returns of
22.64% (37.66%), which confirms the predictability of returns based on financial
statement information. Overall, the result is inconsistent with the risk-based
explanations as proposed by Fama and French (1992).
Inspired by Piotroski (2000), Dorantes (2013) explores the trading performance of
FSCORE-sorted portfolios in the Mexican market. The author finds that the fundamental
strategy works well for predicting returns one year ahead. The high FSCORE portfolio
produces a mean one-year excess returns of 1.62% for the period 1993 to 2011. The
author then simulates the strategy to screen stocks on a year-by-year basis and observes
that this strategy generates 952% for the period 1993 to 2010—against 651% produced
by the market index. The results seem to provide contradictory evidence to the semi-
strong form of the efficient market theory.
In a nutshell, the ability of using widely available and disseminated financial
information to yield above average returns has been observed in large amount of
literature. The ability of the neural network to enhance fundamental signals also seems
20 In summary, their approach produces nine portfolios, namely value (weak expectations), middle and glamour (strong expectations) firms, each with strong, medium and weak fundamentals.

27
beneficial. In addition, the apparent lack of market efficiency (in the semi-strong sense)
in the emerging markets provides profitable opportunities for value investing. Overall,
the results appear not likely to be attributed to higher risks. The presence of an
accounting-based anomaly provides support for the firm foundation theory, which
contradicts the efficient market theory.
2.2.2 Corporate Governance Analysis
2.2.2.1 Definition
In this thesis, we define corporate governance analysis as a stock screening strategy that
attempts to identify strong or weak governance firms through the use of corporate
governance information.21 Corporate governance, in turn, can be described as ‘the ways
in which suppliers of finance to corporations assure themselves of getting a return on
their investment’ (Shleifer & Vishny 1997, p. 737).22 As has been argued by Bebchuk,
Cohen and Wang (2013), if corporate governance is not yet reflected in the market
price, a trader will be able to generate abnormal returns by trading on the basis of
publicly available governance information.
Like its traditional counterpart, the use of corporate governance trading strategy is
supported from the theory of firm foundation. Graham and Dodd (1934) argue that
fundamental theory is not restricted only to quantitative factors, but also qualitative
issues (such as the character of management), which can affect intrinsic (firm
foundation) values of the firm. Loh (2005) similarly affirms that publicly available
information is not limited to financial variables. The consideration of governance
information is consistent with the recent statement made by Eugene Fama to possibly
21 Our definition for this new fundamental analysis is analogous to how the use of financial information (for traditional fundamental analysis) is also defined as financial statement analysis. 22 Despite the vast attention given to governance issues, there is currently no common definition of corporate governance. Anand (2008) argues that this is because corporate governance is a broad concept that covers different aspects of a firm. For example, other than the definition provided by Shleifer and Vishny (1997) above, Tirole (2001, p. 4) defines corporate governance as ‘the design of institutions that induce or force management to internalize the welfare of stakeholders’. The differences in definitions, however, do not affect our analysis in any way. All governance instruments examined in this thesis (see Chapter 3) are common variables associated with corporate governance and supported from prior literature in top/leading journals.

28
consider socially responsible information in refining firm foundation.23 In consequence,
the theory of using corporate governance trading strategy to generate abnormal returns
(governance anomaly) is in opposition to the doctrine of semi-strong efficient market
theory (Aman & Nguyen 2008; Bebchuk, Cohen & Wang 2013; Moorman 2005).
Both traditional fundamental analysis and new fundamental research are identical in
regards to their approach, since both screen for securities. While financial statement
analysis selects undervalued stocks using financial information, corporate governance
trading strategy screens firms based on the governance criteria (Aman & Nguyen 2008;
Bebchuk, Cohen & Ferrell 2009; Budde 2008; Drobetz, Schillhofer & Zimmermann
2004; Gompers, Ishii & Metrick 2003). From the trading point of view, a mechanical
buy (sell) signal is emitted when the firm has good (bad) corporate governance.
2.2.2.2 Strategy in Practice
As documented from the survey among 200 institutional traders in 31 countries by
McKinsey and Company (2002), the value of corporate governance for trading decisions
is deemed equal to financial statement analysis. In practice, its importance brings forth
several governance advising and/or monitoring firms, such as the The Corporate Library
(TCL), Institutional Shareholder Services (ISS) and GovernanceMetrics International
(GMI),24 which produce their own governance rating systems. GMI, for example, claims
that firms ‘which emphasize corporate governance and transparency can, over time,
generate superior returns’ (GMI n.d., para. 3). It is anticipated that these mechanisms help
to measure the extent of governance practices and in turn assist traders in making trading
decisions (see Mallin 2007).
More prominently, the use of corporate governance information as an element for
socially responsible investing is evident through the alliance between the Enhanced
Analytics Initiative and the United Nations Principles for Responsible Investment
23 See Ideas that changed the theory and practice of investing: a conversation with Eugene F. Fama, published by the Journal of Investment Consulting in 2008. Socially responsible investing is an umbrella term that also includes corporate governance. See Budde (2008) and Renneboog, Ter Horst and Zhang (2008). 24 The firm is now known as GMI Ratings, which was formed through a merger of TCL, GMI and Audit Integrity in 2010.

29
(UNPRI 2008).25 The initiative promotes the importance for improved trading research
by appraising the impact of extra financial issues.26 With their current combined total
assets under management of over US$32 trillion (UNPRI 2013), the weight of corporate
governance information in the context of trading strategy is clearly manifested.
Within the context of Malaysia, the use of corporate governance trading strategy has also
come into view. For example, Corston-Smith Asset Management is involved with making
trading decisions based on in-depth stock analysis using governance information.
Likewise, Hwang Select Opportunity Fund mainly trades in firms that practice good
corporate governance. The gravity of corporate governance analysis is further supported
by Tan Sri Zarinah Anwar, chairman of the Securities Commission of Malaysia. She
argues that ‘[c]orporate governance is today an established investment criterion. Investors
are increasingly weighting corporate governance as a critical factor in deciding on the
quality of a particular investment’ (Anwar 2009, para. 15). Overall, the above clearly
shows that practical use of governance trading strategy in the real world is prevalent.
2.2.2.3 Existing Literature
Discourse on corporate governance has been evoked since the work of Adam Smith in
1776, who discusses the subject of ownership and control, and Berle and Means (1932),
who raise the issue of the principal-agent problem. Although much literature has
examined the issues of corporate governance and/or its relationship with some form of
firm performance (for example, Baliga, Moyer & Rao 1996; Black 2001; Dye 1993;
Fama & Jensen 1983; Haniffa & Hudaib 2006; La Porta et al. 1998; Lipton & Lorsch
1992; Mak & Kusnadi 2005; Martin & Parker 1995; McConnell & Servaes 1990;
Mitton 2002; Pathirawasam & Wickremasinghe 2012; Shleifer 1998; Tirole 2001;
Yermack 1996), there is a relative lack of research examining corporate governance
specifically within the context of developing and testing trading strategy. This is not
unexpected. As discussed earlier, the use of corporate governance information for trading
25 UNPRI is an initiative of the UN Global Compact and the UN Environment Programme Finance Initiative. The collaboration with Enhanced Analytics Initiative was announced on 6 October 2008. 26 UNPRI (2008, para. 3) describes extra financial issues as ‘fundamentals that are generally not part of traditional fundamental analysis but have the potential to impact companies’ financial performance or reputation in a material way’. This includes corporate governance.

30
strategy is a rather new area of fundamental research. The study by Gompers, Ishii and
Metrick (2003) provides a reasonable starting point for a review of research in this field.
In their highly influential study, Gompers, Ishii and Metrick (2003) examine the
relationship between corporate governance and firm performance in about 1,500 firms,
sourced from the Investor Responsibility Research Center (IRRC), during the 1990s.
Based on 24 governance variables focusing on anti-takeover provisions, they develop a
governance index (G) that is measured as the sum of each binary variable. In defining
good and weak governed firms, the authors rate those with stronger rights (democracy
firms) with their lower G index (G ≤ 5), while weaker rights (dictatorship firms) are
those with a high G index (G ≥ 14). They find that shareholder rights are strongly
associated with firm value. As well, a simple trading strategy that buys (sells)
democracy (dictatorship) firms yields an abnormal return of 8.5% per annum. The result
appears to be in direct contrast to the logic of semi-strong efficient market theory, and
suggests that a trader can construct a profitable strategy by screening stocks on the basis
of publicly available corporate governance information.
Drobetz, Schillhofer and Zimmermann (2004) find similar results. Focusing on the
German stock market, they examine if the differences in governance quality among the
firms can explain stock returns. To do this, they construct a corporate governance rating
(CGR) of firms based on the responses from their questionnaires. Their CGR comprises
of 30 criteria from five categories, namely corporate governance commitment,
shareholder rights, transparency, management and supervisory board matters, and
auditing. Analogous to Gompers, Ishii and Metrick (2003), Drobetz, Schillhofer and
Zimmermann (2004) focus on two portfolios – the principal portfolio (firms with high
CGR), and the agent portfolio (firms with low CGR). They employ a simple trading
strategy that long (short) high (low) CGR companies. The strategy generates about 12%
of annual abnormal returns.
Extending the approach in Gompers, Ishii and Metrick (2003) to European markets,
Bauer, Guenster and Otten (2004) use similar screening method. Using CGR by
Deminor CGR, which includes most of the firms listed on the FTSE Eurotop 300 for
2000 and 2001, they describe the top (bottom) quintile of firms with the highest (lowest)

31
CGR as good (bad) for the European Monetary Union (EMU) portfolio, while for the
UK, portfolios are based on quartile cut-off points.27 For the period January 1997 to July
2002, they find that the governance trading strategy produces an annual return of 2.1%
(7.1%) for the EMU (UK) portfolio. Like Drobetz, Schillhofer and Zimmermann (2004),
however, they only use constant ratings for the period 1997 to 2000 because of the
unavailability of CGR for these years. Overall, their results indicate that good corporate
governance is associated with higher stock returns and market value.
Whereas previous studies investigate the performance of governance trading strategy in
the developed markets of the US and Europe, Chen et al. (2007), Aman and Nguyen
(2008) and Bauer et al. (2008) test the relationship between CGI and stock returns in the
Asian markets. Using four governance variables (CEO duality, board size, management
holdings and block holdings), Chen et al. (2007) focus on the aspect of ownership and
leadership structure for firms listed on the Taiwan stock market. Based on their CGI,
they divide firms into portfolios of weak, moderate, and strong governance. Examining
the period 1992 to 2001, they observe that the portfolio of firms with strong corporate
governance earns an annual return of 8.8%, whereas firms with moderate governance
only earn 2.02%. Further, the portfolio of weakly governed firms records an annual loss
of -6.12%. The results indicate that traders can profit by screening firms with good
corporate governance.
Conflicting results, however, are observed in the Japanese market. Aman and Nguyen
(2008) investigate their CGI (which is built based on board structure, ownership
characteristics and quality of disclosure) over the period 2000 to 2005, and find that
firms with weak governance outperform those with good governance. Nonetheless, this
is due to the greater risk exposure associated with the former. Overall, they argue that
their result is consistent with a semi-strong efficient market. In contrast, Bauer et al.
(2008), using the data from GMI, find that a simple zero-investment strategy using a 5%
cut-off point produces an outperformance of 8.72% per annum for the period 2000 to
2004, in line with the argument that the market is not efficient. Several factors may have
caused these discrepancies, for example, differences in the sample firms or period used, 27 This is different to the absolute index measure as employed in Gompers, Ishii and Metrick (2003). The difference in cut-off points between the EMU and the UK is due to the smaller sample size of the UK portfolio.
32
but CGI formulation seems most likely. Indeed, as argued by Bauer et al. (2008), some
aspects of corporate governance are not material to shareholders in Japan.
In another major study, Bebchuk, Cohen and Ferrell (2009) build an entrenchment (E)
index using a more parsimonious model to Gompers, Ishii and Metrick (2003), focusing
only on six provisions out of the 24 used in the G index: (1) staggered board; (2) limits
to amend bylaws; (3) limits to amend charter; (4) supermajority; (5) golden parachutes
and (6) poison pill. Based on the data from IRRC for the period 1990 to 2003, they find
that a simple trading strategy of buying (selling) good (weak) governed firms with E = 0
(E ≥ 5) yields about 7% of annual abnormal returns. In contrast, they observe that the
remaining 18 provisions from the G index in Gompers, Ishii and Metrick (2003) are not
correlated to abnormal returns.
Most recently, Bebchuk, Cohen and Wang (2013) argue that the returns on the
governance trading strategies in Gompers, Ishii and Metrick (2003) (G index) and
Bebchuk, Cohen and Ferrell (2009) (E index) are particular to the 1990s period. Re-
examining the same rules in the same dataset, they find that the governance trading
strategies produce statistically and economically significant results for the first sample
period of 1990 to 1999. However, for the second period of 2000 to 2008, the strategies
no longer yield abnormal returns. The returns generated by these strategies are not
significantly different from zero. Whereas the market seems semi-strong inefficient to
process corporate governance information in the 1990s, Bebchuk, Cohen and Wang
(2013) argue that the dissipation of returns from the trading strategies is due to the fact
that market participants already learn the differences between good and bad governance
and invest in it, making the stock prices already reflect this information. They conclude
that trading strategies based on the G and E indexes are no longer profitable.
The results from Bebchuk, Cohen and Wang (2013) do not mean any corporate
governance trading strategy is totally ineffective and is no longer useful. In fact, their
study is restricted to the use of G and E indexes developed by Gompers, Ishii and
Metrick (2003) and Bebchuk, Cohen and Ferrell (2009). The use of other governance
indicators and/or more sophisticated trading rules (for example, where the trading rule is
enhanced using neural networks) may produce an even superior outperformance. Indeed,
in reflecting on Bebchuk, Cohen and Wang (2013), Bebchuk (2012) later affirms that

33
there are still possibilities to make profit from a governance trading strategy, since there
are other governance instruments that are not efficiently priced yet.28 Overall, the above
literature review suggests that there are potentials for constructing profitable strategies
via screening stocks on the basis of publicly available corporate governance information,
which exploits the inefficiency of the capital market.
2.2.3 Technical Analysis
2.2.3.1 Definition
Unlike traditional fundamental and corporate governance analysis, which is concerned
with stock selection policy, technical analysis is a market timing strategy. Instead of
analysing firm fundamentals, technical strategy focuses on studying the market for
making trading decisions. Rotella (1992, p. 101) defines technical analysis as ‘the study
of past market behaviour to determine the current state or condition of the market’.
Since technicians believe any price influencing factors (such as fundamental,
psychological, etc.) is already reflected in the stock prices, the only requisite is the study
of the market itself (Murphy 1999).
Based on the castle in the air theory originating from Keynes (1936), 29 technical
strategy deals with analysing market data (such as price and volume) to forecast future
trends or returns (Achelis 2001; Edwards, Magee & Bassetti 2007; Murphy 1999). The
theory, therefore, is in direct contrast to the weak-form market efficiency (Fama 1970;
Malkiel 2007). Murphy (1999) outlines three philosophies behind the strategy: (1)
prices move in trends, (2) the market discounts everything and (3) history tends to
repeat itself. Since there are myriad technical indicators, entry and exit rules may vary
from one another. In most cases, however, from the trading viewpoint, an entry (exit)
signal may be emitted when the indicator value reaches or crosses above (below) some
specified thresholds, or some other indicators.
28 For other studies in corporate governance and equity returns, see for example Bhagat and Bolton (2008), Core, Guay and Rusticus (2006), Johnson, Moorman and Sorescu (2009) and Moorman (2005). 29 Keynes’ (1936) idea of investing is further discussed in Malkiel (2007).

34
In general, there are two types of technical analysis. One is subjective analysis (or
charting), while the other is objective (or quantitative) analysis (Murphy 1999; Rotella
1992). Objective analysis refers to studies that can be analysed and confirmed
mathematically (Rotella 1992). In contrast, charting, to a large extent, depends on
subjective interpretation (Lo, Mamaysky & Wang 2000; Rotella 1992) and it is
therefore (more) problematic for statistical verifications (Rotella 1992). Further, even
among the skilled technicians, charting is largely employed inconsistently (Vanstone
2006). As argued by Murphy (1999), the practice of charting is mainly considered an
art, rather than a science. In view of these factors, this thesis focuses on objective
analysis, and this is consistent with Brock, Lakonishok and LeBaron (1992), Dryden
(1970), Fama and Blume (1966), Lai, Balachandher and Nor (2007), Loh (2005), Rosillo,
de la Fuente and Brugos (2013), Thawornwong, Enke and Dagli (2003), Vanstone (2006)
and Wong, Manzur and Chew (2003), to name a few. In short, the use of quantitative
analysis in this study allows for a verifiable empirical test, objective practical applications
and alleviating our analysis from subjective interpretations. For readers interested in
charting, we direct them to the following work of Lo, Mamaysky and Wang (2000).
2.2.3.2 Strategy in Practice
Long before the modern theory of finance, ancient societies began using past prices to
forecast future returns. In fact, an elemental form of technical analysis was used by
ancient civilizations almost three millennia ago. Dating back to about the 7th century
BC, archaic diaries detail the prices of six commodities for the purpose of prediction by
ancient Babylonians (Lo & Hasanhodzic 2010).30 Throughout the ages, the technical
approach has been used by the western worlds of the Babylonians, Greeks and Romans,
through to the Middle Ages and the Renaissance, and thereafter through to Asian
countries (Lo & Hasanhodzic 2010). 31 It is only in the 19th century that modern
technical analysis surfaced. In 1884, Charles Dow developed the Average32 and noted
its fluctuations and capability to forecast future performance (Edwards, Magee &
30 The commodities were barley, dates, sesame, wool, mustard/cuscuta and cress/cardamom. 31 We strongly recommend readers interested in the history of technical analysis to read Lo and Hasanhodzic (2010). They provide many details of its historical development from the ancient times to the modern era. 32 The Average is the mean of 11 essential stocks at that time.

35
Bassetti 2007). The DJIA is a direct progeny of the Dow Theory (Achelis 2001;
Edwards, Magee & Bassetti 2007). It is not only an index, but also the barometer of the
US economy. Later works, especially by Wilder (1978), contribute to modern technical
analysis by offering new technical rules that are now largely employed among trading
communities and researched at length among academics.
Although technical analysis has been met with scepticism in the past (Malkiel 2007), its
value in today’s financial practice is pronounced. As shown by prior surveys discussed
earlier, the strategy is used not only among traders, but also among professionally
qualified practitioners. Indeed, according to Wong, Manzur and Chew (2003), there are
now many stockbroking firms that have trading teams focusing on technical analysis.
Most (if not all) stock exchanges, for instance, Bursa Malaysia, FTSE, ASX and NYSE,
publish technical charts on their websites. Moreover, formal technical qualifications
also receive professional and regulatory recognitions.33 Overall, technical analysis is
commonly used for short-term trading, where the degree of importance is often greater
than that of fundamental analysis.
Some examples of notable technicians include Munehisa Homma, John Maynard
Keynes, John Murphy and Ralph Acampora. Homma, arguably the first well-known
technical analyst, accumulated vast wealth using the strategy in the Osaka and Edo (now
Tokyo) markets in the 1700s, and later, was appointed financial consultant to the
government and awarded the honorary title of samurai (Nison 1991). His method
developed into the Japanese candlestick, as it is known today. A world-renowned
economist, Keynes was also a successful technical trader. Indeed, Buffett (1991) also
acknowledges the brilliance of Keynes as both a trader and an academician. According
to Malkiel (2007), Keynes highlights the importance of behaviour that shapes the
inclination of traders to build castles in the air. By analysing potential castle-building,
he advocates the use of market timing to buy stocks before the crowds. Despite
spending less than an hour each morning on playing the market, Keynes yielded several
million pounds for himself and substantially increased the market value of the
33 For example, the Chartered Market Technician (CMT) by the Market Technicians Association is recognised by the NYSE. The Securities Industry Development Corporation (SIDC), which is the training and development division of the SC of Malaysia, also administers or provides programs on technical analysis for Continuing Professional Education (CPE).

36
endowment for King’s College, Cambridge University (Malkiel 2007). Other technicians
mentioned above have also made reputable achievements. For further information, we
direct interested readers to Lo and Hasanhodzic (2009) for their thought-provoking
interviews with some of today’s famous practitioners in this domain.
2.2.3.3 Existing Literature
Early empirical studies (such as Dryden 1970; Fama & Blume 1966; Jensen &
Benington 1970; Levy 1967) find mixed results on the profitability of technical trading
rules. Fama and Blume (1966) examine 24 filter rules (using the values from 0.5% to
50%) on 30 individual stocks from the DJIA. Using daily data from 1956 to 1958
(varying initial dates in the samples) to 1962, they discover that even before costs,
except for two securities, the filter rules cannot outperform the simple B&H. Moreover,
after the inclusion of costs, only four stocks have positive mean returns per filter
strategy. Their results suggest that prices follow a random walk and that the US market
is weak-form efficient.
Levy (1967) tests the profitability of relative strength on a sample of 200 NYSE
individual stocks. Using weekly data from 1960 to 1965, he discovers that the strategy
based on 26 weeks produces mean price appreciation of about 20.1% per year, against
only 12.8% for all stocks. The gains from technical trading rule continue to outperform
random selection, even after deducting brokerage fees. In contrast to Fama and Blume
(1966), the findings in Levy (1967) seem to suggest that the US market is not efficient
even at the weak form.
Jensen and Benington (1970) dispute the results found in Levy (1967) and attribute
them to data snooping. Re-examining the strategies using monthly data from 1926 to
1966 on 29 subsamples of 200 NYSE firms, they find that on average, the technical
rules yield about 1.4% higher than the B&H, but the result comes before subtracting
costs. After costs, technical rules only either equal or underperform B&H. Further, after
adjusting for risk, the B&H rule dominates technical strategies.

37
Making a departure from earlier studies that focus on the US market, Dryden (1970)
argues there is a danger in extrapolating US results to UK data. Extending filter rules on
indices and one individual stock in the UK,34 he finds that before costs, the rules are
consistently superior to the B&H. Moreover, even after deducting costs (0.625% per
trade), his long-only strategies persistently achieve better results than the B&H policy.
On this basis, the results, to a certain extent, support the profitability of technical trading
rules, and the UK market appears to be inefficient in processing historical market data.
Whereas earlier academic studies focus on testing the profitability of simple technical
rules, Wilder (1978) introduces a range of new and sophisticated indicators for technical
traders. These indicators include the average directional movement index (ADX),
average true range (ATR), relative strength index (RSI) and parabolic time/price
system. Implicit in these is the view that the stock market does not incorporate historical
data efficiently. In addition, the author also stresses the value of money management.
If technical analysis is useful, we would expect that by following the recommendations
made by advisors (using the strategy), a trader will be able to obtain above market
returns. In view of this, Dawson (1985) examines whether trading the stocks
recommended by an investment advisory firm is profitable. The study is based on a total
of 292 round-trip technical signals among 66 different firms published in a newsletter
(by an advisory firm in Singapore) dating from 1979 to 1984. He finds that most sales
takes place following a stop loss, and that prices of recommended stocks appreciate, but
mostly because of the general market trends. However, the strategy produces loss (small
gain) after deducting commissions of 2% (1%), and none produces statistically
significant returns. While technical signals (advocated by the firm) may have contained
information related to price, they underperform the market and the B&H, and this is
consistent with the weak-form EMH. Note that the results are based solely on using
recommendations from a newsletter, whereas there is a possibility that other technical
rules can provide superior performance.
34 He tests the rules on three indices, namely the Financial Times-Actuaries 500 Share Indices, Financial Times-Actuaries (Capital Goods Index), and Daily Mail Industrial Share Price Index. The individual stock is Tesco.

38
White (1988) attempts to decipher the non-linearity and patterns in the financial times
series using ANN. In particular, he trains the network to predict the daily returns of
IBM stock, but finds that the results do not provide any evidence to cast doubt on the
efficient market theory. This is contributed to network overfitting or learning factors,
which are transient. Nonetheless, he proposes that instead of reducing forecasting error,
future research might instead focus on trading profits that may yield better results.
In a widely cited article, Brock, Lakonishok and LeBaron (1992) analyse the daily data
of the DJIA from 1897 to 1986 using two popular and simple technical rules, namely
the moving average (MA) (with fixed [FMA] and variable [VMA] lengths) and trading
range breakout (TRB). To eliminate whiplash signals, they also test rules that include a
1% band around the MA. They find that technical rules can generate profitable results,
and the results are not consistent with the stochastic processes of random walk with
drift, AR(1), GARCH-M (generalised autoregressive conditional heteroskedasticity in
mean) and EGARCH (exponential GARCH). Overall, their results reveal that technical
rules have predictive power and therefore appear to be in contrast with the logic of
EMH. Nonetheless, no adjustment is made for trading costs.
Bessembinder and Chan (1995) address the limitation in Brock, Lakonishok and
LeBaron (1992) by allowing for trading costs, which are computed based on the break-
even costs that would have eliminated trading returns. Replicating the same set of rules
in Brock, Lakonishok and LeBaron (1992) onto six Asian indices, Bessembinder and
Chan (1995) find that after deducting costs, technical rules can no longer yield profits in
the more developed markets of Hong Kong, Japan and Korea. However, the strategies
can still offer positive gains in the emerging markets of Malaysia, Thailand and Taiwan,
inferring that these markets are weak-form inefficient.
Since stock prices exhibit a highly chaotic nature, Tsibouris and Zeidenberg (1995)
argue that traditional tests of market efficiency are imperfect because of their use in
linear models. Thus, in modelling complex and dynamic market behaviour, they suggest
the use of ANNs. They investigate six stocks from 1988 to 1990 (from CRSP), using the
first two years as a training set for out-of-sample (one year) forecasting. Nine inputs,
based on the signs of returns in previous periods (each of the past five days, two weeks,
one month, six months and one year), are used, where positive (negative) returns are

39
coded as 1 (0). The results are mixed, but there is some evidence that suggests that
ANN have predictive ability. It remains to be seen if ANN trained with more advanced
technical variables can yield superior results.
Yao, Tan and Poh (1999) employ their ANN, which also considers more sophisticated
technical indicators as inputs, to forecast the KLCI. This is unlike the simple variables
used by Tsibouris and Zeidenberg (1995). These indicators include MA, momentum,
RSI, Stochastics (%K) and moving average of Stochastics (%D). Yao, Tan and Poh
(1999) use daily data from January 1984 to October 1991. In short, their ANN-based
trading strategies can achieve an annual return of 26%, which outperforms the passive
benchmark, bank savings and the ARIMA (autoregressive integrated moving average)
models. The authors conclude that future research can include both fundamental and
technical indicators as inputs, which might improve forecasting power.
Studying the profitability of a simple ANN-based technical strategy in the Madrid stock
market, Fernández-Rodríguez, González-Martel and Sosvilla-Rivero (2000) find that it
is superior to the B&H policy for both the bear (with a total return of 48% from the
ANN versus -40% from the B&H) and stable (27% versus 0.19%, respectively)
markets. However, it only yields 29% and underperforms the B&H (with a return of
44%) during the bull market. These results are obtained in the absence of costs. Note
that the authors use simple inputs to the ANN (where the network is trained using the
corresponding previous nine days’ returns) rather than sophisticated technical indicators.
Gunasekarage and Power (2001) explore the profitability of simple moving average
rules in the emerging markets of Bangladesh, India, Pakistan and Sri Lanka for the
period January 1990 to March 2000. Using similar VMA and FMA rules to those of
Brock, Lakonishok and LeBaron (1992), the authors show that these technical strategies
have predictive ability and produce significantly different returns to the ones generated
by the buy-and-hold policy. Overall, their findings refute weak-form efficiency in the
South Asian stock markets and lend credence to the castle in the air theory.
Thawornwong, Enke and Dagli (2003) examine the use of sophisticated technical
indicators for training ANN-based trading strategies. Specifically, they investigate
whether ANN-based trading strategies, using RSI, money flow index, MA, Stochastic

40
oscillator and moving average convergence divergence (MACD) as inputs, are capable
of outperforming non-ANN-based technical rules and the B&H. Using various ANN
models and the integration of the network outputs on three stocks (Lockheed Martin,
Caterpillar and Delta Air Lines), they observe that out-of-sample (July to December
1999), the ANN-based strategies outperform the B&H and raw technical rules, in terms
of average signs (correct prediction of future price changes), portfolio returns and
Sharpe ratios, even after 1% of round-trip trading costs. The study concludes that ANN
can detect non-linearity in technical indicators and hence improve trading performance.
The performance of technical trading strategy (without soft computing) is investigated
in Wong, Manzur and Chew (2003). The authors test the most established trend (MA)
and counter-trend (RSI) indicators. Using Singapore Straits Times Industrial Index
(STII) data from 1974 to 1994, the results show that, on the whole, technical strategies
can produce significant positive returns. Despite ignoring costs, Wong, Manzur and
Chew (2003) support that their results are relevant for members of the exchange who
are exempted from commissions.
Two studies inspired by Brock, Lakonishok and LeBaron (1992) published in 2005,
focusing on two Oceania countries, find identical results on the markets becoming more
efficient over time. Marshall and Cahan (2005) test a total of 12 technical rules on the
New Zealand NZSE 40 index from 1970 to 2002. While the first subsample period
(1970 to 1980) yields significant returns, informational efficiency increases and the
trading rules can no longer provide returns in the most recent period (1992 to 2002).
Loh (2005) examines and compares the performance of technical rules, time series
models and their combination in the Australian stock market. Based on the ASX All
Ordinaries index data from 1980 to 2002, she finds that over time, the Australian market
becomes increasingly efficient with all strategies, in due course, losing their
profitability. The combination strategy performs better than the time series models, but
worse than technical analysis. However, her study employs simple trading strategies and
tested on broad index, and she proposes future research use more advanced models and
examine individual stocks.

41
Investigating simple VMA, FMA and TRB rules on nine popular Asian market indices,
Lai and Lau (2006) also incorporate trading costs and explore the performances of these
rules from January 1988 to December 2003. Both VMA and FMA rules perform well
and yield economically significant profits in the emerging markets of China, Indonesia,
Korea, Malaysia, Taiwan and Thailand, as well as the developed markets of Singapore
and Hong Kong, with the exception of Japan. Nonetheless, the TRB rules do not
provide promising results. Their findings suggest that moving averages can still produce
profitable opportunities, especially in the less developed capital markets.
In another study, Lai, Balachandher and Nor (2007) examine whether technical trading
rules can predict daily returns of the KLCI, using data from the year 1977 to 1999.
Overall, they find that under the assumption of homoscedasticity, the Malaysian market
(based on daily and weekly returns) does not follow a random walk. To see if this non-
randomness can be exploited, they use FMA and VMA rules as in Brock, Lakonishok
and LeBaron (1992), and consider cost by using the method described in Bessembinder
and Chan (1995). In particular, they find that both 60-day FMA and VMA produce
significant profits when compared to the B&H, even after costs. The results are in line
with the previous finding in Malaysia by Bessembinder and Chan (1995), and provide
evidence against a weakly efficient market.
In recognising the limitations of prior research to reflect real-world trading, Vanstone
(2006) considers all three major functions of a trading system to develop ANN-based
technical strategies in Australia. 35 Using data from 1994 to 2003 on two separate
datasets, he trains two ANNs using a myriad of technical indicators to build two trading
systems (one for each market) in-sample (1994 to 2001). The trading systems
incorporate a static 1% money management and stop loss with the threshold determined
using MAE. He also includes 1% (one way) cost. Out-of-sample (2002 to 2003), one
trading system performs well on the ASX All Share (with significant profit and greater
Sharpe ratio than the B&H). However, another strategy underperforms B&H in the
S&P/ASX200, making a loss and negative return to variability. Vanstone (2006)
attributes the poor performance of this technical trading system to poor selection of
35 Recall that the three major functions are the rules to enter and exit the trades, money management and risk control. As mentioned earlier, the work by Vanstone (2006) is closely related to this thesis.

42
input variables, listless market, tight stop loss threshold and the fact that S&P/ASX200
is more efficient than the ASX All Share.
The ability of technical rules to produce returns continues to be scrutinised by academic
communities. Most recent results (for example, Chong & Ng 2008; Fifield, Power &
Knipe 2008; Kara, Acar Boyacioglu & Baykan 2011; Kung & Wong 2009; Metghalchi,
Marcucci & Chang 2012; Rosillo, de la Fuente & Brugos 2013; Vanstone & Hahn 2010;
Yu et al. 2013) are still mixed. Consistent with Marshall and Cahan (2005) and Loh
(2005), Kung and Wong (2009) observe that markets are becoming more efficient in
recent times. On the contrary, Metghalchi, Marcucci and Chang (2012) find that even
the simple MA (SMA) rules can still discern price patterns and outperform B&H on
most European stock markets, even after deducting trading costs and considering the
effects of data snooping.
Fifield, Power and Knipe (2008) explore 15 emerging stock markets (such as Argentina,
Chile, Indonesia, Malaysia, Mexico, South Africa and Zimbabwe) from January 1989 to
December 2003. The authors find that the moving average rules can still offer profitable
outcomes in some of these stock markets, but not in the developed UK and US markets.
Similarly, Yu et al. (2013) show that simple technical rules possess superior predictive
ability in the emerging Asian markets as compared to the developed stock markets, but
transaction costs can eliminate the trading profits. One major criticism of these studies,
however, is that they employ simple trading rules. By default, taking into account
realistic constraints, we would not expect simple technical strategies to consistently beat
the market, since simple historical patterns (if any) would have certainly been exploited.
In contrast, the latest studies utilising more advanced rules document that technical
strategies are indeed beneficial. Examining 60 years of Financial Times Institute of
Actuaries 30 (FT30) index data, Chong and Ng (2008) test the profitability of two
oscillators, MACD and RSI. In the main, both strategies outperform the B&H and yield
significant returns, and these persist even in the most recent subsample. Vanstone and
Hahn (2010) re-examine the ANN trading system in the ASX 200 using more recent
holdout data (2004 to 2008), which is trained in-sample from 1993 to 2004. Using 5%
position sizing, the strategy outperforms the market and non-ANN strategy, and yields

43
better Sharpe ratio with 0.96, against 0.63 and 0.22 produced by raw technical rules and
ASX 200, respectively.
Predicting the directional movement of the Turkey stock market index, Kara, Acar
Boyacioglu and Baykan (2011) find that their ANN-based technical strategy produces
superior performance over the support vector machine. Rosillo, de la Fuente and Brugos
(2013) develop a software using RSI, MACD, Momentum and Stochastic in the Spanish
market to generate buy (sell) signals for small traders. They find that returns are reliant
on the type of firms and the indicator being used, and that their method eliminates
ambiguity resulting from utilising different technical indicators.
Taken as a whole, the literature review documents the potential for sophisticated
technical rules in yielding superior results. This is especially the case for those enhanced
using ANNs. In addition, gaining excess returns (over the naive buy-and-hold policy) in
the emerging stock markets also seems possible as these markets are more likely to be
information inefficient at the weak form. The overall findings from the review seem to
lend support to Keynes’ (1936) castle in the air theory.
2.2.4 Fusion Analysis
2.2.4.1 Definition
In contrast to fundamental and technical analysis, fusion analysis is a relatively new
concept of trading strategy. As defined in Varga (2006), fusion analysis is a hybrid
approach that merges together fundamental and technical methods in a trading system.
This is consistent with the definition published by the New York Institute of Finance
(NYIF 2008a), which describes it as the integration of both investment disciplines.
Since fusion analysis is a combination of fundamental and technical analysis, it is
supported from the perspectives of both firm foundation and castle in the air theories.
As a consequence, fusion strategy contradicts the semi-strong form of EMH, which
states that prices efficiently adjust to all publicly available information (Bonenkamp
2010; Fama 1970; Reilly & Brown 2003). Over the years, various techniques have been
employed in augmenting the two strategies. From the trading point of view, the most

44
popular approach is by using fundamental strategy to determine what to buy (sell), and
technical strategy to decide when to buy (sell) (Bernstein 1998; Bollinger 2002, 2005).
Academicians and practitioners have used many terminologies to define the hybrid
system. These include techno-fundamental strategy (Brady 1975; Darvas 1960; Gotthelf
1995), rational analysis (Bollinger 2002, 2005) and fusion analysis (or fusion investing)
(Lee 2003; NYIF 2008a; Palicka 2005, 2012; Varga 2006). Some put a specific label,
such as CAN SLIM® (O’Neil 2009), whereas others (for example Lam 2004; Quah &
Srinivasan 1999) do not provide a particular designation for their strategy.36 In spite of
these variations, the basic concept, which is integrating technical and fundamental
strategies, is inherently synonymous. In other words, these strategies can be considered
fusion analysis (since they combine both streams of analysis), even if they do not
specifically refer to themselves as so.
2.2.4.2 Strategy in Practice
As compared to the millennia old practical applications of technical analysis, and more
than a century of fundamental analysis, efforts to combine both approaches have
commenced only since the 1950s or 1960s. According to Conant (1961), a number of
financial firms (at about that era) already embarked on programs to interweave financial
statement data with technical information. Famous traders, such as Nicolas Darvas,
William O’Neil and John Palicka, also began using fusion strategies during (or slightly
after) that period. Using a small capital of $36,000, Darvas made over $2,000,000 in the
stock market by combining both strategies, in only 18 months (Darvas 1960). In
acknowledging his success, he was featured in TIME magazine. O’Neil, Founder and
chairman of Investor’s Business Daily (IBD), developed and successfully used his
hybrid approach, CAN SLIM®, to garner lucrative wealth. He managed to purchase a
seat on the NYSE at the mere age of 30—one of the youngest ever to achieve such a
feat (Boik 2004). Real life investors, such as David Ryan and Lee Freestone, both won
the US Investing Championships using O’Neil’s strategy using real money (Boik
36 Given the many terms used to describe the hybrid strategy, Bollinger (2005, p. 60) jokingly states that sometimes the combination strategy is even referred to as ‘sneaking a peak at the chart in the drawer.’

45
2004).37 Palicka, who was the Chief Portfolio Manager in Midco Investors (a subsidiary
of Prudential Insurance), turned $50 million of investments into $1.5 billion via his
fusion analysis, in just over 11 years (Palicka 2012).
All in all, the above clearly demonstrates the ability of fusion strategy to generate
lucrative profits in the real world. Indeed, NYIF (2008b) argues there is a growing
number of Wall Street professionals who utilise this strategy. Surveys among analysts
and traders also confirm the prevalent use of hybrid rule. This is further supported by
Edwards, Magee and Bassetti (2007), who argue that in practice, it is highly uncommon
for traders to use exclusively fundamental strategy. In a similar vein, Bernstein (1998)
remarks that compared to pure technicians or fundamentalists, there is a greater number
of traders combining both strategies. Surprisingly, however, empirical literature that
explores the performance of hybrid strategy is still very thin (Bettman, Sault & Schultz
2009; Bonenkamp, Homburg & Kempf 2011).38
2.2.4.3 Existing Literature
Considering that the application of fusion strategy began in the mid-1900s, it is not
surprising that the earliest observable literature in this area is published at around that
period. Darvas (1960) encapsulates the development of his techno-fundamental strategy
and provides anecdotal evidence on how it has profited him in the 1950s. His technique
merges several indicators, inter alia, increased in firm’s earning power and his invention
called the Box Theory. He also places a stop loss order. Some examples of the stocks
traded using the strategy include Texas Instruments, Universal Controls, Thiokol
Chemical and Zenith Radio. Overall, Darvas (1960) shows that the combination strategy
can generate substantial returns.
37 In March 2000, O’Neil was chosen as one of the top 100 Business News Luminaries of the Century by TJFR Group and MasterCard International. 38 In fact, prior research in fusion analysis (including that published in top/leading journals) provides few reviews of literature in this area. For example, Bettman, Sault and Schultz (2009) do not review any literature on combination strategy and argue that literature in this area is almost non-existent. As well, Bonenkamp, Homburg and Kempf (2011) only review very limited studies specific to this field. In contrast, the amount of literature we review in this thesis greatly exceeds those of the existing studies. To our knowledge, our review is the most comprehensive to date in the area of fusion analysis. We believe this review, in itself, is also a contribution to this relatively new field.

46
Hackett (1968) develops a techno-fundamental portfolio management simulation for
students by utilising financial information (obtained from Compustat) and a technical
timing model. More specifically, the programs for the fundamental model comprises of
MASTER (such as dividend and PER), REFINED (which narrows the MASTER list),
BALANCE (comparative balance sheet), INCOME (income statements) and RATIO
(financial ratios). The technical model projects a nine-week price trend for all stocks on
the MASTER list. The study suggests that combining both indicators can improve
trading performance.
The first scientific research in testing fusion strategy is undertaken by Reinganum
(1988). In the study, he examines the common features of 222 stock market winners
based on the historical data of 2,279 NYSE and AMEX firms from 1970 to 1983 (in-
sample). 39 He observes nine fundamental and technical traits common among the
winners: (1) PBR < 1; (2) five-year growth rate (based on quarterly earnings) > 0; (3)
accelerating quarterly earnings; (4) pre-tax profit margins > 0; (5) common shares
outstanding < 20,000,000; (6) relative strength rank ≥ 70; (7) relative strengtht0 >
relative strengtht-1; (8) O’Neil Datagraph rating ≥ 70 and (9) stock price within 15% of
its maximum price during the previous two years. Accordingly, he builds a trading
system that generates a buy signal when a stock fulfils all nine criteria. Out-of-sample
(1984 to 1986), the strategy produces 59 buy signals. The results indicate that the fusion
strategy is economically significant and outperforms the benchmark. On average, the
screened stocks appreciated in value by 86.2%, whereas the S&P 500 appreciated by
only 49.5%. The author suggests that the fusion rule incorporates the stable elements of
a successful strategy.
Inspired by Reinganum (1988), Longo (1996) expands on his study by using the neural
network to differentiate between stock market winners and losers, instead of just
screening for winners. Based on the US data, he identifies 50 top and bottom firms
using compounded returns during the period 1973 to 1992. His fundamental criterion is
based on liquidity, asset management, capital structure, profitability, and market value
ratios, while technical indicators include relative strength and stochastic, among others.
39 He defines winners as the 272 firms included in the Greatest Stock Market Winners: 1970-1983. From the 272 firms, he selects only 222 that match with Datagraph. See Reinganum (1988) for further details.

47
Longo (1996) also includes round-trip trading cost of 0.1%. The best ANN produces a
winner portfolio with an annual compound return of 31.2%, against the market with
only 18.36%. He then uses ANN for market timing to forecast future directional returns
of the S&P 500, and finds that it generates greater accuracy than the B&H. Finally, the
integration of both techniques has resulted in a higher gain, where the fusion strategy
yields 42.1% of compounded return. The results seem to suggest that the US market is
not efficient at the semi-strong form.
While prior studies on fusion strategy focus on the US market, Quah and Srinivasan
(1999) explore whether neural networks can be used to unearth complex relationships
between stock returns with the financial and technical indicators in the Singaporean
stock market. Analysing quarterly data from 1993 to 1996, they use seven indicators as
neural network inputs, drawn from four fundamental categories (yield, liquidity, risk
and growth) and a technical (momentum) factor. The ANN is trained to forecast excess
returns (output). At the beginning of each quarter, the ANN selects (avoids) top (under)
performers. All in all, the hybrid strategy outperforms the benchmark Singapore All
Equities Index (SESALL).
Since the Nobel Prize in economics was awarded to Kahneman in 2002, the term
behavioural finance 40 has also appeared more prominently in the fusion literature.
Bollinger (2002) combines technical and fundamental strategies in a relative
framework. To alleviate the dangers associated with emotions (such as panic sell), he
argues that the hybrid strategy allows traders to understand both the stock and the firm,
and thus make rational trading decisions. Lee (2003) argues that investor sentiment can
offer signals on the dynamic changes between short-term momentum and long-term
reversals. Hence, merging fundamental and behavioural (technical) models can yield a
superior trading system. Bollinger (2005) extends his earlier work by incorporating
40 Note that we do not attempt to differentiate the term ‘technical analysis’ from ‘behavioural finance’ in this thesis. In fact, as argued by Flanegin and Rudd (2005, p. 28), ‘behavioural finance, crowd psychology, and the psychology of financial markets are the underpinnings of technical analysis’. Similarly, we consider technical analysis as synonymous with behavioural finance. The same view is shared by other researchers. For example, Lee (2003) does not use the term ‘technical analysis’ in his paper. Instead, he uses the term ‘behavioural finance’. He considers the momentum life cycle stages by using trading volume. Bollinger (2005), however, considers the approach in Lee (2003) as technical analysis. Likewise, Flanegin and Rudd (2005) use the term behavioural finance and technical analysis interchangeably to convey the same meaning.
48
aspects of behavioural finance and quantitative analysis into his rational analysis. He
argues that modern computing power offers superior quantitative analysis, while
behavioural finance recognises cognitive biases in traders.
Taking a different approach from prior studies, Lam (2004) investigates the ANN-based
fusion rule by using ROE as the predicted variable (output). To produce the hybrid
effect, she uses a few different approaches. First, she simulates the time series effect by
increasing the ROE from one to three years. Second, she includes (only) one technical
indicator (RSI) alongside 15 fundamentals as inputs. Third, she includes 11
macroeconomic variables. Using a sample of 364 S&P 500 firms from 1985 to 1995,
she finds that networks using fusion data significantly outperform the market returns,
although not the top one-third. In contrast, the ANN that merges financial and
macroeconomic data is not superior to any benchmark, and these economic variables
deteriorate the performance of ANN. All in all, the results support the benefits of the
fusion method. In fact, fusion strategy performs well even during economic recession.
Varga (2006) examines fusion trading strategy in the US mutual funds (industry sectors
and international funds). The fundamental rule screens for firms with at least 10 years of
history across market conditions, Morningstar rating ≥ 2 stars and no-load fee structure.
The technical aspect focuses on a Point and Figure (P&F) chart to generate buy and sell
signals. Based on the three-year (out-of-sample) test sets, the strategy yields annualised
mean returns of 7.95% with 64% of the sampled dataset producing positive returns. By
using ANN to extrapolate the performance, Varga (2006) finds the P&F model offers
profit potential for the consequent period. Later, he re-examines the strategy using four-
year test sets (with the addition of stop loss and other rules). He discovers that the
average return increases to 11.8%, with 61% of trades producing mean trade gains over
5%. The study supports the benefits of using fusion analysis.
If fundamental and technical analysis complement each other, we would expect the
fusion strategy to produce a superior outcome compared to each constituent strategy in
isolation. In this context, Bettman, Sault and Schultz (2009) examine whether these two
strategies are substitutes or complements. Based on the US listed firms from 1983 to
2002, they consider BV, EPS and forecast EPS (fundamental indicators) and momentum
(technical indicator) in building several stock valuation models. The results show that

49
while both purely fundamental and technical models perform well individually, the
hybrid models have superior explanatory power, as shown by the higher adjusted R2
values. The findings indicate that fundamental and technical strategies are complements.
However, the study focuses on valuations of stocks, and it is not examined within the
context of testing trading strategy.
Mixed results can be found in the most recent articles in this area (e.g., Bonenkamp,
Homburg & Kempf 2011; Contreras, Hidalgo & Núñez-Letamendia 2012; Shynkevich
2012). In extending the work of Bettman, Sault and Schultz (2009), Bonenkamp,
Homburg and Kempf (2011) integrate price momentum with operating cash flow within
the scope of testing fusion trading strategy. They examine NYSE, AMEX and
NASDAQ stocks using data from 1989 to 2007. By forming 100 hybrid portfolios based
on momentum and cash flow, they focus on the portfolio with the top 10% of both
factors.41 Compared to either momentum or cash flow strategies alone, investment in
the combination portfolio yields superior results with a monthly abnormal return of
1.18%, even after transaction costs. They conclude that using both analyses together
significantly enhances trading returns. Overall, the results correspond to a semi-strong
inefficient market.
Shynkevich (2012) examines the return predictability of combination strategies along
two style dimensions, namely growth/value and size, for the period of 1970s to 2000s
(until 2009) in the US equity market. Of particular interest, the author sorts 10
portfolios in accordance with their fundamental information across the dimension of
low (high) PBR, which corresponds to value (growth) stocks. Next, he uses over 12,000
technical trading rules derived from four indicators, namely filter rule, MA, support and
resistance, and channel breakout rules, on these segregated portfolios. For both in and
out-of-sample periods, value portfolios generally yield greater percentage of profitable
technical strategies. Statistical significant returns (over the benchmark B&H) can be
observed during the 1970s to 1990s, but these ceased to exist for the most recent
41 In total, Bonenkamp, Homburg and Kempf (2011) examine 122 portfolios of pure momentum and cash flow, as well as pure momentum adjusted for quantity in the combination portfolio, and pure cash flow strategy adjusted for portfolio size. For an earlier work using smaller number of portfolios (25 for combination and five each for pure momentum and cash flow strategies), see Bonenkamp (2010).

50
subperiod (2000s).42 Shynkevich (2012) attributes this futility to improved US market
efficiency due to the introduction of exchange traded funds, conversion to decimal
pricing and reduced trading costs caused by the widespread use of electronic trading,
which enhances market liquidity.
Contreras, Hidalgo and Núñez-Letamendia (2012) utilise genetic algorithm to combine
both fundamental and technical analysis in order to generate buy (sell) signals. In
particular, they employ four indicators from each trading strategy, namely MA, RSI,
volume and support and resistance for the technical indicators, and PER, PBV, return on
assets and sales growth as the fundamental indicators. Using a sample of 100 firms from
the S&P 500, they investigate the performance of the hybrid strategy for the period
1994 to 2003, and observe that the trading system considerably outperforms the B&H
approach. More specifically, their fusion trading system produces an accumulated return
of 830%, over four times larger than those produced by the B&H strategy with only
180%, suggesting information inefficiency in the US equity market.
For further references in fusion analysis, we advise interested readers to see related
investment books or articles in practitioners’ journals, among others, of Bollinger
(2002), Brady (1975), Gotthelf (1995), O’Neil (2009), Palicka (2012) and Snead (1999).
Overall, based on the above discussed literature, it is evident that existing (empirical)
studies in fusion analysis are still relatively limited, and there are many opportunities
for academic research in this area. The literature shows that building a hybrid trading
strategy is possible and can yield superior stock market trading returns, especially those
enhanced using soft computing. Existing studies employ different methods for merging
fundamental and technical information, and the use of ANNs, in particular, seems
prevalent. In addition, the fact that emerging markets are less likely to be efficient in
both weak and semi-strong forms promises further potential for combination strategies
to succeed in these markets.
42 Shynkevich (2012) also finds that in the presence of costs, technical trading rules tend to perform better for value stocks, with the number of statistically significant profitable strategies considerably outperforms those in growth stocks.

51
2.3 Research Contributions
2.3.1 Limitations and Knowledge Gap
In presenting the contributions of this thesis, we first highlight several limitations of
previous research. Based on the above cited studies, we suggest a number of drawbacks
and gaps that can be summarised as follows.
1) Although traders are not confined only to fundamental or technical analysis,
existing research often examines these strategies in isolation. Accordingly, the
hybrid of financial statement analysis and technical analysis is still very much
lacking in the literature (Bettman, Sault & Schultz 2009; Bonenkamp, Homburg
& Kempf 2011).
2) It follows from the above that there is currently no study that merges together
accounting (traditional fundamental), technical and corporate governance (new
fundamental) information in a single trading system.
3) There are limits to how far the concept and tradability of the trading systems
built in prior studies can be taken. With the exceptions of Vanstone (2006) and
Vanstone and Hahn (2010), extant literature focuses almost entirely on the
trading rules and ignores realistic position sizing and risk control factors.43 This
is most pronounced in corporate governance trading literature, where none of the
existing studies incorporate any of these factors in their investigations.
4) There are several areas where the limitations of the literature in regards to
practical constraints are attributed, including trading costs, budget (investment
capital), realistic universe of stocks (sample portfolio), round lot constraints and
short selling restrictions. This can be outlined below.
a. There is a large number of studies that ignore trading costs (including
those in top/leading academic journals). This would have exaggerated
trading results (profits) and may lead to incorrect inferences about
market inefficiency (see Jensen 1978; Malkiel 2007). In fact, this basic
43 Indeed, with respect to stop loss risk management strategy, for example, James and Yang (2010) also argue that ‘[d]espite being widely used among market practitioners, the academic literatures on stop-losses are surprisingly few’ (p. 1).

52
friction is virtually invisible in the existing literature of corporate
governance trading strategies.
b. Existing studies largely ignore the constraint of budget or use an
unrealistic one (i.e., assume infinite investment capital). Realistic budget
is an important issue as it effectively limits the number of stocks and size
of trades that can be produced (see O’Neil 2009). This is especially
relevant if the trading system is to be employed by an individual or retail
investors with limited funds.
c. Many studies investigate the use of the whole population or very large
sample sizes and/or ignore (produce) realistic (impractical) sample
portfolio of stocks for trading analysis. In other words, these studies
implicitly assume that the strategies are able to trade in each of these
stocks.44 Unless the trader has unlimited funds, the constraint of budget
above limits the number of stocks that can be effectively traded.
d. Extant studies largely assume stocks can be traded in fractions. The
limitation to buy/sell stocks in round lots is often ignored. In practice,
stocks are traded in minimum lots (Fabozzi et al. 2007), such as 100 units,
1,000 units. Therefore, assuming stocks can be traded in fractional sizes is
a serious flaw. It is interesting to note that even in cases where odd lot
trading is possible, it would have been more difficult (i.e., limited number
of stocks available for odd lot trading) and costly as well.
44 For example, the fundamental strategy by Aby, Briscoe, Elliott et al. (2001) produces a portfolio of 14 value stocks and can be reasonably considered practical. In contrast, it is obvious that a strategy that yields a portfolio size of, for example, 1,000 stocks, is not quite realistic, especially for a typical retail trader. In practice, some research has shown that traders generally trade in limited numbers. Feng and Seasholes (2004) find that the average number of trades for individual investors per annum, for a brokerage firm in China, is only about six. In the US, a brokerage firm defines those who execute more than 48 trades per year as active traders, while the general or affluent households (which make up about 90% of the study population) trade less than that (Barber & Odean 2000). Similarly, in their sample of an Italian bank, Cervellati, Fattori and Pattitoni (2010) document that the mean (median) of trades per year by each investor is only seven (two). Moreover, Barber and Odean (2000) argue that excessive trades are detrimental to wealth, especially since individual investors execute small trades; thus, they are exposed to higher proportional commission fees. Note that even if a study uses a single index (for example Brock, Lakonishok & LeBaron 1992; Loh 2005) or a limited number of stocks (such as Thawornwong, Enke & Dagli 2003), a trading strategy may still produce an unfeasibly large number of trades (sample portfolio). For example, the feedforward neural network technical strategy of Thawornwong, Enke and Dagli (2003) produces a total of 222 trades for their semi-annual out-of-sample period, even though they examine only three stocks. Therefore, the number of trades produced by their strategy is largely different to those of the real world as documented by Barber and Odean (2000), Cervellati, Fattori and Pattitoni (2010) and Feng and Seasholes (2004) above.

53
e. Much research, especially in fundamental and corporate governance
trading strategy, engages in zero-investment strategy. In effect, this long-
short strategy assumes unrestricted short selling activities and is devoid
of the need to cover their positions even after an extended period of time.
In reality, however, short selling activities are often restricted (Holthausen
& Larcker 1992). Moreover, arbitrage strategy should have also incurred
additional (margin) costs (Olson & Mossman 2003).
5) Several studies also suffer from some statistical biases. For example, the studies
by Bauer, Guenster, and Otten (2004) and Drobetz, Schillhofer and Zimmermann
(2004) extend their ratings backwards. These ratings had not (at that time) been
publicly known to investors and therefore lead to look-ahead bias. In addition,
the problems of survivorship and data snooping biases, which are among the
most prominent biases in finance research (see DeFusco et al. 2007; Haugen &
Baker 1996), also raise concerns about the validity of the results presented in
some of the existing studies.
6) In terms of research design, existing literature in corporate governance trading
strategy tends to use a simple, linear model to explore the relationship between
governance and returns. In a similar vein, studies in technical analysis, while in
recent years have been using more advanced indicators, often ignore the state of
the market, which may lead to the use of inappropriate strategy (e.g., a trend
indicator is used in a cycle market).
7) It appears that a considerable number of studies use traditional measures of
prediction accuracy (such as the R2, MSE and mean absolute error) to evaluate
performance. In the context of testing trading system, however, these measures
are not appropriate, since high accuracy may not translate into higher profitability
(Azoff 1994; Leitch & Tanner 1991; Pesaran & Timmermann 1995) (see Chapter
1). In particular, the use of sophisticated trading metrics is lacking. Much
attention is also directed towards the use of simple performance measures, for
example, net profit or annualised gain, or statistical tests such as t-statistics.
While these measures are also important, they provide little information about
trading system behaviour.
8) Existing studies in fusion analysis concentrate almost exclusively on the US
market. Therefore, there is a potential risk of data snooping bias. These results
also limit the generalisability of the fusion trading system to different stock

54
markets, particularly those with different market characteristics (such as
emerging markets).
2.3.2 Contributions of the Study
With the limitations and research gap listed previously, this study makes contributions
to the literature by addressing these gaps. The manners in which these limitations and
gaps are addressed are presented below.
1) This study merges financial statements (traditional fundamental), corporate
governance (new fundamental) and technical information into a fusion mechanical
stock market trading system. This is a significant leap compared to (the still very
limited) prior research that only merges traditional fundamental with technical
indicators; thus, we claim this approach as the first in the literature.
2) Our contribution is enhanced by the fact that we incorporate all three major
functions of a trading strategy as described by Chande (1997) and Pardo (2008).
More specifically, these include entry and exit rules, money management and
risk control in developing full-fledged stock market trading systems.
3) This thesis examines the efficacies and compares the performance of the trading
systems within a valid practical context. Specifically, realistic trading settings
and constraints such as transaction costs, budget (investment capital), sample
portfolio, round lot constraints and short selling restriction are considered.
4) The research design of this thesis alleviates (to some extent) survivorship, data
snooping and look-ahead biases and these are explicitly discussed in the method.
5) This thesis makes noteworthy contributions to the literature on corporate
governance trading strategy, which by itself is a new area of fundamental
research, by exploring it within the context of an ANN-based trading system.
For the technical trading system, this study includes all four technical categories,
namely market mode, trend, cycle and volatility, as described by Pan (2003).
6) The utilisation of multiple trading metrics extensively used by practitioners (such
as the Sharpe ratio, Sortino ratio, profit factor, maximum percentage drawdown
and recovery factor) allows this thesis to provide much needed depth in
analysing trading performance and system behaviours.

55
7) The use of a different market (Bursa Malaysia) expands on the previous studies
and offers insight into the performance of the combination rule in an emerging
market.
2.4 Conclusion
This chapter has explored the existing literature relevant for this thesis. As noted earlier,
the present study is primarily motivated by Vanstone (2006), who provides a well-
defined methodology to build full-fledged stock market trading systems using artificial
intelligence, to incorporate several real-world constraints and to test the results using a
variety of trading metrics. This thesis, however, also attempts to extend his research.45
Vanstone (2006) investigates fundamental and technical analysis in isolation. In this
study, we also explore corporate governance trading system—which by itself is a new
area of fundamental research—as well as the classical hybrid of fundamental and
technical rules, and the novel fusion of financial statement, corporate governance and
technical analysis. In doing so, this thesis also extends recent studies of classical fusion
by Bettman, Sault and Schultz (2009) and Bonenkamp, Homburg and Kempf (2011).
Building on the literature review, we will develop comprehensive trading systems that
are built on a new conceptual foundation. This conceptual framework and the research
methodology will be discussed in the next chapter.
45 As noted earlier, the research design in this thesis is most closely related to Vanstone (2006). However, our research objective is fairly different. In short, the focus in Vanstone (2006) is about the ANN, and the research question in his thesis is ‘[c]an ANNs be used to develop economically significant stock market trading systems?’ (p. 24 and 212). In contrast, our main objective is about the novel combination of fundamental, technical and corporate governance trading strategies. More specifically, the focus of this thesis is to investigate if trading on the basis of the novel fusion system is able to generate economically significant profit and outperform the B&H policy, classical fusion approach and its constituent trading systems (see Section 1.4). Because of its proven forecasting power and ability to map non-linearity in the financial time series, we utilise ANN in this study as a tool in developing the models, while money management and stop loss policies are also considered to engineer the full-fledged trading systems.

56
CHAPTER 3
Conceptual Framework and
Research Methodology
‘People like us, who believe in physics, know that the distinction between the past, present, and future is only a stubbornly persistent illusion’
Albert Einstein Nobel Laureate, Physicist, Scientist
3.1 Introduction
The overarching aim of this chapter is to provide an understanding of the research
method used in this thesis to combine the neurally enhanced fundamental, corporate
governance and technical trading rules. Snead (1999) argues the importance of using a
well-founded method in constructing a fusion strategy, where he claims that:
[b]uilding a combined forecasting model is easy to demonstrate. The only ingredients needed are reliable technical and fundamental indicators and a method by which to combine them. It is the method of combining them that deserves special attention, because battle-tested fundamental and technical indicators are already widely available. (p. 405)
In doing so, this chapter has three objectives. First, it describes the theoretical
underpinnings that guide the development of the fusion approach. Second, it specifies
the elements of the framework and outlines the propositions and hypotheses. Third, it
explains the methods utilised in this research to test the research postulates. This chapter
proceeds as follows. Section 3.2 outlines the conceptual framework, as well as the
propositions and hypotheses of this study. Section 3.3 presents the data. Section 3.4
provides the information about software and hardware used for modelling the trading
systems. Section 3.5 explains the neural network modelling, in particular the inputs,
architecture and outputs. Section 3.6 outlines the rules to enter and exit the trades,
position sizing and risk management. Section 3.7 describes the realistic settings and
constraints explored to provide valid analysis. Section 3.8 outlines the performance
evaluation, both the trading metrics and statistical tests. Section 3.9 concludes.

57
3.2 Conceptual Framework
The main objective of this thesis is to investigate the new combination of neurally enhanced
fundamental, corporate governance and technical trading rules, within the context of a full-
fledged trading system. In so doing, we introduce a well-developed structure for (primarily)
building the novel fusion system. The following discusses the elements of the framework.
3.2.1 Elements of the Framework
The conceptual framework for building three individual mechanical trading systems, the
classical fusion approach, and central to this thesis, the novel fusion system, is
illustrated in Figure 3.1. It is divided into three main phases: (1) theoretical
perspectives, (2) main trading strategies (indicators) and (3) major functions of a trading
system. The first phase outlines the theoretical constructs of firm foundation (Graham &
Dodd 1934; Guild 1931; Williams 1938) and castle in the air (Keynes 1936), which
provides the logical pillars for the use of fundamental (both financial and non-financial)
and technical information in building trading systems. As described earlier, the firm
foundation theory argues that intrinsic value (or potential mispricing) can be found by
analysing financial statement and/or corporate governance information. In contrast, the
castle in the air theory explores psychological forces to forecast market direction, and
this is accomplished by investigating the technical factors.
The second phase of the schematic diagram lists the three major individual trading
strategies (indicators) dominating the stock market. Empirical evidence (as discussed in
Chapter 2) in general points towards the viability of using these strategies to produce
abnormal returns. In this thesis, the fundamental indicators include PER, PBV, ROE
and DPR (Fama & French 1992; Aby, Briscoe, Elliott et al. 2001; Piotroski 2000;
Vanstone & Hahn 2010). Corporate governance variables comprise CEO duality, board
size, institutional ownership, government ownership and Big N auditors (Aggarwal,
Klapper & Wysocki 2005; Bhagat & Bolton 2008; Chhaochharia, Kumar & Niessen-
Ruenzi 2012; Cremers & Nair 2005; Haniffa & Hudaib 2006). Technical indicators
include fractal dimension (D), SMA, MACD, RSI, ATR and percent Bollinger (%B)

58
(Achelis 2001; Bollinger 2002; Ehlers & Way 2010; Vanstone 2006; Wilder 1978).
These three sets of indicators are selected as inputs for the distinct neural networks.
The final phase of the framework refers to the three major elements of a trading strategy as
defined by Chande (1997) and Pardo (2008): (1) rules to enter and exit the trades, (2)
money management (position sizing) and (3) risk control (risk management) strategies.
These criteria collectively lead to emitting trading signals (Vanstone 2006) for full-fledged
trading systems. In particular, the first factor deals with the entry (buy) and exit (sell) rules.
According to Pardo (2008), this is the most essential component of a trading system.
Figure 3.1 shows how the three trading indicators are used as inputs to their relevant
neural networks. ANN is an advanced modelling tool (Falbo & Pelizzari 2011) and is
used in this thesis for several reasons. First, the stock market is a complex system.
Details about the nature of price formation is not fully known (Thawornwong, Enke &
Dagli 2003) and this relationship cannot be captured by classical statistical models
(Refenes, Zapranis & Francis 1994). A neural network, in contrast, is capable of
mapping complex and non-linear relationships between the inputs and outputs (Refenes,
Azema-Barac & Zapranis 1993) without a priori assumptions of its functional form
(Trippi & Turban 1996). Second, ANN is a universal approximator, which means that it
can approximate any continuous function to any desirable level of accuracy (Hornik,
Stinchcombe & White 1989). Finally, the neural network has been found to be superior
compared to other financial forecasting tools, such as ARIMA, GARCH and MLR
(Thawornwong & Enke 2003). Although there are other forms of artificial intelligence
techniques available, for example, fuzzy logic (Zadeh 1965) and genetic algorithms
(Goldberg 1989), it has been argued by Tan (1999) that ANN is the best method for
dealing with uncertainty, and this is also echoed in Vanstone and Finnie (2009).46
46 This claim can be further supported by the fact that neural networks are non-linear modelling technique that is capable to model complex relationships between inputs and outputs. In contrast, genetic algorithm is an optimisation technique used to approximate solutions to optimisation problem, while fuzzy logic is a form of many-valued logic that focuses on approximate reasoning.

59
Figure 3.1 Conceptual Framework for the Neurally Enhanced Full-Fledged Trading Systems and
the Construction of the Novel Fusion Approach
Anti-Martingale
Stop Loss
Stop Loss
Stop Loss
Ent
ry a
nd E
xit R
ules
P
osit
ion
Siz
ing
Ris
k C
ontr
ol
TA-NN Trading System
(TA-NNTS)
FUSION-NN Trading System
(FUSION-NNTS)
Maj
or F
unct
ions
of
a T
radi
ng S
yste
m
Mai
n T
radi
ng
Str
ateg
ies
(Ind
icat
ors)
The
oret
ical
P
ersp
ecti
ves
Stop Loss
Investment Theories
Fundamental Analysis - Price Earnings Ratio - Price to Book Value Ratio - Return on Equity - Dividend Payout Ratio
Corporate Governance Analysis - CEO Duality - Board Size - Institutional Ownership - Government Ownership - Big N Auditors
Technical Analysis - Fractal Dimension - Simple Moving Average - Moving Average Convergence Divergence - Relative Strength Index - Average True Range - Percent Bollinger
Firm Foundation Theory Castle in the Air Theory
Anti-Martingale
Anti-Martingale
Anti-Martingale
Novel Fusion Neural Networks (FUSION-NN)
Neural Networks (FA-NN)
Neural Networks (CG-NN)
FA-NN Trading System
(FA-NNTS)
CG-NN Trading System
(CG-NNTS)
Neural Networks (TA-NN)
Stop Loss
Anti-Martingale
Classical Fusion Neural Networks
(CFUS-NN)
CFUS-NN Trading System (CFUS-NNTS)

60
In total, there are five neurally enhanced entry/exit rules examined in this study. The
network training produces three individual neural networks: (1) fundamental (FA-NN),
(2) corporate governance (CG-NN) and (3) technical (TA-NN). Each network emits its
own buy and sell signals. In this part come the two forms of network ensembles. The
classical fusion (CFUS-NN) involves simultaneous use of FA-NN and TA-NN. The
focal point of this thesis, the novel fusion (FUSION-NN), pulls together all three
individual networks (FA-NN, CG-NN and TA-NN). These two forms of fusion rules
can be considered multiple complex filters (Pardo 2008), which signal entry (exit)
trades according to their constituent networks.
Simultaneous use of multiple signals by the fusion strategies is expected to improve
trading performance over the individual strategies. Brady (1975) argues that using
fundamental or technical strategy independently may be insufficient, and that the
integration of the two allows the strengths of each to offset the weaknesses of the other.
By merging strategies, Bernstein (1998) claims that technical signals will complement
fundamentals, where trading will be responsive to both accounting and market signals.
Moreover, NYIF (2008a) argues that skilful combination can outperform the market,
even after risk.
Nonetheless, relying upon financial indicators alone may prove detrimental, a fact made
clear in the recent Asian and global financial crises. Corporate governance, in particular,
can lend credibility to accounting information and increase confidence among traders
(Khiari, Karaa & Omri 2007). Its importance for trading decisions (McKinsey &
Company 2002; Mercer 2006) and potentials to yield excess returns (Chen et al. 2007;
Gompers, Ishii & Metrick 2003) makes it a valuable non-financial fundamental strategy.
The combination of the triumvirate of trading rules (accounting, corporate governance
and technical) is therefore a novel approach, and is expected to yield an even more
superior trading performance.
Finally, the second and third major elements refer to position sizing and risk
management strategies. Position sizing indicates how much of the trading capital is to
be used per trade (i.e., bet size). Risk control, conversely, is concerned with ‘keeping
risk within measured, anticipated, and affordable boundaries’ (Pardo 2008, p. 74). For
these components, this thesis uses anti-Martingale (Balsara 1992; Tharp 1998) and stop

61
loss (Chande 1997; Kaminski & Lo 2008; Vanstone 2006) strategies. These choices can
be supported by logical grounds, as well as by the behavioural biases of the gambler’s
fallacy (Shefrin 2002; Tharp 1998) and disposition effect (Kahneman & Tversky 1979;
Shefrin & Statman 1985), respectively. The combination of entry (exit) rules, money
management and risk control results in five mechanical full-fledged trading systems
being developed, represented by their relevant arrows. In particular, the framework
accentuates FUSION-NNTS, which is the central trading system of this thesis, being the
hybrid of accounting, governance and technical factors.
3.2.2 Propositions and Hypotheses
To investigate the performance of this novel fusion approach, as well as the classical
fusion and individual trading systems, the analysis is performed within a valid trading
context and alleviates several biases commonly associated with research in finance.
Against this practical backdrop, we form formal propositions (P) and hypotheses (H) to
answer the related research objectives (RO) as presented in Chapter 1. This is shown in
the following table.

62
Table 3.1 Summary of Propositions and Hypotheses
Research Objectives
Propositions and Hypotheses
Descriptions
RO1 P1 The novel fusion trading system is able to yield economically significant returns and outperform the B&H policy
H1a FUSION-NNTS can generate positive returns H1b FUSION-NNTS can outperform the B&H strategy RO2 P2 The novel fusion trading system can outperform its
constituent trading systems and the classical fusion strategy P2a FUSION-NNTS can outperform FA-NNTS, CG-NNTS
and TA-NNTS P2b FUSION-NNTS can outperform CFUS-NNTS RO3 P3 The classical fusion trading system is able to yield
economically significant returns and outperform the B&H H2a CFUS-NNTS can generate positive returns H2b CFUS-NNTS can outperform the B&H policy RO4 P4 The classical fusion trading system can outperform its
constituent trading systems (FA-NNTS and TA-NNTS) RO5 P5 Fundamental, corporate governance and technical trading
systems (in isolation) can yield economically significant returns and outperform the B&H policy
H3a FA-NNTS can generate positive returns H3b FA-NNTS can outperform the B&H strategy H4a CG-NNTS can generate positive returns H4b CG-NNTS can outperform the B&H strategy H5a TA-NNTS can generate positive returns H5b TA-NNTS can outperform the B&H strategy
The table provides the related propositions and hypotheses for the neurally enhanced full-fledged stock market trading systems to address the research objectives of this thesis. The null hypotheses tested in the present study are as follows: (H0a) the mean returns generated by the stock market trading systems equal zero and (H0b) the mean returns generated by the stock market trading systems equal the mean return from employing the benchmark B&H strategy. For P2 and P4, testable research propositions are used to address the related research objectives.
The EMH, which is the central theory of finance (Dimson & Mussavian 1998), serves
as the (null) benchmark for testing our trading strategies. It follows that if the market is
efficient, stock prices already fully reflect existing information and adjust rapidly to
new information. Thus, no trading strategy using historical and/or publicly available
data can be expected to yield superior return than that produced by the naive buy-and-
hold rule. In other words, fusion (both novel and classical), fundamental, corporate
governance and technical trading systems are just a waste of time. In this case, the best
trading strategy would be B&H (Fama 1965; Malkiel 2007; Reilly & Brown 2003).
63
Stated formally, the two null hypotheses developed for testing our neurally enhanced
full-fledged trading systems (for P1, P3 and P5) are as follows:
H0a: The mean returns generated by the stock market trading systems are zero
H0b: The mean returns generated by the stock market trading systems equal the
mean return from employing the benchmark B&H strategy
The use of the above null hypotheses is the standard convention in testing trading
strategies (see for instance Lai, Balachandher & Nor 2007; Vanstone 2006). Statistical
tests are used to test the above hypotheses (see Section 3.8.3). Note that significant
profitability of an active trading system (and its significant outperformance over the
passive B&H rule) alone does not necessarily imply inefficiency. If greater returns are
simply a product of higher risks, then efficiency cannot immediately be rejected. As
argued by Jensen (1978) and Malkiel (2007), in an efficient market, traders will not be
able to earn higher returns (after costs) without facing higher risks. Thus, it is vital to
also examine the risk-return tradeoffs before inferring efficiency and superiority or lack
thereof. Relevant key metrics explored in this study address this issue by providing
further analysis of trading risks and returns (see Section 3.8.2.2).
In regards to comparing the performance of our fusion strategies against their
constituent trading systems (and for the novel approach, the classical rule as well), this
thesis employs research propositions (P2 and P4). We use the term proposition to avoid
the implication of statistical testing associated with the term hypothesis. By definition,
since the entry (exit) rules of our combination models are driven by each individual
component, we do not expect the emitted signals to vary significantly with their
constituent strategies. In addition, because of the differences in the timeframes of the
trades between the active trading systems, a statistical comparison of mean returns per
trade (such as independent samples t-test or the Analysis of Variance) is not an
appropriate measure (Vanstone & Hahn 2010).47 Further, statistical significance does
not necessarily denote economic significance (Damodaran 2012), and it has been argued
47 Note that statistical analysis will also not be applicable when evaluating the performance of the trading systems against each benchmark index. This is because each index will only produce a single trade (i.e., sample size of only one) throughout the out-of-sample period.

64
that the latter is a better criterion for appraising the efficacies of different trading models
(Olson & Mossman 2003).
Based on the above arguments, we evaluate the relative trading performances of the ANN
trading systems on the basis of their economic significance, more specifically, as reflected
by their key trading metrics (see Section 3.8.2.2 for a detail list of these metrics). The use
of testable propositions, or the lack of hypothesis testing, in comparing the performance
of these systems, is consistent with a large number of existing studies (including several
articles that have been published in top/leading academic journals).48 Ultimately, the
superiority of a stock market trading system is gauged (ranked) based upon its reward to
variability measure, as primarily indicated by the Sharpe ratio (Sharpe 1966, 1994).49 For
robustness purposes, the Sortino ratio (see Sortino & Satchell 2001), which distinguishes
between positive and negative volatility, is used in conjunction with the Sharpe ratio to
confirm the economic significance of the related trading systems.
To illustrate how this thesis attempts to address the above research objectives by
comparing the performance of the trading systems, Figure 3.2 provides the graphical
display of the testable propositions and hypotheses examined in this thesis.
48 For example, Eakins and Stansell (2003) rank their trading strategies on the basis of the Sharpe ratio. No hypothesis testing is conducted. In a similar vein, Thawornwong, Enke and Dagli (2003) establish their findings using several metrics, rather than basing their results on statistical significance. Lai, Balachandher and Nor (2007) test their models for statistical significance only over the mean returns of zero, B&H and the difference of buy (sell) signal returns. The best VMA and FMA rules are decided from their profits. They do not perform any statistical tests between their models. Olson and Mossman (2003) compare the results yielded by their ANN trading strategies over those produced by OLS and logit models based on the differences in directional forecast accuracies and abnormal returns. No hypothesis testing is performed to measure whether these differences are significant. Several studies in combination rules also follow a similar route. Reinganum (1988) evaluates his trading systems based on several metrics (such as excess returns and beta), without the use of any statistical tests. In his PhD thesis, Longo (1996) appraises the performance of his ANN fusion strategy against the other trading strategies using a number of performance measures, such as the Sharpe ratio and annualised returns, without evaluating the statistical significance of his results. Finally, Lam (2004) concludes that the extension of her model using macroeconomic factors does not improve performance. This is based on the insignificant returns yielded by this form of fusion model over those obtained from all of her sample firms. She does not examine if there is any statistically significant difference between her ANN models. 49 The Sharpe ratio is considered the most established measure of trading performance, both in academic literature and the financial industry. It is interesting to point out that the ratio is actually closely related to the t-statistic, which attempts to measure the statistical significance for the differences in mean returns. Specifically, if the Sharpe ratio is multiplied by the square root of the number of returns, the resulting answer equates to the t-statistic. See Sharpe (1994).

65
Figure 3.2 Propositions and Hypotheses: Comparing Trading Systems
Symbol RO Propositions and Hypotheses RO1 Proposition 1 (H1a and H1b) RO2 Proposition 2 (P2a and P2b) RO3 Proposition 3 (H2a and H2b) RO4 Proposition 4 RO5 Proposition 5 (H3a, H3b, H4a, H4b, H5a and H5b) - Theoretical element (factor)
The figure illustrates how we compare the related trading systems within a valid trading environment. The three outer circles (firm foundation theory, castle in the air theory and efficient market theory) partly surrounded by the crooked dotted grey layer represent the underlying theories, colour-coded and linked to their relevant trading strategies. The EMH serves as the null theory. Enveloped within the dotted grey layer, eight black circles denote practical settings and constraints (realistic portfolio of stocks, round lot, budget, transaction costs and short selling restrictions), plus research design that alleviates possible biases (look-ahead, survivorship and data snooping). The inner circles show the five trading systems, with the novel fusion trading system, focal to this thesis, located at its core. The B&H is the benchmark trading strategy, along with the zero mean profit.
Realistic Portfolios of
Stocks
Realistic Short Selling Restriction
Mitigates Data
Snooping Bias
Mitigates Survivorship
Bias
Mitigates Look-ahead
Bias
Realistic Transaction
Costs
Realistic Budget
CG-NNTS
TA-NNTS FA-NNTS
µ = 0 B&H
FUSION-NNTS
Realistic Round
Lot
Castle in the Air Theory
CFUS-NNTS
Efficient Market Theory
Firm Foundation
Theory

66
Throughout this thesis, we have highlighted the importance of testing trading systems
within a realistic trading context, and this is considered in this study. In summary, it can
be seen from the conceptual framework (see Figure 3.1) and the research benchmarks
(see Figure 3.2) that we are undertaking an elaborate research project. In the sections
that follow, we proceed with discussing the data and methods used to build and explore
the trading systems.
3.3 Data
3.3.1 Sample and Timeframe
Data is collected from a sample of 30 firms listed in Bursa Malaysia,50 spanning the
period 1 July 2002 through to 30 June 2011, for a total of nine years.51 This gives us a
sum of 61,861 daily observations, with 866,054 data points.52 The year 2002 is selected
in order to reflect the KLSE revamped listing requirements for corporate governance
disclosure in 2001. This allows our trading systems to include publicly available
corporate governance data.
Our sample composition is as follows. Except for financial firms (due to the differences
in regulatory requirements), we include mainly all firms from the FTSE Bursa Malaysia
Large 30 constituency (now FTSE Bursa Malaysia KLCI). The removal of finance firms
is in line with prior research, for example Mak and Kusnadi (2005) and Haniffa and
Hudaib (2006) in Malaysia, Yermack (1996) in the US, Alexakis, Patra and Poshakwale
(2010) in Greece, and Pathirawasam and Wickremasinghe (2012) in Sri Lanka. We
replace the eliminated financial companies with an equal number of non-financial firms
selected randomly (via Excel 2007 syntax) from the remaining KLCI components,
50 The use of 30 firms in this study is deemed reasonable for a well-founded analysis of trading strategies. For example, several studies only examine an index (that is, N = 1). These include Brock, Lakonishok and LeBaron (1992) (DJIA), Loh (2005) (ASX All Ordinaries index), and Lai, Balachandher and Nor (2007) (KLCI). In the context of testing trading strategies on individual firms, White (1988) also examines only one stock (IBM). Thawornwong, Enke and Dagli (2003) inspect three stocks, Tsibouris and Zeidenberg (1995) analyse six stocks, while Fama and Blume (1966) investigate 30 stocks, in the US. In their study about fractal, Evertsz and Berkner (1995) also explore 30 DAX stocks. 51 The nine-year total period exceeds the minimum of five years for time series analysis as recommended by Ryan (2004). As a comparison, the sample period is also greater than the periods examined by, among others, Aman and Nguyen (2008), Bauer et al. (2008), Drobetz, Schillhofer and Zimmermann (2004), Quah and Srinivasan (1999), Thawornwong, Enke and Dagli (2003) and Tsibouris and Zeidenberg (1995). 52 As measured by daily observations (fundamental data + corporate governance data + technical data).

67
which mainly correspond to the FTSE Bursa Malaysia Mid 70 (the next group of largest
firms in Bursa Malaysia). The final dataset of 30 firms is representative of the
Malaysian stock market and includes properties, industrial products, infrastructure
project companies, construction, plantation, consumer products, and trading and
services industries.
The selection of these blue chip firms as our sample avoids the dangers of greater
vicissitudes associated with small companies (Graham & Zweig 2003), which conforms
to the stability, liquidity and tradability requirements of the stock exchange. Moreover,
it has been argued that larger firms are closely monitored by the market, particularly the
institutional investors, and consequently, have a higher possibility of being priced
efficiently (Lakonishok, Shleifer & Vishny 1994). In doing so, we are biasing the
results against our favour. 53 We obtain the list of sample stocks from the Bursa
Malaysia website, while any changes in the constituents are cross-checked with the
FTSE website. To mitigate any potential look-ahead or survivorship bias, the stock list
is sourced only from the information available prior to the out-of-sample window.
Because the list also includes firms that later (during the out-of-sample period) become
delisted, we also isolate any possibility of survivorship bias. See Haugen and Baker
(1996), Chan (2009) and DeFusco et al. (2007) for details.
3.3.2 Data Source
In order to build the neurally enhanced fundamental, corporate governance, technical
and the hybrid trading systems, the present study uses related fundamental (accounting),
corporate governance and technical data of 30 Malaysian stocks, as noted in the
framework (see Section 3.2.1). In brief, we obtain both accounting and technical
information from the Thomson Reuters DataStream. Fundamental data includes
financial ratios (indicators). These ratios are related to the market valuation, profitability
and cash flow of the firms. Technical data includes daily historical information,
specifically Open, High, Low and Close prices and Volume. DataStream provides the
prices and volumes that have been adjusted for stock splits, dividends, and so on.
Relevant technical data are then used to formulate the technical indicators. These 53 In other words, our research design is more likely to accept the null hypothesis of market efficiency.

68
indicators include all aspects of technical categories, specifically market mode, trend,
cycle and volatility, as described by Pan (2003). Following the validation process in
Vanstone (2006), we check the final dataset for each row of the 30 securities (a total of
61,861 rows) using Excel 2007 syntax so that the following criteria are not violated:
Open ≤ High, Close ≤ High, Open ≥ Low, Close ≥ Low, High ≥ Low, Open > 0, High >
0, Low > 0, Close > 0, and Volume > 0. For corporate governance data, we extract the
indicators manually from a total of 268 audited annual reports published in the Bursa
Malaysia website. This set of variables encompasses a firm’s leadership structure,
ownership structure and accounting (disclosure) quality. Finally, and for information
(additional comparison) purposes only, historical information on the seven FTSE and
Dow Jones indices in Malaysia are obtained from Bloomberg.
3.3.3 Dataset Constructions
For each security, we merge together fundamental, corporate governance and technical
data in ASCII (.CSV) file format. These files reside in two separate folders that
correspond to the partitioned datasets (see Section 3.3.4). Because we merge various
types of information, it is important to deal with their different underlying timeframes.
Specifically, technical data is based on daily observations, while both accounting and
governance information (from audited annual reports) are based on yearly data.
To allow the systems access to financial and governance information at daily intervals,
we synchronise these indicators for each trading day throughout the entire sample period.
This process aligns traditional and new fundamentals (annual) with technical (daily) data,
and is consistent with the approach adopted by Vanstone (2006). In order to mark the
precise data accessibility points for the accounting and governance data (due to the
reporting lags), we use the exact announcement (disclosure) dates as published in Bursa
Malaysia website, made available through Bursa LINK.54 For example, assume a firm
54 Bursa Malaysia Listing Requirements 9.23(1) requires listed companies to issue their annual audited financial statements within six months from when the fiscal year ends. To facilitate efficient and timely information distribution, Bursa Malaysia utilises the Bursa LINK (Listing Information Network) connecting different organisations such as listed companies and banks to the exchange. Any announcements, including annual reports and circulars, are submitted electronically and made available on its website. The website conveys the exact dates at which the reports are available for public access. These announcement dates (we define as t) are used in the present study as the points where we are fully

69
with a fiscal year end of 20 December 2003 has its audited annual report made public on
15 March 2004. In this case, we use the latter date to synchronise its audited accounting
and corporate governance information with the available technical data, by placing them
in the same row in the spreadsheet file. The same fundamental data runs through each
row until the next disclosure date, where it is replaced by the following year’s audited
financial and governance information.
3.3.4 Data Partitioning
To provide valid empirical analysis, we split our dataset into two non-overlapping
periods.55 The first period is used for constructing the neurally enhanced full-fledged
trading systems, while the second period is employed for examining the performance of
the trading systems and the B&H policy. In general, the proportion of split relies upon
the size of the available data and it is typically determined arbitrarily (Vanstone 2006).
In this thesis, we allocate 67% (two-thirds) of in-sample data to forecast the remaining
33% (one-third) of unseen out-of-sample data, and this is consistent with Tsibouris and
Zeidenberg (1995), Varga (2006) and Vanstone and Hahn (2010). The splitting ratio
produces the in-sample period of 1 July 2002 to 30 June 2008, and the blind holdout
portion of 1 July 2008 to 30 June 2011. The ratio is selected as it allows both periods to
include different market characteristics.56 This choice can be supported by Azoff (1994),
who argues that the ANN training period should be sufficient to include diverse market
certain the information is already made public. Accordingly, any trade is only executed after those dates (at t+1). Hence, there is no possibility that our trading systems will be emitting buy/sell signals based on the information not yet available at that time. See Section 3.6.1 for a detailed discussion on how the trading rules are programmed. 55 Data splitting is an essential procedure for research using financial time series. Nisbet, Elder and Miner (2009) argue that preparing the data set is the first major stage for data mining, and this includes creating a separate blind holdout sample for model validations. Of particular importance, because of the danger associated with overfitting the network and data snooping, it is crucial to examine our ANN trading systems using unseen, out-of-sample data, which has not been used for ANN training and in building the trading systems. If the performance of our trading systems is a result of data mining, it is highly unlikely to be significant out-of-sample (DeFusco et al. 2007). In research using artificial neural networks, poor performance in the holdout sample might suggest the network captures spurious structures or memorises noises instead of learning the relationship between the input and output. Further, it is important to give sufficient data for model building and for validating the model. If the in-sample data split is too small, there is a risk of overfitting the neural networks. 56 More specifically, the in-sample period includes the recovery phase from the Asian financial crisis, the pre and global financial crisis. The out-of-sample portion also includes the global financial crisis and the recent recovery period. See Chhibber, Ghosh and Palanivel (2009).

70
behaviours. The trading systems can then be evaluated on the test period which has also
undergone different market phases. The overall procedure also ameliorates potential data
snooping bias and simulates realistic trading environment for producing valid results.
3.4 Software and Hardware
To construct our neurally enhanced trading systems, we use Wealth-Lab Developer 6.4
and Neuro-Lab® 1.0 software by Fidelity Investments.57 Wealth-Lab is also used in
building the benchmark B&H policy and in comparing the strategies via their trading
metrics. The network algorithms and the trading systems are coded using Wealthscript,
which is based on the C# programming language. Finally, we use PASW Statistics 18.0
by SPSS Inc (now owned by IBM) for the related statistical analysis.
The computational complexity of the ANN models requires high performance computing
hardware.58 In this thesis, we solve our neurally enhanced mechanical trading systems
using a computer powered by Intel® Core™ 2 Duo E7500 processor with 3GB DDR3 of
random access memory (RAM), running on Microsoft Windows 7 Ultimate. This high
end desktop PC (PassMark 2010)59 is used for building and training the neural networks,
constructing the full-fledged trading systems, and evaluating trading performances.
3.5 Neural Network Modelling
3.5.1 Inputs
The following gives a brief description of fundamental, corporate governance and
technical indicators used in training the networks. The selection of these variables is
supported by prior literature in the related areas. Since each of these indicators already
exists prior to our study (sample) period, this mitigates any possibility of look-ahead
57 Fidelity Investments is one of the largest investment firms in the world. It is also one of the pioneers to apply neural network for financial forecasting. 58 As an example, even though Vanstone (2006) uses the (then) high end computer, he still requires about three days to train each of his neural networks. 59 Based on the central processing unit (CPU) benchmark determined using PassMark software. At the time of analysis, more than 300,000 systems and 1,000 CPU models are tested. The list of processors is divided into four groups: (1) High End CPUs; (2) High Mid Range CPUs; (3) Low Mid Range CPUs; (4) Low End CPUs. The processor used for developing our main trading systems is listed on the High End CPUs (as at 10 December 2010).
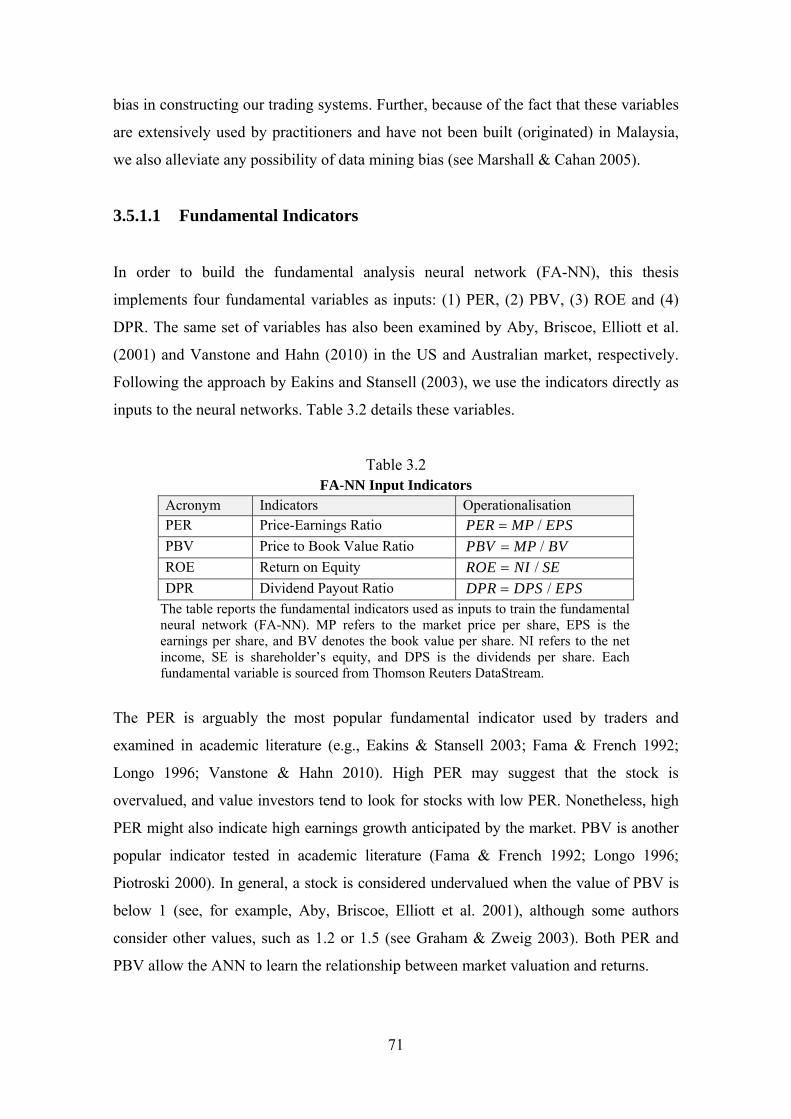
71
bias in constructing our trading systems. Further, because of the fact that these variables
are extensively used by practitioners and have not been built (originated) in Malaysia,
we also alleviate any possibility of data mining bias (see Marshall & Cahan 2005).
3.5.1.1 Fundamental Indicators
In order to build the fundamental analysis neural network (FA-NN), this thesis
implements four fundamental variables as inputs: (1) PER, (2) PBV, (3) ROE and (4)
DPR. The same set of variables has also been examined by Aby, Briscoe, Elliott et al.
(2001) and Vanstone and Hahn (2010) in the US and Australian market, respectively.
Following the approach by Eakins and Stansell (2003), we use the indicators directly as
inputs to the neural networks. Table 3.2 details these variables.
Table 3.2 FA-NN Input Indicators
Acronym Indicators Operationalisation PER Price-Earnings Ratio /PER MP EPS
PBV Price to Book Value Ratio /PBV MP BV
ROE Return on Equity /ROE NI SE
DPR Dividend Payout Ratio /DPR DPS EPS The table reports the fundamental indicators used as inputs to train the fundamental neural network (FA-NN). MP refers to the market price per share, EPS is the earnings per share, and BV denotes the book value per share. NI refers to the net income, SE is shareholder’s equity, and DPS is the dividends per share. Each fundamental variable is sourced from Thomson Reuters DataStream.
The PER is arguably the most popular fundamental indicator used by traders and
examined in academic literature (e.g., Eakins & Stansell 2003; Fama & French 1992;
Longo 1996; Vanstone & Hahn 2010). High PER may suggest that the stock is
overvalued, and value investors tend to look for stocks with low PER. Nonetheless, high
PER might also indicate high earnings growth anticipated by the market. PBV is another
popular indicator tested in academic literature (Fama & French 1992; Longo 1996;
Piotroski 2000). In general, a stock is considered undervalued when the value of PBV is
below 1 (see, for example, Aby, Briscoe, Elliott et al. 2001), although some authors
consider other values, such as 1.2 or 1.5 (see Graham & Zweig 2003). Both PER and
PBV allow the ANN to learn the relationship between market valuation and returns.

72
ROE is posited to have effects on stock prices (returns) as it shows how efficient the
shareholder’s equity is used to generate profits. Aby, Briscoe, Elliott et al. (2001)
observe that ROE is the most influential factor in separating performing and non-
performing stocks in the US. The use of ROE as input enables FA-NN to consider
profitability factor. Whether the firm has a low (high) level of DPR generally signals
under (over) valuation (Graham & Zweig 2003). Rather than being distributed as
dividends, reinvestment of retained earnings is deemed beneficial, thus low DPR can
increase stock price (Aby, Briscoe, Elliott et al. 2001). This indicator allows the neural
network to include cash flow information.
3.5.1.2 Corporate Governance Indicators
To construct the corporate governance neural network (CG-NN), we employ five
governance indicators as inputs: (1) CEO duality (DUAL), (2) board size (BSIZE), (3)
institutional ownership (INST), (4) government ownership (GOVN) and (5) big N
auditors (BIGN). These indicators are reported in Table 3.3. As a new form of
fundamental analysis, these indicators merit further discussions.
DUAL refers to the combined leadership of chairman of the board and chief executive
officer (or managing director), in which both top positions are held by the same
individual. Following Chen et al. (2007) and Haniffa and Hudaib (2006), we employ a
binary variable to represent DUAL. The MCCG (2007) recommends separation of these
roles so that there will be a balance of power for effective board mechanism. This view
is also shared by Fama and Jensen (1983). BSIZE denotes the number of directors on
the board. It is a measure of board cohesiveness and is found to be a significant
determinant of stock returns (Yermack 1996). Consistent with prior research (Bhagat &
Bolton 2008; Haniffa & Hudaib 2006), we compute BSIZE based on the number of
directors in the company.60 Although the MCCG (2007) highlights the importance of
size for an effective board, it does not present any specific guideline on the range or
60 Prior studies in Malaysia (Haniffa & Hudaib 2006; Mak & Kusnadi 2005) document negative results between BSIZE and firm value. This is in line with Jensen’s (1993) argument that a large board is prone to manipulation by the CEO and suffers from a lack of coordination, which results in an ineffective board. The studies by Yermack (1996) in the US and Eisenberg, Sundgren and Wells (1998) in Finland endorse smaller board as more effective, and that there is an inverse relationship between BSIZE and firm performance.

73
optimal number of directors in a firm.61 Both DUAL and BSIZE enable the CG-NN to
include leadership mechanism as input to forecast future returns.
Table 3.3 CG-NN Input Indicators
Acronym Indicators Operationalisation DUAL CEO
Duality 1
0
if CEO COBDUAL
otherwise
BSIZE Board Size : 2BSIZE x x INST Institutional
Ownership /INST LPV TSO
GOVN Government Ownership
/GOVN PIN TSO
BIGN Big N Auditor
1 5 (2002) 4 ( 2002)
0
if AUD BIG or BIGBIGN
otherwise
The table reports the corporate governance indicators used as inputs to train the corporate governance neural network (CG-NN). The operationalisation column shows the mathematical representation of the variables. CEO (COB) refers to chief executive officer (chairman of the board). BSIZE is the integer ( ) set of all x greater than or equal to two, which is the minimum number of directors as required by the Malaysian Companies Act 1965 (Section 122). INST (GOVN) refers to the percentage shareholding in the firm by institutional (government) investors. LPV refers to total stocks owned by local, private institutional investors, and TSO denotes the total stocks outstanding. PIN refers to total stocks owned by public (government) investors, which is measured as a sum of those held by the federal government, state government bodies and government investment arms. Both INST and GOVN are calculated using the information from the 30 largest shareholders as disclosed in the audited annual reports. AUD is the external auditor of the firm, BIG5 (2002) is the Big Five accounting firms operating in Malaysia in 2002, and BIG4 is the Big Four accounting firms after 2002. Each corporate governance data is collected manually from audited annual reports published on the Bursa Malaysia website.
INST and GOVN allow the CG-NN to incorporate information about ownership
structure for network training. INST refers to the percentage of ownership held by
private, local institutional investors. Chhaochharia, Kumar and Niessen-Ruenzi (2012)
find that INST are effective monitors of corporations, and that firms with high INST
have better internal governance and are more profitable. Likewise, GOVN shows the
61 Existing research is inconclusive on the optimal size of the board. For example, Lipton and Lorsch (1992) recommends BSIZE ≤ 10, with the ideal BSIZE = 8 or 9, whereas Jensen (1993) suggests BSIZE ≤ 7 or 8 for the board to be effective. Conversely, according to the survey of corporate governance by the National Association of Corporate Directors and the Center for Board Leadership (see Conger & Lawler 2001), most CEOs believe it is quintessential to have the board in the range of 8 ≤ BSIZE ≤ 12. For large companies, Conger and Lawler (2001) recommend BSIZE = 14 or 15, but this is subject to the need for knowledge diversity.

74
total proportion of government holdings in the firms.62 Ramirez and Tan (2003) find
that government ownership sends a positive signal to the market. Similarly, Gomez and
Jomo (1999) find that politically connected firms in Malaysia benefit from favourable
access in securing lucrative government contracts. Cremers and Nair (2005) show that a
corporate governance trading strategy produces higher abnormal returns when there is
high public ownerships.63
To allow CG-NN to capture the effect of accounting (or disclosure) quality, we include
the BIGN indicator. BIGN shows if the financial statement is audited by one of the big
accounting firms (during the period). Aggarwal, Klapper and Wysocki (2005) and Mitton
(2002) observe that BIGN has a positive relationship with stock returns. 64 Following
these studies, we use a dummy variable of one when the auditor is one of the big
accounting firms, and zero otherwise.
3.5.1.3 Technical Indicators
To build the technical neural network (TA-NN), this thesis uses six variables as inputs:
(1) D, (2) SMA, (3) MACD, (4) RSI, (5) ATR and (6) %B. Collectively, these six
variables encompass all categories of technical indicators, namely market mode, trend,
cycle and volatility, as described by Pan (2003). Detail formulae for these indicators are
provided in Table 3.4.
62 Notable examples include the Ministry of Finance, Khazanah, Employees Provident Fund, Nasional Pension Fund, Bank Negara Malaysia and Permodalan Nasional Berhad. 63 Although these studies appear to support the ownerships by the government, on the down side, the government may pursue their policy goals, which may contradict the interests of the shareholders (Bai et al. 2003). Also, they may not actively monitor the firms and adversely appoint senior government officers ill-equipped for the positions of directors (Mak & Li 2001), who lack business expertise and are motivated by their own political gain rather than the goal of maximising shareholders’ value (Ramirez & Tan 2003). 64 Higher quality investments have been associated with BIGN, possibly because of the need of the auditors to uphold their reputations, and higher fees charged by these auditors are more likely to refrain lower quality firms from obtaining their services (Michaely & Shaw 1995). Rahman (1998) argues that an unqualified audit report by a BIGN firm is valuable as traders perceive the audit to be of high quality and the financial statements to convey reliable information.

75
Table 3.4 TA-NN Input Indicators
Acronym Indicators Operationalisation D Fractal Dimension
log 1 2 log( 3)
log 2
N N ND
SMA Simple Moving
Average 1
1 n
ii
SMA Cn
MACD Moving Average Convergence Divergence
1 1
( ) ( )n n
k di i
MACD EMA i EMA i
RSI Relative Strength Index
100100
1RSI
RS
ATR Average True Range
1( 1) t tt
n ATR TRATR
n
%B Percent Bollinger %
C BLB
BU BL
The table reports the technical indicators used as inputs to train the technical neural network (TA-NN). N is computed over two equal-length intervals (0 to T and T to 2T), N1 is the difference between highest price (HP) and lowest price (LP) for the first interval divided by T, N2 is the difference between HP and LP over the second interval divided by T, and N3 is the difference between HP and LP for the entire intervals divided by 2T; these parameters are consistent with the values described in Ehlers and Way (2010). C, H and L denote the closing, high and low prices. n is the number of periods (five-day), which corresponds to the very short-term period as described by Achelis (2001). For MACD, k = 12 and d = 26, which is consistent with the values frequently employed by traders in practice (Murphy 1999). The exponential MA (EMA) is given as follows:
2 2( ) ( ) 1 ( 1)
1 1n nEMA i C i EMA in n
RS refers to relative strength, which is the quotient of average upward price change divided by the average downward price change over the period of n days. TR denotes the true range, which is the greatest of either Ht to Lt, Ct-1 to Ht, or Ct-1 to Lt. %B requires the calculation of the Bollinger Bands, where:
2 2
1 1
1 1,
n n
i ii i
UB MB S C MB LB MB S C MBn n
UB is the upper band, LB is the lower band, MB is the middle band (which is essentially the SMA), and S refers to the number of standard deviations. Historical market data used for the calculation of the technical indicators are sourced from Thomson Reuters DataStream.
D is a market mode sensor (Ehlers & Way 2010) based on Mandelbrot’s fractal geometry
(Mandelbrot 1983, 1997), which allows a system to spot whether the market is trending or
cycling, and thus enables a trader to employ an appropriate strategy for that particular
market mode. The values of D are discussed in Ehlers and Way (2010), Mulligan (2004)

76
and Peters (1994). Random walk (or Gaussian distribution) is represented by D = 1.5.
When D equals one, prices are in a straight line, equivalent to the Euclidean dimension
(i.e., the market is trending). When D equals two, the market is in cycle mode. As input to
the network, D provides TA-NN an indication of the state of the market.
SMA is a finite impulse response filter (Pan 2003) and shows the MA of a stock price
over a specific time period, computed arithmetically, and provides clear manifestation
of market trends (Schwager 1999). In general, a buy (sell) signal is generated when the
closing price rises (falls) above (below) the SMA. Unlike the SMA, the MACD is a
cycle indicator with the ability to detect changes in trends (Rosillo, de la Fuente &
Brugos 2013). It is the difference between short-term (k) EMA and long-term (d) EMA
of closing prices (Achelis 2001). SMA (MACD) enables TA-NN to react to trend
(cycle) information. The MACD is commonly employed with the RSI by Wilder
(1978), which is an oscillator that measures the internal strength of the stock (Achelis
2001). RSI allows the network to respond to changes in price strength (Vanstone 2006).
To give the technical neural network the ability to capture the effects of volatility, we
include Wilder’s (1978) ATR and Bollinger’s (2002) %B as inputs. The ATR measures
the degree of volatility. In short, high (low) ATR indicates higher (lower) volatility. %B
shows the position of the stock price in relation to the Bollinger Bands. Note that the
Bollinger Bands widens (contracts) during volatile (calm) markets.
3.5.2 Network Process and Architecture
In this thesis, we use multi-layer feedforward neural networks with the backpropagation
algorithm, which is the most popular approach for predicting stock returns in the existing
literature (Thawornwong & Enke 2003). The ANN uses logistic sigmoid function as its
activation function, and can be expressed mathematically as
1( )
1 xf x
e
where α corresponds to the selected learning rate, and the neuron output is constrained
between the value of zero and one. The network architectures are based on N number of
variables (trading indicators) in the input vector (i.e., input nodes), with a single hidden
(3.1)
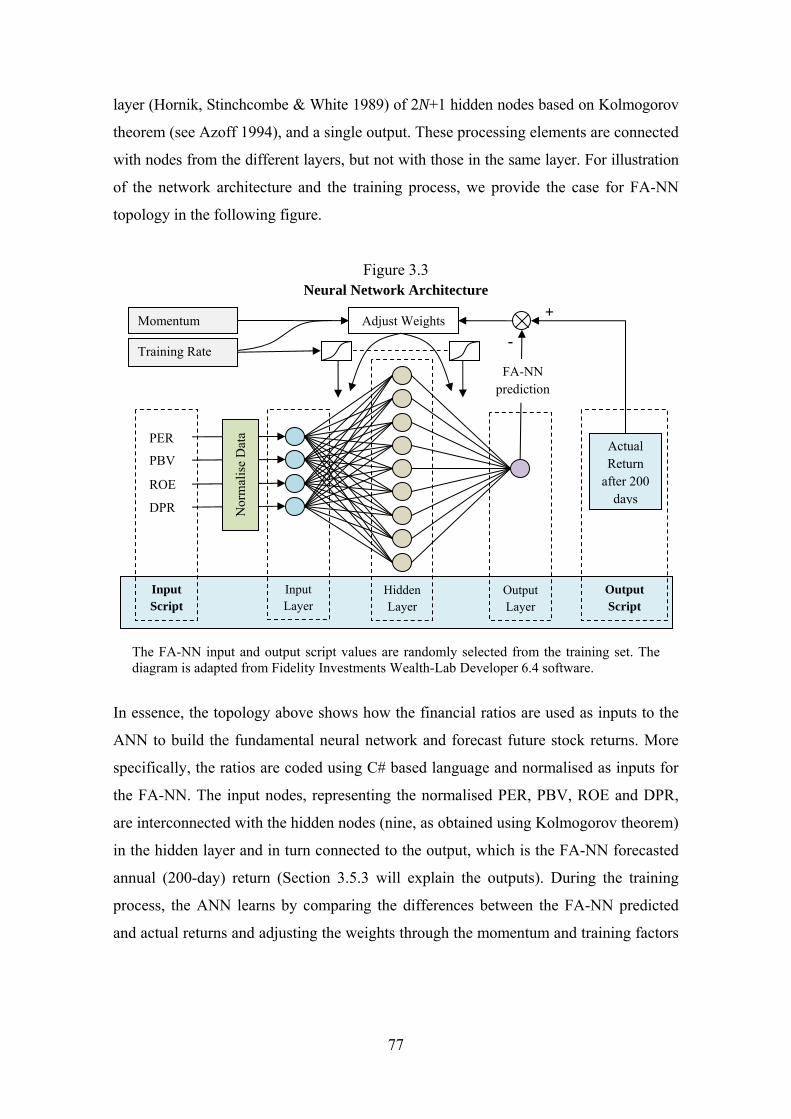
77
layer (Hornik, Stinchcombe & White 1989) of 2N+1 hidden nodes based on Kolmogorov
theorem (see Azoff 1994), and a single output. These processing elements are connected
with nodes from the different layers, but not with those in the same layer. For illustration
of the network architecture and the training process, we provide the case for FA-NN
topology in the following figure.
Figure 3.3 Neural Network Architecture
The FA-NN input and output script values are randomly selected from the training set. The diagram is adapted from Fidelity Investments Wealth-Lab Developer 6.4 software.
In essence, the topology above shows how the financial ratios are used as inputs to the
ANN to build the fundamental neural network and forecast future stock returns. More
specifically, the ratios are coded using C# based language and normalised as inputs for
the FA-NN. The input nodes, representing the normalised PER, PBV, ROE and DPR,
are interconnected with the hidden nodes (nine, as obtained using Kolmogorov theorem)
in the hidden layer and in turn connected to the output, which is the FA-NN forecasted
annual (200-day) return (Section 3.5.3 will explain the outputs). During the training
process, the ANN learns by comparing the differences between the FA-NN predicted
and actual returns and adjusting the weights through the momentum and training factors
PER
PBV
ROE
DPR Nor
mal
ise
Dat
a
Output Layer
Output Script
Input Layer
Hidden Layer
Actual Return
after 200 days
Momentum
Training Rate
Adjust Weights
-
FA-NN prediction
Input Script
+

78
via logistic sigmoid function. At each epoch,65 the network records the MSE. Following
Vanstone (2006), the ANN automatically stops learning when there is no improvement
to the network (that is, when no new lower MSE rate is obtained) after 2,000 epochs.
This is expected to preserve the generalisation ability of the network. At this stage, we
evaluate the network based on its in-sample performance (1 July 2002 to 30 June 2008),
in order to identify the specific buy/sell thresholds (see Section 3.6.1).
3.5.3 Output
In line with extant literature in trading strategies, the aim of our mechanical trading
systems is to forecast future stock returns. Accordingly, each neural network is trained
to predict one output based on the input data it is presented with. This is consistent with
Azoff (1994) who argues the need for only one output neuron for research in time series
forecasting. Note that there is an ongoing debate on the type of output that should be
used in training an ANN (such as directional accuracy or future stock prices) that goes
beyond the scope of this study, and interested readers should refer to Vanstone (2006).
Nonetheless, it is generally established that most traders are primarily concerned with
profits, as noted by Olson and Mossman (2003), and therefore, the use of stock returns
as output in this study is substantiated.
The purpose of fundamental analysis is long-term investment, which often corresponds
to the frequency of audited annual reports. That is, a fundamental trading system is
typically used to predict stock returns one year ahead (see Eakins & Stansell 2003;
Olson & Mossman 2003; Piotroski 2000). In a similar vein, annual (or annualised)
returns are also used as a yardstick for a corporate governance trading strategy (Aman &
Nguyen 2008; Bhagat & Bolton 2008; Drobetz, Schillhofer & Zimmermann 2004;
Gompers, Ishii & Metrick 2003). Following prior literature in these areas, we employ
one year as the prediction look-ahead for both networks (FA-NN and CG-NN). Note
that although a calendar year consists of 365 days, trading days generally conform to
working days (after deducting holidays, weekends, etc.). Following Vanstone (2006)
and Vanstone and Hahn (2010), we use 200 days as proxy for one year. In other words,
for both the FA-NN and CG-NN, we train the networks to forecast the future percentage 65 An epoch indicates the completion of one cycle of the learning process with each new input pattern.
79
annual (200-day forward) stock returns. In contrast, technical analysis focuses on
predicting short-term returns. In this study, we train the TA-NN to predict the
percentage returns five days ahead. This forecasting length matches the period of very
short-term trends as described by Achelis (2001).
3.6 Full-fledged Trading Systems
This section discusses the construction of the full-fledged stock market trading systems.
More specifically, we address each of the three elements for a trading strategy as
described by Chande (1997) and Pardo (2008). Section 3.6.1 outlines the first element,
which is the rules to enter and exit the trades, for both individual and hybrid trading
systems, by using the neural networks discussed in Section 3.5. Section 3.6.2 describes
the anti-Martingale position sizing approach. Section 3.6.3 explains the stop loss risk
control strategy. Taken together, these three components form the neurally enhanced,
full-fledged mechanical trading systems, as presented in the conceptual framework (see
Section 3.2.1).
3.6.1 Entry and Exit Rules
Following Vanstone and Hahn (2010), we derive the optimal threshold for signalling a
trade based on the ANN in-sample performance evaluation, where the line between
negative and positive percentage of average output can be identified. Neuro-Lab® 1.0
produces an output that ranges between zero and 100. This is measured by multiplying
the true output from the logistic sigmoid function (scaled between zero and one) by 100.
When the network produces a low (high) value, it is forecasting that the output will be
near the low (high) spectrum of the output range. In other words, the ANN signals a
higher (lower) output value when it expects higher (lower) stock returns (Vanstone
2006). The optimal threshold is the point where the ANN signals exceeding it indicate
the actual output being higher than the average output for all observations, and vice
versa. Section 3.6.1.1 outlines the trading rules for the individual systems. This is
followed by the fusion systems in Section 3.6.1.2.
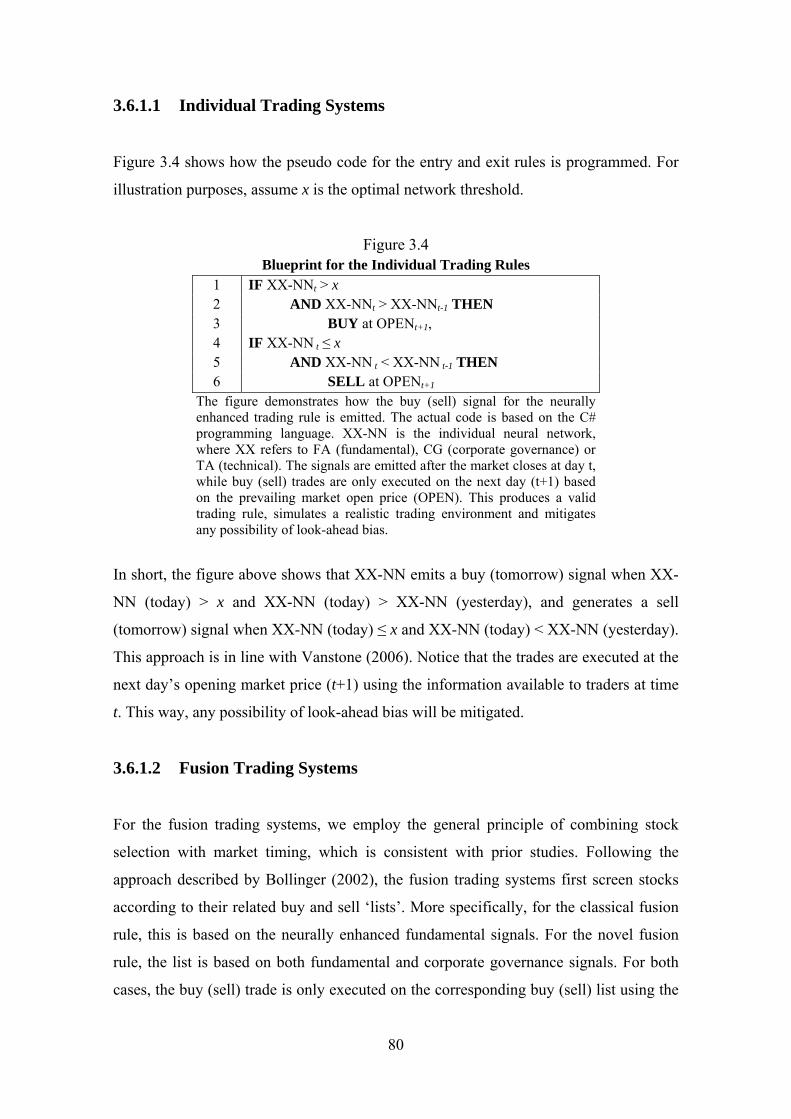
80
3.6.1.1 Individual Trading Systems
Figure 3.4 shows how the pseudo code for the entry and exit rules is programmed. For
illustration purposes, assume x is the optimal network threshold.
Figure 3.4 Blueprint for the Individual Trading Rules
1 IF XX-NNt > x 2 AND XX-NNt > XX-NNt-1 THEN 3 BUY at OPENt+1, 4 IF XX-NN t ≤ x 5 AND XX-NN t < XX-NN t-1 THEN 6 SELL at OPENt+1
The figure demonstrates how the buy (sell) signal for the neurally enhanced trading rule is emitted. The actual code is based on the C# programming language. XX-NN is the individual neural network, where XX refers to FA (fundamental), CG (corporate governance) or TA (technical). The signals are emitted after the market closes at day t, while buy (sell) trades are only executed on the next day (t+1) based on the prevailing market open price (OPEN). This produces a valid trading rule, simulates a realistic trading environment and mitigates any possibility of look-ahead bias.
In short, the figure above shows that XX-NN emits a buy (tomorrow) signal when XX-
NN (today) > x and XX-NN (today) > XX-NN (yesterday), and generates a sell
(tomorrow) signal when XX-NN (today) ≤ x and XX-NN (today) < XX-NN (yesterday).
This approach is in line with Vanstone (2006). Notice that the trades are executed at the
next day’s opening market price (t+1) using the information available to traders at time
t. This way, any possibility of look-ahead bias will be mitigated.
3.6.1.2 Fusion Trading Systems
For the fusion trading systems, we employ the general principle of combining stock
selection with market timing, which is consistent with prior studies. Following the
approach described by Bollinger (2002), the fusion trading systems first screen stocks
according to their related buy and sell ‘lists’. More specifically, for the classical fusion
rule, this is based on the neurally enhanced fundamental signals. For the novel fusion
rule, the list is based on both fundamental and corporate governance signals. For both
cases, the buy (sell) trade is only executed on the corresponding buy (sell) list using the

81
signals emitted by the ANN-based technical rules. To simplify, Figures 3.5 and 3.6
present the CFUS-NN and FUSION-NN trading rules. Assume the optimal thresholds
for FA-NN, CG-NN and TA-NN are x, y and z, respectively.
Figure 3.5 Blueprint for the CFUS-NN Trading Rule
1 IF FA-NNt > x 2 AND TA-NNt > z 3 AND TA-NNt > TA-NNt-1 THEN 4 BUY at OPENt+1, 5 IF FA-NNt ≤ x 6 AND TA-NNt ≤ z 7 AND TA-NNt < TA-NNt-1 THEN 8 SELL at OPENt+1
The figure demonstrates the pseudo code for signalling buy (sell) signals for the neurally enhanced classical fusion trading rule. The actual code is based on the C# programming language. The signals are emitted after the market closes at day t, while buy (sell) trades are only executed on the next day (t+1) based on the prevailing market open price (OPEN). This produces a valid trading rule, simulates a realistic trading environment and mitigates any possibility of look-ahead bias.
As can be seen from the figure above, the classical fusion rule generates a buy
(tomorrow) signal when FA-NN (today) > x, TA-NN (today) > z and TA-NN (today) >
TA-NN (yesterday), while the sell (tomorrow) signal is generated when FA-NN (today)
≤ x, TA-NN (today) ≤ z and TA-NN (today) < CG-NN (yesterday). The FUSION-NN
extends the classical approach by taking it a step further, via incorporating a corporate
governance neural network.
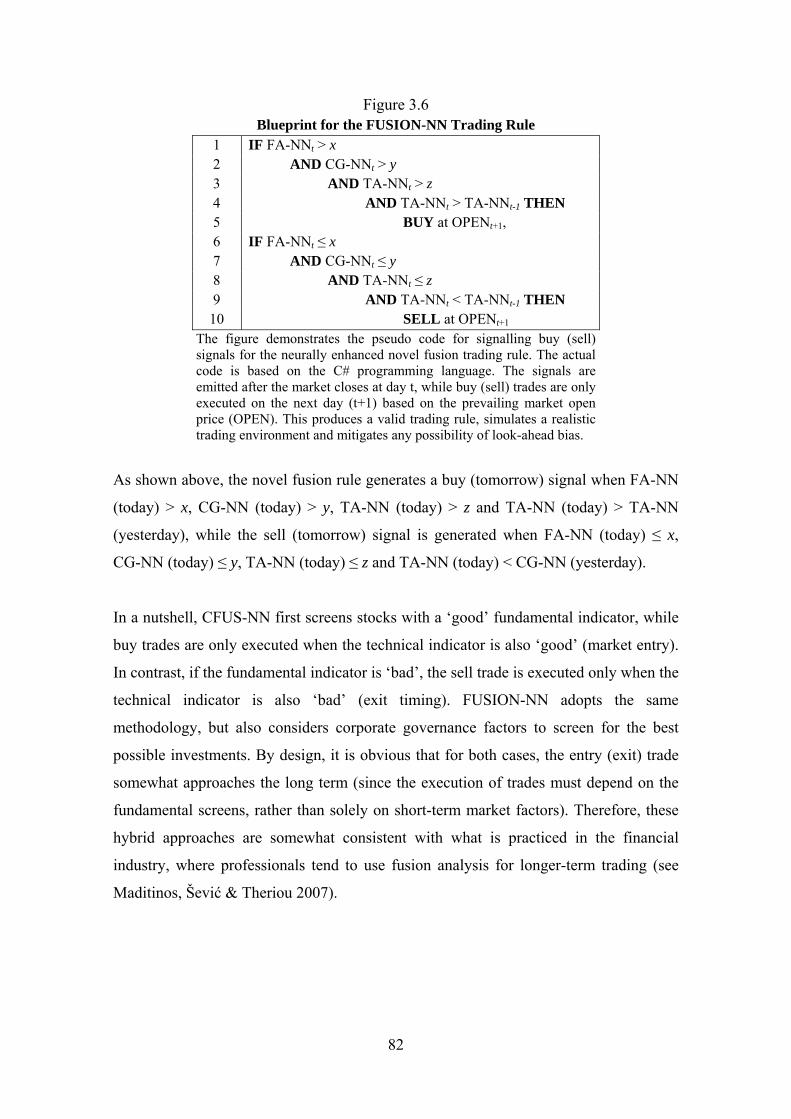
82
Figure 3.6 Blueprint for the FUSION-NN Trading Rule
1 IF FA-NNt > x 2 AND CG-NNt > y 3 AND TA-NNt > z 4 AND TA-NNt > TA-NNt-1 THEN 5 BUY at OPENt+1, 6 IF FA-NNt ≤ x 7 AND CG-NNt ≤ y 8 AND TA-NNt ≤ z 9 AND TA-NNt < TA-NNt-1 THEN
10 SELL at OPENt+1 The figure demonstrates the pseudo code for signalling buy (sell) signals for the neurally enhanced novel fusion trading rule. The actual code is based on the C# programming language. The signals are emitted after the market closes at day t, while buy (sell) trades are only executed on the next day (t+1) based on the prevailing market open price (OPEN). This produces a valid trading rule, simulates a realistic trading environment and mitigates any possibility of look-ahead bias.
As shown above, the novel fusion rule generates a buy (tomorrow) signal when FA-NN
(today) > x, CG-NN (today) > y, TA-NN (today) > z and TA-NN (today) > TA-NN
(yesterday), while the sell (tomorrow) signal is generated when FA-NN (today) ≤ x,
CG-NN (today) ≤ y, TA-NN (today) ≤ z and TA-NN (today) < CG-NN (yesterday).
In a nutshell, CFUS-NN first screens stocks with a ‘good’ fundamental indicator, while
buy trades are only executed when the technical indicator is also ‘good’ (market entry).
In contrast, if the fundamental indicator is ‘bad’, the sell trade is executed only when the
technical indicator is also ‘bad’ (exit timing). FUSION-NN adopts the same
methodology, but also considers corporate governance factors to screen for the best
possible investments. By design, it is obvious that for both cases, the entry (exit) trade
somewhat approaches the long term (since the execution of trades must depend on the
fundamental screens, rather than solely on short-term market factors). Therefore, these
hybrid approaches are somewhat consistent with what is practiced in the financial
industry, where professionals tend to use fusion analysis for longer-term trading (see
Maditinos, Šević & Theriou 2007).
83
3.6.2 Position Sizing
For the second major element of the trading system, we employ the anti-Martingale
strategy as generally described by Balsara (1992), Pardo (2008) and Tharp (1998). The
advantage of this approach is that it combines the dual-feature of winning and losing
streaks, by increasing or decreasing subsequent trade sizes, based on the performance of
the previous trades. Its design also alleviates the danger associated with the gambler’s
fallacy (Tharp 1998).
The strategy can be described as follows. We use an initial trade size of 5% of equity,
and this parameter value is in line with Vanstone and Finnie (2010). Unlike their static
approach, however, the position size in this thesis adjusts dynamically. If the trade is
profitable, the next trade size is increased by 2%. If the trade is a loss, the next trade size
is reduced by 1%. This is subject to a minimum of 1% of equity, to avoid unnecessary
costs related with very small trades. Both increase and decrease rates are based on the
default system (software) settings. Provided that the streak continues, this strategy
enhances (reduces) potential profit (loss) for the next trade.
Of course, this approach may expose more money at risk when the trade size gets larger.
As argued by Balsara (1992), there is a risk that the largest position size may be assigned
on a losing trade directly after a profitable trade. Nonetheless, based on our in-sample
metrics, we observe that our trading systems have relatively modest exposures,
endorsing the use of greater percentage of equity. Indeed, as argued by Vanstone and
Hahn (2010), the use of larger trade sizes are warranted as long as the system has low
exposure. This way, more capital can be exposed to the market. In any case, any risk
associated with losing will be bounded within the stop loss threshold.
3.6.3 Risk Control
As for the third major element of a trading system, the risk of losing in this study is
capped using a stop loss program. Stop loss is an important, fail-safe risk management
strategy, which liquidates the stocks mechanically when the loss reaches a specified
threshold. It is a widely used risk control strategy by practitioners. Brady (1975), Chande

84
(1997), Darvas (1960), Pardo (2008) and Vanstone (2006) similarly advocate the use of
stop loss policy in developing trading systems. O’Neil also recognises its importance for
traders who are unable to closely monitor their investments, and those with difficulties in
selling their stocks (Boik 2004; O’Neil 2009).
There are many ways to find a stop loss threshold, such as using the MAE (Vanstone
2006; Tharp 1998) or utilizing predefined (arbitrary) values (for instance, 10% or 20%).
Although MAE assists traders to identify the threshold in which losing trades might later
become profitable, it involves subjective interpretation (eyeballing), while changes in
market dynamics or listless markets may render the strategy ineffective (Vanstone 2006).
Chande (1997) proposes to take profits slowly and cut all losses at once. O’Neil places a
stop rule of 7% or 8% below the purchase price (Boik 2004). The use of low stop rates,
however, may limit potential gain (Bernstein 1998) and triggers the stop order even when
there is only a small fluctuation in the price or random noise (Vanstone 2006). For
example, a tight stop is blamed for the loss made by Darvas in his investment in Joy
Manufacturing (Darvas 1960). In some cases, a wider stop is required (Bernstein 1998).
Setting a stop too high, nonetheless, will risk the trader losing substantial amount of
their investment.
Based on the above arguments, it is crucial to ensure that the threshold is not on the
extremes of either side. Accordingly, it is important to determine how much, from the
practical standpoint, is the maximum limit of price decline to be considered reasonable. In
this aspect, Warren Buffett prescribes an important rule for taking risk in stock
trading.66 In brief, Buffett warns that a trader must not invest in stocks if they could not
risk losing 50% of equity value (Lynch 1994), which suggests the upper limit a trader
should be willing to lose. Put another way, a trader must be able to tolerate that much of
a decline in the stock price. Taking into account the preceding discussions, we place a
50% stop loss policy on our trading systems. This choice can be supported from several
perspectives. In general, the use of a loose stop is appropriate for a constant stop strategy
(Chande 1997). Moreover, a sufficiently large stop lowers the likelihood of it being hit
by noise (Vanstone 2006) and allows adequate space for the market to swing without
66 While Buffett does not directly address the issue of stop loss, his advice can be generalised as the threshold for a risk control strategy in trading stocks.

85
triggering the stop (Bernstein 1998). Finally, the threshold represents a balance between
high and low stop spectrums, which allows the policy to mitigate the danger of holding
on to the losing position too long, as described by the disposition effect theory (Shefrin &
Statman 1985). In any event, we also re-run the analysis using the MAEs (in-sample) and
observe that the predefined value of 50% stop loss to be reasonable.67
3.7 Realistic Settings and Constraints
To provide valid trading simulations, we include realistic levels of budget, portfolio or
sample of stocks, transaction costs, short selling restriction and round lot trading. An
investment capital of RM100,000 is placed at the initial period. This figure is
comparable with other forms of investments in Malaysia.68 Moreover, since traders in
Malaysia are likely to come from middle and upper levels of economic classes (Isa &
Lim 1995), the budget can be considered reasonable. The use of 30 stocks as a sample
size effectively makes the research less likely to trade in an excessively large number of
stocks (and thus produces realistic sample portfolios), especially since the trading systems
in this study are designed to allow only a single open position for each symbol (stock) at
any given time, and also because of the practical limitation of budget above.69
67 From the results, we find that by and large, the trading systems still produce considerable number of winners, including those that have previously entered into large unprofitable territories. Moreover, there is no clear threshold that can be observed from the MAEs (for instance, in one case, all the trades become profitable), and that our trading systems require a sufficiently large, predefined stop loss threshold. Accordingly, we adopt the maximum value as described by Buffett as the limit. We re-run the analysis using Buffett’s benchmark and find that during the in-sample period, the stop loss threshold of 50% yields reasonable outcomes. That is, all our trading systems generate significant profits and superior risk-return tradeoffs compared to the B&H rule. Prior research by Vanstone (2006) observes that the stop value for his fundamental strategies (using MAE) is 45%, which is also near Buffett’s guideline. Based on this, the threshold can be considered practical. Using this stop value, both of his fundamental strategies generate profits. In contrast, one of his technical strategies, which use a low 5% stop benchmark, incurs substantial loss and underperforms the B&H. Like Darvas (1960), Vanstone (2006) attributes his tight stopping benchmark as one of the culprits, even though the MAE has been correctly identified in-sample. 68 For example, the Floating Rate Negotiable Instruments of Deposit (FRNID) issued under the Central Bank of Malaysia Guidelines on Negotiable Instruments of Deposit (2006) also requires RM100,000 as the minimum investment requirements. Note that with effect from 18 May 2009, the guidelines have been removed and all requirements are incorporated into the Guidelines on Introduction of New Products and the Guidelines on Product Transparency and Disclosure. 69 This is further made evident by the number of trades executed during the in-sample period, as well as that during the out-of-sample period (see Chapters 4 and 5). The number of trades (sample portfolio) produced by each trading system is within the vicinity of those documented in the real world by Barber and Odean (2000), Cervellati, Fattori and Pattitoni (2010) and Feng and Seasholes (2004).

86
Each trade in this thesis is appropriately adjusted for costs. The total costs for trading in
the Bursa Malaysia comprise a brokerage fee (minimum of 0.60% and maximum of
0.70% of contract value), stamp duty (RM1 for RM1,000 or fractional part of the value
of securities) and clearing fees (0.03% of transaction value). Assuming a maximum
brokerage fee is charged, the one way (round-trip) total cost can be formulated as
approximately 0.83% (1.66%). Note that by using high cost, we are thus biasing the
results against our favour, and our findings are at best understated. To put it differently,
our research design is more likely to accept the null hypothesis that our mechanical
trading systems do not generate significant returns.
While the ban on short selling70 has recently been lifted, Bursa Malaysia reintroduced
the Regulated Short Selling (RSS).71 More specifically, stocks are required to satisfy all
criteria imposed by the exchange to be included.72 These requirements are not unlike the
ones in the Australian market as examined by Vanstone (2006), which means that only
certain stocks can be shorted at any given time. Therefore, a realistic long-only
constraint is employed in this thesis. Finally, all trading is executed in round lots. In
Malaysia, a board lot equals 100 units. In other words, each trade and open positions are
in the multiples of 100. With the inclusion of these constraints, our study attempts to
offer more accurate and valid empirical results.
3.8 Performance Evaluation
This thesis investigates two forms of performance evaluation techniques, namely
trading metrics and statistical analysis. This approach largely follows the methodology
described in Vanstone (2006). Next, we briefly outline the benchmark B&H policy.
This is followed by a description of the trading metrics, and later, statistical tests.
70 The prohibition of short selling activities in the Malaysian stock market is stated in the Members’ Circular R/R of 1997, dated 5 September 1997. 71 This comprises only 100 RSS Approved Securities in the Bursa Malaysia. Initially, the reintroduction of RSS consisted of 70 stocks. 72 The criteria include: (1) average daily market capitalisation over RM500 million for the past three months; (2) at least 50 million shares in public float and (3) average monthly volume traded of more than 1 million units for the past 12 calendar months. The list is reviewed about every six months.

87
3.8.1 Buy-and-Hold
As mentioned earlier, under the assumption that the market is information efficient, the
best trading strategy would be to follow the naive B&H rule (Fama 1965; Fama &
Blume 1966; Malkiel 2007; Reilly & Brown 2003; Vanstone 2006). The B&H is a
passive strategy that makes no attempt to identify mispriced stocks. Moreover, because
it is not concerned with rebalancing, the strategy (generally) incurs lower costs (Ou &
Penman 1989).
To implement this strategy, we code the policy to buy all 30 sample stocks equally
(with the weight of 1/N) at the initial out-of-sample period (1 July 2008). The stocks are
held all through the entire period. Note that by design, the strategy ignores any other
trading activities or risk control strategies, and it gains only by exploiting market trends.
The use of B&H as the benchmark strategy is in line with prior literature (for example
Dryden 1970; Fama & Blume 1966; Fernández-Rodríguez, González-Martel &
Sosvilla-Rivero 2000; Jensen & Benington 1970; Thawornwong, Enke & Dagli 2003;
Vanstone 2006).
3.8.2 Trading Metrics
This thesis explores several trading metrics that are widely used by real life traders and
investment firms. To provide systematic analysis, we classify the trading metrics into
two parts: (1) general trading metrics and (2) key trading metrics. Given the breadth of
performance measures examined in this thesis, this distinction allows us to emphasise
the key and relevant metrics when comparing multiple trading systems. This distinction
can be supported by prior research.73 The latter, in particular, lists the salient metrics for
73 For example, with respect to the general metrics, although net profit is important, it must be referred to risk to make sense (Vanstone 2006). In a similar vein, the number of trades merely indicates how many trades are triggered by the trading system, and by itself provides little information. In comparison, for the key performance metrics, drawdown is said to be a more important gauge of performance compared to net profit (Rotella 1992). Likewise, it is widely acknowledged that Sharpe and Sortino ratios, for instance, are the most essential performance measures. In any event, since the trading systems are ultimately sorted based on their Sharpe ratios (which is established in both academic research and practice as the leading measure) following Eakins and Stansell (2003), the classification does not affect the final outcome of our trading systems ranking.

88
trading performance. Indeed, the Fidelity Investments Wealth-Lab Developer similarly
indicates these key metrics as among the ‘bottom line’ of performance measures.74
Altogether, we examine a total of 20 trading metrics ranging from profitability to risk,
trades, and their risk-return tradeoffs. A detailed discussion of these metrics goes outside
the scope of this thesis. Interested readers should refer to Chande (1997), Grossman and
Zhou (1993), Kaufman (1998), Link (2003), Pardo (2008), Rotella (1992), Ruggiero
(1997), Sharpe (1966, 1994), Sortino and Satchell (2001), Tharp (1998), Vanstone and
Finnie (2009) and Vanstone and Hahn (2010).
3.8.2.1 General Trading Metrics
The first category deals with 13 general metrics, which comprise the following: (1) net
profit; (2) net profit %; (3) annualised gain %; (4) number of trades; (5) average profit;
(6) average profit %. (7) exposure; (8) winners: winning trades; (9) winners: win rate;
(10) winners: average profit %; (11) losers: losing trades; (12) losers: loss rate and (13)
losers: average loss %. These metrics can be briefly described as follows.
Net profit refers to the total dollar profit generated after deducting trading costs. Net
profit % indicates total net profit in terms of its percentage of initial budget (starting
capital). Annualised gain % refers to the compounded annual growth rate (CAGR),
which is also known as the annual percentage return (APR). It shows the smoothed
average rate of return on the basis of compounding the starting capital annually.
Number of trades simply shows the total number of round-trip trades and open
positions. Average profit (profit %) is the average dollar (percentage) return per trade
after deducting trading costs. Exposure refers to the total area of portfolio equity
exposed to the market during the period.
Winners: winning trades (win rate) refers to the number (ratio) of winning trades
produced by the trading systems, while winners: average profit % indicates the average
percentage profit of the winners. Similarly, losers: losing trades (loss rate) refers to the
number (ratio) of losing trades generated by the trading systems, while losers: average 74 In addition, this thesis also includes the ulcer index and Sortino ratio to the list of key metrics.

89
loss % indicates the average percentage loss of the losing trades. It is generally desirable
for a trading system to generate more winners than losers, or similarly, better directional
forecast. Nonetheless, this also depends on the system average profits (losses) when the
trade is a winner (loser).
3.8.2.2 Key Trading Metrics
More important for our study, the second group of metrics details the principal
performance measures of a trading system. This thesis explores seven key metrics: (1)
profit factor; (2) payoff ratio; (3) maximum drawdown %, (4) recovery factor; (5) ulcer
index; (6) Sharpe ratio and (7) Sortino ratio. Briefly stated, these performance measures
can be given as follows.
Profit factor is a measure of profitability and is calculated by dividing gross profit with
gross loss. Chande (1997) advises the factor to exceed one, although Vanstone and
Finnie (2009) assign a stricter threshold of two. Payoff ratio indicates the efficacy of a
trading system in acquiring returns relative to losses, measured by dividing the average
percentage profit over the average percentage loss. It is desirable for the ratio to exceed
two (Vanstone & Finnie 2009). Maximum drawdown % is the percentage decline of the
largest peak to valley in the equity curve. According to Pardo (2008), drawdown is one
of the best measures to evaluate the overall risk of a system. Recovery factor is
computed by dividing the absolute value of net profit by the maximum drawdown. It
shows how effective the trading system is in overcoming the effects of drawdown.
Chande (1997) proposes a minimum factor of two to be exceeded for the trading system
to be desirable. Ulcer index measures volatility in terms of drawdown by square rooting
the quotient of sum squared drawdowns divided by the period.
Ultimately, the superiority of a trading system is gauged by its risk-return tradeoffs. The
most popular approach, the Sharpe ratio (Sharpe 1966, 1994), measures the return to its
variability (volatility). In this study, the ratio is computed by dividing the annualised
average return with its annualised standard deviation. In general, the value above one
indicates the system has good risk-return tradeoffs. Varga (2006) contends that a ratio
above 0.7 is also acceptable. Accordingly, when contesting different strategies, the best
trading system is the one with the highest Sharpe ratio.

90
One of the main limitations with the Sharpe ratio, however, is that it penalises both upside
and downside volatility as equally risky. In reality, investors are more concerned with the
downside risk (the risk of loss) whereas the ‘risk’ of upside (profit) is actually preferred.
This limitation is addressed in the Sortino ratio (see Sortino & Satchell 2001). The ratio
only considers ‘bad’ volatility (i.e., downside deviation instead of standard deviation) in
the denominator, and therefore, provides robustness to the results on return to variability.
Like the Sharpe criterion, the higher ratio indicates the better system.
Despite the limitations of the Sharpe measure, it remains the most popular approach in
measuring investment risk-return tradeoffs (Feibel 2003). This is also supported by Lo
(2002, p.36), who notes that it is ‘one of the most commonly cited statistics in financial
analysis’. Accordingly, its use as the primary performance measure in this thesis allows
for comparability with other studies. As discussed in Section 3.2.2, the Sharpe ratio is
also used as the primary metric in order to rank the trading systems (i.e., for
Propositions 2 and 4). This approach is consistent with Eakins and Stansell (2003).
Further, to provide a numerical assessment of the economic significance of the fusion
trading systems, the percentage increase in the Sharpe (and Sortino) ratio by combining
the trading strategies will also be noted.75 In the table that follows, we provide the
mathematical formula for the key trading metrics.
75 As measured by the differences in the Sharpe (Sortino) ratios between the fusion trading system and the base strategy, divided by the Sharpe (Sortino) ratio produced by the base strategy. The base strategy refers to the constituent trading systems, and in the case of FUSION-NNTS, it also refers to the CFUS-NNTS.

91
Table 3.5 Key Trading Metrics
Acronym Metric Operationalisation PF Profit Factor GP
PFGL
PR Payoff Ratio AWPR
AL
MD% Maximum Drawdown % %
V PMD
P
RF Recovery Factor NPRF
MDD
UI Ulcer Index 2
1
N
iiD
UIN
SR Sharpe Ratio p f p
p p
R R RSR
ST Sortino Ratio p f p
pd pd
R R RST
The table shows the mathematical formula for the key metrics. PF is a measure of profitability, where GP (GL) is the gross profit (gross loss). PR indicates the efficacy of a trading system in acquiring returns relative to losses, where AW (AL) indicates the mean percentage profit (loss) for winning (losing) trades. MD% refers to the largest market peak (P) to valley (V) percentage decline. RF shows how effective the trading system is in overcoming the effects of drawdown, where NP (MDD) denotes net profit (maximum dollar drawdown). UI measures volatility in terms of drawdown (D) during the period (N). SR conveys the risk-adjusted return for the trading systems, where Rp denotes the annualised mean return, Rf refers to the risk-free rate and σp refers to the annualised standard deviation. The calculation for ST is similar to the SR, but utilises downside deviation of portfolio return (σpd). This study assumes Rf = 0; therefore, SR (ST) equals Rp divided by σp (σpd).
It is important to highlight that, typically, the calculation of the Sharpe (and Sortino)
ratio uses excess returns (Sharpe 1994). Nonetheless, since our trading systems do not
involve removing cash from the portfolio, and hence there are no other costs incurred or
streams of income acquired, the calculation of the Sharpe (and Sortino) ratio assumes a
zero risk-free rate of return (see Vanstone 2006). Kaufman (1998) also argues that for
practical purposes, the risk-free rate is often ignored from the calculation of the ratio.
Briefly stated, since there is no risk-free rate used, the excess return effectively equals
the mean profit (see Table 3.5). Note that the use of average return (rather than excess
return) is also applicable for a zero-investment strategy (Capaul, Rowley & Sharpe
1993). In any event, the approach adopted in this thesis is consistent with other studies,
for example Thawornwong, Enke and Dagli (2003) and Vanstone and Hahn (2010).

92
3.8.3 Statistical Analysis
Although economic significance (such as the trading metrics used in this study) is
perhaps the more important aspect for evaluating the performance of a trading system
(Olson & Mossman 2003), statistical tests can provide further understanding on whether
the trading systems are indeed beneficial and capable of exploiting market inefficiency,
or if the findings are simply the result of curve fitting or due to chance (Katz &
McCormick 2000). In the existing literature, one of the most common approaches in
examining statistical significance of a trading system is by using the Student’s t-test
(Katz & McCormick 2000; Kaufman 1998; Vanstone 2006). This parametric test
depends on the assumptions that the observations should be independent and follow the
Gaussian (normal) distribution.
The assumption of normality is widely used in quantitative finance, and while this may
not always hold true, it allows for numerous advances in the field (Wilmott 2007). The
central limit theorem, in particular, legitimises the assumption of normality given
sufficiently large sample size (which is, in the context of this study, the total number of
trades). In brief, as the sample size increases, the sampling distribution approaches
normal. Normally, the assumption of Gaussian distribution can be invoked when the
sample size is greater than 20 or 30 (De Sá 2007; Studenmund 2001). In the context of
trading, Katz and McCormick (2000) argue that even when there is only a small number
of trades of 10, there will only be a small error (if any) in case the assumption is violated.
Likewise, the authors support the use of the central limit theorem when the number of
trades exceeds 20 or 30, and this assumption is also used in this thesis. In contrast, if the
trading system produces only a small number of trades (< 20), we utilise the Shapiro-Wilk
statistic (Shapiro & Wilk 1965; Shapiro, Wilk & Chen 1968) to test for normality.76
Katz and McCormick (2000) argue that while the assumption of normality is vital, serial
dependence poses a more serious violation when testing trading systems. The presence
of a significant serial dependence can be measured by calculating Vince’s (1992) Z
76 The Shapiro-Wilk test is a reasonably powerful test for normality and can be used for a sample size as small as three. Given the nature of this thesis, where a small number of trades can be expected (see for example Aby, Briscoe, Elliott et al. 2001; Vanstone 2006), this test is preferred compared to the other types of normality tests, such as the Kolmogorov-Smirnov test.

93
score of runs test. It shows whether the sequence of winning and losing trades of the
system has more or less streaks than a random distribution. The runs test analysis can be
mathematically presented as
( 0.5)
( ( ))( 1)
N R XZ Score
X X NN
where N refers to total number of trades, R is the total number of runs, W (L) denotes
total number of winning (losing) trades, and X = 2 × W × L. According to Vince (1992),
the assumption of serial dependence can only be accepted if the value of Z score is
above two (that is, two standard deviations, or 95.45%). Otherwise, it is safe to assume
there is no statistically significant dependency. Stated differently, we can conclude the
data are random (not random) when Z Score < 2 (≥ 2). This approach has also been used
in Vanstone (2006). Accordingly, the use of parametric statistical analysis in this thesis
is valid provided the assumptions of normality and serial independence above are met.
The following describes the statistical tests used in this thesis for testing the hypotheses
presented earlier (see Table 3.1: H1a to H5a). We employ the one sample t-test (one
tailed) to investigate whether the mean returns from the trading systems are statistically
distinguishable from zero (Katz & McCormick 2000; Kaufman 1998; Vanstone 2006).
This parametric test is fairly robust to departure from normality and is the first choice
for analysis. However, if the above discussed assumptions are violated, we instead use
the nonparametric one sample Wilcoxon signed rank test (one tailed) to examine if the
median profits from the systems are significantly greater than zero.
To analyse if the mean return yielded by the neurally enhanced trading system is
statistically superior to the B&H policy (see Table 3.1: H1b to H5b), this thesis employs
the independent samples t-test (one tailed) as the prime approach. This unpaired t-test is
also fairly robust to departure from normality. Note that in addition to normality and
independence, the standard test also depends on the assumption of homogeneity of
variances. In order to test if there is significant heterogeneity of variances, we use the
Levene’s test for equality of variances (based on the typical alpha value of 0.05). If the
variances of the ANN trading system and the B&H are equal, we use the standard t-test.
(3.2)

94
Conversely, if the variances are not equal, we employ the Welch t-test (Welch 1947),
which makes no assumption of equal variances. Alternatively, if the assumptions of
normality and serial independence cannot be accepted, we utilise the nonparametric
Mann-Whitney U test (one tailed) to examine if the mean returns from our trading
systems are significantly higher than the one produced by the B&H rule.
3.9 Conclusions
This chapter has presented the novel framework, which integrates the triumvirate of
neurally enhanced trading indicators, within the context of a full-fledged stock market
trading system. Each trading system developed in this study considers sophisticated
money management settings and practical risk management strategy. To test the
viability of the novel approach, as well as the classical and individual trading systems,
we form several testable propositions and hypotheses, in light of valid trading settings
and constraints (such as round lot, limited budget and trading costs). In order to explore
these research postulates, data has been collected from the Bursa Malaysia and
Thomson Reuters DataStream.
To guard against potential biases of data snooping, look-ahead and survivorship, this
thesis utilises a research design that attempts to alleviate these biases. For example, the
stock list is sourced only from information publicly available before the out-of-sample
horizon. This also includes firms that later (in the out-of-sample period) become
delisted. Buy or sell trading signals are generated at time t+1, only after it is fully
confirmed the information is publicly available on day t. Finally, the trading systems are
built in-sample, and their performances are evaluated on a completely separate, blind
hold out sample period.

95
A myriad of trading metrics (such as the Sharpe and Sortino ratios, ulcer index, profit
factor and payoff ratio) commonly used by traders and investment managers are explored
to provide rigorous performance measures for the trading systems. In the following
chapter, we first investigate if the individual trading systems built upon fundamental,
corporate governance and technical indicators can yield economically significant profits
and outperform the benchmark B&H rule. This is followed by an analysis of both novel
and classical fusion trading systems in Chapter 5.

96
CHAPTER 4
Trading Performance of Fundamental,
Corporate Governance and Technical Analysis
‘Plan the trade and trade the plan’ Trading Proverb
4.1 Introduction
Having discussed the conceptual framework and research methodology (plan the trade) in
the last chapter, this chapter gives the results and discussion of our findings (by trading
the plan).77 In this chapter, we develop and examine the three major trading systems
dominating the stock market, namely fundamental analysis, corporate governance
analysis and technical analysis (in isolation), against the benchmark B&H strategy. As
described in Chapter 3, our trading models are constructed in-sample, while all analysis is
made out-of-sample and tested within realistic and complex trading environments.
For the sake of brevity, and since the definition of the trading metrics is independent of
the trading systems, we only provide a detailed discussion of the trading metrics for the
first trading system and summarise the performance for the subsequent trading systems.
This approach is similar to Vanstone (2006). The remainder of this chapter is organised
as follows. Section 4.2 discusses fundamental analysis. Section 4.3 presents corporate
governance analysis. Section 4.4 discusses technical analysis. Section 4.5 presents the
discussion of our findings. Section 4.6 concludes.
77 In the last chapter we have engineered a sophisticated framework for building neurally enhanced full-fledged trading systems, which are supported by the leading investment theories. In practice, it is highly crucial for a trader to follow a well-founded trading framework to help with his/her investment decision making. Warren Buffett argues that in order to succeed in trading stocks, one not only requires a sound framework, but also must prevent emotions from eroding the framework (Graham & Zweig 2003). Ironically, many traders ignore these rules. As Bernstein (1998, p. 80) puts it, ‘the good news is that a trading system will give you strict rules to follow. The bad news is that most traders will not follow their rules.’ Therefore, it is vital for a trader not only to plan the trade, but also trade the plan.

97
4.2 Fundamental Analysis
In this section, we first examine the developmental stage (in-sample) of the neurally
enhanced fundamental trading system (FA-NNTS), and later investigate its trading
performance against the B&H rule (out-of-sample) within the context of realistic trading
settings. Based on the fundamental theory, we use financial ratios as inputs for training
the fundamental neural network (FA-NN) to forecast future (annual) stock returns. The
results are presented below.
4.2.1 Model Design
4.2.1.1 Training Data
As detailed in Chapter 3, we use four fundamental variables, namely PER, PBV, ROE
and DPR for training the FA-NN, covering profitability, cash flow and market valuation.
The in-sample data ranges from 1 July 2002 to 30 June 2008, which consists of 39,841
daily observations. Table 4.1 shows the descriptive statistics of the fundamental variables.
Table 4.1 Descriptive Statistics of Fundamental Variables
Variables Min Max Mean Std Dev PER 0.00 4720.00 45.70 368.88 PBV 0.12 33.02 2.67 3.76 ROE -101.52 134.26 13.17 24.14 DPR 0.00 99.45 35.57 25.53
The table reports descriptive statistics of the fundamental variables based on annual data synchronised daily. The synchronisation process generates 159,364 fundamental data points—39,841 (daily observations) × 4 (fundamental variables). The values for ROE and DPR are in percentages.
A few remarks can be made. The PER ranges from 0 to 4,720. On average, it appears
investors are willing to pay more than 40 times per dollar of earnings in the sample
Malaysian firms. We find that the relatively high maximum PER is caused by very
small profits. The minimum (maximum) PBV is 0.12 (33.02), with an average of 2.67.
ROE ranges from -101% to 134.26%. The mean ROE of 13% shows how much on
average the sample firms yield returns for their investors. This value is also close to the
ratio in the US, which is 12% as deemed by Buffett (Aby, Briscoe, Elliott et al. 2001).
The percentages of earnings distributed to shareholders as dividends ranges from 0 to

98
99.45%, with an average of 35.57%. This is in line with the fact that more stable,
mature firms tend to pay higher dividends, while non-dividend paying firms are either
those more susceptible to risks, or relatively new firms (in our early sample period),
which may hold their cash for expansion purposes.
To facilitate system utilisation within the constraints of time and RAM, every fifth row
of bars78 are loaded as inputs for training the network. Consistent with Vanstone (2006),
we remove outliers to prevent skewing the analysis. This results in a total of 6,281 daily
observations. Table 4.2 presents the final fundamental input for the ANN.
Table 4.2 Descriptive Statistics of FA-NN Input Variables
Variables Min Max Mean Std Dev PER 0.00 205.30 17.51 19.62 PBV 0.21 8.13 1.88 1.16 ROE -33.52 27.30 11.72 7.11 DPR 0.00 99.45 32.48 22.16
The table reports descriptive statistics of the fundamental variables being included for neural network training. As a result of sampling out bars and removal of outliers, there is a total of 25,124 fundamental data points—6,281 (daily observations) × 4 (fundamental variables). The values for ROE and DPR are in percentages.
As described in the preceding chapter, the purpose of fundamental analysis is for long-
term investment. Accordingly, we program our FA-NN to predict the percentage returns
one year forward. Recall that considering the effects of non-trading days, we use 200
days as proxy for one year. The following table reports the characteristics of the FA-NN
target output.
Table 4.3 Descriptive Statistics of FA-NN Target Variable
Variables Min Max Mean Std Dev Output -70.89 260.38 17.43 32.23
The table shows the target variable, which is the percentage return 200 days in the future. The statistics are based on the sampled data (after sampling every fifth bar and removing outliers in the financial ratios), which matches the FA-NN input (i.e., 6,281 daily observations).
78 This thesis uses daily data. Accordingly, each bar represents one trading day.

99
From the table above, we can see that the percentage annual (200-day) returns (from the
FA-NN training set) for the Malaysian firms range from a minimum of -70.89% to a
maximum of 260.38%. On average, the yearly stock return across the sample firms is
17.43% with a standard deviation of 32.23%.
4.2.1.2 Training Process
Using four fundamental variables as inputs and the future annual returns as output, our
FA-NN topology is given as 4:9:1. That is, the network consists of four input nodes
(financial ratios), nine hidden nodes and one output node (200-day forward returns).
The number of hidden nodes is determined using the Kolmogorov theorem as measured
by 2N+1 hidden nodes, where N = 4 input nodes. The fundamental neural network is
trained until there is no new rate of MSE low for 2,000 epochs. Effectively, the FA-NN
runs for a total of 41,408 epochs until this condition is met, where the training stops
automatically. Figure 4.1 illustrates how the MSE declines as the training progresses,
with a sharp fall in the earlier epochs (until about 4,000 epochs), and later plateaus
when there is little improvement to our networks.
Figure 4.1 FA-NN Training Error
The figure presents the training error for the ANN using the sampled data (after sampling every fifth bar and removing outliers) for the period 1 July 2002 to 30 June 2008 on each epoch. The error term denotes the average of the sum of the squared differences between the FA-NN output and the target output (MSE) and multiplied by 1,000.
As can be seen from Figure 4.1, the final MSE from employing FA-NN in forecasting
future annual returns is less than 0.0035. To determine the specific buy/sell threshold
for our FA-NN trading rules, we evaluate the performance of FA-NN using the entire

100
in-sample period by examining its generated indicator values, predicted output, number
of observations, actual output and percentage of average. This is described below.
4.2.1.3 Trading Rules
The following table reports the results for the performance evaluation of the FA-NN,
based on the entire in-sample data for the period 1 July 2002 to 30 June 2008.
Table 4.4 FA-NN Performance Evaluation
FA-NN Indicator
Predicted Output
Observations Actual Output
Percentage of Average (%)
Performance Bar
5-10 -39.39 15 -26.95 -255.00 10-15 -23.34 3 -39.49 -327.16 15-20 -12.10 394 -11.71 -167.34 20-25 5.95 1719 6.12 -64.82 25-30 19.91 3022 17.56 1.00 30-35 33.19 866 33.62 93.36 35-40 50.30 84 56.68 226.00 40-45 65.73 150 66.37 281.76 45-50 88.19 99 82.43 374.12
The table shows the performance evaluation of the FA-NN using the entire in-sample period (1 July 2002 to 30 June 2008) data. The FA-NN indicator presents the values generated by the ANN. When the FA-NN produces a low (high) value it is forecasting that the output will be near the low (high) end of the output range. Predicted output shows the forecasted output value. Observations report the number of individual observations (more specifically, bars) of data within the FA-NN indicator range. We remove any outliers (any row with the observation of less than 1% of the total observations) from the analysis. Outliers (if any) provided in the table are for illustration purposes only. Actual output reports the average actual output. Percentage of average (%) displays the magnitude of the average output for that particular row compared to the average output for all observations. Performance bar provides a graphical presentation of the percentage of average (%). Note that the bar is not to scale and is provided for illustration purposes only.
Table 4.4 shows the performance evaluation of FA-NN. Briefly stated, since the
network is trained to forecast annual returns, the indicator will be higher when FA-NN
thinks there will be greater returns after 200 days. Notice the demarcation point between
negative and positive percentage of average output is located when FA-NN = 25. In
other words, this is the optimal parameter for signalling the trades. When FA-NN > 25,
the actual output is higher than the average output for all observations as demonstrated
by the positive percentage of average and as shown in the performance bar. The
opposite can be said when FA-NN < 25. The value is also located within the range of

101
most observations, with 1,719 and 3,022 observations for the 20-25 and 25-30 indicator
ranges, respectively, for making meaningful analysis. As argued by Chande (1997),
parameter values from a trading system must be robust so that it can be employed across
diverse times and markets. In view of the above, we apply the threshold of 25 for the
fundamental neural network to emit trading signals.
Based on the data obtained from the performance evaluation, Figure 4.2 shows how we
code the first major component of a trading system (buy/sell rule). More specifically,
the fundamental neural network emits a buy (tomorrow) signal when FA-NN (today) >
25 and FA-NN (today) > FA-NN (yesterday), and generates a sell (tomorrow) signal
when FA-NN (today) ≤ 25 and FA-NN (today) < FA-NN (yesterday).
Figure 4.2 Pseudo Code for the FA-NN Trading Rule
1 IF FA-NNt > 25 2 AND FA-NNt > FA-NNt-1 THEN 3 BUY at OPENt+1, 4 IF FA-NN t ≤ 25 5 AND FA-NN t < FA-NN t-1 THEN 6 SELL at OPENt+1
The figure demonstrates the pseudo code for signalling buy (sell) signals for the neurally enhanced fundamental trading rule. The actual code is based on the C# programming language. The signals are emitted after the market closes at day t, while buy (sell) trades are only executed on the next day (t+1) based on the prevailing market open price (OPEN). This produces a valid trading rule, simulates a realistic trading environment and mitigates any possibility of look-ahead bias.
Overall, based on the in-sample results (Table 4.4), we can conclude that fundamental
neural network looks promising in forecasting future returns. In exploring its trading
performance, we include the FA-NN buy/sell rule above (see Figure 4.2) within a full-
fledged trading system. As discussed in Chapter 3, this comprises dynamic anti-
Martingale position sizing (second major function) and risk management (third major
factor) using 50% stop loss threshold. To provide valid empirical results, we examine
the performance of our neurally enhanced fundamental trading system (FA-NNTS)
against the primary B&H benchmark using out-of-sample analysis.

102
4.2.2 Empirical Results
Table 4.5 details the performance of the FA-NNTS against the B&H approach in the
Bursa Malaysia during the out-of-sample period, spanning 1 July 2008 to 30 June 2011
(for a total of three years). An investment budget of RM100,000.00 is placed at the
initial period, with a one way transaction cost rate of 0.83% (1.66% round-trip). Realistic
round lot and long-only trading constraints are also imposed.
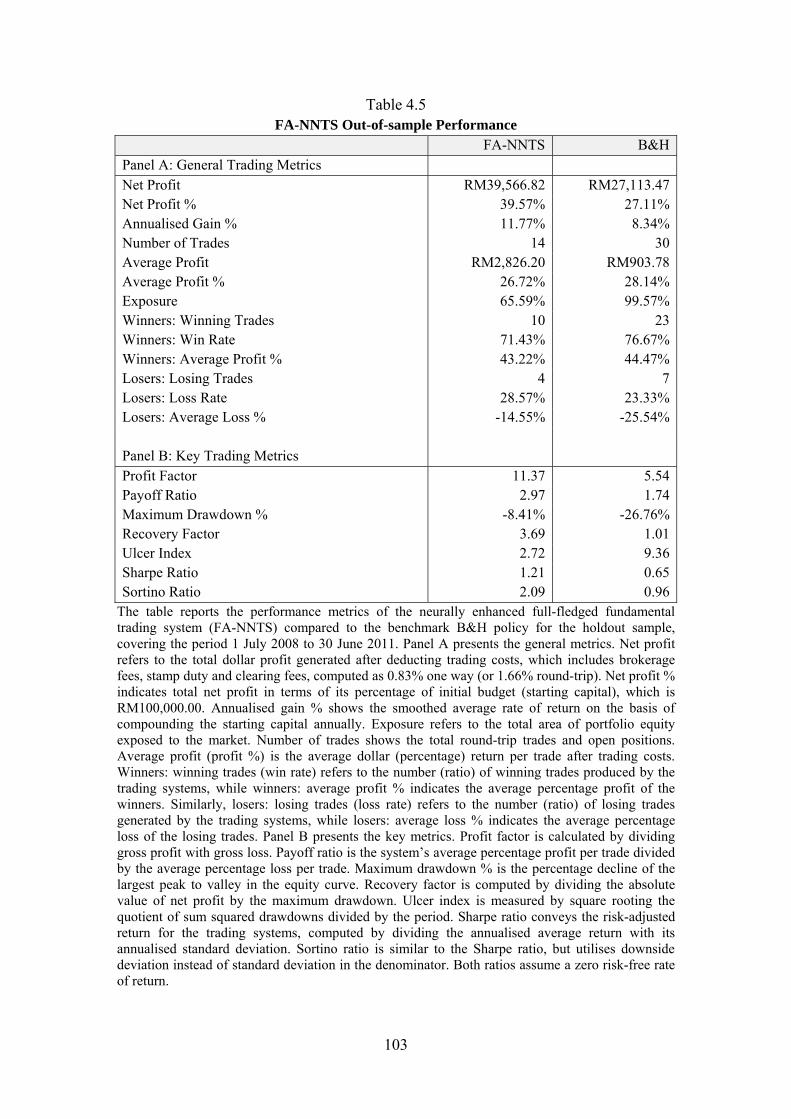
103
Table 4.5 FA-NNTS Out-of-sample Performance
FA-NNTS B&HPanel A: General Trading Metrics Net Profit RM39,566.82 RM27,113.47Net Profit % 39.57% 27.11%Annualised Gain % 11.77% 8.34%Number of Trades 14 30Average Profit RM2,826.20 RM903.78Average Profit % 26.72% 28.14%Exposure 65.59% 99.57%Winners: Winning Trades 10 23Winners: Win Rate 71.43% 76.67%Winners: Average Profit % 43.22% 44.47%Losers: Losing Trades 4 7Losers: Loss Rate 28.57% 23.33%Losers: Average Loss % -14.55% -25.54% Panel B: Key Trading Metrics Profit Factor 11.37 5.54Payoff Ratio 2.97 1.74Maximum Drawdown % -8.41% -26.76%Recovery Factor 3.69 1.01Ulcer Index 2.72 9.36Sharpe Ratio 1.21 0.65Sortino Ratio 2.09 0.96
The table reports the performance metrics of the neurally enhanced full-fledged fundamental trading system (FA-NNTS) compared to the benchmark B&H policy for the holdout sample, covering the period 1 July 2008 to 30 June 2011. Panel A presents the general metrics. Net profit refers to the total dollar profit generated after deducting trading costs, which includes brokerage fees, stamp duty and clearing fees, computed as 0.83% one way (or 1.66% round-trip). Net profit % indicates total net profit in terms of its percentage of initial budget (starting capital), which is RM100,000.00. Annualised gain % shows the smoothed average rate of return on the basis of compounding the starting capital annually. Exposure refers to the total area of portfolio equity exposed to the market. Number of trades shows the total round-trip trades and open positions. Average profit (profit %) is the average dollar (percentage) return per trade after trading costs. Winners: winning trades (win rate) refers to the number (ratio) of winning trades produced by the trading systems, while winners: average profit % indicates the average percentage profit of the winners. Similarly, losers: losing trades (loss rate) refers to the number (ratio) of losing trades generated by the trading systems, while losers: average loss % indicates the average percentage loss of the losing trades. Panel B presents the key metrics. Profit factor is calculated by dividing gross profit with gross loss. Payoff ratio is the system’s average percentage profit per trade divided by the average percentage loss per trade. Maximum drawdown % is the percentage decline of the largest peak to valley in the equity curve. Recovery factor is computed by dividing the absolute value of net profit by the maximum drawdown. Ulcer index is measured by square rooting the quotient of sum squared drawdowns divided by the period. Sharpe ratio conveys the risk-adjusted return for the trading systems, computed by dividing the annualised average return with its annualised standard deviation. Sortino ratio is similar to the Sharpe ratio, but utilises downside deviation instead of standard deviation in the denominator. Both ratios assume a zero risk-free rate of return.

104
All in all, the above results show that fundamental trading system provides excellent
trading performance and is superior to the B&H approach. Moreover, statistical analysis
also confirms that the performance of FA-NNTS is statistically significant. We describe
the analysis (statistical and trading metrics) below.
4.2.2.1 Statistical Analysis
To identify whether it is applicable to use parametric statistical tests, we first need to
confirm if the return is normally distributed, and if there are more (fewer) streaks of
wins and losses compared to what is expected from a random sequence. Because the
number of trades produced by the FA-NNTS is less than 20 (see Table 4.5), the central
limit theorem cannot be invoked to assume normality of the trading returns. To
investigate if there is significant departure from the Gaussian distribution, we perform
the Shapiro-Wilk test for normality (Shapiro & Wilk 1965; Shapiro, Wilk & Chen
1968). Table 4.6 reports the result.
Table 4.6 FA-NNTS Test for Normality
FA-NNTS Shapiro-Wilk W Statistic 0.892 Degrees of Freedom (df) 14 p value 0.086
The table reports the Shapiro-Wilk test for normality. It tests the null hypothesis that the sample comes from a normal distribution. The value of W lies between zero and one. Normality is rejected on smaller values of W. The value of one indicates the data is normally distributed.
The result from the Shapiro-Wilk statistic of 0.892 with p = 0.086 (p > 0.05) says that
there is insufficient evidence to reject the null hypothesis of normality for the FA-NNTS
returns distribution. Since the normality assumption is accepted, we now need to see if
the streaks are sufficiently random. In examining the presence of significant serial
dependence among the FA-NNTS trades, we use the Z score of runs test (Vince 1992).
Table 4.7 exhibits the results for this test on the fundamental trading system.

105
Table 4.7 FA-NNTS Test for Serial Independence
FA-NNTS Total Cases 14 Number of Runs 6 Z Score -0.149
The table reports the runs test analysis. Total cases indicates the total number of trades generated by the trading system. Number of runs shows the total number of runs in the sequence. Z score shows how many standard deviations the sequence of wins and losses produced by the trading system are away from the mean.
From the table above, we can see that the runs test produces a Z score of -0.149
(absolute value [ABS] = 0.149). Because the value of Z score is less than 2 (or 95.45%
confidence level), the assumption of serial dependence among the FA-NNTS trades
cannot be accepted. In brief, we can safely conclude that the streaks (of wins and losses)
are not significantly different to the random distribution. Note that the negative Z score
implies positive dependency. In other words, there are fewer streaks than the ones
implied by the normal probability function, in which gains lead to gains while losses
lead to losses (Vince 1992). Accordingly, the results from both tests of normality and
serial independence above allow us to utilise parametric statistical tests. In the table that
follows, we show the results for the one sample and independent samples t-tests.

106
Table 4.8 FA-NNTS Statistical Results
Panel A: One Sample t-test
Test Value = 0
Sample Mean t-statisticDegrees of
Freedom (df) p value
(1-tailed)
FA-NNTS 2826.202 2.814 13 0.0073
Panel B: Independent Samples t-test
Levene's Test t-test for Equality of Means
F-statistic p value t-statisticDegrees of
Freedom (df) p value
(1-tailed)
Equal Variances Assumed 28.797 0.000 2.459 42 0.0091
Equal Variances Not Assumed 1.851 14.855 0.0421 The table reports the statistical results for the hypotheses testing. Panel A presents the results from the one sample t-test (one tailed). The test is used to examine whether the mean profit from FA-NNTS is significantly greater than zero (µFA-NNTS > 0). Panel B shows the results from the independent samples t-test. This panel provides three inferential tests. The Levene’s test is used to test the homogeneity of variances assumption. There are two types of independent samples t-tests: the equal variances assumed shows the equal variance t-test; the equal variances not assumed refers to the unequal variance (also known as Welch) t-test. These independent sample t-tests (one tailed) are used to examine if the mean return from FA-NNTS is significantly greater than the one produced by the B&H (µFA-NNTS > µB&H). The sample means for the trading systems are the average profits (after deducting trading costs).
The sample mean from FA-NNTS is 2826.202. We test the mean profit of FA-NNTS
against the mean of zero, which is the standard null hypothesis that says no excess
return can be generated by the trading strategy. Panel A (see Table 4.8) shows that the
mean return from the FA-NNTS is significantly greater than zero, specifically t(13) =
2.814, p = 0.0073 (p < 0.01) (one tailed). In view of this, we can reject the null
hypothesis (H0a) that the mean return from FA-NNTS equals zero, and conclude that
trading using FA-NNTS can provide significant positive profit (at 1% level of
significance), accepting the alternative hypothesis (H3a).
In comparing the trading performance of FA-NNTS against the B&H, the results
presented in Table 4.5 earlier clearly show the superiority of our fundamental trading
system over the B&H policy. Table 4.8 (Panel B) confirms the statistical significance of
this finding. The Levene’s test shows that the distributions of FA-NNTS and B&H
trading returns do not have the same variance, with F = 28.797, p = 0.000 (p < 0.05).
The Welch t-test, which makes no assumption of equal variances, confirms that FA-

107
NNTS is significantly superior to the B&H, with t’ = 1.851, df = 14.855, p = 0.0421 (p
< 0.05) (one tailed). This allows us to accept H3b at 95% confidence level.
4.2.2.2 Trading Metrics
As reported in Table 4.5, the metrics generally display the superiority of our
fundamental trading system over the approach of always investing in the portfolio
(B&H). The results in Panel A describe the general metrics. As can be seen, FA-NNTS
yields greater net return, which is by RM12,453.35 over the B&H, and also healthier
CAGR as demonstrated by its higher annualised gain (by 3.43%). The fundamental
approach produces lower transactions with 14 compared to a total of 30 trades by the
B&H. Barber and Odean (2000) argue that too many trades lead to inferior performance
due to the frequency and cost of trading. In particular, they find that a large number of
buys and sells are attributed to the behavioural aspect of overconfidence on the value of
information possessed by traders. Detailed discussion of investment behaviour goes
outside the scope of this thesis. Nonetheless, their study lends support to the notion that
a small number of trades may (to a certain extent) be desirable from the practical stance,
although too little trades may also impede the development of a viable trading system
(Vanstone & Hahn 2010).
Turning to the average dollar profit, with a difference of RM1,922.42, the metric
yielded by FA-NNTS is more than triple those from the B&H, although the average
percentage return slightly favours the latter by 1.42%. In terms of exposure, with the
metric of only 65.59%, FA-NNTS incurs only about two-thirds of the portfolio equity
that is exposed to systematic risk compared to the B&H (99.57%). To put it differently,
the fundamental strategy is less vulnerable to market risk, such as natural disaster
(tsunami, earthquake, etc.), terrorism and financial crisis, which afflicts the whole
economy. Note that by definition, exposure from the B&H is always 100% as the
strategy places all funds in all the stocks in the portfolio at the initial period and they are
held until the end of the period. However, since we include realistic round lot constraint,
it is highly unlikely to exhaust 100% of cash in the stocks, which may explain the
remaining 0.43% unexposed from the B&H policy.

108
Interestingly, the B&H possesses a greater percentage of winning trades with 76.67%
(23 out of 30 trades) as opposed to FA-NNTS with 71.43% (10 out of 14 trades), and
slightly higher percentage average return (by only 1.25%) when the trade is winning.
Although FA-NNTS incurs higher number of losing trades, when a trade is losing, the
FA-NNTS has a much lower percentage average loss of -14.55% against -25.54%
induced by the B&H. In other words, FA-NNTS losses are more frequent, but the
percentage of loss is smaller than the passive benchmark. From the perspective of
drawdown (which will be discussed later), it appears FA-NNTS is preferable. In this
context, Vanstone (2006) argues that it is better to lose less, more often, particularly
because drawdowns can be severely affected by large, infrequent losses.
More importantly, we report the key metrics in Panel B (see Table 4.5), which present
the bottom line of trading system performance measures. It can be observed that FA-
NNTS has a higher profit factor (11.37) and payoff ratio (2.97) as opposed to the B&H
(5.54 and 1.74, respectively). Both strategies yield profit factors above two and thus
comply with the benchmark as designated by Vanstone and Finnie (2009). In relative
terms, however, the factor yielded by FA-NNTS is more than double that produced by
the B&H. This means that the fundamental trading system performs better since it is
much more profitable than the B&H. Turning to the next metric, the payoff ratio must
be more than two for a system to be beneficial (Vanstone & Finnie 2009). Comparing
the two trading systems, it is evident that only FA-NNTS exceeds this value. Again, the
neurally enhanced fundamental strategy is superior as it is more effective than the B&H
in acquiring returns relative to losses.
Figure 4.3 illustrates the drawdown curve of FA-NNTS, which exhibits the magnitude
and periods of the longest and deepest drawdown. Of particular interest, the curve also
points on the maximum percentage drawdown, which falls at 25 May 2010. With
respect to this metric, the FA-NNTS outperforms the B&H due to the fact that it has a
smaller maximum drawdown % (-8.41%) compared to the latter (-26.76%). More
specifically, as measured by the greatest peak to valley percentage decline, the
fundamental strategy has a much smaller loss in the portfolio value, which is less than a
third of the B&H, during the period.

109
Figure 4.3 FA-NNTS Drawdown Curve (Underwater Equity Curve)
The figure illustrates the percentage decline of peak to valley in FA-NNTS equity curve for the period 1 July 2008 to 30 June 2011, presented on a daily basis. It shows the period and magnitude of the drawdown. The curve is measured on a walk-forward basis. Specifically, the percentage of drawdown at a point is determined from the maximum equity obtained until that specific time.
In association with the maximum drawdown, we also observe that the recovery factor
metric is higher for the FA-NNTS (3.69) than the value from the B&H (1.01). While
both strategies satisfy the condition (both factors are more than one) as advocated by
Vanstone and Finnie (2009), only FA-NNTS has a factor above two, which adheres to a
stricter minimum proposed by Chande (1997). From this metric, we can say that FA-
NNTS outperforms B&H since it is much more effective in overcoming the effects of
drawdown. In a similar vein, FA-NNTS has lower ulcer index (2.72) compared to the
B&H (9.36). This shows that FA-NNTS has lower volatility (in terms of daily
drawdowns) and therefore the system is preferable for real-world trading.
Ultimately, the chief metrics for comparing any trading strategies are based upon their
risk-return tradeoffs. This is indicated by their return to variability, specifically, the
value of the Sharpe (1966, 1994) and Sortino (Sortino & Satchell 2001) ratios. As might
be expected, FA-NNTS dominates with its higher Sharpe measure (1.21), which is more
than one for a trading strategy to be deemed as acceptable, and nearly twice the value
yielded by the B&H (0.65). In other words, our fundamental system provides greater
return to variability. In contrast, the B&H appears to be a relatively risky strategy, as
reflected by the fact that it requires a higher risk to generate a unit of return. As far as
the deviation of negative returns is concerned, FA-NNTS further outperforms B&H,
with the Sortino ratio of 2.09 against 0.96 produced by the passive benchmark. Our
results convey one important message. That is, the superiority of our fundamental
trading system is not attributed to higher risk. This is crucial when making theoretical
inferences, and will be discussed further in Chapter 6.

110
Taken as a whole, it is evident that our neurally enhanced fundamental trading system
clearly outperforms the passive B&H approach. For information purposes only, we
provide graphical presentations of the FA-NNTS return distributions for daily, weekly
and monthly periods, from the beginning of the out-of-sample period in 1 July 2008
until the end on 30 June 2011. Return distributions can provide extra information on
how one can anticipate the system to perform and for establishing confidence intervals
on the returns corresponding to the time frames used (Vanstone 2006).79 See Appendix I
for these diagrams.
4.3 Corporate Governance Analysis
Having analysed traditional fundamental (financial statement) analysis, we now turn our
attention to explore the performance of the new fundamental strategy. Based on
fundamental (and corporate governance) theory, our neurally enhanced governance
trading system (CG-NNTS) uses corporate governance information as inputs to the
ANN to forecast future yearly stock returns. First, we examine the in-sample
development phase of CG-NNTS. Thereafter, we inspect its out-of-sample performance
against the B&H approach.
4.3.1 Model Design
4.3.1.1 Training Data
As discussed in the previous chapter, we employ five corporate governance variables,
namely DUAL, BSIZE, INST, GOVN and BIGN, for training the corporate governance
neural network (CG-NN). These variables represent board structure, ownership structure
and accounting (or disclosure) quality of the firms. Table 4.9 gives the descriptive
statistics of the corporate governance variables.
79 In addition, Vanstone (2006) argues that this information may also allow traders to determine whether the model is performing as expected or requires retraining.
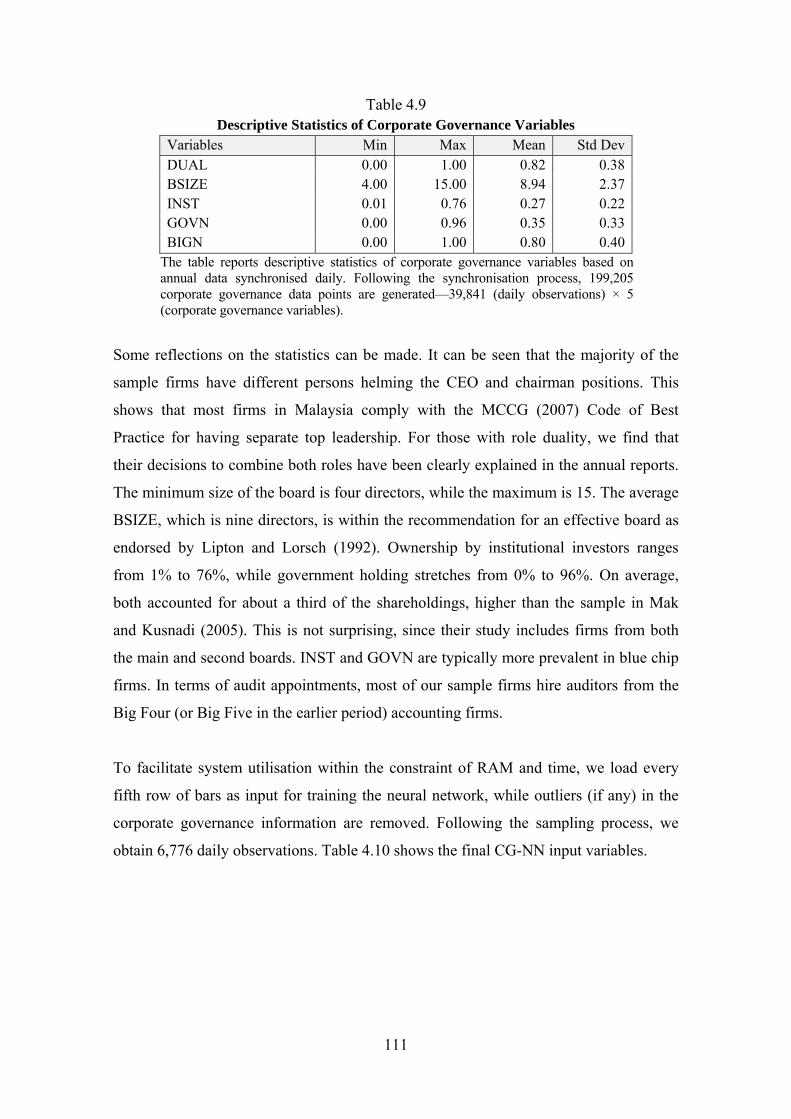
111
Table 4.9 Descriptive Statistics of Corporate Governance Variables
Variables Min Max Mean Std Dev DUAL 0.00 1.00 0.82 0.38 BSIZE 4.00 15.00 8.94 2.37 INST 0.01 0.76 0.27 0.22 GOVN 0.00 0.96 0.35 0.33 BIGN 0.00 1.00 0.80 0.40
The table reports descriptive statistics of corporate governance variables based on annual data synchronised daily. Following the synchronisation process, 199,205 corporate governance data points are generated—39,841 (daily observations) × 5 (corporate governance variables).
Some reflections on the statistics can be made. It can be seen that the majority of the
sample firms have different persons helming the CEO and chairman positions. This
shows that most firms in Malaysia comply with the MCCG (2007) Code of Best
Practice for having separate top leadership. For those with role duality, we find that
their decisions to combine both roles have been clearly explained in the annual reports.
The minimum size of the board is four directors, while the maximum is 15. The average
BSIZE, which is nine directors, is within the recommendation for an effective board as
endorsed by Lipton and Lorsch (1992). Ownership by institutional investors ranges
from 1% to 76%, while government holding stretches from 0% to 96%. On average,
both accounted for about a third of the shareholdings, higher than the sample in Mak
and Kusnadi (2005). This is not surprising, since their study includes firms from both
the main and second boards. INST and GOVN are typically more prevalent in blue chip
firms. In terms of audit appointments, most of our sample firms hire auditors from the
Big Four (or Big Five in the earlier period) accounting firms.
To facilitate system utilisation within the constraint of RAM and time, we load every
fifth row of bars as input for training the neural network, while outliers (if any) in the
corporate governance information are removed. Following the sampling process, we
obtain 6,776 daily observations. Table 4.10 shows the final CG-NN input variables.

112
Table 4.10 Descriptive Statistics of CG-NN Input Variables
Variables Min Max Mean Std Dev DUAL 0.00 1.00 0.82 0.38 BSIZE 4.00 15.00 9.01 2.37 INST 0.01 0.76 0.27 0.22 GOVN 0.00 0.96 0.35 0.33 BIGN 0.00 1.00 0.80 0.40
The table reports descriptive statistics of the corporate governance variables being included for neural network training. After sampling out bars and removing outliers, there is a total of 33,880 corporate governance data points—6,776 (daily observations) × 5 (corporate governance variables).
Like financial statement analysis, the purpose of corporate governance trading strategy
is long-term investment. For this reason, we utilise the CG-NN inputs (governance
indicators) above to forecast annual (200-day forward) stock returns (CG-NN output).
Table 4.11 reports the target output characteristics for the ANN training set.
Table 4.11 Descriptive Statistics of CG-NN Target Variable
Variables Min Max Mean Std Dev Output -70.89 260.38 17.04 32.03
The table shows the target variable, which is the percentage return 200 days in the future. The statistics are based on the sampled data (sampling of every fifth bar), which matches the CG-NN input (i.e., 6,776 daily observations).
As can be seen from the table above, the percentage annual returns ranges from a
minimum of -70.89% to a maximum of 260.38%, while the mean annual return is 17.04%
with a standard deviation of 32.03%. By default, since both (traditional) fundamental and
corporate governance analysis attempt to predict 200-day look-ahead returns, they
produce almost identical statistics. Any distinction may be attributed to the differences in
the sample set caused by the sampling of the data rows and the removal of outliers.
4.3.1.2 Training Process
Using five governance variables as inputs and future annual returns as output, the
topology of CG-NN is given as 5:11:1. To be precise, the network consists of five input
nodes (corporate governance indicators), 11 hidden nodes (measured as 2N+1 hidden
nodes, where N = 5 input nodes) and one output node (200-day forward returns). The
network is trained until there is no new MSE low rate for 2,000 epochs. The error chart

113
(see Figure 4.4) shows how the MSE declines as the training progresses, with a sharp
fall until about 5,000 epochs, and later flattens out when there is a small improvement to
the networks. As a result, the CG-NN continues to run for a total of 30,538 epochs, after
which the training stops.
Figure 4.4 CG-NN Training Error
The figure presents the training error for the ANN using the sampled data (after sampling every fifth bar and removing outliers) for the period 1 July 2002 to 30 June 2008 on each epoch. The error term denotes the average of the sum of the squared differences between the CG-NN output and the target output (MSE) and multiplied by 1,000.
It can be seen from the figure above that the final MSE obtained from the CG-NN to
forecast annual returns is smaller than 0.0028. Using the trained network, we evaluate
its performance on the in-sample period to identify the specific entry/exit threshold for
the neurally enhanced corporate governance trading rules.
4.3.1.3 Trading Rules
Table 4.12 shows the CG-NN performance evaluation results for the entire in-sample
data (1 July 2002 to 30 June 2008).

114
Table 4.12 CG-NN Performance Evaluation
CG-NN Indicator
Predicted Output
Observations Actual Output
Percentage of Average (%)
Performance Bar
10-15 -21.79 48 -35.02 -305.57 15-20 -10.51 884 -6.76 -139.70 20-25 5.98 2,967 8.37 -50.86 25-30 18.05 1,773 20.19 18.51 30-35 35.10 497 40.03 135.02 35-40 51.92 443 53.35 213.19 40-45 67.94 148 77.73 356.33 45-50 83.45 97 90.72 432.62
The table shows the performance evaluation of the CG-NN using the entire in-sample period (1 July 2002 to 30 June 2008) data. CG-NN indicator presents the values generated by the ANN. When the CG-NN produces a low (high) value, it is forecasting that the output will be near the low (high) end of the output range. Predicted output shows the forecasted output value. Observations report the number of individual observations (more specifically, bars) of data within the CG-NN indicator range. We remove any outliers (any row with the observation of less than 1% of the total observations) from the analysis. Outliers (if any) provided in the table are for illustration purposes only. Actual output reports the average actual output. Percentage of average (%) displays the magnitude of the average output for that particular row compared to the average output for all observations. Performance bar provides a graphical presentation of the percentage of average (%). Note that the bar is not to scale and is provided for illustration purposes only.
The data in Table 4.12 demonstrates that the optimal point that separates the negative
with positive percentage of average output is located when CG-NN = 25. That is, when
CG-NN > 25, the actual output is higher than the average output for all observations.
Conversely, it is apparent that when CG-NN < 25, the actual output is lower than the
mean output for the entire observation. The performance bar gives the graphical
illustration of this incidence. The value of 25 is also located within the range of the most
number of observations (with 2,967 and 1,773 observations for the ranges of 20-25 and
25-30, respectively) for making valid analysis. Accordingly, we use this value as the
demarcation point between entering and exiting a trade for programming the ANN-
based governance trading rules.
Based on the CG-NN performance appraisal above, Figure 4.5 displays how we
program the neural network indicator to generate trading signals. We code a buy
(tomorrow) signal when CG-NN (today) > 25 and CG-NN (today) > CG-NN
(yesterday), while the sell (tomorrow) signal is generated when CG-NN (today) ≤ 25
and CG-NN (today) < CG-NN (yesterday).

115
Figure 4.5 Pseudo Code for the CG-NN Trading Rule
1 IF CG-NNt > 25 2 AND CG-NNt > CG-NNt-1 THEN 3 BUY at OPENt+1, 4 IF CG-NN t ≤ 25 5 AND CG-NN t < CG-NN t-1 THEN 6 SELL at OPENt+1
The figure demonstrates the pseudo code for signalling buy (sell) signals for the neurally enhanced corporate governance trading rule. The actual code is based on the C# programming language. The signals are emitted after the market closes at day t, while buy (sell) trades are only executed on the next day (t+1) based on the prevailing market open price (OPEN). This produces a valid trading rule, simulates a realistic trading environment and mitigates any possibility of look-ahead bias.
In summary, our in-sample results (see Table 4.12) suggest that a neural network trained
with governance data is capable of predicting future (annual) stock returns. To proceed
with analysing its trading performance, we include the CG-NN trading rule above
within the context of a full-fledged trading system. As outlined, this comprises dynamic
anti-Martingale money management strategy and risk control of 50% stop loss level. In
order to provide valid empirical results, we investigate the trading performance of the
neurally enhanced corporate governance trading system (CG-NNTS) against the B&H
within a valid trading environment using the previously unseen, holdout sample data.
4.3.2 Empirical Results
In the table that follows, we provide the performance of the CG-NNTS against the B&H
strategy using a three-year (1 July 2008 to 30 June 2011) out-of-sample period. An
initial budget of RM100,000.00 is placed at the initial period, with all trades subject to a
one way (round-trip) transaction cost rate of 0.83% (1.66%), realistic round lot and
short selling restrictions.

116
Table 4.13 CG-NNTS Out-of-sample Performance
CG-NNTS B&HPanel A: General Trading Metrics Net Profit RM51,647.03 RM27,113.47Net Profit % 51.65% 27.11%Annualised Gain % 14.91% 8.34%Number of Trades 11 30Average Profit RM4,695.18 RM903.78Average Profit % 42.48% 28.14%Exposure 65.03% 99.57%Winners: Winning Trades 10 23Winners: Win Rate 90.91% 76.67%Winners: Average Profit % 47.32% 44.47%Losers: Losing Trades 1 7Losers: Loss Rate 9.09% 23.33%Losers: Average Loss % -5.88% -25.54% Panel B: Key Trading Metrics Profit Factor 34.35 5.54Payoff Ratio 8.05 1.74Maximum Drawdown % -11.66% -26.76%Recovery Factor 2.76 1.01Ulcer Index 3.92 9.36Sharpe Ratio 1.27 0.65Sortino Ratio 2.44 0.96
The table reports the performance metrics of the neurally enhanced full-fledged corporate governance trading system (CG-NNTS) compared to the benchmark B&H policy for the holdout sample, covering the period 1 July 2008 to 30 June 2011. Panel A presents the general metrics. Net profit refers to the total dollar profit generated after deducting trading costs, which includes brokerage fees, stamp duty and clearing fees, computed as 0.83% one way (or 1.66% round-trip). Net profit % indicates total net profit in terms of its percentage of initial budget (starting capital), which is RM100,000.00. Annualised gain % shows the smoothed average rate of return on the basis of compounding the starting capital annually. Exposure refers to the total area of portfolio equity exposed to the market. Number of trades shows the total round-trip trades and open positions. Average profit (profit %) is the average dollar (percentage) return per trade after trading costs. Winners: winning trades (win rate) refers to the number (ratio) of winning trades produced by the trading systems, while winners: average profit % indicates the average percentage profit of the winners. Similarly, losers: losing trades (loss rate) refers to the number (ratio) of losing trades generated by the trading systems, while losers: average loss % indicates the average percentage loss of the losing trades. Panel B presents the key metrics. Profit factor is calculated by dividing gross profit with gross loss. Payoff ratio is the system’s average percentage profit per trade divided by the average percentage loss per trade. Maximum drawdown % is the percentage decline of the largest peak to valley in the equity curve. Recovery factor is computed by dividing the absolute value of net profit by the maximum drawdown. Ulcer index is measured by square rooting the quotient of sum squared drawdowns divided by the period. Sharpe ratio conveys the risk-adjusted return for the trading systems, computed by dividing the annualised average return with its annualised standard deviation. Sortino ratio is similar to the Sharpe ratio, but utilises downside deviation instead of standard deviation in the denominator. Both ratios assume a zero risk-free rate of return.

117
Evidently, the above table shows that the corporate governance trading system yields
excellent results and is a better performer compared to the B&H rule. Next we proceed
with presenting the results of the related statistical tests, which confirm that our findings
are statistically significant. This is followed by the summary of trading metrics.
4.3.2.1 Statistical Analysis
To determine the appropriate tests of statistical significance, we first need to verify if
the returns distribution of CG-NNTS sufficiently follows the Gaussian distribution, and
if there is any presence of serial dependency (in other words, if the data is not
sufficiently random). Since the number of trades generated by CG-NNTS (see Table
4.13) does not exceed 20 for implementing the central limit theorem, we proceed by
testing for normality using the Shapiro-Wilk test. The results from this test are
displayed in Table 4.14.
Table 4.14 CG-NNTS Test for Normality
CG-NNTS Shapiro-Wilk W Statistic 0.875 Degrees of Freedom (df) 11 p value 0.090
The table reports the Shapiro-Wilk test for normality. It tests the null hypothesis that the sample comes from a normal distribution. The value of W lies between zero and one. Normality is rejected on smaller values of W. The value of one indicates the data is normally distributed.
Based on the typical alpha value of 0.05 for testing normality, the Shapiro-Wilk statistic
of 0.875 with p = 0.090 (p > 0.05) above indicates there is insufficient evidence to reject
the null hypothesis of Gaussian distribution for the CG-NNTS returns. Having passed
the assumption of normality, we perform the Z score of runs test to examine the
applicability of employing parametric statistical test. Table 4.15 shows the results.

118
Table 4.15 CG-NNTS Test for Serial Independence
CG-NNTS Total Cases 11 Number of Runs 3 Z Score 1.768
The table reports the runs test analysis. Total cases indicates the total number of trades generated by the trading system. Number of runs shows the total number of runs in the sequence. Z score shows how many standard deviations the sequence of wins and losses produced by the trading system are away from the mean.
As can be seen from the table above, the Z score of CG-NNTS is 1.768, which is less
than the threshold value of two. From this value, we cannot conclude that there is serial
dependence among the CG-NNTS trades and thus argue that the trades are sufficiently
random. The findings from both tests above validate the use of parametric tests. Table
4.16 gives the results for the one sample and independent samples t-tests.
Table 4.16 CG-NNTS Statistical Results
Panel A: One Sample t-test
Test Value = 0
Sample Mean t-statisticDegrees of
Freedom (df) p value
(1-tailed)
CG-NNTS 4695.185 2.649 10 0.0122
Panel B: Independent Samples t-test
Levene's Test t-test for Equality of Means
F-statistic p value t-statisticDegrees of
Freedom (df) p value
(1-tailed)
Equal Variances Assumed 29.738 0.000 3.329 39 0.0010
Equal Variances Not Assumed 2.115 10.454 0.0297 The table reports the statistical results for the hypotheses testing. Panel A presents the results from the one sample t-test (one tailed). The test is used to examine whether the mean profit from CG-NNTS is significantly greater than zero (µCG-NNTS > 0). Panel B shows the results from the independent samples t-test. This panel provides three inferential tests. The Levene’s test is used to test the homogeneity of variances assumption. There are two types of independent samples t-tests: the equal variances assumed shows the equal variance t-test; the equal variances not assumed refers to the unequal variance (also known as Welch) t-test. These independent sample t-tests (one tailed) are used to examine if the mean return from CG-NNTS is significantly greater than the one produced by the B&H (µCG-NNTS > µB&H). The sample means for the trading systems are the average profits (after deducting trading costs).

119
Table 4.16 (Panel A) shows that, with the sample mean of 4695.185, the t-statistic
indicates that the mean return produced by CG-NNTS is significantly greater than zero,
specifically t(10) = 2.649, p = 0.0122 (p < 0.05) (one tailed). Therefore, there is
sufficient evidence to accept the research hypothesis (H4a) that trading guided by the
CG-NNTS can produce statistically significant return (at 95% confidence level).
The results presented in Table 4.13 earlier clearly show the dominance of our corporate
governance strategy over the B&H, in terms of the trading metrics. Table 4.16 (Panel B)
confirms that the difference in mean returns is statistically significant. As can be seen,
the assumption of homogeneity of variances is violated, where the Levene’s test shows
that F = 29.738, p = 0.000 (p < 0.05). Since the variances for CG-NNTS and B&H are
not equal, the result is reported using the Welch t-test. The result verifies that FA-NNTS
is indeed significantly superior to the B&H, with t’ = 2.115, df = 10.454, p = 0.0297 (p
< 0.05) (one tailed). This allows us to accept the alternative hypothesis, H4b, at 95%
confidence level.
4.3.2.2 Trading Metrics
As with our neurally enhanced trading system trained with financial statement data, we
find that our corporate governance strategy is superior to the B&H approach. The results
in Table 4.13 (Panel A) show that the corporate governance trading system produces
greater net profit with RM51,647.03, which is almost twice the return produced by the
B&H strategy with RM27,113.47, and yields higher annualised gain (14.91%)
compared to the B&H (8.34%). The governance trading system also has lower exposure
(65.03%), higher win rate (90.91%) and average profit (47.32%) when the trade is
winning, and lower average loss (-5.88%) when the trade is losing, compared to the
B&H (99.57%, 76.67%, 44.47% and -25.54%, respectively).
The more crucial aspects of performance measures as reported in Panel B (Table 4.13)
further confirm the outperformance of CG-NNTS. Briefly stated, it has a greater profit
factor (34.35), payoff ratio (8.05) and recovery factor (2.76), and lower maximum
percentage drawdown (-11.66%) and ulcer index (3.92), compared to the B&H
approach (with 5.54, 1.74, 1.01, -26.76% and 9.36, respectively). Figure 4.6 exhibits the

120
underwater equity curve, which pinpoints the location of CG-NNTS maximum
percentage drawdown on 11 March 2011.
Figure 4.6 CG-NNTS Drawdown Curve (Underwater Equity Curve)
The figure illustrates the percentage decline of peak to valley in the CG-NNTS equity curve for the period 1 July 2008 to 30 June 2011, presented on a daily basis. It shows the period and magnitude of the drawdown. The curve is measured on a walk-forward basis. Specifically, the percentage of drawdown at a point is determined from the maximum equity obtained until that specific time.
Results reported for the metrics on risk-return tradeoffs (see Panel B of Table 4.13)
validate the fact that CG-NNTS is indeed a superior trading strategy. More specifically,
the non-financial fundamental strategy yields greater Sharpe and Sortino ratios with 1.27
and 2.44, respectively, compared to the B&H with only 0.65 and 0.96. This indicates that
for a unit of risk, the corporate governance trading system produces better returns.
In a nutshell, based on the overall metrics as outlined above, it is apparent that our
neurally enhanced full-fledged corporate governance trading system clearly dominates
the B&H policy. For expositional purposes only, we give the graphical presentations of
the CG-NNTS return distributions for multiple periods (daily, weekly and monthly)
from 1 July 2008 to 30 June 2011 (see Appendix II).
4.4 Technical Analysis
Thus far we have examined the performance of both traditional and new fundamental
trading systems. Both results are excellent, yielding superior risk-return profiles over
the B&H benchmark. We now investigate the outcome from trading using historical
market data. Supported by technical theory, our technical trading system (TA-NNTS)
uses technical information as inputs to the neural network to predict short-term returns.
First, we explore the key phases of developing the ANN-based trading system (in-

121
sample). Later, we investigate its performance against the benchmark B&H approach
(out-of-sample).
4.4.1 Model Design
4.4.1.1 Training Data
Table 4.17 gives the descriptive statistics of the technical indicators. In training the
technical analysis neural network (TA-NN), we use six technical variables as inputs,
namely D, SMA, MACD, RSI, %B and ATR. As noted in Chapter 3, this set of indicators
covers all the main technical categories, which are market mode, trend, cycle and
volatility, as described by Pan (2003).
Table 4.17 Descriptive Statistics of Technical Variables
Variables Min Max Mean Std Dev D 0.90 1.79 1.32 0.14 SMA 0.45 51.30 6.00 7.68 MACD -1.14 1.25 0.02 0.13 RSI 0.50 99.65 51.68 19.81 %B -0.52 1.55 0.53 0.32 ATR 0.00 1.56 0.12 0.14
The table reports descriptive statistics of the technical variables based on daily data. In total, there are 228,246 technical data points generated. Since technical indicators require lead days for formulation (for example, to build a 20-day SMA will require at least the previous 20 days of data), we remove the initial 60 days from ANN training (for each firm). The value is deemed sufficient as it doubles the number of days of the largest period in the indicator (D) and exceeds three times the period used in RSI, which is the amount of time required for the indicator to stabilise. Accordingly, the total data points generated is computed as [39,841 (total daily observations) – 60 (lead days) × 30 (number of firms)] × 6 (technical variables). The values for RSI and %B are in percentages.
It can be seen from the data in Table 4.17 that the minimum (maximum) fractal
dimension of our sample is 0.90 (1.79). The mean D of 1.32 suggests that on average,
the financial time series of Malaysian stock prices follow a trend-reinforcing, Hurst
process, as argued by Mulligan (2004). Given its departure from the Brownian motion
(Gaussian distribution), we can argue that stock prices in Malaysia do not move in an
entirely random manner and therefore offer the potential for a trading strategy to yield
profits. The result is in line with an earlier study in KLCI by Yao, Tan and Poh (1999),
Evertsz and Berkner (1995) with D = 1.46 on the 30 DAX stocks, and Valdez-Cepeda

122
and Solano-Herrera (1999), which finds the value of D = 1.33 for the US (DJIA)
market. The SMA ranges from 0.45 to 51.30 with a mean of 6, while the minimum,
maximum and mean of MACD are -1.14, 1.25 and 0.02, respectively. With an average
of 51.68, the RSI ranges from 0.50 to 99.65. Finally, in relation to volatility, the
minimum, maximum and mean of %B (ATR) among the 30 Bursa Malaysia sample
firms are observed to be -0.52 (0), 1.55 (1.56) and 0.53 (0.12), respectively.80
In order to facilitate system utilisation within the RAM and time constraints, we remove
any outliers as well as program the system to load every fifth row of bars as input for
training the network. This procedure generates a total of 7,213 daily observations. The
following results (see Table 4.18) demonstrate the input variables for our technical
neural network.
Table 4.18 Descriptive Statistics of TA-NN Input Variables
Variables Min Max Mean Std Dev D 0.93 1.74 1.32 0.14 SMA 0.46 24.86 4.57 3.28 MACD -0.37 0.41 0.02 0.08 RSI 0.65 99.39 51.60 19.73 B% -0.41 1.48 0.53 0.32 ATR 0.01 0.53 0.10 0.08
The table reports descriptive statistics of the technical variables being included for neural network training. After sampling out bars and removing outliers, there is a total of 43,278 technical data points, as measured by 7,213 (daily observations, after removing lead days) × 6 (technical variables). The values for RSI and %B are in percentages.
Recall that unlike financial statement and corporate governance analysis, technical
analysis is used to forecast short-term returns. As discussed in the preceding chapter, we
train the TA-NN inputs (technical indicators) to predict the returns five days ahead (TA-
NN output). Table 4.19 gives the target output characteristics of the training set.
80 Note that many technical indicators are not (directly) comparable since they are calculated based on the absolute values of prices. Accordingly, we do not attempt to provide a detailed discussion of the descriptive results. Indeed, research in this area (for example Vanstone 2006; Vanstone & Hahn 2010; Thawornwong, Enke & Dagli 2003) does not attempt to discuss the descriptive statistics, and instead focuses on the out-of-sample results.

123
Table 4.19 Descriptive Statistics of TA-NN Target Variable
Variables Min Max Mean Std Dev Output -30.69 55.00 0.32 4.17
The table shows the target variable, which is the percentage return five days in the future. The statistics are based on the sampled data (every fifth bar), which matches the TA-NN input (i.e., 7,199 daily observations).
The table above shows the percentage of short-term returns from the training set of TA-
NN in Bursa Malaysia. It ranges from a minimum of -30.69% to a maximum of 55.00%.
On average, the five-day forward return is 0.32% with a standard deviation of 4.17%.
4.4.1.2 Training Process
Based on six technical variables as inputs and the future short-term returns as output,
the TA-NN topology is given as 6:13:1. To be exact, it consists of six input (technical
indicators) nodes, 13 hidden nodes (2N+1 hidden nodes, where N = 6 input nodes) and
one output node (five-day forward returns). Figure 4.7 shows the error chart for TA-NN
training. As can be seen, the MSE declines in a somewhat flattened fashion throughout
the training process. The training runs for a total of 24,878 epochs, after which it stops
mechanically when there is no new rate of MSE low for 2,000 epochs.
Figure 4.7 TA-NN Training Error
The figure presents the training error for the ANN using the sampled data (after sampling every fifth bar and removing outliers) for the period 1 July 2002 to 30 June 2008 on each epoch. The error term denotes the average of the sum of the squared differences between the TA-NN output and the target output (MSE) and multiplied by 1,000.
As shown in Figure 4.7 above, the final MSE obtained from training the TA-NN to
forecast short-term returns is about 0.00116. Based on this trained neural network, we

124
proceed with evaluating its performance using the entire in-sample data. This allows us to
identify the particular buy/sell threshold for the neurally enhanced technical trading rules.
4.4.1.3 Trading Rules
Table 4.20 reports the performance evaluation information for the TA-NN, based on the
whole in-sample data (1 July 2002 to 30 June 2008).
Table 4.20 TA-NN Performance Evaluation
CG-NN Indicator
Predicted Output
Observations Actual Output
Percentage of Average (%)
Performance Bar
30-35 -1.40 89 -0.55 -265.79 35-40 0.46 7134 0.33 0.25 40-45 5.02 28 0.43 28.16
The table shows the performance evaluation of the TA-NN using the entire in-sample period (1 July 2002 to 30 June 2008) data. TA-NN indicator presents the values generated by the ANN. When the TA-NN produces a low (high) value, it is forecasting that the output will be near the low (high) end of the output range. Predicted output shows the forecasted output value. Observations report the number of individual observations (more specifically, bars) of data within the TA-NN indicator range. We remove any outliers (any row with the observation of less than 1% of the total observations) from the analysis. Outliers (if any) provided in the table are for illustration purposes only. Actual output reports the average actual output. Percentage of average (%) displays the magnitude of the average output for that particular row compared to the average output for all observations. Performance bar provides a graphical presentation of the percentage of average (%). Note that the bar is not to scale and is provided for illustration purposes only.
From the table above, we can see that the optimal threshold between the negative and
positive percentage of average output is located at TA-NN = 35. More specifically,
when TA-NN > 35, the actual output is higher than the average output for all
observations. The effect is reversed when TA-NN < 35. Despite the marked differences
in observations among the clusters, this value is located within the range of most
number of observations. Accordingly, we program the TA-NN trading rules using the
signal strength of 35 as threshold for initiating a trade.
Figure 4.8 shows the pseudo code for the neurally enhanced technical buy/sell rules.
The figure indicates how the technical neural network emits the buy (tomorrow) signal
when TA-NN (today) > 35 and TA-NN (today) > TA-NN (yesterday). Conversely, the

125
sell (tomorrow) signal is generated when TA-NN (today) ≤ 35 and TA-NN (today) <
TA-NN (yesterday).
Figure 4.8 Pseudo Code for the TA-NN Trading Rule
1 IF TA-NNt > 35 2 AND TA-NNt > TA-NNt-1 THEN 3 BUY at OPENt+1, 4 IF TA-NN t ≤ 35 5 AND TA-NN t < TA-NN t-1 THEN 6 SELL at OPENt+1
The figure demonstrates the pseudo code for signalling buy (sell) signals for the neurally enhanced technical trading rule. The actual code is based on the C# programming language. The signals are emitted after the market closes at day t, while buy (sell) trades are only executed on the next day (t+1) based on the prevailing market open price (OPEN). This produces a valid trading rule, simulates a realistic trading environment and mitigates any possibility of look-ahead bias.
In summary, based on the in-sample results (see Table 4.20), we can conclude that the
technical neural network appears to be capable of predicting short-term returns. In order
to investigate its trading performance, we incorporate the TA-NN buy/sell rule (see
Figure 4.8) within a full-fledged stock market trading system. As discussed earlier, this
consists of anti-Martingale position sizing and risk management using 50% stop loss
level. Using out-of-sample analysis, we examine the performance of our neurally
enhanced technical trading system (TA-NNTS) against the benchmark B&H policy.
4.4.2 Empirical Results
Table 4.21 reports the performance of the TA-NNTS against the B&H using a three-
year (1 July 2008 to 30 June 2011) holdout sample period. As with the previous trading
simulations, an initial budget of RM100,000.00 is placed at the initial period. The trades
are also subject to a one way (round-trip) transaction cost rate of 0.83% (1.66%), as well
as realistic round lot and long-only constraints.

126
Table 4.21 TA-NNTS Out-of-sample Performance
TA-NNTS B&HPanel A: General Trading Metrics Net Profit RM72,689.06 RM27,113.47Net Profit % 72.69% 27.11%Annualised Gain % 20.01% 8.34%Number of Trades 22 30Average Profit RM3,304.05 RM903.78Average Profit % 25.14% 28.14%Exposure 92.38% 99.57%Winners: Winning Trades 15 23Winners: Win Rate 68.18% 76.67%Winners: Average Profit % 48.76% 44.47%Losers: Losing Trades 7 7Losers: Loss Rate 31.82% 23.33%Losers: Average Loss % -25.47% -25.54% Panel B: Key Trading Metrics Profit Factor 4.26 5.54Payoff Ratio 1.91 1.74Maximum Drawdown % -24.82% -26.76%Recovery Factor 2.85 1.01Ulcer Index 7.75 9.36Sharpe Ratio 1.12 0.65Sortino Ratio 2.10 0.96
The table reports the performance metrics of the neurally enhanced full-fledged technical trading system (TA-NNTS) compared to the benchmark B&H policy for the holdout sample, covering the period 1 July 2008 to 30 June 2011. Panel A presents the general metrics. Net profit refers to the total dollar profit generated after deducting trading costs, which includes brokerage fees, stamp duty and clearing fees, computed as 0.83% one way (or 1.66% round-trip). Net profit % indicates total net profit in terms of its percentage of initial budget (starting capital), which is RM100,000.00. Annualised gain % shows the smoothed average rate of return on the basis of compounding the starting capital annually. Exposure refers to the total area of portfolio equity exposed to the market. Number of trades shows the total round-trip trades and open positions. Average profit (profit %) is the average dollar (percentage) return per trade after trading costs. Winners: winning trades (win rate) refers to the number (ratio) of winning trades produced by the trading systems, while winners: average profit % indicates the average percentage profit of the winners. Similarly, losers: losing trades (loss rate) refers to the number (ratio) of losing trades generated by the trading systems, while losers: average loss % indicates the average percentage loss of the losing trades. Panel B presents the key metrics. Profit factor is calculated by dividing gross profit with gross loss. Payoff ratio is the system’s average percentage profit per trade divided by the average percentage loss per trade. Maximum drawdown % is the percentage decline of the largest peak to valley in the equity curve. Recovery factor is computed by dividing the absolute value of net profit by the maximum drawdown. Ulcer index is measured by square rooting the quotient of sum squared drawdowns divided by the period. Sharpe ratio conveys the risk-adjusted return for the trading systems, computed by dividing the annualised average return with its annualised standard deviation. Sortino ratio is similar to the Sharpe ratio, but utilises downside deviation instead of standard deviation in the denominator. Both ratios assume a zero risk-free rate of return.

127
The outperformance of technical trading system over the B&H approach is clear, as
shown by the results (Table 4.21) above. Next we present the related statistical tests,
which validate the fact that our findings are statistically significant. This is followed by
the summary of trading metrics.
4.4.2.1 Statistical Analysis
Similar to the previous trading systems, we proceed with identifying whether the
assumptions of normality and randomness can be employed to use parametric statistical
tests. TA-NNTS produces a total of 22 trades during the period (see Table 4.21). Since
the sample size (number of trades) is sufficiently large (> 20), we can safely use the
central limit theorem to assume normality of the returns distribution (De Sá 2007; Katz
& McCormick 2000; Studenmund 2001). The next step is to test for serial dependence
among the trades. Table 4.22 reports the runs test results.
Table 4.22 TA-NNTS Test for Serial Independence
TA-NNTS Total Cases 22 Number of Runs 7 Z Score -1.545
The table reports the runs test analysis. Total cases indicates the total number of trades generated by the trading system. Number of runs shows the total number of runs in the sequence. Z score shows how many standard deviations the sequence of wins and losses produced by the trading system are away from the mean.
The TA-NNTS has a Z score of -1.545 (ABS = 1.545). Since the value is less than two
(95.45% confidence level), we cannot accept dependency among the trades. In other
words, we can conclude that the data (TA-NNTS trades) are sufficiently random. Since
both assumptions of normality and serial independence are accepted, parametric statistical
tests can be used for analysing the related hypotheses of the study. Table 4.23 provides
the results for the related t-tests.

128
Table 4.23 TA-NNTS Statistical Results
Panel A: One Sample t-test
Test Value = 0
Sample Mean t-statisticDegrees of
Freedom (df) p value
(1-tailed)
TA-NNTS 3304.048 2.336 21 0.0147
Panel B: Independent Samples t-test
Levene's Test t-test for Equality of Means
F-statistic p value t-statisticDegrees of
Freedom (df) p value
(1-tailed)
Equal Variances Assumed 32.177 0.000 1.926 50 0.0299
Equal Variances Not Assumed 1.668 22.491 0.0546 The table reports the statistical results for the hypotheses testing. Panel A presents the results from the one sample t-test (one tailed). The test is used to examine whether the mean profit from TA-NNTS is significantly greater than zero (µTA-NNTS > 0). Panel B shows the results from the independent samples t-test. This panel provides three inferential tests. The Levene’s test is used to test the homogeneity of variances assumption. There are two types of independent samples t-tests: the equal variances assumed shows the equal variance t-test; the equal variances not assumed refers to the unequal variance (also known as Welch) t-test. These independent sample t-tests (one tailed) are used to examine if the mean return from TA-NNTS is significantly greater than the one produced by the B&H (µTA-NNTS > µB&H). The sample means for the trading systems are the average profits (after deducting trading costs).
From the table above, the one sample t-statistic (see Panel A) indicates that the mean
profit generated by the TA-NNTS is significantly greater than zero. More specifically,
t(21) = 2.336, p = 0.0147 (p < 0.05) (one tailed). Thus, we can reject the null hypothesis
(H0a) of zero mean and conclude that trading using the TA-NNTS can yield statistically
significant return at 95% confidence level, accepting the alternative hypothesis (H5a).
Panel B (Table 4.23) provides the statistical analysis in comparing the mean returns of
TA-NNTS with the benchmark B&H policy. The Levene’s test shows that F = 32.177, p
= 0.000 (p < 0.05), which says that the variances of the returns for both strategies are
not equal. Taking into account the heterogeneity in the variances, we report the findings
using the Welch t-test. The result confirms that TA-NNTS is significantly superior to
the B&H, with t’ = 1.668, df = 22.491, p = 0.0546 (p < 0.10) (one tailed). This allows us
to accept the alternative hypothesis, H5b, at 90% confidence level.

129
4.4.2.2 Trading Metrics
Similar to the results obtained by employing fundamental and corporate governance
trading systems, we find that our neurally enhanced technical strategy is superior to the
B&H approach. Table 4.21 (Panel A) shows that TA-NNTS generates RM72,689.06,
which is more than twice the net profit produced by the B&H (RM27,113.47). It also
yields higher annualised gain (20.01%) against the B&H (8.34%), as well as slightly
lower exposure with 92.38%. Although the technical trading system has lower win rates
(68.18%), it has higher average profit (48.76%) when the trade is winning, and slightly
lower average loss when the trade is losing (-25.47%), compared to that produced by
the B&H approach (44.47% and -25.54%, respectively).
Panel B (Table 4.21) in general validates the dominance of TA-NNTS over the B&H.
While the technical trading system has a lower profit factor (4.26) when compared to
the B&H (5.54), it has greater payoff ratio (1.91), recovery factor (2.85) and somewhat
lower maximum percentage drawdown (-24.82%) and ulcer index (7.75) against the
B&H rule (with 1.74, 1.01, -26.76% and 9.36, respectively). The maximum percentage
drawdown of TA-NNTS, which falls on 25 November 2008, can be observed in the
following underwater equity curve (see Figure 4.9).
Figure 4.9 TA-NNTS Drawdown Curve (Underwater Equity Curve)
The figure illustrates the percentage decline of peak to valley in TA-NNTS equity curve for the period 1 July 2008 to 30 June 2011, presented on a daily basis. It shows the period and magnitude of the drawdown. The curve is measured on a walk-forward basis. Specifically, the percentage of drawdown at a point is determined from the maximum equity obtained until that specific time.
Ultimately, when inferring the dominance of one trading system over another, the most
crucial performance measure is the return to variability. Based on the results (see Panel
B of Table 4.21), it is evident that TA-NNTS yields better Sharpe (Sortino) ratio with

130
1.12 (2.10) as opposed to the B&H policy with only 0.65 (0.96). For this reason, our
findings confirm that TA-NNTS generates greater risk-return tradeoffs, and it is therefore
a superior trading strategy.
In summary, by referring to the above discussed metrics, we can conclude that our
neurally enhanced technical trading system surpasses the B&H policy. For illustration
purposes only, we present the return distributions of the TA-NNTS for daily, weekly
and monthly frequencies throughout the out-of-sample period (1 July 2008 to 30 June
2011). See Appendix III for information.
4.5 Discussion of Results
In this chapter we have explored the trading performance of three separate trading
strategies, namely financial statement analysis, corporate governance analysis and
technical analysis in the Bursa Malaysia, during the period 1 July 2008 to 30 June 2011.
These full-fledged trading systems are designed to incorporate major elements of entry
and exit rules, position sizing and risk management. The rest of this section bases our
discussions on these three elements, with particular emphasis on the first factor, since it
is considered the driver (or engine) of a trading system (Pardo 2008) and thus the most
important aspect.
In regards to the first major element, this thesis employs a backpropagation neural
network to train indicators drawn from the related information in order to emit
entry/exit signals. While ANN is known to excel in pattern recognition, we wish to
emphasise that it is only as good as its inputs. For example, several studies that employ
simple past returns to train their ANNs, such as Fernández-Rodríguez, González-Martel
and Sosvilla-Rivero (2000) and Tsibouris and Zeidenberg (1995), might not seem to
provide promising results. As argued by Longo (1996), like any other model, ‘garbage
in, garbage out’ (p. 62) is also applicable to ANN. Moreover, the problem of overfitting
might also affect the network (Trippi & Turban 1996; Vanstone 2006). In other words,
it is possible for a network to memorise the patterns in the training set instead of
learning the relationship, which might lead to its poor ability to generalise.

131
Nonetheless, the empirical results presented in this chapter confirm that all three trading
systems possess the ability to yield significant profits and lower risks, beating the B&H
policy. These suggest that the accounting ratios, governance mechanisms and technical
indicators used in this thesis are relevant inputs for the ANNs in predicting future stock
returns. Our findings can generally be supported by Brock, Lakonishok and LeBaron
(1992), who argue that the use of more sophisticated indicators may offer even better
results. These are also in line with studies utilising advanced indicators, for example,
Thawornwong, Enke and Dagli (2003), Vanstone (2006) and Yao, Tan and Poh (1999).
The ability of each trading system to produce significant results in the holdout sample
period also suggests that our ANNs do not suffer from overfitting. It appears that these
networks are capable of discerning the underlying relationships between the related
inputs and outputs instead of memorising noise or random fluctuations. Note that while
the profit yielded by the B&H might also seem acceptable, it does not offer reasonable
tradeoffs of risk and return. The key trading metrics, more specifically the Sharpe and
Sortino ratios, validate the fact that all our trading systems are not riskier than the
passive strategy championed by proponents of an efficient market.
The overall benefits of fundamental, corporate governance and technical trading
strategies in this study corroborate the findings of a great deal of the previous work in
these fields. We find that traditional fundamental information about valuation, cash flow
and profitability allows the system to identify mispriced securities. The findings provide
support for Graham and Dodd’s (1934) school of thought. This is in line with Aby,
Briscoe, Elliott et al. (2001), Basu (1977), Lakonishok, Shleifer and Vishny (1994),
Oppenheimer and Schlarbaum (1981), and Piotroski (2000) in the US market. The later
study by Alexakis, Patra and Poshakwale (2010) also arrives at the same conclusion for
the Greek market. Our findings also confirm the results in Thong (2002) in the
Malaysian market. In addition, the results can be reinforced by previous literature in
ANN-based financial statement analysis, such as Olson and Mossman (2003), Eakins
and Stansell (2003), Vanstone (2006) and Vanstone and Hahn (2010). These studies
substantiate the benefits of using accounting-based fundamental strategies modelled
using ANNs.

132
Another important finding is that corporate governance information, which is still
invisible in ANN-based trading literature, is also useful in providing the ANN with
information about leadership structure, ownership structure and disclosure quality to
predict long-term stock returns. This finding corroborates the argument made by
Graham and Dodd (1934) on the importance of non-financial fundamentals, such as the
management of the firms, in order to find undervalued firms. While there is no direct
comparable research in this topic (i.e., ANN-based corporate governance trading
strategy), our results complement the findings of Gompers, Ishii and Metrick (2003) and
Bebchuk, Cohen and Ferrell (2009) in the US market, Bauer, Guenster and Otten (2004)
in Europe, and Drobetz, Schillhofer and Zimmermann (2004) in the German market,
which employ simple governance trading rules. These studies reveal that trading on the
basis of publicly available corporate governance information allows investors to yield
(abnormal) profits, since this information is not efficiently reflected in the market price.
Bauer et al. (2008) and Chen et al. (2007) similarly confirm these findings in the Asian
markets of Japan and Taiwan, respectively.
As for the use of historical market data, we find the incorporation of all technical
categories (market mode, trend, cycle and volatility) as described by Pan (2003)
provides the ANN valuable inputs to predict short-term returns in the Bursa Malaysia.
The outperformance yielded by our technical trading system over the B&H endorses the
technical theory of Keynes (Malkiel 2007). The results are consistent with a large
number of prior studies, including Brock, Lakonishok and LeBaron (1992), Chong and
Ng (2008), Dryden (1970), Metghalchi, Marcucci and Chang (2012) and Wong, Manzur
and Chew (2003). These studies show that historical market data can be used to form
profitable rules in the stock markets of Europe, Singapore, the US and the UK. In
regards to the use of ANNs, our findings are augmented by the studies of Thawornwong,
Enke and Dagli (2003), Vanstone and Hahn (2010) and Yao, Tan and Poh (1999),
which similarly find advantage in using the soft computing-based technical strategy. In
the context of the Malaysian market, the efficacy of our technical trading system is
consistent with those of Bessembinder and Chan (1995), Lai, Balachandher and Nor
(2007) and Yao, Tan and Poh (1999), who document that historical patterns in the time
series can be exploited to yield superior profits.

133
In terms of the second and third major elements (position sizing and risk management),
a closer inspection of the data (trades information) reveals that, to a certain extent, both
these strategies affect our final outcomes. By definition, these factors will have effects
on trading performance (Chande 1997; Pardo 2008). Instead of capping potential returns
by using fixed position sizing parameter, we observe that our dynamic position sizing,
anti-Martingale, allows our trading systems to boost (reduce) gain (losses) during the
winning (losing) streaks. This corroborates the argument put forth by Tharp (1998),
where he claims that it is logical and beneficial for a money management strategy to
increase the bet when the trading system is making money, and reduce it otherwise. In
this way, it avoids the danger associated with the gambler’s fallacy (Tharp 1998). The
results also confirm that our trading systems have positive mathematical expectation of
rewards (see Balsara 1992). Moreover, the benefits of an anti-Martingale strategy in this
thesis is consistent with the findings of Babcock (1989), in which he documents its
ability to substantially increase performance, with no substantial increase in risk.
As for the risk management strategy, further analysis supports the value of stop loss in
our full-fledged trading systems in cutting losses. This is in line with the argument
given by Chande (1997) and Pardo (2008). In many cases, the threshold used in this
thesis provides the prospect for the neurally enhanced individual trading systems to
recoup unrealised losses (in other words, open positions that are currently below the
purchased prices and/or give negative returns after costs). In order to illustrate this
phenomenon, Figure 4.10 exhibits the MAEs for FA-NNTS, CG-NNTS and TA-NNTS
for the out-of-sample period.

134
Figure 4.10 MAEs of Individual Trading Systems
(a) FA-NNTS
(b) CG-NNTS
(c) TA-NNTS
The figure shows the MAEs for FA-NNTS, CG-NNTS and TA-NNTS for the period 1 July 2008 to 30 June 2011. The graph presents the breakdown for all trades and winning trades produced by each trading system. It indicates the largest intraday loss for a trading system throughout its lifetime. Whereas the in-sample MAEs might be useful for finding suitable stop loss thresholds, the out-of-sample MAEs are only provided here to confirm the operation of the stop loss policy.
As seen in Figure 4.10, the use of our stop loss threshold of 50% allows our previously
losing open position to later gain profit. That is, for the most part, those trades that at first
suffer losses tend to later convert to winning trades. From one perspective, these results
may provide some support to Buffett’s (Lynch 1994) warning of the level of risk a trader
should be willing to confront. Further, the midpoint value seems practical and avoids the
danger associated with the disposition effect, as can be explained by the prospect theory.
Similarly, had a low stop loss threshold been programmed, the trades might mechanically

135
have stopped at a loss. For example, O’Neil (2009) advocates using a 7% or 8%
benchmark. If comparable figures are used, the results in Figure 4.10 suggest there might
be large numbers of rewarding trades evaded. Indeed, losses associated with a tight stop
threshold have been documented in the literature, such as Darvas (1960) and Vanstone
(2006). In contrast, our findings are consistent with the argument made by Balsara (1992)
and Bernstein (1998), where a larger stop loss threshold allows currently losing open
trades the potential to swing back to profit. The findings by Kaminski and Lo (2008),
which document the merit of stop loss rules on non-random walk portfolios to yield a
positive stopping premium, further lend credence to our results.
4.6 Conclusion
This chapter has examined the trading performance of three full-fledged trading systems
in the Bursa Malaysia, namely traditional fundamental analysis, corporate governance
analysis and technical analysis. The results reveal that in all cases, each trading strategy
significantly outperforms the passive B&H approach and yields positive returns. Our
findings are in line with the bulk of prior literature. Overall, the results presented in this
chapter provide support for Proposition 5. Nonetheless, it is important to note that even
though this chapter confirms the benefits of using the three trading strategies above in
isolation, it says nothing about the performance of the hybrid strategies. In the chapter
that follows, we investigate whether the classical and novel fusion trading systems can
yield superior performance over the B&H, as well as over the constituent strategies as
presented in this chapter.
136
CHAPTER 5
Trading Performance of Classical and
Novel Fusion Analysis
‘Two heads are better than one’ Proverb
5.1 Introduction
Following our discussions on fundamental, corporate governance and technical trading
systems in the previous chapter, this chapter proceeds by examining the efficacy of two
forms of fusion strategies. For the first hybrid strategy, we adopt a classical approach of
integrating only financial statement and technical analysis. For the second fusion
approach, we introduce a novel trading system, engineered for the first time in this
thesis, which merges together financial statement analysis, technical analysis and non-
financial fundamental of corporate governance analysis. Both trading systems incorporate
position sizing and risk management strategies. The rest of this chapter is structured as
follows. Section 5.2 explores the classical fusion analysis. Section 5.3 presents the novel
fusion analysis. Section 5.4 discusses the results and compares the performance of
relevant trading systems. Section 5.5 briefly gives additional comments about the
results, and compares the strategies against several tradable and investable indices in
Malaysia by FTSE and Dow Jones. Section 5.6 concludes.
5.2 Classical Fusion Analysis
Being a combination of two separate trading rules, the classical fusion analysis is
supported from both the fundamental (firm foundation) and technical (castle in the air)
theories. In this section, we first investigate the development phase of the neurally
enhanced classical fusion trading system (CFUS-NNTS). Thereafter, we investigate its
out-of-sample efficacy against the B&H approach, within the context of realistic trading
settings.

137
5.2.1 Model Design
5.2.1.1 Merging Neural Networks
In Chapter 4, we have engineered three separate neural networks, each trained using
relevant trading indicators. The classical hybrid strategy is concerned with the
combination of two of these neural networks, namely the fundamental neural network
(FA-NN) and technical neural network (TA-NN). Recall that FA-NN is trained using
financial ratios (PER, PBV, ROE and DPR) to forecast future annual (200-day forward)
returns, while TA-NN is trained using technical indicators (D, SMA, MACD, RSI, %B
and ATR) to predict short-term (five-day forward) returns. Each ANN emits its own
entry and exit signals, where the thresholds (25 for FA-NN and 35 for TA-NN) are
identified from their respective in-sample performance.
To devise a fusion rule that combines the aspects of accounting (profitability, cash flow
and market valuation) and technical (market mode, trend, cycle and volatility) information
for generating a mechanical, classical fusion trading system, we merge the two trained
ANNs together to emit the entry and exit signals based on the above benchmarks.
5.2.1.2 Trading Rules
The trading rules for a classical fusion strategy follow the general principle of stock
selection and market timing. As described in Chapter 3, the neurally enhanced
traditional fundamental signals are used for screening securities (stock selection), while
ANN-based technical signals are employed for market timing (entry and exit trades).
This is in line with the majority of fusion approaches described in prior literature
(Bernstein 1998; Bollinger 2002, 2005; Varga 2006). Based on the buy/sell thresholds
obtained from the FA-NN and TA-NN performance evaluations (see Tables 4.4 and
4.20 in Chapter 4), Figure 5.1 shows how we code the ANNs indicators simultaneously
in the system to generate the classical fusion (CFUS-NN) buy/sell signals.

138
Figure 5.1 Pseudo Code for the CFUS-NN Trading Rule
1 IF FA-NNt > 25 2 AND TA-NNt > 35 3 AND TA-NNt > TA-NNt-1 THEN 4 BUY at OPENt+1, 5 IF FA-NNt ≤ 25 6 AND TA-NNt ≤ 35 7 AND TA-NNt < TA-NNt-1 THEN 8 SELL at OPENt+1
The figure demonstrates the pseudo code for signalling buy (sell) signals for the neurally enhanced classical fusion trading rule. The actual code is based on the C# programming language. The signals are emitted after the market closes at day t, while buy (sell) trades are only executed on the next day (t+1) based on the prevailing market open price (OPEN). This produces a valid trading rule, simulates a realistic trading environment and mitigates any possibility of look-ahead bias.
As shown in the figure above, the classical fusion rule generates a buy (tomorrow)
signal when FA-NN (today) > 25, TA-NN (today) > 35 and TA-NN (today) > TA-NN
(yesterday), while the sell (tomorrow) signal is generated when FA-NN (today) ≤ 25,
TA-NN (today) ≤ 35 and TA-NN (today) < TA-NN (yesterday). More specifically, our
fusion strategy first screens stocks with a ‘good’ fundamental indicator, while buy
trades are only executed when a technical indicator is also ‘good’ (market entry).
Conversely, if the fundamental indicator is ‘bad’, the sell trade is executed only when
the technical indicator is also ‘bad’ (exit timing).
This buy/sell rule is then incorporated within a full-fledged, realistic trading system
(CFUS-NNTS), which comprises anti-Martingale position sizing (Tharp 1998) and 50%
stop loss rule. To provide valid empirical results, we investigate its trading performance
against the primary B&H policy using out-of-sample analysis.
5.2.2 Empirical Results
Table 5.1 exhibits the results from trading using the CFUS-NNTS against the B&H
strategy in Bursa Malaysia during the period of 1 July 2008 to 30 June 2011, for a total
of three years. An investment budget of RM100,000.00 is placed at the initial period,
with a one way transaction cost rate of 0.83% (1.66% round-trip). Realistic round lot
trading and long-only constraints are also imposed.

139
Table 5.1 CFUS-NNTS Out-of-sample Performance
CFUS-NNTS B&HPanel A: General Trading Metrics Net Profit RM74,905.53 RM27,113.47Net Profit % 74.91% 27.11%Annualised Gain % 20.52% 8.34%Number of Trades 21 30Average Profit RM3,566.93 RM903.78Average Profit % 17.18% 28.14%Exposure 83.59% 99.57%Winners: Winning Trades 16 23Winners: Win Rate 76.19% 76.67%Winners: Average Profit % 25.29% 44.47%Losers: Losing Trades 5 7Losers: Loss Rate 23.81% 23.33%Losers: Average Loss % -8.75% -25.54% Panel B: Key Trading Metrics Profit Factor 16.50 5.54Payoff Ratio 2.89 1.74Maximum Drawdown % -16.05% -26.76%Recovery Factor 4.50 1.01Ulcer Index 3.77 9.36Sharpe Ratio 1.80 0.65Sortino Ratio 3.79 0.96
The table reports the performance metrics of the neurally enhanced full-fledged classical fusion trading system (CFUS-NNTS) compared to the benchmark B&H policy for the holdout sample, covering the period 1 July 2008 to 30 June 2011. Panel A presents the general metrics. Net profit refers to the total dollar profit generated after deducting trading costs, which includes brokerage fees, stamp duty and clearing fees, computed as 0.83% one way (or 1.66% round-trip). Net profit % indicates total net profit in terms of its percentage of initial budget (starting capital), which is RM100,000.00. Annualised gain % shows the smoothed average rate of return on the basis of compounding the starting capital annually. Exposure refers to the total area of portfolio equity exposed to the market. Number of trades shows the total round-trip trades and open positions. Average profit (profit %) is the average dollar (percentage) return per trade after trading costs. Winners: winning trades (win rate) refers to the number (ratio) of winning trades produced by the trading systems, while winners: average profit % indicates the average percentage profit of the winners. Similarly, losers: losing trades (loss rate) refers to the number (ratio) of losing trades generated by the trading systems, while losers: average loss % indicates the average percentage loss of the losing trades. Panel B presents the key metrics. Profit factor is calculated by dividing gross profit with gross loss. Payoff ratio is the system’s average percentage profit per trade divided by the average percentage loss per trade. Maximum drawdown % is the percentage decline of the largest peak to valley in the equity curve. Recovery factor is computed by dividing the absolute value of net profit by the maximum drawdown. Ulcer index is measured by square rooting the quotient of sum squared drawdowns divided by the period. Sharpe ratio conveys the risk-adjusted return for the trading systems, computed by dividing the annualised average return with its annualised standard deviation. Sortino ratio is similar to the Sharpe ratio, but utilises downside deviation instead of standard deviation in the denominator. Both ratios assume a zero risk-free rate of return.

140
As can be observed from Table 5.1, the combination strategy of fundamental and
technical analysis produces excellent results and dominates the B&H policy. Next we
proceed with the related statistical tests to see if our findings are statistically significant.
This is followed by a summary of the trading metrics.
5.2.2.1 Statistical Analysis
The number of trades produced by CFUS-NNTS (see Table 5.1) is sufficiently large (>
20). This allows us to invoke the central limit theorem in order to assume normality of
the returns distribution, consistent with the argument by Katz and McCormick (2000)
and Studenmund (2001). With respect to serial independence, Table 5.2 reports the runs
test analysis for the CFUS-NNTS. The trading system produces a Z score of 1.185.
Because the value does not exceed two, we can conclude there is no dependency among
the trades, and thus the trades are sufficiently random.
Table 5.2 CFUS-NNTS Test for Serial Independence
CFUS-NNTS Total Cases 21 Number of Runs 10 Z Score 1.185
The table reports the runs test analysis. Total cases indicates the total number of trades generated by the trading system. Number of Runs shows the total number of runs in the sequence. Z Score shows how many standard deviations the sequence of wins and losses produced by the trading system are away from the mean.
Since both assumptions of normality and serial independence of the trades generated by
the classical ANN fusion trading system cannot be rejected, parametric statistical tests
can be used for analysing the related hypotheses of the study. The following table
exhibits the results for both the one sample and independent samples (one tailed) t-tests.

141
Table 5.3 CFUS-NNTS Statistical Results
Panel A: One Sample t-test
Test Value = 0
Sample Mean t-statisticDegrees of
Freedom (df) p value
(1-tailed)
CFUS-NNTS 3566.931 3.367 20 0.0015
Panel B: Independent Samples t-test
Levene's Test t-test for Equality of Means
F-statistic p value t-statisticDegrees of
Freedom (df) p value
(1-tailed)
Equal Variances Assumed 29.195 0.000 2.838 49 0.0033
Equal Variances Not Assumed 2.438 22.540 0.0115 The table reports the statistical results for the hypotheses testing. Panel A presents the results from the one sample t-test (one tailed). The test is used to examine whether the mean profit from CFUS-NNTS is significantly greater than zero (µCFUS-NNTS > 0). Panel B shows the results from the independent samples t-test. This panel provides three inferential tests. The Levene's Test is used to test the homogeneity of variances assumption. There are two types of independent samples t-tests: the Equal Variances Assumed shows the equal variance t-test; the Equal Variances Not Assumed refers to the unequal variance (also known as Welch) t-test. These independent sample t-tests (one tailed) are used to examine if the mean return from CFUS-NNTS is significantly greater than the one produced by the B&H (µCFUS-NNTS > µB&H). The sample means for the trading systems are the average profits (after deducting trading costs).
Panel A (see Table 5.3) shows the one sample t-statistic. With the sample mean of
3566.931, the t-statistic shows that the mean return generated by the CFUS-NNTS is
significantly greater than zero, with t(20) = 3.367, p = 0.0015 (p < 0.01) (one tailed).
This allows us to reject the null hypothesis (H0a) of zero mean and conclude that the
hybrid of financial statement and technical analysis can provide statistically significant
profit at 99% confidence level. In brief, this allows us to accept the alternative
hypothesis, H2a.
Table 5.3 (Panel B) confirms that the classical fusion strategy is significantly better than
the B&H policy. Given that the variances of both trading returns are not equal, as shown
by the Levene’s test for equality of variances—F = 29.195, p = 0.000 (p < 0.05)—we
report the findings using the unequal variances independent samples t-test. The results
show that CFUS-NNTS is significantly superior (at 95% confidence level) to the B&H.
More specifically, Welch t’ = 2.438, df = 22.540, p = 0.0115 (p < 0.05) (one tailed).
This allows us to reject (accept) the null (alternative) hypothesis, H0b (H2b).
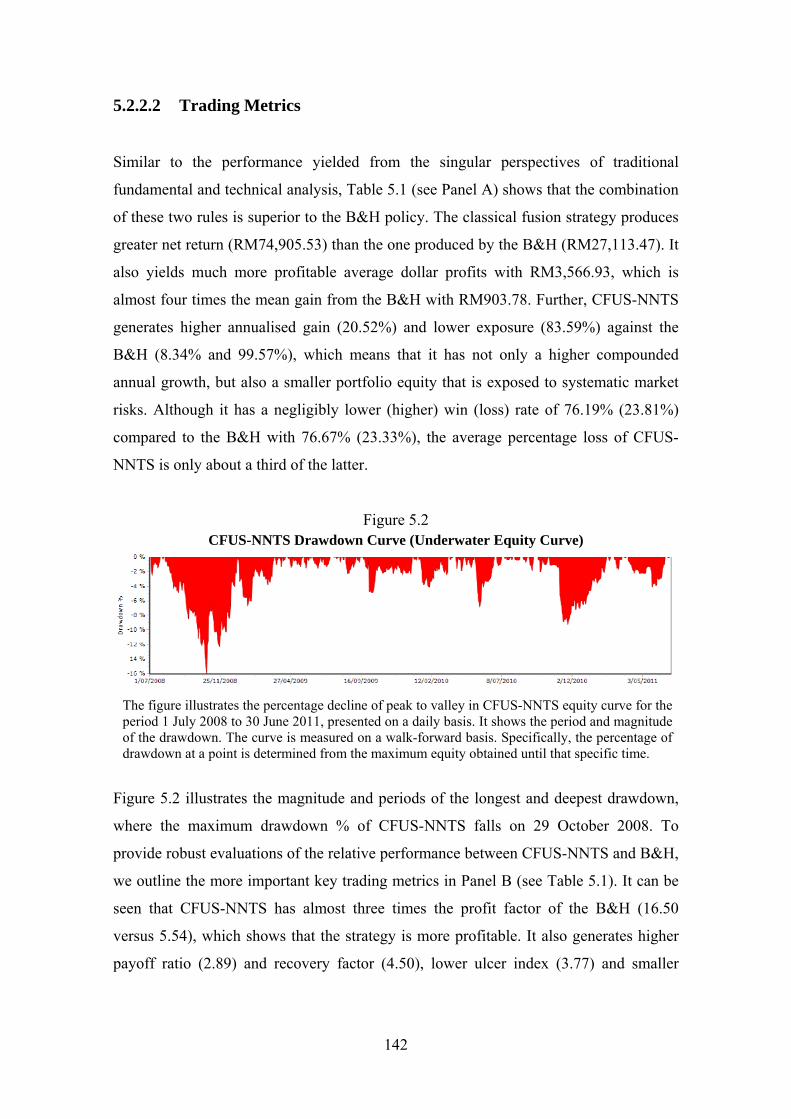
142
5.2.2.2 Trading Metrics
Similar to the performance yielded from the singular perspectives of traditional
fundamental and technical analysis, Table 5.1 (see Panel A) shows that the combination
of these two rules is superior to the B&H policy. The classical fusion strategy produces
greater net return (RM74,905.53) than the one produced by the B&H (RM27,113.47). It
also yields much more profitable average dollar profits with RM3,566.93, which is
almost four times the mean gain from the B&H with RM903.78. Further, CFUS-NNTS
generates higher annualised gain (20.52%) and lower exposure (83.59%) against the
B&H (8.34% and 99.57%), which means that it has not only a higher compounded
annual growth, but also a smaller portfolio equity that is exposed to systematic market
risks. Although it has a negligibly lower (higher) win (loss) rate of 76.19% (23.81%)
compared to the B&H with 76.67% (23.33%), the average percentage loss of CFUS-
NNTS is only about a third of the latter.
Figure 5.2 CFUS-NNTS Drawdown Curve (Underwater Equity Curve)
The figure illustrates the percentage decline of peak to valley in CFUS-NNTS equity curve for the period 1 July 2008 to 30 June 2011, presented on a daily basis. It shows the period and magnitude of the drawdown. The curve is measured on a walk-forward basis. Specifically, the percentage of drawdown at a point is determined from the maximum equity obtained until that specific time.
Figure 5.2 illustrates the magnitude and periods of the longest and deepest drawdown,
where the maximum drawdown % of CFUS-NNTS falls on 29 October 2008. To
provide robust evaluations of the relative performance between CFUS-NNTS and B&H,
we outline the more important key trading metrics in Panel B (see Table 5.1). It can be
seen that CFUS-NNTS has almost three times the profit factor of the B&H (16.50
versus 5.54), which shows that the strategy is more profitable. It also generates higher
payoff ratio (2.89) and recovery factor (4.50), lower ulcer index (3.77) and smaller

143
maximum percentage drawdown (-16.05%), compared to the B&H rule (with 1.74,
1.01, 9.36 and -26.76%, respectively).
Most importantly, if we are to consider the neurally enhanced classical fusion trading
system as successful, it has to offer higher units of profit per unit of risk. The empirical
results show that CFUS-NNTS produces superior Sharpe (1.80) and Sortino (3.79)
ratios compared to the B&H (with 0.65 and 0.96, respectively). These ratios validate
that the combination strategy of fundamental and technical analysis produces greater
risk-return tradeoffs compared to the passive B&H strategy, regardless of the risk
measure (whether only upside or both upside and downside deviations are equally
penalised), and therefore, is the superior strategy of the two. For expositional purposes
only, we present the return distributions of the CFUS-NNTS for daily, weekly and
monthly frequencies throughout the out-of-sample period (1 July 2008 to 30 June 2011).
See Appendix IV.
5.3 Novel Fusion Analysis
We now turn our attention to the main objective of this thesis. That is, to explore if the
new form of fusion, which augments the classical strategy with the new fundamental
corporate governance analysis, can yield significant returns and outperform the
benchmark B&H rule. In other words, this novel approach is an amalgamation of the three
separate ANN trading rules. For this reason, it has the benefit of being supported from
both the fundamental (firm foundation) and technical (castle in the air) theories. Similar to
the previous section, we first examine the developmental stage of this new fusion trading
system (FUSION-NNTS). This is followed by an investigation of its performance against
the B&H rule out-of-sample, within the context of realistic trading settings.

144
5.3.1 Model Design
5.3.1.1 Merging Neural Networks
Analogous to the classical approach, the novel fusion strategy merges the previously
trained ANNs in Chapter 4. Instead of combining only the traditional fundamental (FA-
NN) with technical (TA-NN) neural networks, we also incorporate the ANN trained using
corporate governance factors. Recall that the corporate governance neural network (CG-
NN) has been trained using several governance indicators (DUAL, BSIZE, INST, GOVN
and BIGN) to forecast future annual (200-day forward) returns. Each ANNs emits its
own entry and exit signals, where the threshold is identified from their respective in-
sample performance.
Also recall that the threshold between the negative and positive percentage of average
output for the trained neural networks equals 25 for both FA-NN and CG-NN, and 35
for TA-NN.81 As noted, these thresholds are located within the range of the most
number of observations as required for making meaningful analysis. In order to devise a
fusion rule that combines the aspects of accounting (profitability, cash flow and market
valuation), corporate governance (board structure, ownership characteristics and
disclosure quality) and technical (market mode, trend, cycle and volatility) information
for generating a mechanical, novel fusion trading rule, we merge the three trained
ANNs above together to emit the related entry and exit signals, using the thresholds as
previously described.
5.3.1.2 Trading Rules
Resembling the approach for the classical fusion rule, we employ the general principle
of stock selection and market timing for the novel combination strategy, which is
consistent with prior studies. As described in Chapter 3, the neurally enhanced financial
statement and corporate governance signals are used for screening securities, while for
market timing, the signals are emitted using the ANN-based technical signals. Based on
the buy/sell thresholds obtained from the FA-NN, CG-NN and TA-NN performance
81 See Tables 4.4, 4.12 and 4.20 in Chapter 4.

145
evaluations, Figure 5.3 shows how we code the neural network indicators to generate
the fusion (FUSION-NN) buy/sell signals.
Figure 5.3 Pseudo Code for the FUSION-NN Trading Rule
1 IF FA-NNt > 25 2 AND CG-NNt > 25 3 AND TA-NNt > 35 4 AND TA-NNt > TA-NNt-1 THEN 5 BUY at OPEN+1, 6 IF FA-NNt ≤ 25 7 AND CG-NNt ≤ 25 8 AND TA-NNt ≤ 35 9 AND TA-NNt < TA-NNt-1 THEN
10 SELL at OPENt+1 The figure demonstrates the pseudo code for signalling buy (sell) signals for the neurally enhanced novel fusion trading rule. The actual code is based on the C# programming language. The signals are emitted after the market closes at day t, while buy (sell) trades are only executed on the next day (t+1) based on the prevailing market open price (OPEN). This produces a valid trading rule, simulates a realistic trading environment and mitigates any possibility of look-ahead bias.
As shown in Figure 5.3, the novel fusion rule generates a buy (tomorrow) signal when
FA-NN (today) > 25, CG-NN (today) > 25, TA-NN (today) > 35 and TA-NN (today) >
TA-NN (yesterday), while the sell (tomorrow) signal is generated when FA-NN (today)
≤ 25, CG-NN (today) ≤ 25, TA-NN (today) ≤ 35 and TA-NN (today) < TA-NN
(yesterday). Put another way, it first screens stocks with ‘good’ fundamental and
governance indicators, while buy trades are only executed when a technical indicator is
also ‘good’ (market entry). Conversely, if both fundamentals are ‘bad’, the sell trade is
executed only when the technical indicator is also ‘bad’ (exit timing). The FUSION-NN
is then incorporated within a full-fledged, realistic trading system, comprising the
dynamic, anti-Martingale position sizing and 50% stop loss. To provide valid empirical
results, we examine the trading performance of this full-fledged, neurally enhanced
fusion trading system (FUSION-NNTS) against the primary B&H strategy using out-of-
sample analysis.

146
5.3.2 Empirical Results
Table 5.4 details the performance of the FUSION-NNTS against the B&H strategy in
the Malaysian market during the out-of-sample period, spanning 1 July 2008 to 30 June
2011, for a total of three years. As always, we place an investment budget of
RM100,000.00 at the initial period, with a one way transaction cost rate of 0.83% (1.66%
round-trip). Realistic round lot trading and long-only constraints are also imposed.

147
Table 5.4 FUSION-NNTS Out-of-sample Performance
FUSION-NNTS B&HPanel A: General Trading Metrics Net Profit RM35,902.64 RM27,113.47Net Profit % 35.90% 27.11%Annualised Gain % 10.78% 8.34%Number of Trades 13 30Average Profit RM2,761.74 RM903.78Average Profit % 54.02% 28.14%Exposure 57.95% 99.57%Winners: Winning Trades 12 23Winners: Win Rate 92.31% 76.67%Winners: Average Profit % 58.86% 44.47%Losers: Losing Trades 1 7Losers: Loss Rate 7.69% 23.33%Losers: Average Loss % -3.98% -25.54% Panel B: Key Trading Metrics Profit Factor 170.13 5.54Payoff Ratio 14.79 1.74Maximum Drawdown % -5.68% -26.76%Recovery Factor 4.59 1.01Ulcer Index 1.77 9.36Sharpe Ratio 1.95 0.65Sortino Ratio 4.81 0.96
The table reports the performance metrics of the neurally enhanced full-fledged novel fusion trading system (FUSION-NNTS) compared to the benchmark B&H policy for the holdout sample, covering the period 1 July 2008 to 30 June 2011. Panel A presents the general metrics. Net profit refers to the total dollar profit generated after deducting trading costs, which includes brokerage fees, stamp duty and clearing fees, computed as 0.83% one way (or 1.66% round-trip). Net profit % indicates total net profit in terms of its percentage of initial budget (starting capital), which is RM100,000.00. Annualised gain % shows the smoothed average rate of return on the basis of compounding the starting capital annually. Exposure refers to the total area of portfolio equity exposed to the market. Number of trades shows the total round-trip trades and open positions. Average profit (profit %) is the average dollar (percentage) return per trade after trading costs. Winners: winning trades (win rate) refers to the number (ratio) of winning trades produced by the trading systems, while winners: average profit % indicates the average percentage profit of the winners. Similarly, losers: losing trades (loss rate) refers to the number (ratio) of losing trades generated by the trading systems, while losers: average loss % indicates the average percentage loss of the losing trades. Panel B presents the key metrics. Profit factor is calculated by dividing gross profit with gross loss. Payoff ratio is the system’s average percentage profit per trade divided by the average percentage loss per trade. Maximum drawdown % is the percentage decline of the largest peak to valley in the equity curve. Recovery factor is computed by dividing the absolute value of net profit by the maximum drawdown. Ulcer index is measured by square rooting the quotient of sum squared drawdowns divided by the period. Sharpe ratio conveys the risk-adjusted return for the trading systems, computed by dividing the annualised average return with its annualised standard deviation. Sortino ratio is similar to the Sharpe ratio, but utilises downside deviation instead of standard deviation in the denominator. Both ratios assume a zero risk-free rate of return.

148
As can be observed from the table above, our fusion trading system produces excellent
results and clearly outperforms the B&H strategy. Next we proceed with discussing the
relevant statistical tests, which further confirm that our results are statistically
significant. This is followed by a summary of the trading metrics.
5.3.2.1 Statistical Analysis
In order to decide on the use of parametric or nonparametric statistical tests, we first
need to confirm if the central assumptions of normal distribution (for the trading
returns) and serial independence (randomness) can be accepted. FUSION-NNTS signals
only 13 trades during the period (see Table 5.4), which is less than the minimum of 20
for the central limit theorem to be relevant (Katz & McCormick 2000; Studenmund
2001). Consequently, we utilise the Shapiro-Wilk test for normality to examine if there
is a significant departure from the Gaussian distribution. The result is reported in the
following table.
Table 5.5 FUSION-NNTS Test for Normality
FUSION-NNTS Shapiro-Wilk W Statistic 0.921 Degrees of Freedom (df) 13 p value 0.258
The table reports the Shapiro-Wilk test for normality. It tests the null hypothesis that the sample comes from a normal distribution. The value of W lies between zero and one. Normality is rejected on smaller values of W. The value of one indicates the data is normally distributed.
Table 5.5 shows that since the Shapiro-Wilk statistic is 0.921, with p = 0.258 (p > 0.05),
the assumption of normality for the FUSION-NNTS returns distribution can be accepted.
Next, we need to see if the streaks are sufficiently random (i.e., no significant serial
dependence among the trades). This can be found from the Z score of runs test (Vince
1992). Table 5.6 reports the results from the runs test analysis.

149
Table 5.6 FUSION-NNTS Test for Serial Independence
FUSION-NNTS Total Cases 13 Number of Runs 3 Z Score 1.812
The table reports the runs test analysis. Total cases indicates the total number of trades generated by the trading system. Number of runs shows the total number of runs in the sequence. Z score shows how many standard deviations the sequence of wins and losses produced by the trading system are away from the mean.
The table above shows that with a Z score of 1.812 (which is less than two), we can
conclude that there is no dependency among the FUSION-NNTS trades. Given the fact
that both assumptions of normality and randomness are confidently met, the use of
parametric statistical tests is warranted. Table 5.7 displays the results for the one sample
and independent samples t-tests.
Table 5.7 FUSION-NNTS Statistical Results
Panel A: One Sample t-test
Test Value = 0
Sample Mean t-statisticDegrees of
Freedom (df) p value
(1-tailed)
FUSION-NNTS 2761.742 4.116 12 0.0007
Panel B: Independent Samples t-test
Levene's Test t-test for Equality of Means
F-statistic p value t-statisticDegrees of
Freedom (df) p value
(1-tailed)
Equal Variances Assumed 8.274 0.006 3.121 41 0.0016
Equal Variances Not Assumed 2.574 15.906 0.0102 The table reports the statistical results for the hypotheses testing. Panel A presents the results from the one sample t-test (one tailed). The test is used to examine whether the mean profit from FUSION-NNTS is significantly greater than zero (µFUSION-NNTS > 0). Panel B shows the results from the independent samples t-test. This panel provides three inferential tests. The Levene’s test is used to test the homogeneity of variances assumption. There are two types of independent samples t-tests: the equal variances assumed shows the equal variance t-test; the equal variances not assumed refers to the unequal variance (also known as Welch) t-test. These independent sample t-tests (one tailed) are used to examine if the mean return from FUSION-NNTS is significantly greater than the one produced by the B&H (µFUSION-NNTS > µB&H). The sample means for the trading systems are the average profits (after deducting trading costs).
150
Table 5.7 (see Panel A) shows that with the sample mean of 2761.742, the mean return
yielded by the FUSION-NNTS is significantly greater than zero. Specifically, t(20) =
4.116, p = 0.0007 (p < 0.01) (one tailed). The result allows us to reject (accept) the null
(alternative) hypothesis H0a (H1a) and conclude that the amalgamation of financial
statement, corporate governance and technical trading rules can produce statistically
significant profit, at 99% confidence level.
In the following panel (Panel B of Table 5.7), the Levene’s test shows that the
distributions of FUSION-NNTS and B&H trading returns have heterogeneous variances,
with F = 8.274, p = 0.006 (p < 0.05). This requires the use of unequal variances t-test. The
Welch t-test confirms that the trades produced by FUSION-NNTS is significantly
superior to the ones generated by the B&H, with t’ = 2.574, df = 15.906, p = 0.0102 (p <
0.05) (one tailed). This allows us to accept H1b at 95% confidence level.
5.3.2.2 Trading Metrics
Panel A (see Table 5.4) shows that our neurally enhanced novel fusion strategy is
superior to the B&H rule. The hybrid strategy of fundamental, corporate governance
and technical ANNs produces higher net profits (RM35,902.64) compared to that
produced by the B&H (RM27,113.47). It also yields greater annualised gain (10.78%)
against the B&H (8.34%), as well as remarkably much lower exposure, with only
57.95%. In other words, the amount of portfolio equity from trading using FUSION-
NNTS that is exposed to systematic risk is barely about half of the total trading budget.
Moreover, the novel fusion approach has higher win rates (92.31%) and average profits
(58.86%) when the trade is winning, and much lower average loss (-3.98%) when the
trade is losing, compared to that produced by the B&H approach (76.67%, 44.47% and -
25.54%, respectively).

151
Figure 5.4 FUSION-NNTS Drawdown Curve (Underwater Equity Curve)
The figure illustrates the percentage decline of peak to valley in FUSION-NNTS equity curve for the period 1 July 2008 to 30 June 2011, presented on a daily basis. It shows the period and magnitude of the drawdown. The curve is measured on a walk-forward basis. Specifically, the percentage of drawdown at a point is determined from the maximum equity obtained until that specific time.
Figure 5.4 shows the maximum percentage drawdown of FUSION-NNTS, which falls
on 15 March 2011. The results in Panel B (see Table 5.4), which indicate the key
performance metrics, further demonstrate that the combination of the three ANNs is a
much better strategy. It has a massive profit factor of 170.13—more than 30 times to
that produced by the B&H (5.54). Therefore, this new fusion analysis is considerably
more profitable. The hybrid strategy also has a much higher payoff ratio (14.79) and
recovery factor (4.59), as well as a much lower ulcer index (1.77) and maximum
percentage drawdown (-5.68%), compared to the B&H rule (with 1.74, 1.01, 9.36 and -
26.76%, respectively). Judging by the values of the maximum drawdown %, it is
noticeable that the novel fusion system sustains only about a fifth of the greatest peak to
valley percentage decline as induced by the B&H.
Ultimately, the neurally enhanced fusion trading system yields much more superior
Sharpe (1.95) and Sortino (4.81) ratios, against the ones obtained by the B&H (0.65 and
0.96, respectively). These effectively confirm that this innovative hybrid strategy
produces substantially superior risk-return tradeoffs compared to the passive benchmark
policy. On the whole, the results are outstanding. The novel fusion system dramatically
outperforms the B&H strategy in each and every trading metric examined in Table 5.4.
For illustration purposes only, we give the daily, weekly and monthly charts of
FUSION-NNTS return distributions for the out-of-sample (1 July 2008 to 30 June 2011)
period (see Appendix V).

152
5.4 Discussion and Performance Comparison
In this chapter we have explored the trading performance of two fusion strategies in the
Bursa Malaysia during the period 1 July 2008 to 30 June 2011. In short, the classical
fusion approach is a hybrid of only (traditional) fundamental and technical analysis,
while the novel fusion strategy extends the classical approach by subsuming corporate
governance analysis. Both of these full-fledged trading systems also incorporate
position sizing and risk control strategies. This section proceeds by discussing and
comparing the above results with the B&H strategy, constituent trading systems and
prior literature. Table 5.8 presents the key trading metrics and related statistical results
as summarised from the previous sections, from both analysis chapters (Chapters 4 and
5). Following Eakins and Stansell (2003), we rank the trading systems according to the
descending order of their Sharpe (1966, 1994) ratios.

153
Table 5.8 Summary Performance of the Trading Systems
Key Trading Metrics Statistical Analysis
Sharpe Ratio
Maximum Drawdown %
Profit Factor
RecoveryFactor
Payoff Ratio
Ulcer Index
Sortino Ratio
Sample Mean
One sample t-statistic
(µXX-NNTS > 0)
Independent samples t-statistic (µXX-NNTS > µB&H)
1 FUSION-NNTS 1.95 -5.68% 170.13 4.59 14.79 1.77 4.81 2761.742 4.116*** 2.574**
2 CFUS-NNTS 1.80 -16.05% 16.50 4.50 2.89 3.77 3.79 3566.931 3.367*** 2.438**
3 CG-NNTS 1.27 -11.66% 34.35 2.76 8.05 3.92 2.44 4695.185 2.649** 2.115**
4 FA-NNTS 1.21 -8.41% 11.37 3.69 2.97 2.72 2.09 2826.202 2.814*** 1.851**
5 TA-NNTS 1.12 -24.82% 4.26 2.85 1.91 7.75 2.10 3304.048 2.336** 1.668*
6 B&H 0.65 -26.76% 5.54 1.01 1.74 9.36 0.96 903.781 - - The table provides the key performance metrics and the related statistical results as presented in Chapters 4 and 5. It ranks each of the five neurally enhanced full-fledged trading systems and the benchmark B&H policy in descending order of the Sharpe ratios. The out-of-sample investigation period spans the period from 1 July 2008 until 30 June 2011. XX-NNTS denotes the related trading systems, where XX refers to the trading information used to construct the system (FUSION, CFUS, CG, FA or TA). The results are based on a trading simulation using initial budget (starting capital) of RM100,000.00. Trading costs are also considered, which include brokerage fees, stamp duty and clearing fee, computed as 0.83% one way (or 1.66% round-trip). Sharpe ratio conveys the risk-adjusted return for the trading systems, computed by dividing the annualised average return with its annualised standard deviation. Maximum drawdown % is the percentage decline of the largest peak to valley in the equity curve. Profit factor is calculated by dividing gross profit with gross loss. Recovery factor is computed by dividing the absolute value of net profit by the maximum drawdown. Payoff ratio is the system’s average percentage profit per trade divided by the average percentage loss per trade. Ulcer index is measured by square rooting the quotient of sum squared drawdowns divided by the period. Sortino ratio is similar to the Sharpe ratio, but utilises downside deviation instead of standard deviation in the denominator. Both Sharpe and Sortino ratios assume a zero risk-free rate of return. The sample mean indicates the average return obtained by trading using the strategies. The one sample Student’s t-test is used to analyse if the mean returns from the trading systems are significantly greater than zero (one tailed). The independent samples t-test represents the Welch t’ (unequal variances) statistic. It makes no assumption of homogeneity of variances. It is used to analyse if the mean returns from the full-fledged ANN stock market trading systems are greater than the one produced by the benchmark B&H policy (one tailed). *, ** and *** denote statistical significance at 10%, 5% and 1% level, respectively.

154
Table 5.8 shows that each neurally enhanced trading system developed in this thesis can
provide an investor with significant trading profits, and outperform the benchmark
B&H strategy, as shown by the related one sample and independent samples t-tests.
This effect is most pronounced for the novel combination of fundamental, corporate
governance and technical analysis, which produces the highest t-statistics.82 This is
followed by the classical hybrid approach. The key trading metrics provide evidence of
the superiority of both fusion strategies over the solitary trading systems, where the new
combination rule dominates.
Before we move on to discussing our novel fusion strategy, we first discuss the
performance of the classical hybrid system, which is still lacking in academic research
(Bettman, Sault & Schultz 2009). The overall results in Table 5.8 provide evidence that
CFUS-NNTS dominates its constituent trading systems (FA-NNTS and TA-NNTS), as
well as the new fundamental (CG-NNTS) and benchmark (B&H) strategies. For
example, CFUS-NNTS yields better profit (16.50) and recovery (4.50) factors compared
to the ANN-based trading systems trained with only financial or technical information.
That is, the hybrid approach is more profitable than the two, and although it endures a
bigger loss in portfolio value compared to the FA-NNTS (but smaller in comparison to
the TA-NNTS), CFUS-NNTS is much more effective in overcoming the effects of
drawdown. Most important, CFUS-NNTS produces better Sharpe (1.80) and Sortino
(3.79) ratios over its constituent strategies.83 These metrics confirm that the duplex of
82 The statistical results show that all trading systems yield significant returns over the benchmark zero mean and B&H rules. The one-tailed t-statistics from the FA-NNTS, CG-NNTS and TA-NNTS are 2.814, 2.649 and 2.336, respectively. When two of these ANN rules (FA-NN and TA-NN) are merged into a single, classical fusion trading system (CFUS-NNTS), it attains a higher level of statistical significance (t-statistics = 3.367). When all three singular ANNs (FA-NN, CG-NN and TA-NN) are merged into a novel hybrid approach (FUSION-NNTS), it produces the highest level of significance (t-statistics = 4.116). In other words, the probability of obtaining this result by chance is practically nil. Similar results are obtained from the Welch t’ statistics, where FUSION-NNTS produces the highest level of significance (Welch t’ statistics = 2.574), followed by CFUS-NNTS (Welch t’ statistics = 2.438). Note that the results from these t tests alone cannot be used to say that the novel integration strategy is indeed superior from the practical standpoint, since t-statistics merely provide the strength of evidence, not the size of the effect. The better measure is economic significance, which, in this thesis, is shown primarily by the Sharpe ratio (and in conjunction with the Sortino ratio). Nonetheless, it goes without saying that if a strategy does not provide statistically significant returns and outperforms even the simple B&H policy, it might not be a viable system (for any rational investor) for practical applications. 83 In isolation, FA-NNTS (TA-NNTS) produces the Sharpe ratio of 1.21 (1.12) and Sortino ratio of 2.09 (2.10). It is interesting to note that although FA-NNTS is superior to the TA-NNTS in terms of the Sharpe ratio, when only downside deviation is considered, the latter provides about the same Sortino measure. This indicates that using TA-NNTS in the Malaysian market provides roughly equal risk-return tradeoffs to the FA-NNTS. It possesses the edge in yielding greater returns (see Chapter 4). Nonetheless, FA-

155
fundamental and technical rules produces even superior risk-return tradeoffs, and its
performance is ranked second only to the novel approach. The hybrid of the ANN-based
accounting and technical rules leads to improvements by about 49% (61%) in the Sharpe
ratio over the FA-NNTS (TA-NNTS) and about 81% over both of its constituent
strategies in terms of the Sortino ratio. These findings support the economic significance
of combining traditional fundamental with technical strategy.
There are several possible explanations for these results. First, it appears that the
strengths of each trading rule (fundamental and technical) are successful to offset the
weaknesses of the other, which corroborates Brady (1975). Second, since the trading
system incorporates both types of data, this leads to better results as it is responsive to
both fundamentals and technical signals. This is consistent with Bernstein (1998).
Finally, the use of ANN enhances the entry and exit rules to correctly reflect the
underlying relationship between these inputs and returns. All in all, the above results are
in line with extant literature in combination strategy, such as Bonenkamp (2010),
Bonenkamp, Homburg and Kempf (2011), Contreras, Hidalgo and Núñez-Letamendia
(2012), Longo (1996), Reinganum (1988) and Varga (2006) in the US market. Quah
and Srinivasan (1999) also find similar results in the Singapore stock market. The
superior Sharpe and Sortino ratios produced by CFUS-NNTS corroborate NYIF
(2008a), which claims that by blending both the fundamental and technical, skilful
traders will be capable of outperforming the market on a risk-adjusted basis. The
findings by Longo (1996) also add credibility to our results, as he observes that a fusion
rule generates a higher reward to variability over the market and any other portfolio in
the US. Our results provide support for combining the firm foundation (Graham &
Dodd 1934) and castle in the air (Malkiel 2007) theories.
We now turn our attention to the main objective of this study. Central to this thesis,
Table 5.8 confirms that the novel fusion trading system, which extends the classical
combination rule by including corporate governance factors, yields the most superior
results. It is evident that of all the trading systems tested, FUSION-NNTS ranks first,
irrespective of the key metrics. In brief, it has the highest profit factor (170.13),
NNTS produces a much smaller maximum drawdown %, and as argued by Rotella (1992), drawdown is a much greater concern than returns.

156
suggesting that the trading system is much more profitable than any other strategy. With
only -5.68% of maximum percentage drawdown, the hybrid rule also incurs the lowest
loss in the portfolio value. At the same time, it is also the most effective in overcoming
the effects of drawdown, as shown by its highest recovery factor of 4.59. FUSION-
NNTS yields the highest payoff ratio (14.79), indicating that it is the most successful
strategy in acquiring returns relative to losses. Further, it produces the lowest ulcer
index (1.77), meaning that it has the lowest volatility in terms of daily drawdowns,
which suggests that it is the most desirable system for real-world trading.
Ultimately, with the Sharpe (Sortino) ratio of 1.95 (4.81), FUSION-NNTS considerably
beats any other trading system explored in this thesis. For example, the novel combination
of the three separate rules improves the Sharpe ratio by about 54% over the top-
performing individual strategy (CG-NNTS). If we are to consider only the negative
deviations of returns (Sortino ratio), FUSION-NNTS produces almost double the return
per unit of risk as compared to CG-NNTS. Moreover, by extending the classical fusion
approach with corporate governance information, the Sharpe (Sortino) ratio of the former
is further improved by about 8% (27%). This indicates an economic improvement to the
classical combination strategy. Overall, the dominance of FUSION-NNTS over CFUS-
NNTS, FA-NNTS, CG-NNTS, TA-NNTS and B&H is solidified by its return to
variability, which validates the economic significance of merging accounting, technical
and governance information.
The above results confirm the complementary nature of fundamental, corporate
governance and technical information, which produces the best performing trading
system. The findings similarly provide support for the argument that the strengths of
each trading rule compensate the shortcomings of the other. In addition, the novel
fusion strategy is responsive to three sets of signals, where the use of ANN enhances
these entry and exit rules to correctly reflect the underlying relationship between these
inputs and returns. While there is no direct comparable study in this area, our results are
generally consistent with the classical fusion literature (such as Bonenkamp, Homburg
& Kempf 2011; Contreras, Hidalgo & Núñez-Letamendia 2012; Longo 1996;
Reinganum 1988; Varga 2006) and confirm that corporate governance factors are not
extraneous variables in formulating the fusion system. Lam (2004) extends her fusion
approach by introducing macroeconomic variables, but finds that this deteriorates the

157
performance of her system. In contrast, we find that the inclusion of ANN trained with
corporate governance data complements the classical combination rule by producing an
even superior result. This provides support for the value of governance in building
trading systems, consistent with previous studies (Bauer, Guenster & Otten 2004;
Bebchuk, Cohen & Ferrell 2009; Drobetz, Schillhofer & Zimmermann 2004; Gompers,
Ishii & Metrick 2003).
It is worth noting that although FUSION-NNTS generates the highest Sharpe and
Sortino ratios (among others), CFUS-NNTS is actually the most profitable strategy (see
Section 5.2) in terms of dollar gain. We attribute the superior trading metrics of the
novel fusion approach to the risk reducing effects of corporate governance.84 To a
certain extent, these findings may lend support to the general beliefs (and empirical
evidence) that good governance firms tend to be less risky investments. Overall,
consistent with our expectations, this novel hybrid strategy of fundamental, corporate
governance and technical analysis dominates each of the constituent strategies, classical
fusion approach and the strategy of buying and holding all stocks equally in the
portfolio by yielding superior returns for a unit of risk. Analogous to the classical rule,
the results lend credence to the firm foundation (Graham & Dodd 1934) and castle in
the air (Keynes 1936) theories.
The efficacy of both classical and novel fusion trading systems can also be traced to the
use of proper money and risk managements. As expected, the results reveal that these
factors affect the final outcomes in similar ways to the constituent trading systems. The
findings on the value of money management strategy are consistent with the argument
made by Chande (1997), Pardo (2008), Rotella (1992), Vanstone (2006) and Vanstone
and Hahn (2010), and provide additional support for the results of Babcock (1989). In
particular, the anti-Martingale strategy functions as intended where both fusion trading
systems are able to increase (decrease) profits (losses) during the winning (losing)
streaks. The observed benefit of this strategy is consistent with Tharp’s (1998) argument
to increase (decrease) the stake when the trading system is winning (losing), which
mitigates the behavioural bias of the gambler’s fallacy. Of course, this rule heavily 84 Since the Sharpe (Sortino) measure is the quotient of the annualised returns over the annualised standard (downside) deviations, the superior ratio of a system with identical or lower returns, compared to the other strategy, is directly associated with the lower volatility of the stocks.

158
relies on the condition that the fusion trading systems have a positive mathematical
expectation of rewards (see Balsara 1992). As argued by Babcock (1989), position sizing
technique itself cannot transform a losing trading system into a successful one. In view
of this, the results provide confirmation of the efficacies of the classical and novel
fusion trading systems and their winning potentials.
For illustration purposes, Figure 5.5 shows the MAEs for FUSION-NNTS and CFUS-
NNTS for the out-of-sample period. In terms of risk management strategy, the findings
seem to support the use of a 50% stop loss threshold in cutting losses. This is consistent
with the results on individual trading systems presented in the previous chapter. More
specifically, the benchmark appears effective in allowing both neurally enhanced fusion
systems the potential to regain unrealised losses during their lifetimes.
Figure 5.5 MAEs of Fusion Trading Systems
(a) FUSION-NNTS
(b) CFUS-NNTS
The figure shows the MAEs for FUSION-NNTS and CFUS-NNTS for the period 1 July 2008 to 30 June 2011. The graph presents the breakdown for all trades and winning trades produced by each trading system. It indicates the largest intraday loss for a trading system throughout its lifetime. Whereas the in-sample MAEs might be useful for finding suitable stop loss thresholds, the out-of-sample MAEs are only provided here to confirm the operation of the stop loss policy.
159
It can be seen from the figure above that a large number of the previously losing open
positions (all trades) later gain profit (winning trades), which lends credence to the stop
threshold. The results from using sufficiently large stop values generally corroborate the
arguments made by Balsara (1992) and Bernstein (1998). The midpoint benchmark also
seems to provide unbiased protection from both sides of the risks, which mitigates the
danger of disposition effect (for holding the losing stocks at deep losses for too long)
and avoids the trades being quickly stopped at a loss (due to a low threshold). The
general benefits of using stop loss for an active trading strategy are also consistent with
Kaminski and Lo (2008).
5.5 Additional Comments and Comparison
In this section we offer brief comments about the results presented in this thesis by
reference to real-world trading practice, as well as investable indices in the Malaysian
market. The overall results of this study (Chapters 4 and 5) can be validated by the real-
world dimension. Looking from this standpoint, we argue that if fundamental, corporate
governance, technical and/or fusion trading strategies are not deemed or proven
beneficial, one would not expect practitioners and traders to employ them extensively
for making trading decisions. This is especially the case among finance professionals,
such as advisors, analysts and brokers, since they put millions (or even billions) of
dollars at stake and their reputations (and possible legal repercussions) on the line. The
same argument can be made for position sizing and risk management strategies.
Conversely, if these strategies are indeed useful (as demonstrated by our results), we
can reasonably expect their use, at least among professionals, to be prevalent.
Keeping the above in mind, the fact that a large number of firms, professionals and/or
traders (see Arnold & Moizer 1984; Maditinos, Šević & Theriou 2007; Menkhoff 2010;
Renneboog, Ter Horst & Zhang 2008; Taylor & Ellen 1992) employ the above
strategies for investment appraisals lends further credibility to our findings. The
achievements of well-known traders too, such as Buffett, Darvas, Keynes and O’Neil,
as discussed earlier, add gravity to our results. The findings can be further reinforced by
extant surveys within the local context. For example, Mohamad and Nassir (1997) and
Saadouni and Simon (2004) observe that both fundamental and technical strategies are

160
those used most predominantly by Malaysian analysts. In terms of anti-Martingale
and/or stop loss rules, their practicality and benefits can be supported by Darvas (1960),
Rotella (1992) and Tharp (1998).
Finally, it is interesting to explore how the full-fledged trading systems engineered in
this thesis perform when compared to the performance of different aspects of the
Malaysian market. More specifically, these comparisons can offer further insights into
the efficacies of our combination (and constituent) trading systems against the large,
mid, small cap and Shariah-compliant capital segments of the Bursa Malaysia.85 If the
full-fledged trading systems can indeed outperform the performance of these market
segments, this will strengthen our results and validate the benefits of using the strategies
built in this thesis.
85 For example, Vanstone and Hahn (2010) contest the performance of their ANN-based fundamental and technical trading strategies against one benchmark index, the ASX 200 (in addition to their non-ANN strategies). Instead of only one index, however, and in addition to the benchmark B&H policy presented earlier, we also briefly compare the results of our trading systems against seven popular investable indices in the Bursa Malaysia.
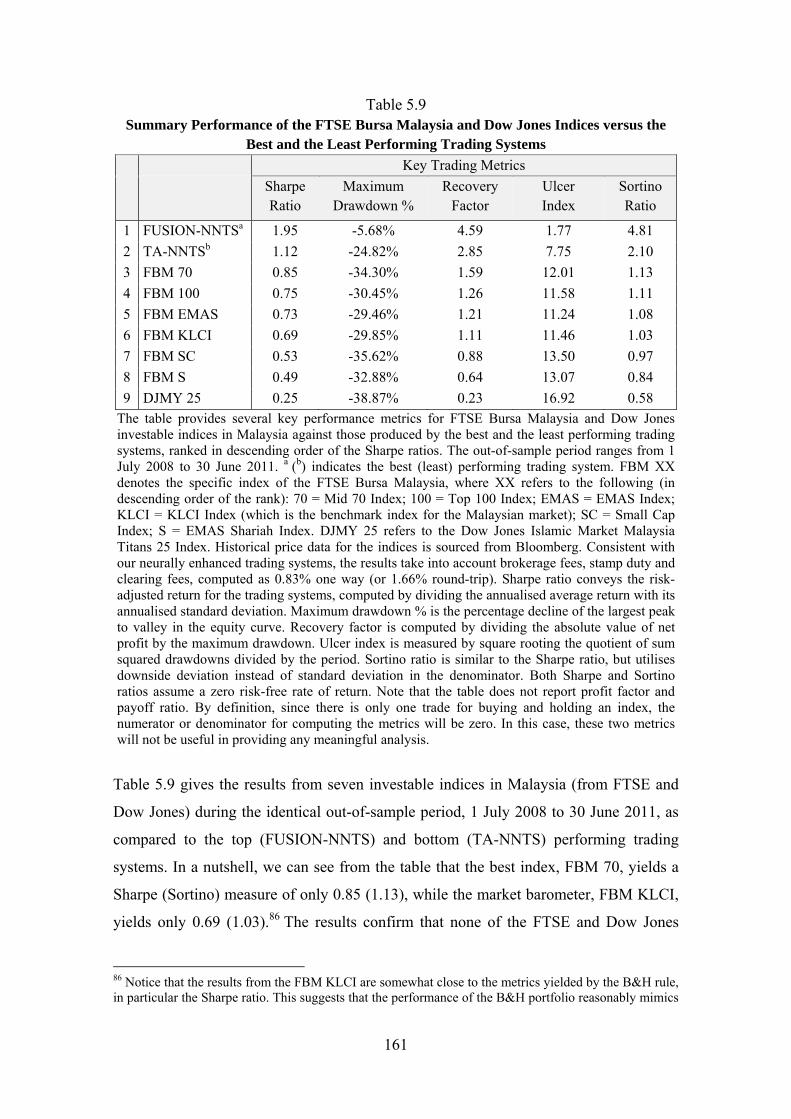
161
Table 5.9 Summary Performance of the FTSE Bursa Malaysia and Dow Jones Indices versus the
Best and the Least Performing Trading Systems
Key Trading Metrics
Sharpe Ratio
Maximum Drawdown %
Recovery Factor
Ulcer Index
Sortino Ratio
1 FUSION-NNTSa 1.95 -5.68% 4.59 1.77 4.81
2 TA-NNTSb 1.12 -24.82% 2.85 7.75 2.10
3 FBM 70 0.85 -34.30% 1.59 12.01 1.13
4 FBM 100 0.75 -30.45% 1.26 11.58 1.11
5 FBM EMAS 0.73 -29.46% 1.21 11.24 1.08
6 FBM KLCI 0.69 -29.85% 1.11 11.46 1.03
7 FBM SC 0.53 -35.62% 0.88 13.50 0.97
8 FBM S 0.49 -32.88% 0.64 13.07 0.84
9 DJMY 25 0.25 -38.87% 0.23 16.92 0.58 The table provides several key performance metrics for FTSE Bursa Malaysia and Dow Jones investable indices in Malaysia against those produced by the best and the least performing trading systems, ranked in descending order of the Sharpe ratios. The out-of-sample period ranges from 1 July 2008 to 30 June 2011. a (b) indicates the best (least) performing trading system. FBM XX denotes the specific index of the FTSE Bursa Malaysia, where XX refers to the following (in descending order of the rank): 70 = Mid 70 Index; 100 = Top 100 Index; EMAS = EMAS Index; KLCI = KLCI Index (which is the benchmark index for the Malaysian market); SC = Small Cap Index; S = EMAS Shariah Index. DJMY 25 refers to the Dow Jones Islamic Market Malaysia Titans 25 Index. Historical price data for the indices is sourced from Bloomberg. Consistent with our neurally enhanced trading systems, the results take into account brokerage fees, stamp duty and clearing fees, computed as 0.83% one way (or 1.66% round-trip). Sharpe ratio conveys the risk-adjusted return for the trading systems, computed by dividing the annualised average return with its annualised standard deviation. Maximum drawdown % is the percentage decline of the largest peak to valley in the equity curve. Recovery factor is computed by dividing the absolute value of net profit by the maximum drawdown. Ulcer index is measured by square rooting the quotient of sum squared drawdowns divided by the period. Sortino ratio is similar to the Sharpe ratio, but utilises downside deviation instead of standard deviation in the denominator. Both Sharpe and Sortino ratios assume a zero risk-free rate of return. Note that the table does not report profit factor and payoff ratio. By definition, since there is only one trade for buying and holding an index, the numerator or denominator for computing the metrics will be zero. In this case, these two metrics will not be useful in providing any meaningful analysis.
Table 5.9 gives the results from seven investable indices in Malaysia (from FTSE and
Dow Jones) during the identical out-of-sample period, 1 July 2008 to 30 June 2011, as
compared to the top (FUSION-NNTS) and bottom (TA-NNTS) performing trading
systems. In a nutshell, we can see from the table that the best index, FBM 70, yields a
Sharpe (Sortino) measure of only 0.85 (1.13), while the market barometer, FBM KLCI,
yields only 0.69 (1.03).86 The results confirm that none of the FTSE and Dow Jones
86 Notice that the results from the FBM KLCI are somewhat close to the metrics yielded by the B&H rule, in particular the Sharpe ratio. This suggests that the performance of the B&H portfolio reasonably mimics

162
indices dominate our full-fledged trading systems. For example, even the best performing
index, FBM 70, underperforms the least performing trading system, which is TA-NNTS
(with a Sharpe ratio of 1.12). Therefore, we can conclude that the ANN-based trading
systems guided by fundamental, corporate governance and technical information (in
isolation), and more importantly the classical and novel fusion approaches, produce
superior results (greater Sharpe, Sortino and recovery measures, and lower maximum
percentage drawdown and ulcer index) over the market. In other words, our trading
systems not only dominate the Malaysian stock market in terms of the main barometer,
but also each of the market segments.
5.6 Conclusion
This chapter has examined the trading performance of two forms of fusion trading
systems in the Bursa Malaysia, for the period 1 July 2008 to 30 June 2011. As expected,
both systems produce significant returns, outperform the passive B&H rule, and
dominate their constituent trading rules. In particular, the novel approach generates the
best performance throughout, even outperforming the classical combination strategy,
with leading metrics in all the key measures tested (Sharpe ratio, Sortino ratio,
maximum drawdown %, payoff ratio, profit factor, recovery factor and ulcer index).
The results are exceptional and lend support to the conceptual premise of amalgamating
fundamental, corporate governance and technical information, within the context of a
sophisticated, full-fledged trading system. On the whole, there is sufficient evidence to
support Propositions 1 to 4. In the following concluding chapter, we provide the
summary of results and their implications, as well as the limitations of this thesis and
scope for further studies.
the market benchmark. Differences in the results can be attributed to the removal of finance firms from our sample (see Chapter 3) and semi-annual revisions of the index constituents.

163
CHAPTER 6
Conclusion and Implications
‘An investment in knowledge pays the best interest’ Benjamin Franklin
Scientist, Publisher, Statesman
6.1 Introduction
Forecasting stock returns remains an absorbing topic for both academics and
practitioners, particularly because of its significant implications in both finance theory
and practice. As a result, this leads to a proliferation of trading strategies. To recapitulate,
the focal aim of this thesis is to build and examine whether the novel combination of
fundamental, corporate governance and technical analysis, within the context of a neurally
enhanced, full-fledged stock market trading system, can provide economically significant
profits. To the best of our knowledge, this is the first study that combines these three
distinct forms of trading strategies.
This final chapter encapsulates the research findings and suggests the implications of
this study. It is structured as follows. Section 6.2 provides an overview of the results
presented in Chapters 4 and 5. Section 6.3 briefly outlines the key implications of our
findings for theory, practice and public policy. Section 6.4 summarises the limitations of
this thesis. Section 6.5 concludes with some recommendations for future research.
6.2 Summary of Results
In this thesis, we investigate a total of five neurally enhanced, full-fledged trading
systems in the Bursa Malaysia: (1) FUSION-NNTS; (2) CFUS-NNTS; (3) FA-NNTS;
(4) CG-NNTS and (5) TA-NNTS. To do so, we build three neural networks using in-
sample data, which spans the period 1 July 2002 to 30 June 2008. Consistent with prior
studies, we train both FA-NN and CG-NN to forecast long-term (200-day) future
returns, while TA-NN is trained to predict short-term (5-day) returns. The B&H rule,
which is supported by advocates of efficient market theory (Malkiel 2007; Reilly &

164
Brown 2003), is used as the null benchmark strategy. The strength of our findings is
supported by rigorous out-of-sample (1 July 2008 to 30 June 2011) analysis, which
considers realistic settings and constraints (such as budget, transaction costs and round
lot trading). The results of this thesis establish five propositions, and where relevant,
confirm the research hypotheses. These are summarised below.
6.2.1 Fundamental Analysis
In examining the trading performance of the full-fledged, neurally enhanced
fundamental trading system (FA-NNTS) in Bursa Malaysia, the ANN is trained using
four accounting variables (PER, PBV, ROE and DPR) to predict long-term stock
returns. This allows the network to discern the underlying relationship between
profitability, cash flow and market valuation, with long-term stock returns. The results
validate the hypotheses (H3a and H3b) that ANN-based fundamental strategy can yield
significant return and outperform the B&H rule. The findings from the trading metrics
show that FA-NNTS also generates superior mean return and lower risks (such as
smaller exposure and maximum drawdown %). Most importantly, the fundamental
trading system provides better returns to variability as indicated by its Sharpe (Sortino)
value of 1.21 (2.09), when compared against the B&H rule with 0.65 (0.96). The
findings support an accounting-based anomaly in the market. The results are generally
in line with Eakins and Stansell (2003), Vanstone (2006) and Olson and Mossman
(2003), and lend support to an earlier study by Thong (2002) in Malaysia.
6.2.2 Corporate Governance Analysis
Unlike the traditional fundamental strategy, the new fundamental analysis forecasts
long-term returns by employing five governance variables (CEO, BSIZE, INST, GOVN
and BIGN) as inputs to the ANN. For this part, the ANN learns the relationship between
non-financial fundamentals about leadership structure, ownership structure and
disclosure quality, with annual returns. Our findings support the hypotheses (H4a and
H4b) that a neurally-enhanced corporate governance trading system can offer significant
returns and outperform the B&H policy. Essentially, it generates a superior Sharpe
(Sortino) ratio of 1.27 (2.44), which exceeds the ratio yielded by the B&H rule. With

165
respect to return to variability, CG-NNTS emerges as the most successful strategy
among all other individual trading systems. The presence of a governance-based
anomaly in Malaysia allows a money-making strategy to be built. The overall findings
corroborate the benefit of using corporate governance information in forming profitable
trading systems. The result is consistent with existing literature (Bauer, Guenster &
Otten 2004; Bebchuk, Cohen & Ferrell 2009; Gompers, Ishii & Metrick 2003).
6.2.3 Technical Analysis
As for the trading system trained using market data, the hypotheses (H5a and H5b) that
technical analysis can offer significant returns and superior to that of the passive B&H
benchmark are validated. The strategy utilises several technical variables (D, SMA,
MACD, RSI, ATR and %B), which cover all technical categories (Pan 2003) as inputs
to the ANN to forecast short-term returns. Specifically, the ANN learns the patterns
between fractal, trend, cycle and volatility, to predict short-term returns. The results show
that the dollar gain from trading using the technical trading system (TA-NNTS) surpasses
the net profits obtained from B&H, traditional and new fundamental strategies. As
compared to the B&H, TA-NNTS has a superior risk-return profile, generating Sharpe
and Sortino ratios of 1.12 and 2.10, respectively. The evidence suggests that historical
market data is not absorbed efficiently in the Malaysian market. The results corroborate
Brock, Lakonishok and LeBaron (1992), Chong and Ng (2008), Dryden (1970),
Metghalchi, Marcucci and Chang (2012) and Thawornwong, Enke and Dagli (2003).
Moreover, our findings also support Bessembinder and Chan (1995), Lai, Balachandher
and Nor (2007) and Yao, Tan and Poh (1999) in their studies of Malaysia.
Overall, the results from the three individual strategies provide support for Proposition 5,
which establishes that fundamental, corporate governance and technical trading systems
(in isolation) can yield economically significant returns and outperform the B&H policy.
6.2.4 Classical Fusion Analysis
The above results confirm the efficacies of fundamental, corporate governance and
technical strategies (in isolation) in the Malaysian market. In exploring the value of

166
combination rules, we first examine the abilities of classical fusion strategies. The
strategy, CFUS-NNTS, uses two ANNs trained with accounting and technical
information. The results show it produces the highest dollar gain over any other system,
and far exceeds the net profits obtained by the B&H. With its Sharpe (Sortino) ratio of
1.80 (3.79), the classical fusion system yields higher returns with lower risks against its
constituent strategies (FA-NNTS and TA-NNTS), the new fundamental analysis (CG-
NNTS) and the passive benchmark (B&H) policy.
The results appear to confirm that the strengths of fundamental (technical) strategy are
successful in offsetting the weaknesses of the other, and that fundamental and technical
signals complement each other. In general, the findings are in line with Bernstein
(1998), Bettman, Sault and Schultz (2009), Bonenkamp, Homburg and Kempf (2011),
Brady (1975), Contreras, Hidalgo and Núñez-Letamendia (2012), Longo (1996) and
Varga (2006). The results give sufficient evidence to support Proposition 4, in which the
union of fundamental and technical analysis is better than each strategy in isolation. For
Proposition 3, the research hypotheses that the CFUS-NNTS can yield significant return
(H2a) and outperform the passive B&H rule (H2b) are also verified.
6.2.5 Novel Fusion Analysis
The novel fusion approach of integrating fundamental, corporate governance and
technical analysis (FUSION-NNTS) is the main objective of this thesis. The empirical
findings endorse the complementary nature of these distinct trading signals. In all the
key trading metrics tested, this new fusion strategy produces the best results. For
example, the strategy has the lowest drawdown and ulcer index, and the highest profit
factor. In particular, FUSION-NNTS yields the highest Sharpe (1.95) and Sortino (4.81)
ratios against all other neurally enhanced trading systems and the B&H policy. The
results confirm that this innovative hybrid system produces the most superior return per
unit of risk, and it is, therefore, the top strategy.
Similar to CFUS-NNTS, the findings provide support for the argument that the
strengths of each trading rule, in this case fundamental, technical and corporate
governance, compensates the shortcomings of the other. Although there is no prior

167
studies of the same tri-indicators’ genetic makeup, the results can be supported by
previous literature in traditional fusion (for example Bonenkamp, Homburg & Kempf
2011; Contreras, Hidalgo & Núñez-Letamendia 2012; Longo 1996; Varga 2006) as well
as corporate governance (Bauer, Guenster & Otten 2004; Bebchuk, Cohen & Ferrell
2009; Gompers, Ishii & Metrick 2003) strategies. All in all, the evidence points towards
supporting Proposition 2, in which the novel fusion strategy of the three sources of
information is indeed superior to each strategy in isolation (P2a) and dominates the
classical fusion policy (P2b). The results also verify the research hypotheses (H1a and
H1b) that FUSION-NNTS can yield significant returns and outperform the passive B&H
rule, which validate Proposition 1.
6.3 Implications of the Study
Based on the results discussed earlier, there are a number of implications of this study.
We proceed by outlining several of the key implications for theory, practice and public
policy.
6.3.1 Implications for Theory
Nobel Laureate Paul Samuelson claims that finance is the crown jewel of social science.
In reference to this claim, Lo (2008, Conclusions, para. 3) argues that ‘the EMH must
account for half the facets’. Extant literature in trading strategies attempt to contribute to
the theory in regards to how the findings support or oppose the theory of efficient
capital market, but existing results remain inconclusive. This thesis contributes to the
ongoing debate of market efficiency by exploring the performance of five sophisticated
trading systems within the context of realistic empirical settings. In the condition where
the market is efficient, superior returns are associated with higher risk (Malkiel 2007;
Reilly & Brown 2003). Therefore, if the trading systems that are built using a related
information set are capable of producing economic profits (after adjusting for risk and
costs), they pose a serious challenge to the efficient market theory (with respect to that
information set) (Jensen 1978). Naturally, the results presented in this thesis have direct
implications for the weak and semi-strong forms of market efficiency.
168
In the weak-form EMH, current stock prices are said to fully reflect all available market
information, such as historical prices and volume. If this holds, technical analysis will
not be able to outperform the simple B&H strategy since the market adjusts rapidly to
this information (Fama & Blume 1966; Malkiel 2007; Reilly & Brown 2003; Vanstone
2006). In contrast, the results presented in this thesis clearly show that our ANN trading
system trained using fractal, trend, cycle and volatility indicators is capable of
forecasting short-term returns and significantly outperforming the benchmark B&H
even after deducting costs. The fact that TA-NNTS also produces greater Sharpe and
Sortino ratios compared to the B&H confirms that our findings are not contributed to
higher risk. As such, the evidence in this thesis supports the castle in the air theory of
Keynes (Malkiel 2007) and indicates a violation of the weak-form market efficiency in
the Malaysian stock market.
In the semi-strong form EMH, market prices are said to fully reflect all publicly
available information. If this is the case, the analysis of financial statement information
will not be beneficial and will be incapable of dominating the B&H rule (Malkiel 2007;
Reilly & Brown 2003; Vanstone 2006). In a similar vein, the use of corporate
governance data should not be able to generate abnormal returns (Aman & Nguyen
2008; Bebchuk, Cohen & Wang 2013; Moorman 2005), since this information is
already absorbed and appropriately priced by the market. However, our results show
that both traditional and new fundamental strategies are capable of identifying
undervalued stocks using publicly available information and outperform the B&H, even
after adjusting for costs and risks. In other words, valuation, cash flow, profitability,
leadership structure, ownership structure and disclosure quality information are not
efficiently priced by the market. For this reason, the evidence supports the firm
foundation theory as postulated by Graham and Dodd (1934), which in turn suggests
that the semi-strong EMH does not apply to the Bursa Malaysia.
The principle of the semi-strong form EMH also incorporates market data (weak-form
EMH) (Cuthbertson & Nitzsche 2004; Loh 2005; Reilly & Brown 2003). In
consequence, the EMH dictates that any trading system that makes use of market (past
prices and volume) as well as non-market (accounting and corporate governance)
information will not be capable of producing superior returns over the simple B&H rule.
Our results show otherwise. Both the classical and novel fusions trading systems yield

169
superior returns and dominate the B&H strategy, as well as produce greater Sharpe and
Sortino ratios. Again, these results cast doubt on the validity of semi-strong EMH in the
Bursa Malaysia.
Overall, our results convincingly suggest that the Malaysian stock market is not semi-
strong efficient in processing financial and non-financial information. The findings also
repudiate EMH even at its weak form. Reilly and Brown (2003) argues that many
influential studies are devoted to examining market efficiency, particularly because of
the serious effect it has on real-world trading practices. In fact, Lo (2008) claims that
the EMH is one of the most fiercely debated theories in all areas of social science. This
study adds to the existing body of literature in this area. The results from our trading
systems have direct implications for market efficiency, and the issue of an efficient
stock market, consequently, has immense practical and policy implications (Cooray &
Wickremasinghe 2007).
6.3.2 Implications for Practice
Nissim and Penman (2001) argue that the purpose of research is to affect practice. We
agree with this view. However, in order for a trading system developed in academia to
be workable in the real world, practical systems and realistic constraints have to be
considered. This thesis has examined the construction of neurally enhanced full-fledged
trading systems and investigates these strategies in the presence of practical constraints,
including round lots, trading budget, short selling restriction, transaction costs and
realistic sample portfolios.
Even after considering the abovementioned constraints and risks, each of our trading
systems produce significant returns and outperform the passive B&H rule. This implies
that traders who endeavour to outperform the market can successfully do so by trading
using the active strategies presented in this thesis. Since historical market data and
publicly available accounting and corporate governance information are not fully
reflected in market prices, traders will be able to exploit market inefficiency by devising
profitable trading strategies, which include all the major factors described in Chande
(1997) and Pardo (2008). Needless to say, they can use technical (fundamental) analysis

170
to forecast future short (long) term returns, as prices do not respond instantaneously to
market (non-market) information. Those who are concerned with socially responsible
factors may also find the use of a corporate governance trading system beneficial.
Ultimately, for investors who wish to yield the most superior risk-return tradeoffs, they
can decide to utilise the novel hybrid approach, which considers financial, non-financial
and market information. Institutional investors (buy-side) can also use these full-fledged
trading systems in their algorithmic trading.
Our findings also have implications for investment firms, security analysts and mutual
funds. Given the importance of trading rules, money management and risk control on
performance, investment banks and stockbroking firms can equip their stockbrokers and
analysts with this knowledge. Professional qualifications, such as Chartered Financial
Analyst (CFA) and CMT, can also be beneficial. In constructing sophisticated trading
systems, however, there is a need to understand complex mathematical models of the
financial market and to program the related rules. Because the stock market does not
move in a simple, linear manner, it is essential to consider issues such as non-linearity
and chaos in the market. In this sense, these firms can also hire programmers and people
from the quantitative backgrounds (such as physics, mathematics and computer
science), who are experts in this area. Indeed, there is now a high demand for these
‘rocket scientists’ in the investment field, most notably on Wall Street.
Financial analysts (sell-side) will be able to employ the methods presented in this thesis
to offer recommendations for individual traders and institutional investors. Instead of
focusing only on simple rules to enter and exit the trades by assessing whether the
securities are undervalued (overvalued) and/or if the timing to enter (exit) the market is
right, they can use neural networks to train related indicators and also highlight the
schemes for correct position sizing and risk management by using sophisticated
financial modelling techniques. As a result, equity research analysts can give ‘buy’,
‘hold’ or ‘sell’ advice based on the signals emitted from the full-fledged mechanical
trading systems.
The findings of this thesis also open up a possibility for the development of new funds.
Fisher and Statman (1997) observe that investment advice from mutual fund firms
closely resemble the naive Talmudic rule (uniform distribution of investment funds

171
among all assets or stocks, popularly known as the 1/N rule). Rather than subscribing to
simple diversification policies or passively tracking the benchmark index,87 these firms
can also assign their funds to active strategies using sophisticated trading systems.
In Malaysia, for example, there is still a limited number of funds that invest in firms
with good corporate governance (such as the Hwang Select Opportunity Fund). As
such, there is a lot of potential for other firms to follow suit in making available socially
responsible financial products. Further, funds that merge traditional fundamental with
technical analysis are scarce. For instance, see CAN SLIM® Select Growth Fund by
NorthCoast Asset Management in the US.88 Thus, the findings of this study not only
support the benefit of combining the two, but also the benefit of building funds that
incorporate the ternion of indicators, within the context of full-fledged trading systems.
Proper money management and stop loss rules can ameliorate risk exposure associated
with managing a large amount of money. Taken as a whole, the findings of this study
offer valuable information for a wide range of market participants.
6.3.3 Implications for Public Policy
The profitability from the trading systems, and thus market inefficiency, also has
implications for public policy. Market efficiency is a key issue for government policy
making (Cooray & Wickremasinghe 2007; Moorman 2005). If the market is efficient,
the prevailing stock prices already manifest relevant information about accounting,
corporate governance and technical data, among others. Thus, the government can rely
on market data to form policies (Moorman 2005). The results presented earlier,
however, refute the validity of EMH in Malaysia at both weak and semi-strong forms.
Put another way, public data on historical market, financial statements and corporate
governance are not immediately reflected in prices.
87 These passive investment strategies subscribe to the notion of an efficient market. Since the manager is not involved with active management, the advantages of index funds are that they incur lower management fees and trading costs (because of lower turnover). However, tracking errors may lead to additional costs and result in the funds underperforming the benchmark index further. Some examples of index tracking funds in Malaysia are OSK-UOB KLCI Tracker Fund and AMB Index-Linked Trust Fund. 88 Note that this techno-fundamental fund is only offered to US residents. As the name shows, it is based on the CAN SLIM® fusion approach advocated by William O’Neil. The fund is distributed by Quasar Distributors, but it is not sponsored, endorsed or sold by Investor’s Business Daily®.
172
The findings of this study suggest that government authorities may need to intervene in
order to ensure efficiency in the Bursa Malaysia. While an inefficient market benefits
traders and speculators, an efficient market is important as it enhances confidence in the
stock market and allows efficient allocation of capital. In order to identify the necessary
policies needed to be taken, we first diagnose several possible causes for inefficiency.
Normally in emerging markets, information may not be circulated in a timely manner. If
this is the case, the government can put in place policies to ensure that data is quickly
transmitted to the public (see, for example, Cooray & Wickremasinghe 2007). In
Malaysia, however, the requirements of timely disclosure have already been established.
The Bursa Malaysia Listing Requirements 9.23(1) obliges listed firms to issue their
audited annual reports within six months from the end of the financial year, at which
point the digital versions of these reports are made available in Bursa Malaysia website
instantaneously. Further, the progress in electronic trading should have made the market
more efficient (Shynkevich 2012). In Malaysia, an online trading platform has already
been available since the early 2000s, which provides real time stock data. With fast
broadband infrastructure and 3G (now 4G) networks, traders are not only able to access
pricing data, but also execute buy (sell) trades at their fingertips. As such, it is unlikely
that slow information distribution is the cause of the Malaysian market being inefficient.
Another aspect that usually contributes to a market being inefficient is illiquidity and
high trading costs. Emerging markets are generally less liquid and charge higher costs
for trading. Reilly and Brown (2003) claim that lower costs lead to a more efficient
market. Moreover, as argued by Shynkevich (2012), the development of electronic
trading and exchange traded funds further reduce costs and in turn boost liquidity,
which results in the market being more efficient. Looking at these arguments, the
Malaysian market should have been efficient, with the trading costs being low and
brokerage fees fully negotiable (for cash upfront and internet trading), as well as with
the introduction of ETF in 2007. Moreover, stocks from the FTSE Bursa Malaysia
Index Series can be considered sufficiently liquid, as required by the FTSE,89 and its
89 Specifically, for the stocks to be eligible for inclusion, they need to conform to the rules set out by FTSE with regards to eligibility, free float and liquidity.

173
liquidity is also apparent based on the report by the World Bank (2009). Therefore, the
source of Bursa Malaysia inefficiency cannot be assigned to these factors.
Since the abovementioned factors are not likely to be the cause for the violation of an
efficient market, we conjecture several possibilities that may have led to the apparent
inefficiency. Under the EMH, it is assumed that all agents process relevant, publicly
available information in the same way (Cuthbertson & Nitzsche 2004). Even if there are
any errors or irrational traders, they are assumed to be random and unbiased, and thus,
cancel each other out. Instead, our findings suggest there might be large number of
irrational traders that base their decisions on rumours and the presence of herding.90 As
well, there might not be sufficient smart money traders to quickly capitalise on this
divergence to push prices back to their fundamental values. Even if there are many
rational traders, they might largely process information using heterogeneous and
erroneous forecasting techniques (i.e., simple or linear models to explain fundamental,
governance and/or technical relationships with stock returns). Because market price is
purely a function of supply and demand, the use of fallible trading systems by the
majority of investors may result in the discrepancy between prices and intrinsic values.
Accordingly, the inefficiency of the Malaysian market leads to policy decisions being
made on case by case basis rather than the more standardised evidence from market
information, as suggested by Moorman (2005). Policy makers may also use the
strategies built in this thesis to spot possible future price movements. For example,
through government-linked investment companies (such as the Employees Provident
Fund, National Pension Fund and Permodalan Nasional Berhad), with large funds at
their disposal, they can exploit trading opportunities by investing in undervalued stocks
to counter noise traders, and as a result, eliminate security mispricing. In short, they can
act as arbitrageurs to bring the price up (down) when the stock is underpriced
(overpriced). Nonetheless, the limitation of this approach is that stocks do not have
perfect substitutes for them to sell short (in the case of overpricing) and buy a substitute.
90 Indeed, Lai and Lau (2004), based on the data from 1992 to 2001, find evidence of herding behaviour in the Malaysian stock market, particularly during the Asian financial crisis. As such, the effect of the global financial crisis (in our early sample period), to a certain extent, may also magnify this behaviour. In other words, traders may have reacted with dismay and further pushed stock prices below their intrinsic values, as manifested by the KLCI, which plunged in value. In 2008, for example, the KLCI dropped from 1,435.68 on 2 January to only 876.75 on 31 December (that is, a fall of 39% in just a year).

174
Moreover, the RSS in Bursa Malaysia limits the extent to which the stocks can be
shorted, while risk aversion might also deter any correction to mispricing.91
As far as the regulatory bodies are concerned, policy makers can impose revisions on
the existing syllabus (or design additional modules) for the licensing examination to
include learning objectives on corporate governance, fusion analysis, risk control and
money management. At the moment, those who intend to apply for a dealer’s
representative license need to sit for Module 6 (Stock Market and Securities Law) and
Module 7 (Financial Statement Analysis and Asset Valuation) by the SC, and coverage
in the latter focuses only on the traditional fundamental analysis. For existing market
professionals, formal training via CPE approved courses can also include the above
materials. In short, proper training for licensed dealers, as well as educating the general
public on the various issues about the stock market, the use of position sizing and risk
management strategies (among others), may also contribute to the Bursa Malaysia
becoming more efficient.
6.4 Limitations of the Study
There is a caveat that needs to be noted that relates to the use of ANNs. Although ANNs
are known to excel in pattern recognition and financial forecasting, they are not a
panacea. Given their nature as a black-box modelling technique, they possess little
capability (albeit difficult) for explanatory purposes (Trippi & Turban 1996), effectively
preventing us from uncovering the significance of each trading indicator (input).
Nonetheless, it generally goes outside the scope of research in this topic (see, for
example, Olson & Mossman 2003; Thawornwong, Enke & Dagli 2003; Vanstone 2006)
to extract the information from the ANNs. Instead, the analysis is typically based on the
out-of-sample metrics, and thus, this limitation is not of significant concern (see Trippi
& Turban 1996).
Another limitation is not specifically confined to this study, but relates to mutual funds
in general. In this thesis, we have constructed five sophisticated trading systems that can
be used by active traders, who share the common goal of outperforming the stock market 91 For further discussions on these issues, see Cuthbertson and Nitzsche (2004).

175
by exploiting market inefficiency. We have also previously discussed how the results
open up a possibility for the development of new funds. In practice, however, mutual
funds often have policy statements that require sufficient diversification in order to reduce
unsystematic risk. Although active strategies may outperform a broad-based market
index, very often they are based on undiversified portfolios. As a result, these policies
might create a barrier in forming portfolios based on the trading systems built in this
thesis. This limitation, however, is not relevant for active traders.
6.5 Suggestions for Future Research
Sir Isaac Newton argues that ‘to explain all nature is too difficult a task for any one man
or even for any one age. Tis much better to do a little with certainty, and leave the rest
for others that come after you, than to explain all things’ (Rogers 1982, p. 231). Within
the context of trading strategies, there is an enormous body of literature spanning
financial statement, corporate governance, technical and, to a lesser extent, fusion
analysis. In reflecting on Newton, therefore, it would have been a herculean task for a
researcher to investigate all the above trading strategies in a single, exhaustive study.
Nonetheless, this thesis has made a significant leap from extant literature by examining
the performance of each trading system above in a single extensive and comprehensive
study. In light of the evidence presented in this thesis, we suggest a number of possible
further studies using the same experimental set up.
For the first major function (entry and exit rules), our ANNs emit buy (sell) signals
based on the trained indicators drawn from the related fundamental, governance and
technical data. The selection of these variables is supported by the existing research.
Future studies may consider different indicators. For example, other financial ratios,
corporate governance and/or technical indicators may also provide useful information in
mapping the relationship to forecast future returns. In addition, the focus on new
fundamental research in this study is constrained to corporate governance, which is
considered the most crucial SRI factor for traders (Mercer 2006). Given the recent
increase in awareness among investors in issues such as human rights, animal testing,
nuclear power and global warming (see for example Budde 2008; Renneboog, Ter Horst
& Zhang 2008), it would be fascinating to analyse the broader concept of socially

176
responsible investing. In this aspect, future studies can also employ environmental and/or
social factors as inputs for training the neural network to predict long-term returns.
In relation to the second major function (position sizing), our framework is based upon
the anti-Martingale strategy as described by Balsara (1992) and Tharp (1998). The
choice for this approach can be supported from logical grounds and mitigates the risk
associated with the gambler’s fallacy (Tharp 1998). It is apparent that the many forms
of position sizing techniques available open up possibilities for further research that
goes outside the scope of this thesis. For instance, following Babcock (1989), future
studies may explore the effect on trading performance by experimenting with different
money management rules. Strategies such as the Kelly method, Martingale, optimal f,
pyramiding and volatility adjusted approaches (for details, see Balsara 1992; Pardo
2008; Tharp 1998; Vince 1992) also offer limitless prospects for further investigation.
For the third major function (risk management), our stop loss threshold follows on from
the advice given by Buffett (Lynch 1994). On the basis of our in-sample MAE, we also
find that this benchmark is reasonable, and this is in proximity with the stop level for
the fundamental strategies observed in Vanstone (2006). Further experimentations using
different stop loss policies may provide motivating insights into their effects on trading
performance. For instance, future studies can investigate the use of a stop threshold
advocated by other real life practitioners (such as a 7% or 8% level as proposed by
O’Neil 2009). Other forms of stop procedures, for example, dollar stop, volatility stop
and trailing stop (see Pardo 2008), can also be examined.
With respect to investigating the performance of the trading systems, we employ out-of-
sample analysis to explore these strategies using blind holdout period (1 July 2008 to 30
June 2011). By splitting the data into two non-overlapping periods, we provide external
validity to the trading models and this allows us to identify if the superior performance
of the trading systems is merely a result of network overfitting and data mining bias, or
due to their efficacies in exploiting market inefficiency. Future studies can examine the

177
trading strategies by splitting the data to reflect different market phases, such as bear,
bull and stable periods.92
Finally, consistent with the extant literature, we have utilised the typical B&H approach
as the benchmark strategy. Moreover, the performance of our trading systems has also
been compared to those of seven investable indices. If the debate on the superiority of
the trading systems developed in this thesis is to be moved forward, future research can
perhaps extend these evaluations against other forms of realistic strategies as well. One
example of such a strategy is portfolio analysis, which is used most prevalently in the
mutual funds industry.93 Since a portfolio choice problem deals with allocating budget
across several assets (or stocks), it will be intriguing to contest the efficacies of stock
selection and/or market timing trading systems engineered in this thesis (which attempt
to shift the efficient frontier vertically) against those obtained from diversification
strategies (which attempt to provide the best combination of risk and return along the
Pareto optimal front).94
92 Recall that the out-of-sample period in this study covers both the global financial crisis and its recovery phases. Note that the crisis period during the holdout sample is less than a year and thus will be too small and insignificant for making valid empirical analysis. Furthermore, it goes outside the scope of this thesis to analyse the trading performances using other time periods (or sub-periods). Instead, this study relies on a single holdout period for analysis, and this is consistent with Thawornwong, Enke and Dagli (2003), Tsibouris and Zeidenberg (1995) and Vanstone (2006), among others. In any event, several other studies similarly do not split their data according to the related economic crises. For example, Gunasekarage and Power (2001) explore simple moving average rules in the South Asian markets during the period January 1990 to March 2000, but do not split their period to reflect the related crises in India (in 1991) and Bangladesh (in 1996). Piotroski and So (2012) explore fundamental strategies covering the period 1972 to 2010 in the US, and the authors do not split their data to indicate the 2008 global financial crisis. Finally, Yu et al. (2013) explore simple technical trading rules in the Southeast Asian markets from 1991 to 2008; the authors do not split their data, even though their entire period covers the Asian and global financial crises as well as the recovery periods. 93 Markowitz’s (1952) mean variance model is arguably the most popular portfolio optimisation approach (Branke et al. 2009), although interestingly, large number of mutual funds follow the simple Talmudic approach (Fisher & Statman 1997). Nevertheless, while these allocation strategies are indeed practical, extant surveys confirm that market participants view portfolio choice as not as popular as, and ranks below, fundamental, technical and fusion trading strategies (Maditinos, Šević & Theriou 2007; Mohamad & Nassir 1997) that dominate the stock market. Portfolio allocation subscribes to the efficient market hypothesis, and therefore is in contrast to the theory of firm foundation (castle in the air), which supports fundamental (technical) strategy. 94 For example, Markowitz (1952) argues that it is portfolio selection, not stock selection, which matters. Sharpe, Alexander and Bailey (1999) assert that focusing investment on a single stock with greatest expected returns is hazardous, and that investors should spread their investments. Statman (2000), however, argues that allocation strategy is pivotal not because it is superior, but because investors are not competent in stock selection or market timing. In contrast, supporters of fundamental, technical and/or fusion strategies (such as Warren Buffett, John Maynard Keynes, Gerald Loeb and William O’Neil) strongly oppose portfolio allocation strategy. Buffett cautions investors against diversification and advises them to employ stock selection rather than subscribing to Markowitz’s (1952) paradigm (Harvey 2010). In his famous letter to FC Scott in 1934 (see Winslow 2003), Keynes acknowledges that the right strategy is to concentrate large funds

178
in specific stocks that traders are familiar with, and that it is wrong to diversify across many stocks with little knowledge of them. Loeb (1957) is more critical, in which he argues that diversification strategy ‘is a necessity for the beginner’ (p. 10) and that those who follow the strategy reveal their inadequate trading knowledge. For experts, he adds, portfolio diversification is an impossibility. In a similar vein, O’Neil (2009) argues that traders should invest in a small number of carefully chosen stocks, and that wide diversification shows lack of knowledge. The comparison between these competing strategies may also provide further insights into the efficiency of the stock market, since portfolio allocation subscribes to the theory of an efficient market. All in all, the debate of stock selection and/or market timing versus portfolio diversification strategy provides an interesting scope for further research.

179
References
ABDC 2010, ABDC journals list by rating, Australian Business Dean Council, viewed 27 September 2012, <http://www.abdc.edu.au/download.php?id=461294,245,1>.
Aby, CD, Briscoe, NR, Elliott, RS & Bacadayan, A 2001, 'Value stocks: a look at benchmark fundamentals and company priorities', Journal of Deferred Compensation, vol. 7, no. 1, pp. 20-31.
Aby, CD, Briscoe, NR, Jones, MD & Kromis, SG 2001, 'Selection of undervalued stock investments for pension plans and deferred compensation programs', Journal of Deferred Compensation, vol. 6, no. 3, pp. 64-76.
Achelis, SB 2001, Technical analysis from A to Z, 2nd edn, McGraw-Hill, New York.
Aggarwal, R, Klapper, L & Wysocki, PD 2005, 'Portfolio preferences of foreign institutional investors', Journal of Banking and Finance, vol. 29, no. 12, pp. 2919-46.
Alexakis, C, Patra, T & Poshakwale, S 2010, 'Predictability of stock returns using financial statement information: evidence on semi-strong efficiency of emerging Greek stock market', Applied Financial Economics, vol. 20, no. 16, pp. 1321-6.
Aman, H & Nguyen, P 2008, 'Do stock prices reflect the corporate governance quality of Japanese firms?', Journal of The Japanese and International Economies, vol. 22, no. 4, pp. 647-62.
Anand, S 2008, Essentials of corporate governance, John Wiley & Sons, New Jersey.
Anwar, Z 2009, Keynote address at the launch of the Securities Commission - Bursa Malaysia Corporate Governance Week 2009, Securities Commission, viewed 30 November 2012, <http://www.sc.com.my/main.asp?pageid=375&linkid=2192& yearno=2009&mod=paper>.
Arnold, J & Moizer, P 1984, 'A survey of the methods used by UK investment analysts to appraise investments in ordinary shares', Accounting and Business Research, vol. 14, no. 55, pp. 195-208.
Azoff, EM 1994, Neural network time series forecasting of financial markets, John Wiley & Sons, West Sussex.
Babcock, B, Jr. 1989, The Dow Jones-Irwin guide to trading systems, Dow Jones-Irwin, Homewood.

180
Bachelier, L 1900, 'Théorie de la spéculation', Annales Scientifiques de l’École Normale Supérieure Sér. 3, vol. 17, pp. 21-86.
Bai, C-E, Liu, Q, Lu, J, Song, FM & Zhang, J 2003, 'Corporate governance and market valuation in China', William Davidson Working Paper, no. 564, pp. 1-42.
Baliga, BR, Moyer, RC & Rao, RS 1996, 'CEO duality and firm performance: what's the fuss?', Strategic Management Journal, vol. 17, no. 1, pp. 41-53.
Balsara, N 1992, Money management strategies for future traders, John Wiley & Sons, New York.
Barber, BM & Odean, T 2000, 'Trading is hazardous to your wealth: the common stock investment performance of individual investors', Journal of Finance, vol. 55, no. 2, pp. 773-806.
Basu, S 1977, 'Investment performance of common stocks in relation to their price-earnings ratios: a test of the efficient market hypothesis', Journal of Finance, vol. 32, no. 3, pp. 663-82.
Bauer, R, Frijns, B, Otten, R & Tourani-Rad, A 2008, 'The impact of corporate governance on corporate performance: evidence from Japan', Pacific-Basin Finance Journal, vol. 16, no. 3, pp. 236–51.
Bauer, R, Guenster, N & Otten, R 2004, 'Empirical evidence on corporate governance in Europe: the effect on stock returns, firm value and performance', Journal of Asset Management, vol. 5, no. 2, pp. 91-104.
Bebchuk, LA 2012, 'Investing in good governance', viewed 21 October 2012, <http://dealbook.nytimes.com/2012/09/12/investing-in-good-governance/>.
Bebchuk, LA, Cohen, A & Ferrell, A 2009, 'What matters in corporate governance?', Review of Financial Studies, vol. 22, no. 2, pp. 783-827.
Bebchuk, LA, Cohen, A & Wang, CCY 2013, 'Learning and the disappearing association between governance and returns', Journal of Financial Economics, vol. 108, no. 2, pp. 323-48.
Beechey, M, Gruen, D & Vickery, J 2000, 'The efficient market hypothesis: a survey', Research Discussion Paper (Reserve Bank of Australia), no. 2000-01, pp. 1-30.
Berle, A & Means, G 1932, The modern corporation and private property, Macmillan, New York.
Bernstein, J 1998, The compleat day trader II, McGraw-Hill Companies, New York.

181
Bessembinder, H & Chan, K 1995, 'The profitability of technical trading rules in the Asian stock markets', Pacific-Basin Finance Journal, vol. 3, no. 2-3, pp. 257-84.
Bettman, JL, Sault, SJ & Schultz, EL 2009, 'Fundamental and technical analysis: substitutes or complements?', Accounting and Finance, vol. 49, no. 1, pp. 21-36.
Bhagat, S & Bolton, B 2008, 'Corporate governance and firm performance', Journal of Corporate Finance, vol. 14, no. 3, pp. 257-73.
Black, B 2001, 'The corporate governance behavior and market value of Russian firms', Emerging Markets Review, vol. 2, no. 2, pp. 89-108.
Boik, J 2004, Lessons from the greatest stock traders of all time, McGraw-Hill, New York.
Bollinger, J 2002, Bollinger on Bollinger bands, McGraw-Hill, New York.
—— 2005, 'Combining technical and fundamental analysis', in CFA Institute Conference Proceedings Quarterly, vol. 2005, pp. 60-70.
Bonenkamp, U 2010, Combining technical and fundamental trading strategies: profits, market reactions, and use by professional investors, Gabler Research, Heidelberg.
Bonenkamp, U, Homburg, C & Kempf, A 2011, 'Fundamental information in technical trading strategies', Journal of Business Finance and Accounting, vol. 38, no. 7-8, pp. 842-60.
Brady, GP 1975, Tripling your money in the stock market with techno-fundamental strategies, Parker Publishing Company, West Nyack.
Branke, J, Scheckenbach, B, Stein, M, Deb, K & Schmeck, H 2009, 'Portfolio optimization with an envelope-based multi-objective evolutionary algorithm', European Journal of Operational Research, vol. 199, no. 3, pp. 684-93.
Brock, W, Lakonishok, J & LeBaron, B 1992, 'Simple technical trading rules and the stochastic properties of stock returns', Journal of Finance, vol. 47, no. 5, pp. 1731-64.
Budde, SJ 2008, Compelling returns: a practical guide to socially responsible investing, John Wiley & Sons, New Jersey.
Buffett, W 1991, Chairman's letter–1991, Berkshire Hathaway Inc., viewed 15 September 2011, <http://www.berkshirehathaway.com/letters/1991.html>.
Capaul, C, Rowley, I & Sharpe, WF 1993, 'International value and growth stock returns', Financial Analysts Journal, vol. 49, no. 1, pp. 27-36.
182
Cervellati, EM, Fattori, P & Pattitoni, P 2010, 'Individual investors' behavior: are small investors different?', paper presented to European Financial Management Association 2010 Annual Meetings, Aarhus, 23-26 June.
Chan, EP 2009, Quantitative trading: how to build your own algorithmic trading business, John Wiley & Sons, Hoboken, New Jersey.
Chande, TS 1997, Beyond technical analysis: how to develop and implement a winning trading system, Wiley, New York.
Chen, A, Kao, L, Tsao, M & Wu, C 2007, 'Building a corporate governance index from the perspectives of ownership and leadership for firms in Taiwan', Corporate Governance, vol. 15, no. 2, pp. 251-61.
Chen, G, Firth, M & Ning Gao, D 2011, 'The information content of earnings components: evidence from the Chinese stock market', European Accounting Review, vol. 20, no. 4, pp. 669-92.
Chhaochharia, V, Kumar, A & Niessen-Ruenzi, A 2012, 'Local investors and corporate governance', Journal of Accounting and Economics, vol. 54, no. 1, pp. 42-67.
Chhibber, A, Ghosh, J & Palanivel, T 2009, The global financial crisis and the Asia-Pacific region: a synthesis study incorporating evidence from country case studies, UNDP Regional Centre for Asia and the Pacific, Colombo.
Chong, TT-L & Ng, W-K 2008, 'Technical analysis and the London stock exchange: testing the MACD and RSI rules using the FT30', Applied Economics Letters, vol. 15, no. 14, pp. 1111-4.
Chui, ACW & Wei, KCJ 1998, 'Book-to-market, firm size, and the turn-of-the-year effect: evidence from Pacific-Basin emerging markets', Pacific-Basin Finance Journal, vol. 6, no. 3-4, pp. 275-93.
Clemen, R 1989, 'Combining forecasts: a review and annotated bibliography', International Journal of Forecasting, vol. 5, no. 4, pp. 559-83.
Conant, LW 1961, 'Tomorrow's investment information tonight: computers seen as selectors for 'best stock buys'', Financial Analysts Journal, vol. 17, no. 2, pp. 31-5.
Conger, JA & Lawler, E 2001, 'Building a high-performing board: how to choose the right members', Business Strategy Review, vol. 12, no. 3, pp. 11-9.
Contreras, I, Hidalgo, J & Núñez-Letamendia, L 2012, 'A GA combining technical and fundamental analysis for trading the stock market', in C Di Chio, A Agapitos, S Cagnoni, C Cotta, F de Vega, G Di Caro, R Drechsler, A Ekárt, A Esparcia-Alcázar, M Farooq, W Langdon, J Merelo-Guervós, M Preuss, H Richter, S

183
Silva, A Simões, G Squillero, E Tarantino, A Tettamanzi, J Togelius, N Urquhart, A Uyar & G Yannakakis (eds), Applications of Evolutionary Computation, Springer, Heidelberg, vol. 7248, pp. 174-83.
Cooray, A & Wickremasinghe, GB 2007, 'The efficiency of emerging stock markets: empirical evidence from the South Asian region', Journal of Developing Areas, vol. 41, no. 1, pp. 171-83.
Core, JE, Guay, WR & Rusticus, TO 2006, 'Does weak governance cause weak stock returns? An examination of firm operating performance and investors' expectations', Journal of Finance, vol. 61, no. 2, pp. 655-87.
Cremers, KJM & Nair, VB 2005, 'Governance mechanisms and equity prices', Journal of Finance, vol. 60, no. 6, pp. 2859-94.
Cuthbertson, K & Nitzsche, D 2004, Quantitative financial economics: stocks, bonds and foreign exchange, 2nd edn, John Wiley & Sons, West Sussex.
Damodaran, A 2012, Investment philosophies: successful strategies and the investors who made them work, 2nd edn, John Wiley & Sons, Hoboken, New Jersey.
Darvas, N 1960, How I made $2,000,000 in the stock market, American Research Council, Larchmont, New York.
Dawson, SM 1985, 'Singapore share recommendations using technical analysis', Asia Pacific Journal of Management, vol. 2, no. 3, pp. 180-8.
De Sá, JPM 2007, Applied statistics using SPSS, STATISTICA, MATLAB and R, 2nd edn, Springer, Heidelberg.
DeFusco, RA, McLeavey, DW, Pinto, JE & Runkle, DE 2007, Quantitative investment analysis, 2nd edn, CFA Investment Series, John Wiley & Sons, Hoboken, New Jersey.
Dimson, E & Mussavian, M 1998, 'A brief history of market efficiency', European Financial Management, vol. 4, no. 1, pp. 91-103.
Dorantes, CA 2013, 'The relevance of using accounting fundamentals in the Mexican stock market', Journal of Economics, Finance and Administrative Science, vol. 18, no. Special Issue, pp. 2-10.
Drobetz, W, Schillhofer, A & Zimmermann, H 2004, 'Corporate governance and expected stock returns: evidence from Germany', European Financial Management, vol. 10, no. 2, pp. 267-93.
Dryden, MM 1970, 'Filter tests of U.K. share prices', Applied Economics, vol. 1, no. 4, pp. 261-75.

184
Dye, R 1993, 'Auditing standards, legal liability and auditor wealth', Journal of Political Economy, vol. 101, no. 5, pp. 887-914.
Eakins, SG & Stansell, SR 2003, 'Can value-based stock selection criteria yield superior risk-adjusted returns: an application of neural networks', International Review of Financial Analysis, vol. 12, no. 1, pp. 83-97.
Edwards, RD, Magee, J & Bassetti, WHC 2007, Technical analysis of stock trends, 9th edn, Taylor & Francis Group, Boca Raton, FL.
Ehlers, JF & Way, R 2010, 'Fractal Dimension as a market mode sensor', Technical Analysis of Stocks & Commodities, vol. 28, no. 6, pp. 16-20.
Eisenberg, T, Sundgren, S & Wells, MT 1998, 'Larger board size and decreasing firm value in small firms', Journal of Financial Economics, vol. 48, no. 1, pp. 35-54.
Evertsz, CJG & Berkner, K 1995, 'Large deviation and self-similarity analysis of graphs: DAX stock prices', Chaos, Solitons & Fractals, vol. 6, pp. 121-30.
Fabozzi, FJ, Kolm, PN, Pachamanova, DA & Focardi, SM 2007, Robust portfolio optimization and management, The Frank J. Fabozzi Series, John Wiley & Sons, Hoboken, New Jersey.
Fabozzi, FJ & Markowitz, H (eds) 2002, The theory and practice of investment management, The Frank J. Fabozzi Series, John Wiley & Sons, Hoboken, New Jersey.
Falbo, P & Pelizzari, C 2011, 'Stable classes of technical trading rules', Applied Economics, vol. 43, no. 14, pp. 1769-85.
Fama, EF 1965, 'Random walks in stock market prices', Financial Analysts Journal, vol. 21, no. 5, pp. 55-9.
—— 1970, 'Efficient capital markets: a review of theory and empirical work', Journal of Finance, vol. 25, no. 2, pp. 383-417.
Fama, EF & Blume, ME 1966, 'Filter rules and stock-market trading', Journal of Business, vol. 39, no. 1, pp. 226-41.
Fama, EF & French, KR 1992, 'The cross-section of expected stock returns', Journal of Finance, vol. 47, no. 2, pp. 427-65.
—— 1998, 'Value versus growth: the international evidence', Journal of Finance, vol. 53, no. 6, pp. 1975-99.
Fama, EF & Jensen, MC 1983, 'Separation of ownership and control', Journal of Law and Economics, vol. 26, no. 2, pp. 301-25.

185
Feibel, BJ 2003, Investment performance measurement, The Frank J. Fabozzi Series, John Wiley & Sons, Hoboken, New Jersey.
Feng, L & Seasholes, M 2004, 'Correlated trading and location', Journal of Finance, vol. 59, no. 5, pp. 2117-44.
Fernández-Rodríguez, F, González-Martel, C & Sosvilla-Rivero, S 2000, 'On the profitability of technical trading rules based on artificial neural networks: evidence from the Madrid stock market', Economics Letters, vol. 69, no. 1, pp. 89-94.
Fifield, SGM, Power, DM & Knipe, DGS 2008, 'The performance of moving average rules in emerging stock markets', Applied Financial Economics, vol. 18, no. 19, pp. 1515-32.
Fisher, KL & Statman, M 1997, 'Investment advice from mutual fund companies', Journal of Portfolio Management, vol. 24, no. 1, pp. 9-25.
Flanegin, FR & Rudd, DP 2005, 'Should investments professors join the “crowd”', Managerial Finance, vol. 31, no. 5, pp. 28-37.
Forbes 2012, The Forbes 400: the richest people in America, Forbes Inc., viewed 25 April 2013, <http://www.forbes.com/forbes-400/list/>.
GMI n.d., GMI and the Principles for Responsible Investment, GovernanceMetrics International, viewed 15 March 2011, <http://www.gmiratings.com/pri.aspx>.
Goldberg, DE 1989, Genetic algorithms in search, optimization, and machine learning, Addison-Wesley Professional, Upper Saddle River, NJ.
Gomez, ET & Jomo, KS 1999, Malaysia's political economy: politics, patronage and profits, 2nd edn, Cambridge University Press, Cambridge, UK.
Gompers, P, Ishii, J & Metrick, A 2003, 'Corporate governance and equity prices', Quarterly Journal of Economics, vol. 118, no. 1, pp. 107-55.
Gotthelf, P 1995, Technofundamental trading: a revolutionary approach to combining technical & fundamental analysis, Probus Publishing, Chicago.
Graham, B & Dodd, DL 1934, Security analysis, Whittlesey House/McGraw-Hill, New York.
—— 2009, Security analysis, 6th edn, McGraw-Hill Companies, New York.
Graham, B & Zweig, J 2003, The intelligent investor: the definitive book on value investing, Revised edn, HarperBusiness Essentials, New York.

186
Grossman, S & Zhou, Z 1993, 'Optimal investment strategies for controlling drawdowns', Mathematical Finance, vol. 3, no. 3, pp. 241-76.
Guild, SE 1931, Stock growth and discount tables, Financial Publishers, New York.
Gunasekarage, A & Power, DM 2001, 'The profitability of moving average trading rules in South Asian stock markets', Emerging Markets Review, vol. 2, no. 1, pp. 17-33.
Hackett, CW, Jr. 1968, A techno-fundamental portfolio management simulation with computer applications, vol. 7 (Revised), Studies in Banking and Finance, Bureau of Business Resesarch, University of Texas.
Haniffa, R & Hudaib, M 2006, 'Corporate governance structure and performance of Malaysian listed companies', Journal of Business Finance and Accounting, vol. 33, no. 7-8, pp. 1034-62.
Harvey, TW 2010, 'Portfolio theory and investment management', in RC Free (ed.), 21st Century Economics: A Reference Handbook, Sage Publications, California, vol. 1.
Haugen, R & Baker, N 1996, 'Commonality in the determinants of expected stock returns', Journal of Financial Economics, vol. 41, no. 3, pp. 401-39.
Holthausen, RW & Larcker, DF 1992, 'The prediction of stock returns using financial statement information', Journal of Accounting and Economics, vol. 15, no. 2-3, pp. 373-411.
Hornik, K, Stinchcombe, M & White, H 1989, 'Multilayer feedforward networks are universal approximators', Neural Networks, vol. 2, pp. 359-66.
Hynes, M 2005, 'Are you ready for non-financial reporting?', Informed: Journal of the Investor Relations Society, vol. Winter, no. 49, p. 26.
Isa, MM & Lim, C 1995, 'Profile of individual investors in the Klang Valley area', Capital Markets Review, vol. 3, no. 1, pp. 1-15.
James, J & Yang, L 2010, 'Stop-losses, maximum drawdown-at-risk and replicating financial time series with the stationary bootstrap', Quantitative Finance, vol. 10, no. 1, pp. 1-12.
Jensen, MC 1978, 'Some anomalous evidence regarding market efficiency', Journal of Financial Economics, vol. 6, no. 2-3, pp. 95-101.
—— 1993, 'The modern industrial revolution, exit, and the failure of internal control systems', Journal of Finance, vol. 48, no. 3, pp. 831-80.

187
Jensen, MC & Benington, GA 1970, 'Random walks and technical theories: some additional evidence', Journal of Finance, vol. 25, no. 2, pp. 469-82.
Johnson, SA, Moorman, TC & Sorescu, S 2009, 'A reexamination of corporate governance and equity prices', Review of Financial Studies, vol. 22, no. 11, pp. 4753-86.
Kahneman, D & Tversky, A 1979, 'Prospect theory: an analysis of decision under risk', Econometrica, vol. 47, no. 2, pp. 263-91.
Kaminski, KM & Lo, AW 2008, When do stop-loss rules stop losses?, Swedish Institute for Financial Research, Stockholm.
Kara, Y, Acar Boyacioglu, M & Baykan, ÖK 2011, 'Predicting direction of stock price index movement using artificial neural networks and support vector machines: the sample of the Istanbul Stock Exchange', Expert Systems with Applications, vol. 38, no. 5, pp. 5311-9.
Katz, JO & McCormick, DL 2000, The encyclopedia of trading strategies, McGraw-Hill, New York.
Kaufman, PJ 1998, Trading systems and methods, 3rd edn, John Wiley & Sons, New York.
Keynes, JM 1936, The general theory of employment, interest and money, Macmillan, London.
Khiari, W, Karaa, A & Omri, A 2007, 'Corporate governance efficiency: an indexing approach using the stochastic frontier analysis', Corporate Governance, vol. 7, no. 2, pp. 148-61.
Kung, JJ & Wong, W-K 2009, 'Profitability of technical analysis in the Singapore stock market: before and after the Asian financial crisis', Journal of Economic Integration, vol. 24, no. 1, pp. 135-50.
La Porta, R, Lopez-de-Silanes, F, Shleifer, A & Vishny, RW 1998, 'Law and finance', Journal of Political Economy, vol. 106, no. 6, pp. 1113-55.
Lai, MM, Balachandher, KG & Nor, FM 2007, 'An examination of the random walk model and technical trading rules in the Malaysian stock market', Malaysian Accounting Review, vol. 6, no. 2, pp. 99-121.
Lai, MM & Lau, S-H 2004, 'Herd behavior and market stress: the case of Malaysia', Academy of Accounting and Financial Studies Journal, vol. 8, no. 3, pp. 85-101.

188
Lai, MM & Lau, S-H 2006, 'The profitability of the simple moving averages and trading range breakout in the Asian stock markets', Journal of Asian Economics, vol. 17, no. 1, pp. 144-70.
Lakonishok, J, Shleifer, A & Vishny, RW 1994, 'Contrarian investment, extrapolation, and risk', Journal of Finance, vol. 49, no. 5, pp. 1541-78.
Lam, M 2004, 'Neural network techniques for financial performance prediction: integrating fundamental and technical analysis', Decision Support Systems, vol. 37, no. 4, pp. 567-81.
Lee, CMC 2003, 'Fusion investing', in Equity Valuation in a Global Context, Charlottesville, Virginia, pp. 15-23.
Leigh, W, Purvis, R & Ragusa, JM 2002, 'Forecasting the NYSE composite index with technical analysis, pattern recognizer, neural network, and genetic algorithm: a case study in romantic decision support', Decision Support Systems, vol. 32, no. 4, pp. 361-77.
Leitch, G & Tanner, JE 1991, 'Economic forecast evaluation: profits versus the conventional error measures', The American Economic Review, vol. 81, no. 3, pp. 580-90.
Levy, RA 1967, 'Relative strength as a criterion for investment selection', Journal of Finance, vol. 22, no. 4, pp. 595-610.
Link, M 2003, High probability trading: take the steps to become a successful trader, McGraw-Hill, New York.
Lipton, M & Lorsch, JW 1992, 'A modest proposal for improved corporate governance', Business Lawyer, vol. 48, no. 1, pp. 59-77.
Lo, AW 2002, 'The statistics of Sharpe ratios', Financial Analysts Journal, vol. 58, no. 4, pp. 36-52.
Lo, AW 2008, 'Efficient markets hypothesis', in SN Durlauf & LE Blume (eds), The New Palgrave Dictionary of Economics, 2nd edn, Palgrave Macmillan, Basingstoke. The New Palgrave Dictionary of Economics Online, Palgrave Macmillan, viewed 4 October 2010, <http://www.dictionaryofeconomics.com/ extract?id=pde2008_E000050>.
Lo, AW & Hasanhodzic, J 2009, The heretics of finance: conversations with leading practitioners of technical analysis, Bloomberg Press, New York.
Lo, AW & Hasanhodzic, J 2010, The evolution of technical analysis: financial prediction from Babylonian tablets to Bloomberg terminals, John Wiley & Sons, Hoboken, New Jersey.

189
Lo, AW, Mamaysky, H & Wang, J 2000, 'Foundations of technical analysis: computational algorithms, statistical inference, and empirical implementation', Journal of Finance, vol. 55, no. 4, pp. 1705-65.
Loeb, GM 1957, The battle for investment survival, 3rd edn, Simon & Schuster, New York.
Loh, EYL 2005, 'A comparative study of technical trading rules, time-series trading rules and combined technical and time-series trading strategies in the Australian Stock Exchange', Doctor of Philosophy thesis, The University of Western Australia.
Longo, JM 1996, 'Selecting superior securities: using discriminant analysis and neural networks to differentiate between 'winner' and 'loser' stocks', Doctor of Philosophy thesis, Rutgers, The State University of New Jersey.
Lowe, J 1994, Benjamin Graham on value investing, Penguin Books, New York.
Lynch, P 1994, Beating the street, Simon & Schuster, New York.
Maditinos, DI, Šević, Ž & Theriou, NG 2007, 'Investors’ behaviour in the Athens Stock Exchange (ASE)', Studies in Economics and Finance, vol. 24, no. 1, pp. 32-50.
Mak, YT & Kusnadi, Y 2005, 'Size really matters: further evidence on the negative relationship between board size and firm value', Pacific-Basin Finance Journal, vol. 13, no. 3, pp. 301-18.
Mak, YT & Li, Y 2001, 'Determinants of corporate ownership and board structure: evidence from Singapore', Journal of Corporate Finance, vol. 7, no. 3, pp. 235-56.
Malkiel, B 2007, A random walk down Wall Street: the time-tested strategy for successful investing, W. W. Norton & Company, New York.
Mallin, CA 2007, Corporate governance, 2nd edn, Oxford University Press, Oxford.
Mandelbrot, B 1983, The fractal geometry of nature, W. H. Freeman and Company, New York.
—— 1997, Fractals and scaling in finance: discontinuity, concentration, risk, Springer, New York.
Markowitz, HM 1952, 'Portfolio selection', Journal of Finance, vol. 7, no. 1, pp. 77-91.
Marshall, BR & Cahan, RH 2005, 'Is technical analysis profitable on a stock market which has characteristics that suggest it may be inefficient?', Research in International Business and Finance, vol. 19, no. 3, pp. 384–98.

190
Martin, S & Parker, D 1995, 'Privatization and economic performance throughout the UK business cycle', Managerial and Decision Economics, vol. 16, no. 3, pp. 225-37.
MCCG 2007, Malaysian Code of Corporate Governance (Revised 2007), Securities Commission, Kuala Lumpur.
McConnell, JJ & Servaes, H 1990, 'Additional evidence on equity ownership and corporate value', Journal of Financial Economics, vol. 27, no. 2, pp. 595-612.
McKinsey & Company 2002, Global investor opinion survey: key findings, McKinsey & Company, London.
Menkhoff, L 2010, 'The use of technical analysis by fund managers: international evidence', Journal of Banking and Finance, vol. 34, no. 11, pp. 2573-86.
Mercer 2006, Perspectives on responsible investment: a survey of US pension plans, foundations and endowments, and other long-term saving pools, Mercer Investment Consulting, New York.
Metghalchi, M, Marcucci, J & Chang, Y-H 2012, 'Are moving average trading rules profitable? Evidence from the European stock markets', Applied Economics, vol. 44, no. 12, pp. 1539-59.
Michaely, R & Shaw, WH 1995, 'Does the choice of auditor convey quality in an initial public offering?', Financial Management, vol. 24, no. 4, pp. 15-30.
Mitton, T 2002, 'A cross-firm analysis of the impact of corporate governance on the East Asian financial crisis', Journal of Financial Economics, vol. 64, no. 2, pp. 215–41.
Mohamad, S & Nassir, AM 1997, 'A survey of methods used by Malaysian brokerage firm investment analysts to appraise investments in ordinary shares', Pertanika Journal of Social Science and Humanities, vol. 5, no. 2, pp. 125-37.
Moorman, TC 2005, 'Corporate governance and long-term stock returns', Doctor of Philosophy thesis, Texas A&M University.
Mukherji, S, Dhatt, MS & Kim, YH 1997, 'A fundamental analysis of Korean stock returns', Financial Analysts Journal, vol. 53, no. 3, pp. 75-80.
Mulligan, RF 2004, 'Fractal analysis of highly volatile markets: an application to technology equities', The Quarterly Review of Economics and Finance, vol. 44, no. 1, pp. 155-79.
Murphy, JJ 1999, Technical analysis of the financial markets: a comprehensive guide to trading methods and applications, New York Institute of Finance, Paramus, NJ.

191
Nisbet, R, Elder, J & Miner, G 2009, Handbook of statistical analysis and data mining applications, Elsevier, Burlington, MA.
Nison, S 1991, Japanese candlestick charting techniques: a contemporary guide to the ancient investment techniques of the Far East, New York Institute of Finance, New York.
Nissim, D & Penman, SH 2001, 'Ratio analysis and equity valuation: from research to practice', Review of Accounting Studies, vol. 6, no. 1, pp. 109–54.
NYIF 2008a, Essentials of fusion analysis, Pearson, viewed 9 September 2009, <http:// www.nyif.com/courses/tech_3002.html>.
—— 2008b, Fusion analysis, Pearson, viewed 13 December 2009, <http://www.nyif .com/courses/tech_3003.html>.
O’Neil, WJ 2009, How to make money in stocks: a winning system in good times or bad, 4th edn, McGraw-Hill, New York.
Olson, D & Mossman, C 2003, 'Neural network forecasts of Canadian stock returns using accounting ratios', International Journal of Forecasting, vol. 19, no. 3, pp. 453-65.
Oppenheimer, HR & Schlarbaum, GG 1981, 'Investing with Ben Graham: an ex ante test of the efficient markets hypothesis', The Journal of Financial and Quantitative Analysis, vol. 16, no. 3, pp. 341-60.
Ou, JA & Penman, SH 1989, 'Financial statement analysis and the prediction of stock returns', Journal of Accounting and Economics, vol. 11, no. 4, pp. 295–329.
Palicka, J 2005, 'The selling climax: fusion analysis in action', The Technical Analyst, May/June 2005, pp. 23-5.
—— 2012, Fusion analysis: merging fundamental, technical, behavioral, and quantitative analysis for risk-adjusted excess returns, McGraw-Hill, New York.
Pan, H 2003, 'A joint review of technical and quantitative analysis of financial markets towards a unified science of intelligent finance', paper presented to Hawaii International Conference on Statistics and Related Fields, Hawaii, 5 May.
Pardo, R 2008, The evaluation and optimization of trading strategies, 2nd edn, John Wiley & Sons, Hoboken, New Jersey.
PassMark 2010, Intel vs AMD CPU benchmarks - high end, PassMark Software, viewed 10 December 2010, <http://www.cpubenchmark.net/high_end_cpus.html>.

192
Pathirawasam, C & Wickremasinghe, GB 2012, 'Ownership concentration and financial performance: the case of Sri Lankan listed companies', Corporate Ownership and Control, vol. 9, no. 4, pp. 170-7.
Pesaran, MH & Timmermann, A 1995, 'Predictability of stock returns: robustness and economic significance', Journal of Finance, vol. 50, no. 4, pp. 1201-28.
Peters, EE 1994, Fractal market analysis: applying chaos theory to investment and economics, John Wiley & Sons, New York.
Piotroski, JD 2000, 'Value investing: the use of historical financial statement information to separate winners from losers', Journal of Accounting Research, vol. 38, no. Supplement, pp. 1-41.
Piotroski, JD & So, EC 2012, 'Identifying expectation errors in value/glamour strategies: a fundamental analysis approach', Review of Financial Studies, vol. 25, no. 9, pp. 2841-75.
Quah, T-S 2008, 'DJIA stock selection assisted by neural network', Expert Systems with Applications, vol. 35, no. 1-2, pp. 50-8.
Quah, T-S & Srinivasan, B 1999, 'Improving returns on stock investment through neural network selection', Expert Systems with Applications, vol. 17, pp. 295-301.
Rahman, MZ 1998, 'The role of accounting in the East Asian financial crisis: lessons learned?', Transnational Corporations, vol. 7, no. 3, pp. 1-52.
Ramirez, CD & Tan, LH 2003, 'Singapore Inc. versus the private sector: are government-linked companies different?', IMF Working Paper, no. WP/03/156, pp. 1-21.
Refenes, AN, Azema-Barac, M & Zapranis, AD 1993, 'Stock ranking: neural networks vs multiple linear regression', in IEEE International Conference on Neural Networks, San Francisco, California, vol. 3, pp. 1419-26.
Refenes, AN, Zapranis, AD & Francis, G 1994, 'Stock performance modeling using neural networks: a comparative study with regression models', Neural Networks, vol. 7, no. 2, pp. 375-88.
Reilly, F & Brown, K 2003, Investment analysis and portfolio management, 7th edn, Thomson/South-Western, Cincinnati, OH.
Reinganum, MR 1988, Selecting superior securities, The Research Foundation of The Institute of Chartered Financial Analysts, Charlottesville, Virginia.

193
Renneboog, L, Ter Horst, J & Zhang, C 2008, 'Socially responsible investments: institutional aspects, performance, and investor behavior', Journal of Banking and Finance, vol. 32, no. 9, pp. 1723-42.
Rogers, G 1982, 'The system of Locke and Newton', in Z Bechler (ed.), Contemporary Newtonian research, D. Reidel Publishing Company, Dordrecht, Holland, pp. 215-38.
Rosillo, R, de la Fuente, D & Brugos, JAL 2013, 'Technical analysis and the Spanish stock exchange: testing the RSI, MACD, momentum and stochastic rules using Spanish market companies', Applied Economics, vol. 45, no. 12, pp. 1541-50.
Rotella, RP 1992, The elements of successful trading: developing your comprehensive strategy through psychology, money management, and trading methods, New York Institute of Finance, Engelwood Cliffs, NJ.
Ruggiero, MA 1997, Cybernetic trading strategies: developing a profitable trading system with state-of-the-art technologies, John Wiley & Sons, New York.
Ryan, B 2004, Finance and accounting for business, Thomson Learning, London.
Saadouni, B & Simon, J 2004, 'Methods used by Thai and Malaysian security analysts to appraise ordinary shares', Asian Review of Accounting, vol. 12, no. 2, pp. 25-56.
Samuelson, PA 1965, 'Proof that properly anticipated prices fluctuate randomly', Industrial Management Review, vol. 6, no. 2, pp. 41-9.
Schwager, JD 1999, Getting started in technical analysis, The Getting Started in Series, John Wiley & Sons, New York.
Shapiro, SS & Wilk, MB 1965, 'An analysis of variance test for normality (complete samples)', Biometrika, vol. 52, no. 3/4, pp. 591-611.
Shapiro, SS, Wilk, MB & Chen, HJ 1968, 'A comparative study of various tests for normality', Journal of the American Statistical Association, vol. 63, no. 324, pp. 1343-72.
Sharpe, WF 1966, 'Mutual fund performance', Journal of Business, vol. 39, no. 1, pp. 119-38.
—— 1985, Investments, 3rd edn, Prentice Hall, Englewood Cliffs, N.J.
—— 1994, 'The Sharpe ratio', Journal of Portfolio Management, vol. 21, no. 1, pp. 49-58.

194
Sharpe, WF, Alexander, GJ & Bailey, JV 1999, Investments, 6th edn, Prentice Hall, Upper Saddle River, New Jersey.
Shefrin, H 2002, Beyond greed and fear: understanding behavioral finance and the psychology of investing, Financial Management Association Survey and Synthesis Series, Oxford University Press, New York.
Shefrin, H & Statman, M 1985, 'The disposition to sell winners too early and ride losers too long: theory and evidence', Journal of Finance, vol. 40, no. 3, pp. 777-90.
Shleifer, A 1998, 'State versus private ownership', The Journal of Economic Perspectives, vol. 12, no. 4, pp. 133-50.
Shleifer, A & Vishny, RW 1997, 'A survey of corporate governance', Journal of Finance, vol. 52, no. 2, pp. 737-83.
Shynkevich, A 2012, 'Short-term predictability of equity returns along two style dimensions', Journal of Empirical Finance, vol. 19, no. 5, pp. 675-85.
Snead, MC 1999, 'Combining technical and fundamental analyses', Technical Analysis of Stocks & Commodities, vol. 17, no. 9, pp. 405-9.
Sortino, FA & Satchell, SE (eds) 2001, Managing downside risk in financial markets, Quantitative Finance Series, Butterworth-Heinemann, Oxford.
Spritzer, AS & Freitas, CMDS 2006, 'A visual tool to support technical analysis of stock market data', paper presented to Proceedings of the working conference on Advanced visual interfaces, Venezia, Italy, 23-26 May.
Statman, M 2000, 'The 93.6% question of financial advisors', Journal of Investing, vol. 9, no. 1, pp. 16–20.
Sternberg, RJ & Lubart, TI 1992, 'Buy low and sell high: an investment approach to creativity', Current Directions in Psychological Science, vol. 1, no. 1, pp. 1-5.
Studenmund, A 2001, Using econometrics: a practical guide, 4th edn, Addison Wesley, Boston, Mass.
Tan, C 1999, 'A hybrid financial trading system incorporating chaos theory, statistical and artificial intelligence/soft computing methods', paper presented to Queensland Finance Conference, Queensland, 30 September - 1 October.
Taylor, MP & Allen, H 1992, 'The use of technical analysis in the foreign exchange market', Journal of International Money and Finance, vol. 11, no. 3, pp. 304-14.
Tharp, VK 1998, Trade your way to financial freedom, McGraw-Hill, New York.

195
Thawornwong, S & Enke, D 2003, 'Forecasting stock returns with artificial neural networks', in GP Zhang (ed.), Neural Networks in Business Forecasting, Information Science Publishing, pp. 47-79.
Thawornwong, S, Enke, D & Dagli, C 2003, 'Neural networks as a decision maker for stocktrading: a technical analysis approach', International Journal of Smart Engineering System Design, vol. 5, no. 4, pp. 313–25.
Thomsett, MC 1998, Mastering fundamental analysis, Dearborn Financial Publishing, Chicago, IL.
Thong, LF 2002, 'A study of Benjamin Graham's stock selection criteria in the Kuala Lumpur Stock Exchange', Master thesis, University of Malaya.
Tirole, J 2001, 'Corporate governance', Econometrica, vol. 69, no. 1, pp. 1-35.
Trippi, RR & Turban, E (eds) 1996, Neural networks in finance and investing: using artificial intelligence to improve real-world performance, Revised edn, Irwin Professional Publishing, Chicago.
Tsibouris, G & Zeidenberg, M 1995, 'Testing the efficient markets hypothesis with gradient descent algorithms', in A-P Refenes (ed.), Neural networks in the capital markets, John Wiley & Sons, Chichester, pp. 127-36.
UNPRI 2008, EAI and PRI join forces to internationalise the call for better investment research, United Nations Principles for Responsible Investment, viewed 11 May 2009, <http://www.unpri.org/press/eai-and-pri-join-forces-to-internationalise-the -call-for-better-investment-research-2/>.
UNPRI 2013, Investors managing $3 trillion encourage participation in the UN Global Compact, United Nations Principles for Responsible Investment, viewed 9 April 2013, <http://www.unpri.org/press/investors-managing-us-3-trillion-encourage-participation-in-the-un-global-compact/>.
Valdez-Cepeda, RD & Solano-Herrera, E 1999, 'Self-affinity of records of financial indexes', Fractals, vol. 7, no. 4, pp. 427-32.
Vanstone, BJ 2006, 'Trading in the Australian stockmarket using artificial neural networks', Doctor of Philosophy thesis, Bond University.
Vanstone, BJ & Finnie, G 2009, 'An empirical methodology for developing stockmarket trading systems using artificial neural networks', Expert Systems with Applications, vol. 36, no. 3, Part 2, pp. 6668-80.
Vanstone, BJ & Finnie, G 2010, 'Enhancing stockmarket trading performance with ANNs', Expert Systems with Applications, vol. 37, no. 9, pp. 6602-10.

196
Vanstone, BJ & Hahn, T 2010, Designing stock market trading systems: with and without soft computing, Harriman House, Hampshire.
Varga, G 2006, 'Exploring the boundary of trading and investing: application of P&F patterns to mutual fund time series data', Journal of Technical Analysis, no. 64, pp. 36-43.
Vince, R 1992, The mathematics of money management: risk analysis techniques for traders, John Wiley & Sons, New York.
Welch, B 1947, 'The generalization of "Student's" problem when several different population variances are involved', Biometrika, vol. 34, no. 1-2, pp. 28-35.
WFE 2008, Annual report and statistics 2008, World Federation of Exchanges, Paris.
—— 2011, Annual report 2011, World Federation of Exchanges, Paris.
White, H 1988, 'Economic prediction using neural networks: the case of IBM daily stock returns', in IEEE International Conference on Neural Networks, San Diego, CA, vol. 2, pp. 451-8.
Wilder, JW 1978, New concepts in technical trading systems, Trend Research, Greensboro, NC.
Williams, JB 1938, The theory of investment value, Harvard University Press, Cambridge, Mass.
Wilmott, P 2007, Paul Wilmott on quantitative finance, 3 Volume Set, John Wiley & Sons, viewed 30 July 2011, <http://vu.eblib.com.au/patron/FullRecord.aspx? p=284478>.
Winslow, T 2003, 'The foundations of Keynes's economics', in J Runde & S Mizuhara (eds), The philosophy of Keyne's economics: probability, uncertainty and convention, Routledge, London, pp. 143-58.
Wong, W-K, Manzur, M & Chew, B-K 2003, 'How rewarding is technical analysis? Evidence from Singapore stock market', Applied Financial Economics, vol. 13, no. 7, pp. 543-51.
World Bank 2009, World development indicators, The World Bank, Washington.
Yao, J & Tan, CL 2002, 'Neural networks for technical forecasting of foreign exchange rates', in K Smith & J Gupta (eds), Neural networks in business: techniques and applications, Idea Group Publishing, Hershey PA, pp. 189-204.
197
Yao, J, Tan, CL & Poh, H-L 1999, 'Neural networks for technical analysis: a study on KLCI', International Journal of Theoretical and Applied Finance, vol. 2, no. 2, pp. 221-41.
Yen, G & Lee, C-F 2008, 'Efficient market hypothesis (EMH): past, present and future', Review of Pacific Basin Financial Markets & Policies, vol. 11, no. 2, pp. 305-29.
Yu, H, Nartea, GV, Gan, C & Yao, LJ 2013, 'Predictive ability and profitability of simple technical trading rules: recent evidence from Southeast Asian stock markets', International Review of Economics and Finance, vol. 25, pp. 356-71.
Yermack, D 1996, 'Higher market valuation of companies with a small board of directors', Journal of Financial Economics, vol. 40, no. 2, pp. 185-211.
Zadeh, L 1965, 'Fuzzy sets', Information and Control, vol. 8, pp. 338-53.

198
Appendix
Appendix I FA-NNTS Returns Distributions
(a) Daily distribution
(b) Weekly distribution
(c) Monthly distribution

199
Appendix II CG-NNTS Returns Distributions
(a) Daily distribution
(b) Weekly distribution
(c) Monthly distribution

200
Appendix III TA-NNTS Returns Distributions
(a) Daily distribution
(b) Weekly distribution
(c) Monthly distribution

201
Appendix IV CFUS-NNTS Returns Distributions
(a) Daily distribution
(b) Weekly distribution
(c) Monthly distribution

202
Appendix V FUSION-NNTS Returns Distributions
(a) Daily distribution
(b) Weekly distribution
(c) Monthly distribution