Embed Size (px)
Citation preview
Published: March 07, 2011
r 2011 American Chemical Society 5692 dx.doi.org/10.1021/jp109869z | J. Phys. Chem. C 2011, 115, 5692–5707
ARTICLE
pubs.acs.org/JPCC
Further Understanding of the Electronic Interactions between N719Sensitizer and Anatase TiO2 Films: A Combined X-ray Absorption andX-ray Photoelectron Spectroscopic StudyKee Eun Lee,*,† Mario A. Gomez,† Tom Regier,‡ Yongfeng Hu,‡ and George P. Demopoulos*,†
†Materials Engineering, McGill University, Montreal, Canada H3A 2B2‡Canadian Light Source Inc., University of Saskatchewan, 101 Perimeter Road, Saskatoon, Canada S7N 0X4
bS Supporting Information
’ INTRODUCTION
Dye-sensitized solar cells (DSSC) have become an activefield of research since they hold a lot of promise because of theuse of an abundant and benign semiconductor material, TiO2.
1
Binding of the dye to the TiO2 substrate plays a key role in theefficiency of DSSC because electron transfer depends on thebinding mode.2 A question that also remains of interest iswhether all nanocrystalline anatase substrates behave in thesame manner chemically and electronically. For example, poly-crystalline titania nanotubes were thought to offer advantages ofdirected electron transport and higher electron mobility3,4
compared to sintered TiO2 nanoparticle films, yet macroscopicmeasurements have shown their electron mobility to be as lowas that of nanoparticle thin films. Recent studies by Richter andSchmuttenmaer5 have proposed that this lack of electronmobility is due to exciton-like trap states. Thus, our aqueous-
produced TiO2material has motivated us to investigate how thebonding, electronic interactions, and electrical performancesmay vary in nanocrystalline anatase films. Our previous studyusing vibrational spectroscopy and confocal Raman imagingdemonstrated that indeed different surface bonding properties(covalent and H-bonding) and distributions for two differentlysynthesized nanocrystalline anatase substrates were observed.6,7 Asa result, a subsequent study to investigate how the electronicinteraction in our aqueous and commercial products comparedis presented in this paper via the use of core-level surface-sensitive spectroscopies (X-ray adsorption and photoelectronspectroscopy).
Received: October 14, 2010Revised: February 11, 2011
ABSTRACT: In this study, the electronic properties of N719 adsorbed onto anatasewere comparably investigated by using X-ray absorption spectroscopy (XAS) andX-ray photoelectron spectroscopy (XPS) techniques. Sensitized TiO2 films madefrom two different nanocrystalline anatase powders were investigated: a commercialone (Solaronix) and our synthetic variety produced through aqueous synthesis. Thiswas done to investigate how our aqueous-produced nanocrystalline anatase substratescompared with commercial products and to observe whether both nanocrystallineanatase anodes behaved in a similar manner in terms of their bonding and electronicinteractions. Surface coordination changes to Ti-Ogroups previously reported via TiK-edge extended X-ray absorption fine structure (EXAFS) data [using transmission or fluorescence yield (FY)] between the pureTiO2 and the adsorbed state were not observed in our measurements via the Ti L or K X-ray absorption near-edge structure(XANES) (nor EXAFS) data for both substrates via a surface-sensitive detection technique (total electron yield, TEY). This is likelydue to the probing depth of TEY mode (5-10 nm), in which the coordination changes that occur to the surface groups, whichshould in turn affect the XANES spectrum, are not observed at Ti K- or L-edge XANES spectrum. The C and N K-edge XANESspectra of theN719 adsorbed onto twoTiO2 films were for the first time evaluated in this work. From the CK-edge XANES data, thespectral changes revealed that additional electronic states occur between dye molecules and TiO2 surface. The C K-edge XANESspectra allowed us to propose that electronic interactions do not only occur through the covalent bonding of the anchoring groupsbut also through the aromatic electron density of the bipyridine groups and the d states found in TiO2. This was further confirmedvia XPS analysis by monitoring the N bipyridine groups before and after sensitization. XPS used in combination with XAS (in TEYmode) provided complementary information owing to its higher surface sensitivity. The Ti 2p and O 1s XPS spectra showed thatadsorption of the dye on TiO2 leads to a change of the surface dipole and/or a change in the Fermi level position in the band gap,which shifts all the core levels of TiO2. These are not equal for both TiO2 substrates in spite of them being nanocrystallnine anatase.This effect was found to be greater for the N719-aqueous TiO2 system than the respective Solaronix one. For the N 1s and S 2pXPS, the shift toward higher energy indicated that there exists an additional H-bonding interaction of the NCS ligand of the dyemolecule with the TiO2 surface groups (OH/H2O).
5693 dx.doi.org/10.1021/jp109869z |J. Phys. Chem. C 2011, 115, 5692–5707
The Journal of Physical Chemistry C ARTICLE
X-ray absorption spectroscopy (XAS) is a perfect probe toinvestigate coordination changes that occur around an element ofinterest in both the X-ray absorption near-edge structure(XANES) and the extended X-ray absorption fine structure(EXAFS) regions. XANES in particular can be used to investigatethe local coordination chemistry (octahedral, tetrahedral), mo-lecular orbitals interactions (p-d hybridization), band structure(density of unoccupied electronic states), and spin state (high orlow spin) of materials at the bulk and interfaces.8-10 Morespecifically, XANES at the L2,3-edge of transition metal cations(such as 3d0 ions Ti4þ or Ca2þ) are dominated by exchangeinteractions, spin-orbit splitting, and crystal field effects, whichmakes it a perfect probing tool to study coordination states.11-14
Therefore, L2,3-edge XANES probes the electronic structure andcrystal field details within the first coordination sphere (e.g.,surface) and bulk depending upon which decay channel is usedfor detection [total electron yield (TEY), surface (5-10 nm);fluorescence yield (FY), bulk (g50 nm)]. In addition to theL-edge XANES, the K-edge XANES spectra of transition metalsalso offer the advantages of sensitivity to coordination states asshown extensively in the literature.15-19
Several groups have studied the interface properties of dye/TiO2 by X-ray absorption spectroscopy to elucidate electrontransfer mechanism. Ju et al.20 reported an XAS study on the TiK-edge of TiO2 nanoparticles of 10-20 nm with and without anassembly of N3 dye. They suggested that the coordinationnumbers for the TiO2/N3 interface were 2.7 (NTi-O) and 2.2(NTi-Ti), in comparison to the coordination number of theisolated TiO2 nanoparticles (4.0 forNTi-O and 1.6 forNTi-Ti) asderived from their fitted EXAFS data, which were measured intransmission mode. These findings were interpreted as a result ofthe reconstruction of Ti local structure upon adsorption of theN3 dye on the TiO2 surface. However, it should be noted thattheir XAS spectra at the Ti K-edge were measured in transmis-sion mode, which is not surface-sensitive. Similarly, Zubavichuset al.21 characterized Ru complexes (N719 and black dye)adsorbed on anatase TiO2 using Ti K-edge XAS (XANES andEXAFS) in combination with out-of-plane X-ray diffraction(XRD) and X-ray photoelectron spectroscopy (XPS) analysis.In their Ti K-edge XANES spectrum, the uniform enhancementof the pre-edge peaks was suggested to correspond to higherdistortions of a local Ti coordination in the coated samples, asthis is forbidden in the centrosymmetric octahedral environment.The EXAFS data measured via fluorescence yield supported theirinterpretation of the XANES spectrum. The coordination num-bersNTi-O andNTi-Ti were drastically diminished (2.8 and 1.4)in comparison with those for the uncoated sample (4.6 and 2.7),because coating with the dyes led to a stronger distortion of thelocal environment of Ti atoms in anatase nanoparticles.21 Theircalculated coordination numbers are different than those sug-gested by Ju et al.20 Furthermore, it may be noted that FY at TiK-edge detects mostly the bulk, unless the dye coating is verythick; that is, this approach is not interface-sensitive.
In terms of XPS studies, the adsorption orientation andelectronic coupling of N3 onto TiO2 have been studied in anumber of publications.22-24 Rensmo et al.22 conducted XPSstudies of Ru-polypyridine complexes for solar cell application,in which they reported the C 1s, O 1s, N 1s, and S 2p spectra tosupport the general picture of bonding via the carboxyl groups ofa single bi-isonicotic acid ligand of the complex. For themeasurement of N3 with TiO2, they concluded that the -NCSligand to TiO2 interaction was small. Later on, Johansson et al.23
compared the electronic and molecular structure of the dyes(black dye, N3, and N719) adsorbed onto nanostructured TiO2
using PES (photoelectron spectroscopy). In their study, theyproposed that a fraction of the -NCS groups interacts with theTiO2 surface through the sulfur atoms on the basis of their S 2pspectra. From the O 1s spectrum of N719 on TiO2, they deducedthe -OH units in carboxylic acid groups to be at a larger distancefrom the TiO2 surface than carboxylated oxygen, indicating thatN719 is anchored to the TiO2 surface through carboxylatedgroups, partly having TBAþ (tetrabutylammonium ion) ascounterion. Moreover, from the N 1s spectrum, the TBAþ
counterions were found to be at the surface, although theamounts were clearly smaller than expected from the molecularformula. Similary, Mayor et al.24 reported an experimental studyof the bonding geometry and electronic coupling of the N3 dyeadsorbed on rutile TiO2, via the (110) plane along withsupporting theoretical calculations. In their study, the carboxylicgroups of one bi-isonicotic acid ligand deprotonated so that its Oatoms bonded to the Ti atoms of the substrate and one of thethiocyanate groups bonded via a S atom to an O atom of the Tisubstrate. Their density functional theory (DFT) calculationssupported that this geometry was energetically more favorablethan the bonding of one carboxylic group from each bi-isonicoticacid ligand.
In this paper, two nanocrystalline TiO2 (commercial and ouraqueous synthetic) and their dye-coated counterparts have beenstudied via XAS (X-ray absorption spectroscopy) and XPS (X-ray photoelectron spectroscopy) techniques. The experimentalTi L,K-edge, O K-edge, C K-edge, and N K-edge XANES spectrawere employed to monitor the bonding (coordination) effectsand interactions on the electronic structure of N719{(bis(tetrabutylammonium)[cis-di(thiocyanato)-bis(2,20-bipyri-dyl-4-carboxylate-40-carboxylic acid)ruthenium(II)]} on two dis-tinct anatase TiO2 films. All XAS measurements were conductedin TEYmode for improved surface/interface sensitivity. XPS wasfurther employed for better surface sensitivity to monitor thesurface interactions between the two different anatase substratesand their sensitized counterparts. The O 1s XPS data were usedto estimate the amount ofOH groups on the surface of pure TiO2
(Solaronix and aqueous) substrate. The N 1s and S 2p XPS datawas used tomonitor the chemical interactions occurring betweenthese groups and the TiO2 surfaces. Finally, the C1s data are usedto observe surface contamination before dye adsorption.
’EXPERIMENTAL SECTION
Sample Preparation.The N719 {bis(tetrabutylammonium)-[cis-di(thiocyanato)-bis(2,20-bipyridyl-4-carboxylate-40-carboxylicacid)ruthenium(II)]} used in this work was obtained fromDyesol. The electronic study of the N719 involved two nanos-tructured TiO2 (both anatase; one commercial, Solaronix (Ti-Nanoxide T20), and one synthesized in our laboratory, aqueous25)films prepared by paste deposition, annealing, and sensitization.The commercially available Solaronix TiO2 (15-20 nm) wasproduced by hydrothermal reaction, and our synthetic variety(5-10 nm) was produced through aqueous synthesis (TEMimage in Figure S1, Supporting Information). Preparation of theaqueous TiO2 paste followed the procedure of Ito et al.26 TiO2
electrodes were prepared by screen-printing on fluorine tin oxide(FTO) glass substrates (Nippon Sheet Glass with a sheetresistance of 10 Ω per square). The TiO2 paste was spread outonto FTO glass and sintered at 450 �C in air for 30 min, yielding
5694 dx.doi.org/10.1021/jp109869z |J. Phys. Chem. C 2011, 115, 5692–5707
The Journal of Physical Chemistry C ARTICLE
a 5-8 μm thick nanostructured anatase film, measured by aDektak 3 surface profile measuring system. Dye adsorption wasperformed by immersing the TiO2 electrodes for 24 h in a 0.3 mMsolution of N719 at room temperature. The coated TiO2 was rinsedthoroughly with ethanol to remove physisorbed dye molecules.In the case of sample preparation of neat dye for XANES
measurement, 5 mg of dye was dissolved in 0.25 mL of ethanol,stirred, and put in an ultrasonic bath for 30 s. Approximately0.01 mL was dropped onto a 5 � 5 mm gold-coated Si wafer(unpolished). The ethanol was allowed to evaporate, leaving alayer of sample that was estimated to be 100 μm thick or more.For XPSmeasurement, the neat dye was prepared similarly to theone in XANES measurement.X-rayAbsorptionNear-EdgeStructure.XANES spectrawere
obtained at the Canadian Light Source (CLS) on the sphericalgrating monochromator (SGM) beamline (ΔE/E = ∼10-4) forthe Ti L-edge, O K-edge, N K-edge, and C K-edge. XANESspectra were recorded in surface-sensitive total electron yield(TEY) mode by use of specimen current and in bulk-sensitivefluorescence yield (FY) mode by use of a multichannel platedetector under high vacuum (5� 10-8 Torr). For the C K-edgemeasurements, a 100 nm Ti filter was placed in the beamline toreduce the contribution of the O K-edge excited by second-orderlight.27 C K-edge spectra were normalized to the incident photonflux as recorded by a photodiode (AXUV100). All other spectrawere normalized to the incident flux recorded with Au mesh(85% transmission). The energy calibrations at the Ti L3,2-edgeand the O K-edge were conducted on the basis of TiO2 anatasepowder and literature values.28,29 Carbon K-edge and nitrogenK-edge were calibrated by use of CO and N2 gas, respectively. TiK-edge was conducted at the SXRMB beamline with a step size of0.3 eV and in TEY mode.X-ray Photoelectron Spectroscopy. XPS measurements
were conducted in a Thermo Scientific K-Alpha, using an Al KRX-ray source at 1486.6 eV. The base pressure was ∼10-10 Torr.High-resolution spectra were obtained at a perpendicular takeoffangle, with a pass energy of 20 eV and steps of 0.05 eV. Spectralpeaks were separated by use of the VG Avantage program, andthe Shirley background was subtracted. The scale of the bindingenergy was calibrated against Au (4f7/2). No effects due tocharging or X-ray damage were observed during the experiment.Cell Fabrication and Photovoltaic Measurements. A sand-
witch-type cell was assembled to measure the I-V curves. As acounterelectrode, a Pt layer was prepared by spreading one dropof 5 mM H2PtCl6 solution (2-propanol), air-drying, and then
heating at 380� for 30 min. For the photoanode, the TiCl4pretreatment was applied before TiO2 paste was screen-printedon the FTO glass.26 The thickness of photoanodes is∼10-12 μmfor both TiO2 without the scattering layer. A 60 μm thick thermo-plastic film (Meltonix 1170-60 Series, Solaronix) was employedto seal the two electrodes, and a commercial electrolyte solution(EL-HPE, Dyesol) was filled through the hole on the Ptelectrode. The current-voltage curves were measured by useof a small-area solar simulator (PV Measurements Inc., ModelSASS). The replicate tests of I-Vmeasurements were performedfor better accuracy. A tungsten lamp was used to provide uniformlight approximating the AM 1.5 global reference spectrum to a1 cm diameter test region. The light intensity was adjusted with aSi reference cell.
’RESULTS AND DISCUSSION
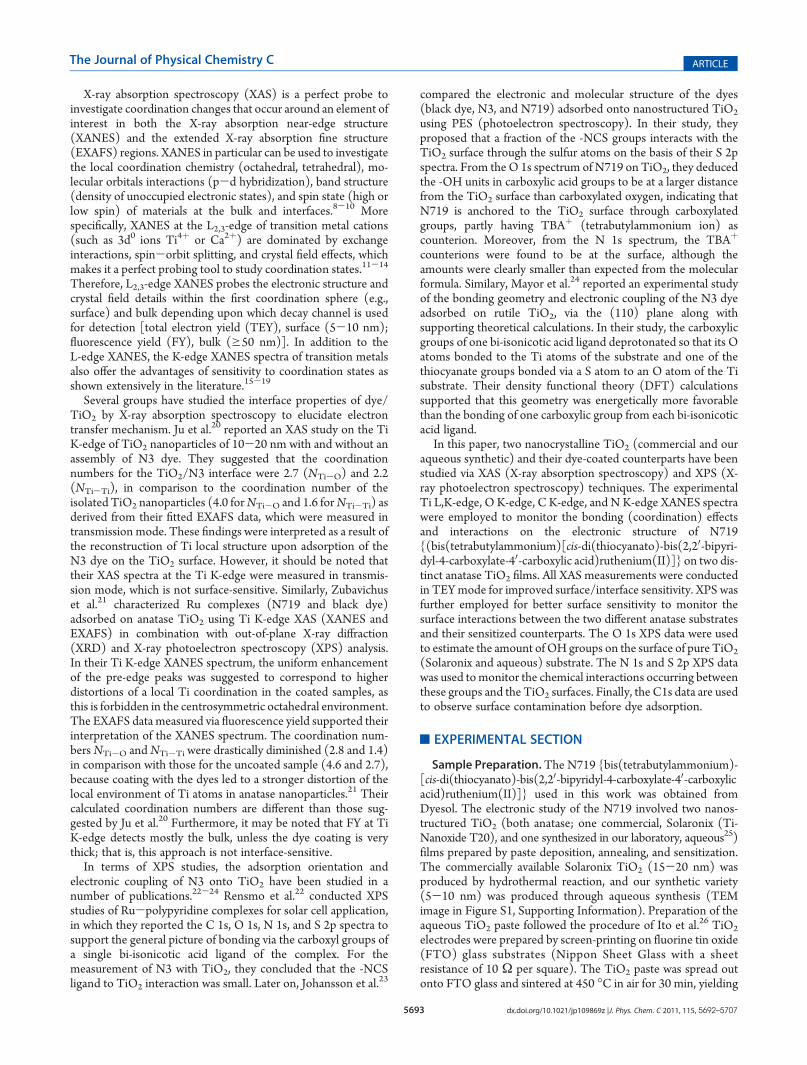
X-ray Absorption Near-Edge Structure. Titanium K-edge.Previous EXAFS studies via the Ti K-edge20,21 have indicatedthat the coordination of Ti-O is changed when the COOHgroup of the dye molecules is adsorbed onto TiO2, as describedin the Introduction. This in turn should modify significantly thecrystal field of the surface-interacting TiO2 nanoparticles as aresult of the coordination change that occurs from the pure stateto the adsorbed state in which bidentate bonding occurs betweenthe dye molecule and TiO2. Such coordination changes shouldthen be clearly observed in the Ti L- or K-edge XANESspectra.11,15,16,30 Thus, the motivation of our XAS study usingthe surface-sensitive TEYmode at the Ti L,K-edge and OK-edgeXANES is to observe and verify these coordination changes forthe dye-coated TiO2 in comparison to the pure TiO2, and toobserve whether any differences occur between the two distinctanatase nanocrystalline substrates (our aqueous and commercial).Figure 1 shows the Ti L-edge XANES spectra of the pure TiO2
andN719 dye-coated TiO2 for the commercial Solaronix and ourlab-based aqueous anatase. For pure TiO2, the XANES spectracontain weak pre-edge peaks, denoted S1 and S2.
27 The spectraalso consist of the usual sets of peaks, denoted L3 and L2 in thehigher photon energy. The L3 features (a1 and a2) result from thedipole-allowed transition of 2p3/2 to the final state of Ti 3d5/2,and the L2 peaks (b1 and b2) are derived from the transition of2p1/2 to the final state of Ti 3d3/2 ((Δl = (1, Δj = 0, (1); thecharacter of these states is modified by the combined spin-orbitand crystal field interactions.27-29 According to the work of deGroot et al.,30 the peaks of L2 are broader due to the shorterlifetime of its excited state, since L2 has extra decay channels
Figure 1. Titanium L-edge XANES spectra of TiO2 and N719-adsorbed TiO2 films: (a) Solaronix; (b) aqueous.
5695 dx.doi.org/10.1021/jp109869z |J. Phys. Chem. C 2011, 115, 5692–5707
The Journal of Physical Chemistry C ARTICLE
compared to L3. As the crystal field splits the 3d state of Ti intotwo levels, t2g and eg, each L peak represents two contributions,a01 (b1) and a02 (b2), respectively. Furthermore, the eg peak of theL3-edge has an asymmetry or an additional splitting (a002) that isthe XANES fingerprint for the crystallographic phases of anatase.The reason for different relative intensities between a2 (a002) and b1(b2) peaks has been discussed by a number of publications.30-33
It has been known that the additional splitting is due todistortions from octahedral symmetry.30,31 However, currentwork by Kruger32,33 has mentioned that the distortion of theTiO6 octahedra is not a sufficient condition to describe the L3(eg)peak splitting since there is no splitting for an isolated (distorted)TiO6 octahedron. Also, his analysis showed that the distortion isnot even a necessary condition since ideal rutile made fromundistorted octahedral also shows a L3(eg) peak splitting ofabout the same width as real rutile. Kruger’s analysis, using thefirst-principles multichannel multiple-scattering method with aparticle-hole wave function, clearly shows that the L3(eg) peaksplitting is not a local effect. Therefore it can be explained withneither atomic crystal field theory nor TiO6 charge transfermodels. Instead it is a nonlocal effect that requires a quite precisedescription of the Ti 3d band structure, which is possible only byuse of k-space band structure or large cluster calculations.32,33
As can be seen from Figure 1, the dye-coated TiO2 Ti 2pXANES spectrum is virtually identical to that of anatase withoutdye in terms of splitting and symmetry of peaks, but theirintensity differs. At this point, it is worthwhile to remind thereader that, in XAS, the core electron is excited to a bound state;that is, we probe the empty density of states (empty orbitals inchemical terms), and as such, transitions (“peaks”) are observedonly if these states are unoccupied. Moreover, the intensity of theXAS peaks can also be qualitatively used to estimate the densityof unoccupied states for the particular transitions as observed inliterature work.34,35 In spite of the fact that both Solaronix andour synthetic substrate are nanocrystalline anatase films, thedensity of states (as indicated from the intensity of the XANESspectra) for the L3(t2g and eg) orbital varies significantly once thedyemolecule is adsorbed in both anatase substrates. For example,in the case of the dye-adsorbed Solaronix TiO2, the intensity ofthe L3(t2g) orbital is much higher than in the pure TiO2,indicating that once the N719 bonds to the surface, the densityof states of these lower-energy electronic states in TiO2 becomefree (unoccupied) and as suchmay be the ones that are filled lateronce the injection process occurs. For our aqueous TiO2
substrate, we observe a completely different behavior than thatobserved in the Solaronix; namely, the density of states for L3(t gand eg) remains the same before and after dye adsorption. In thecase of aqueous TiO2, the splitting of L3(eg)/L30(eg) peak in thedyed TiO2 is less sharp than the one in the pure TiO2 or theSolaronix case. The peaks in the range of 465 eV are alsobroadened, which is likely attributed to some degree of localstructure change in TiO2 nanoparticles. However, most of thespectral structural change that is observed for the TiO2 XANESbefore and after dye adsorption is little to none in both anatasesubstrates. This was rather unexpected since the XANES spec-trum at the L-edge is a very sensitive probe to coordination oftransitionmetals such as Ti4þ systems11,13 and as that reported inprevious studies for the K-edge.20,21 The simplest interpretationis that most of the XANES TEY signal comes from the Ti atomsfar from the dye-TiO2 interface; in other words, even the TEYmode (which can probe 5-10 nm)36 is not sufficiently surface-sensitive to monitor the interface coordination changes in two
distinct nanocrystalline anatase substrates. This then raisesquestions about the EXAFS data reported by Ju et al.20 andZubavichus et al.,21 in which they reported to have detectedsurface coordination changes to the Ti-O bonds of the pureand adsorbed states using less sensitive detection techniques(transmission and FY). However, as shown by our XANES TiL-edge (and later K-edge) data in TEY detection mode, the pureand adsorbed states gave rise to the same XANES spectrum,indicating that no changes to their crystal field (and thereforetheir coordination of the surface groups) could be observed upondye adsorption, in spite of the fact we used even more surface-sensitive techniques than Ju et al.20 and Zubavichus et al.21 If thisis not the case (i.e., surface sensitivity), then it would mean thatthe Ti L-edge spectrum of the interface Ti atoms is not influencedby dye adsorption. However, the latter case is unlikely, and it isthe lack of surface sensitivity of the TEY mode of the Ti L-edgethat does not allow us to see the coordination changes to thesurface TiO2 group upon dye adsorption. Auger electron yield(AEY) or partial electron yield (PEY)may be sensitive enough todetect these changes in coordination states, but this is beyond thescope of the present study.Another reason that we may not see a difference in the Ti
L-edge XANES signals from the coated versus uncoated samplesis that a very small amount of the Ti signal actually comes fromthe TiO2 that is interacting with the dye. Even though the surfacearea in our nanocrystalline anatase is high, the TiO2 that isinteracting with the dye onlymakes up a small fraction of the totalTiO2 that is giving us the signal. Thus one is looking for a verysmall effect on top of a large background in the present study andthose of previous works.20,21
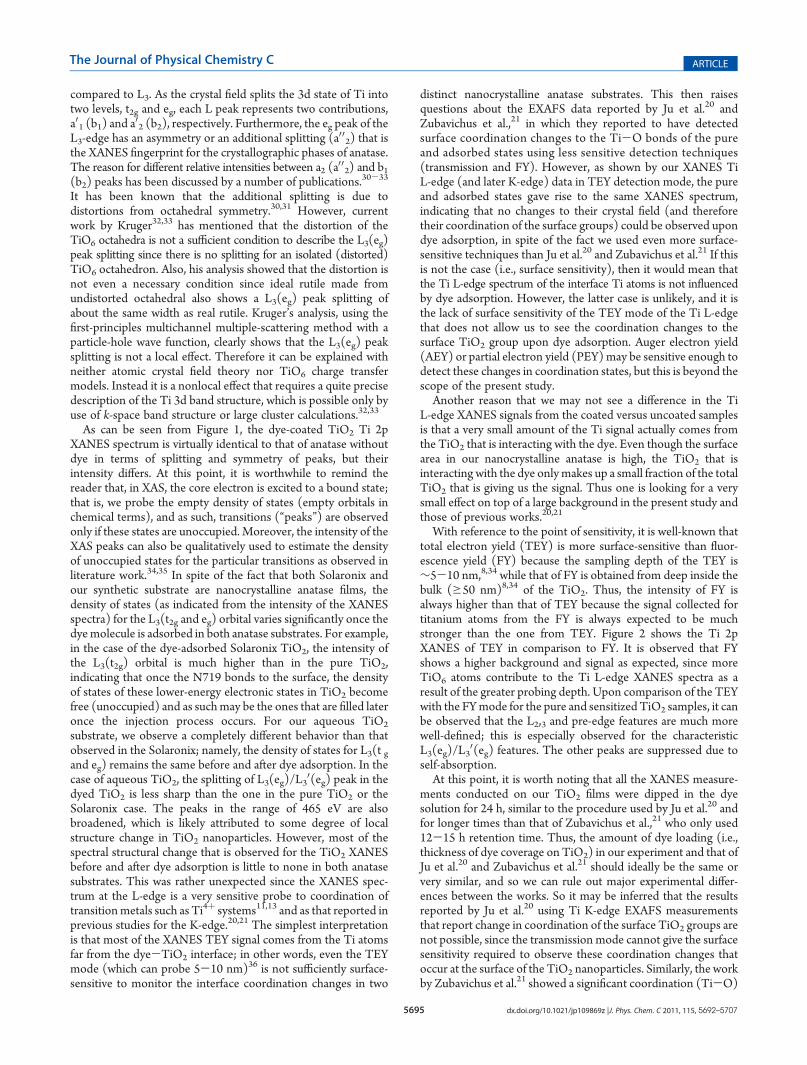
With reference to the point of sensitivity, it is well-known thattotal electron yield (TEY) is more surface-sensitive than fluor-escence yield (FY) because the sampling depth of the TEY is∼5-10 nm,8,34 while that of FY is obtained from deep inside thebulk (g50 nm)8,34 of the TiO2. Thus, the intensity of FY isalways higher than that of TEY because the signal collected fortitanium atoms from the FY is always expected to be muchstronger than the one from TEY. Figure 2 shows the Ti 2pXANES of TEY in comparison to FY. It is observed that FYshows a higher background and signal as expected, since moreTiO6 atoms contribute to the Ti L-edge XANES spectra as aresult of the greater probing depth. Upon comparison of the TEYwith the FYmode for the pure and sensitized TiO2 samples, it canbe observed that the L2,3 and pre-edge features are much morewell-defined; this is especially observed for the characteristicL3(eg)/L30(eg) features. The other peaks are suppressed due toself-absorption.At this point, it is worth noting that all the XANES measure-
ments conducted on our TiO2 films were dipped in the dyesolution for 24 h, similar to the procedure used by Ju et al.20 andfor longer times than that of Zubavichus et al.,21 who only used12-15 h retention time. Thus, the amount of dye loading (i.e.,thickness of dye coverage on TiO2) in our experiment and that ofJu et al.20 and Zubavichus et al.21 should ideally be the same orvery similar, and so we can rule out major experimental differ-ences between the works. So it may be inferred that the resultsreported by Ju et al.20 using Ti K-edge EXAFS measurementsthat report change in coordination of the surface TiO2 groups arenot possible, since the transmission mode cannot give the surfacesensitivity required to observe these coordination changes thatoccur at the surface of the TiO2 nanoparticles. Similarly, the workby Zubavichus et al.21 showed a significant coordination (Ti-O)
5696 dx.doi.org/10.1021/jp109869z |J. Phys. Chem. C 2011, 115, 5692–5707
The Journal of Physical Chemistry C ARTICLE
change using the FY mode at the Ti K-edge, but as previouslydiscussed, these two types of detection modes are more bulk-sensitive than electron yield. In our studies, via the Ti L-edgeXANES in surface-sensitive TEY mode, coordination changes tothe TiO2 surface groups of both subsrates could not be observedin spite of the fact that the L-edge XANES is a perfect probe tomeasure these coordination changes around Ti atoms.9,11,13
Therefore, to clarify the above point, we decided to furtherconduct Ti K-edge measurements using the total electron yieldmode, which should in theory be more surface-sensitive than theFY and transmission measurements, to further verify our L-edgefindings. XPS measurements were also applied to investigate theseinteractions of dye-TiO2 in both substrates with the advantageof giving even greater surface sensitivity than TEY mode.
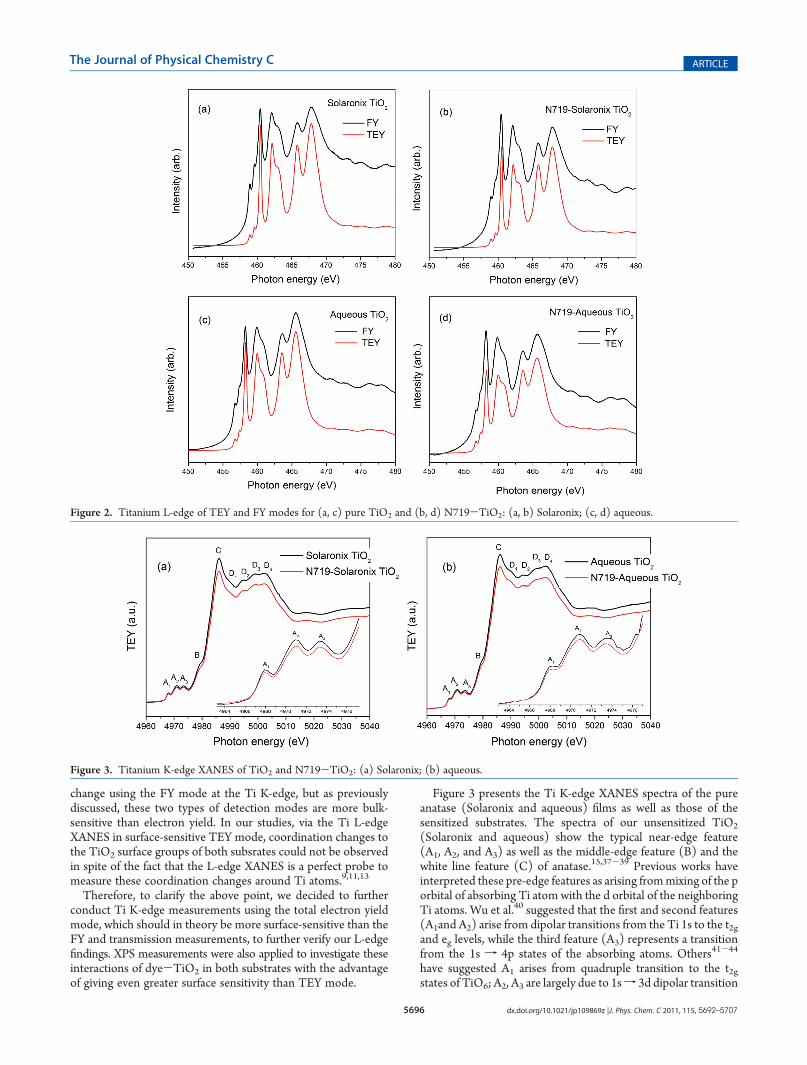
Figure 3 presents the Ti K-edge XANES spectra of the pureanatase (Solaronix and aqueous) films as well as those of thesensitized substrates. The spectra of our unsensitized TiO2
(Solaronix and aqueous) show the typical near-edge feature(A1, A2, and A3) as well as the middle-edge feature (B) and thewhite line feature (C) of anatase.15,37-39 Previous works haveinterpreted these pre-edge features as arising frommixing of the porbital of absorbing Ti atom with the d orbital of the neighboringTi atoms. Wu et al.40 suggested that the first and second features(A1and A2) arise from dipolar transitions from the Ti 1s to the t2gand eg levels, while the third feature (A3) represents a transitionfrom the 1s f 4p states of the absorbing atoms. Others41-44
have suggested A1 arises from quadruple transition to the t2gstates of TiO6; A2, A3 are largely due to 1sf 3d dipolar transition
Figure 2. Titanium L-edge of TEY and FY modes for (a, c) pure TiO2 and (b, d) N719-TiO2: (a, b) Solaronix; (c, d) aqueous.
Figure 3. Titanium K-edge XANES of TiO2 and N719-TiO2: (a) Solaronix; (b) aqueous.
5697 dx.doi.org/10.1021/jp109869z |J. Phys. Chem. C 2011, 115, 5692–5707
The Journal of Physical Chemistry C ARTICLE
to the t2 g and eg orbital of the neighboring octahedral. Zubavichuset al.,21 on the basis of previous works,45,46 attributed these pre-edge triplets to quadrupole (A1) and dipole (A2, A3) 1s f 3dtransitions due to distortions of the centrosymetric Oh environ-ment with participation of the valence p states of the titanium andoxygen atoms; while features B and C were attributed to a 1sf4p transition and promotion of a photoelectron to higher vacantnp states of Ti and Ti-O antibonding states in the coordinationenvironment of Ti.45-49 Furthermore, in this study21 a weak butclear splitting of the A2 feature was observed by looking at thederivative (dμ/dE) of XANES spectra; this was attributed topentacoordinated surface Ti atoms as it corresponded to theirfitted EXAFS coordination numbers.In our case, if we consider the Ti K-edge XANES spectrum
(Figure 3), then we observe substantial damping of the white lineand post-edge features in the sensitized sample in comparison tothe pure TiO2 substrates as that observed by Zubavichus et al.,
21
but we do not observe the enhancement of the pre-edge features in thesensitized samples (rather the opposite occurs). Similar observations asours (damping of white line and post-edge features) have also beenreported by Chen et al.38 for ascorbic acid onto TiO2 nanocrystalline;these enhancements of pre-edge features were correlated to the higherdistortions of the local Ti coordination in the sensitized samples.The derivative of our Ti K-edge XANES data (Figure S2,
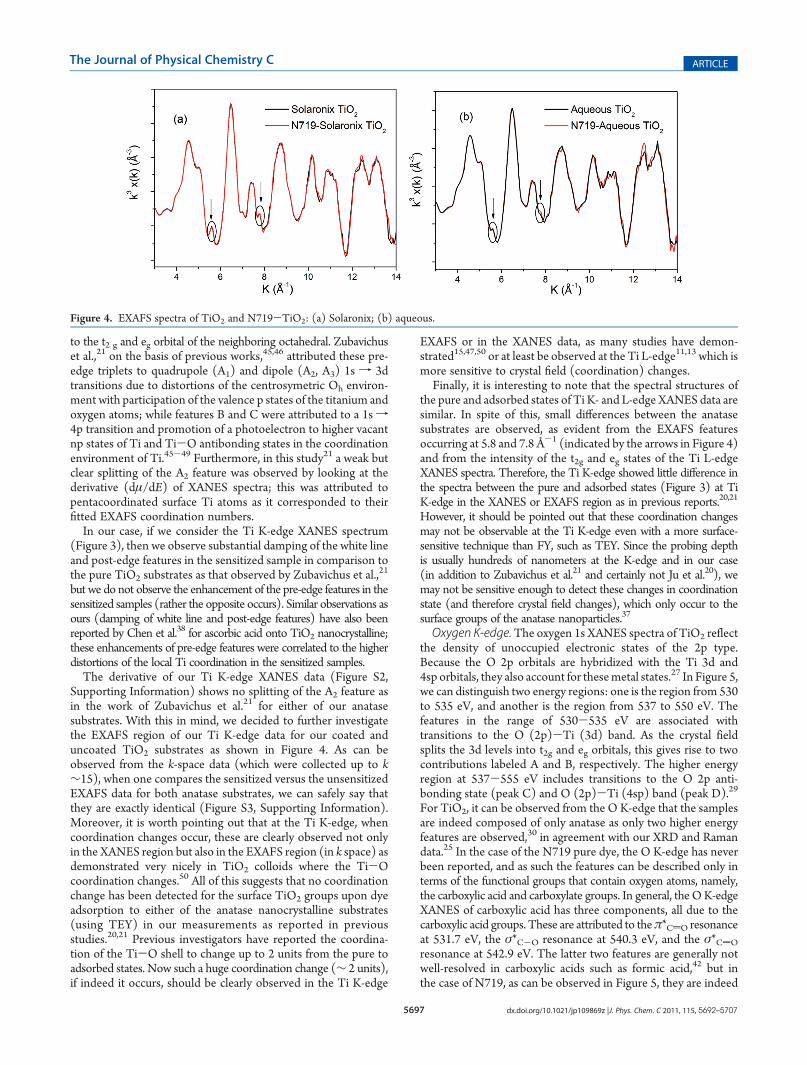
Supporting Information) shows no splitting of the A2 feature asin the work of Zubavichus et al.21 for either of our anatasesubstrates. With this in mind, we decided to further investigatethe EXAFS region of our Ti K-edge data for our coated anduncoated TiO2 substrates as shown in Figure 4. As can beobserved from the k-space data (which were collected up to k∼15), when one compares the sensitized versus the unsensitizedEXAFS data for both anatase substrates, we can safely say thatthey are exactly identical (Figure S3, Supporting Information).Moreover, it is worth pointing out that at the Ti K-edge, whencoordination changes occur, these are clearly observed not onlyin the XANES region but also in the EXAFS region (in k space) asdemonstrated very nicely in TiO2 colloids where the Ti-Ocoordination changes.50 All of this suggests that no coordinationchange has been detected for the surface TiO2 groups upon dyeadsorption to either of the anatase nanocrystalline substrates(using TEY) in our measurements as reported in previousstudies.20,21 Previous investigators have reported the coordina-tion of the Ti-O shell to change up to 2 units from the pure toadsorbed states. Now such a huge coordination change (∼ 2 units),if indeed it occurs, should be clearly observed in the Ti K-edge
EXAFS or in the XANES data, as many studies have demon-strated15,47,50 or at least be observed at the Ti L-edge11,13 which ismore sensitive to crystal field (coordination) changes.Finally, it is interesting to note that the spectral structures of
the pure and adsorbed states of Ti K- and L-edge XANES data aresimilar. In spite of this, small differences between the anatasesubstrates are observed, as evident from the EXAFS featuresoccurring at 5.8 and 7.8 Å-1 (indicated by the arrows in Figure 4)and from the intensity of the t2g and eg states of the Ti L-edgeXANES spectra. Therefore, the Ti K-edge showed little difference inthe spectra between the pure and adsorbed states (Figure 3) at TiK-edge in the XANES or EXAFS region as in previous reports.20,21
However, it should be pointed out that these coordination changesmay not be observable at the Ti K-edge even with a more surface-sensitive technique than FY, such as TEY. Since the probing depthis usually hundreds of nanometers at the K-edge and in our case(in addition to Zubavichus et al.21 and certainly not Ju et al.20), wemay not be sensitive enough to detect these changes in coordinationstate (and therefore crystal field changes), which only occur to thesurface groups of the anatase nanoparticles.37
Oxygen K-edge.The oxygen 1s XANES spectra of TiO2 reflectthe density of unoccupied electronic states of the 2p type.Because the O 2p orbitals are hybridized with the Ti 3d and4sp orbitals, they also account for thesemetal states.27 In Figure 5,we can distinguish two energy regions: one is the region from 530to 535 eV, and another is the region from 537 to 550 eV. Thefeatures in the range of 530-535 eV are associated withtransitions to the O (2p)-Ti (3d) band. As the crystal fieldsplits the 3d levels into t2g and eg orbitals, this gives rise to twocontributions labeled A and B, respectively. The higher energyregion at 537-555 eV includes transitions to the O 2p anti-bonding state (peak C) and O (2p)-Ti (4sp) band (peak D).29
For TiO2, it can be observed from the O K-edge that the samplesare indeed composed of only anatase as only two higher energyfeatures are observed,30 in agreement with our XRD and Ramandata.25 In the case of the N719 pure dye, the O K-edge has neverbeen reported, and as such the features can be described only interms of the functional groups that contain oxygen atoms, namely,the carboxylic acid and carboxylate groups. In general, theOK-edgeXANES of carboxylic acid has three components, all due to thecarboxylic acid groups. These are attributed to theπ*CdO resonanceat 531.7 eV, the σ*C-O resonance at 540.3 eV, and the σ*CdO
resonance at 542.9 eV. The latter two features are generally notwell-resolved in carboxylic acids such as formic acid,42 but inthe case of N719, as can be observed in Figure 5, they are indeed
Figure 4. EXAFS spectra of TiO2 and N719-TiO2: (a) Solaronix; (b) aqueous.
5698 dx.doi.org/10.1021/jp109869z |J. Phys. Chem. C 2011, 115, 5692–5707
The Journal of Physical Chemistry C ARTICLE
well-resolved; this is likely due to the high resolution power at theSGM. The feature at 533.9 eV is well-pronounced and -resolvedbut does not generally appear in the XANES spectra of carboxylicacid, so we can only qualitatively attribute this to a π*COO- typeof feature from the carboxyl groups that form part of the N719molecule. In the case of dye-adsorbedTiO2 samples, theOK-edge isalmost identical with that of pure TiO2; moreover, the N719character of the COOH and COO- groups has completelydisappeared. Thus, itmay be inferred that theOK-edge is insensitiveto show any structural change before and after dye adsorption. Asresult of this, further investigation on the oxygen edge via XPSwas conducted and will be discussed in the Oxygen 1s section.Since the O K-edge was found to be dominated by TiO2
contributions, we decided to investigate the changes occurring tothe dye molecules after adsorption by looking at XAS spectra forthe Carbon K-edge and Nitrogen K-edge.
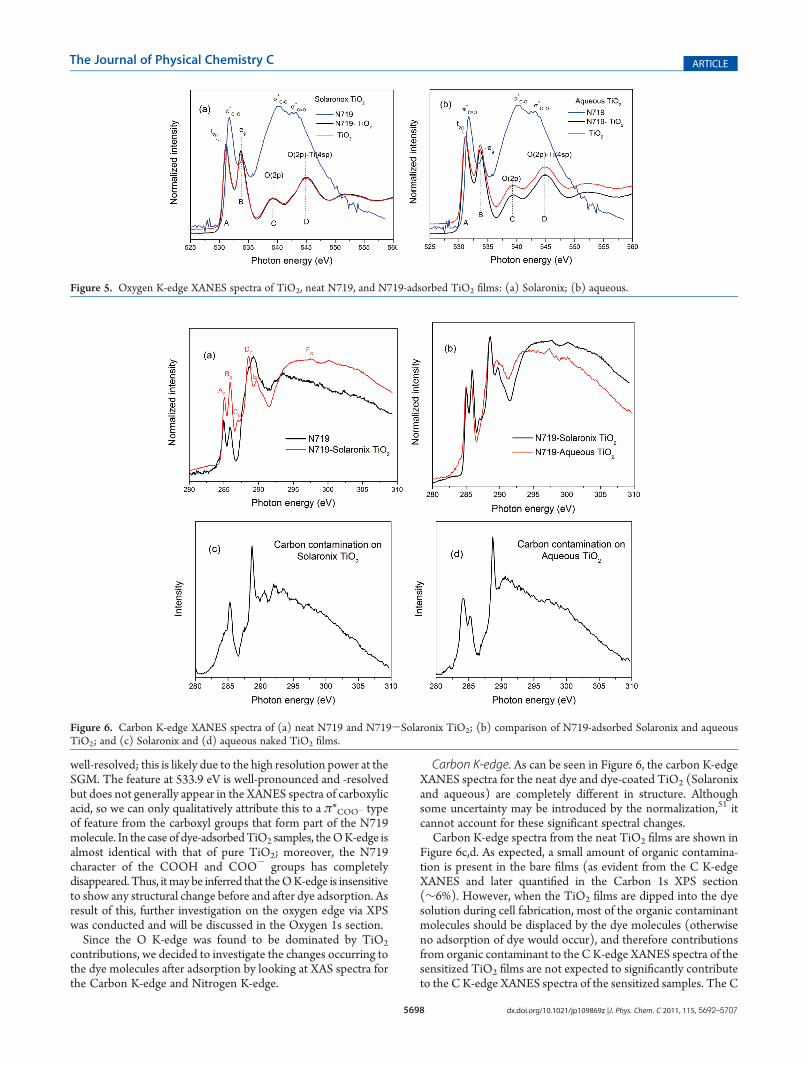
Carbon K-edge. As can be seen in Figure 6, the carbon K-edgeXANES spectra for the neat dye and dye-coated TiO2 (Solaronixand aqueous) are completely different in structure. Althoughsome uncertainty may be introduced by the normalization,51 itcannot account for these significant spectral changes.Carbon K-edge spectra from the neat TiO2 films are shown in
Figure 6c,d. As expected, a small amount of organic contamina-tion is present in the bare films (as evident from the C K-edgeXANES and later quantified in the Carbon 1s XPS section(∼6%). However, when the TiO2 films are dipped into the dyesolution during cell fabrication, most of the organic contaminantmolecules should be displaced by the dye molecules (otherwiseno adsorption of dye would occur), and therefore contributionsfrom organic contaminant to the CK-edge XANES spectra of thesensitized TiO2 films are not expected to significantly contributeto the C K-edge XANES spectra of the sensitized samples. The C
Figure 5. Oxygen K-edge XANES spectra of TiO2, neat N719, and N719-adsorbed TiO2 films: (a) Solaronix; (b) aqueous.
Figure 6. Carbon K-edge XANES spectra of (a) neat N719 and N719-Solaronix TiO2; (b) comparison of N719-adsorbed Solaronix and aqueousTiO2; and (c) Solaronix and (d) aqueous naked TiO2 films.
5699 dx.doi.org/10.1021/jp109869z |J. Phys. Chem. C 2011, 115, 5692–5707
The Journal of Physical Chemistry C ARTICLE
K-edge XANES in Solaronix and aqueous TiO2 show the organiccontamination from the air.As can be seen, the C K-edge XANES spectra for pure TiO2
(Solaronix and aqueous) show the carbon contamination on ourneat TiO2 films (Figure 6c,d). Interestingly, the CK-edge spectraare different for Solaronix and aqueous TiO2, implying that eachsamplemay contain different types of carbon contamination. Thepeak around 285 eV may indicate π-π* transition of CdC inaromatic ring and/or amorphous carbon. The sharp peak at 288eV corresponds to σ* resonances of the CdO in CO2. Interest-ingly, it is worth noting that these features from the organiccontaminants are in a slightly different energy region in compar-ison with the C K-edge spectrum of dye-coated TiO2. All CK-edge data presented in this paper were energy-calibrated withCO. For clear comparison, we overlaid the C K-edge spectra ofthe pure TiO2 and dye-coated TiO2 sample (Figure S4, Support-ing Information). As can be seen, the carbon contamination fromneat TiO2 does not appear to have a significant contribution tothe C K-edge XANES spectrum for the dye coated TiO2 surface.In this work, the C K-edge assignment of dye and dye-coated
TiO2 is based on previous XANES studies for bi-isonicotic acid,which is the binding ligand of N719.51,52 For the neat N719 dye,the strong narrow peak at∼285 eV arises from transitions to thering π* state, the peak at 288 eV is from the C 1sf π* resonanceof CdO group, and the broad peak above 295 eV corresponds toC 1s f σ* transitions. Generally, peaks AC and BC can beassigned to signals arising from the inequivalent C atoms in thepyridyl rings and/or the carboxyl side groups. However, thesetwo peak transitions are assumed to occur solely from ring C 1sf π* resonances as determined by computation conducted byThomas et al.52 A small peak at 287 eV (CC) observed in theadsorbed sample is a new feature, which is not observed in theneat N719 and may be assigned to a C 1sf π* transition in therange of pyridine rings, indicating that there are additionalelectronic states between dye molecules and TiO2 surface incomparison to the neat dye. The clear feature at 288.5 eV (peakDC) arises from C 1sf π* resonance in pyridine and the peak at289.7 eV (peak EC) is believed to be a C 1s f π* transitionarising from the carbon in COOH/COO- groups.We also observethe typical broad peaks from C 1s to σ* transitions above 295 eV(FC), which are analogous to the peaks seen in pyridine.51-53
In addition to theπ* changes, there are other differences in theσ* region in the spectra that again indicate slight modification ofthe electronic structure around the pyridine structures once thedye molecules are adsorbed onto TiO2. From these spectralchanges to the XANES spectrum, it seems reasonable to proposethat the aromatic electronic density from pyridine should interactwith TiO2 electron density once the N719 molecule is adsorbed,a feature that has not been considered by any previous electronicstudies on this system.54 Interestingly, according to the study byKaneko et al.,55 on ruthenium complexes without binding groups(COOH or COO-), such as tris(2,20-bipyridine)rutheniumdichloride [Ru(bpy)3] and tris(bipyrimidine)ruthenium(II),these were found to also generate photocurrent; which indi-cates that electrostatic interactions of adsorption onto theTiO2 also contribute to producing current. These electronicinteractions may be generated between π-π orbital interac-tion in pyridines and the d states found in TiO2. Thus we canassume that, in the N719-TiO2 system, electronic interactionsoccur not only through the covalent bonding of the anchoringgroups but also through the aromatic electron density of thebipyridine groups.
Furthermore, it is interesting to compare the electronic interac-tions that occur between the N719 molecule and two anatasesubstrates, namely, Solaronix and our aqueous product. FromFigure 6b, it can be observed that when the dye is adsorbed ontoSolaronix and aqueous TiO2, the C K-edge spectra show no realsubstantial spectral differences. Both of the dyed samples exhibitsp2 and sp3 character with similar peak features but with someshift in energies to the EC peak and the broad σ* features.To gain some experimental information on the adsorption
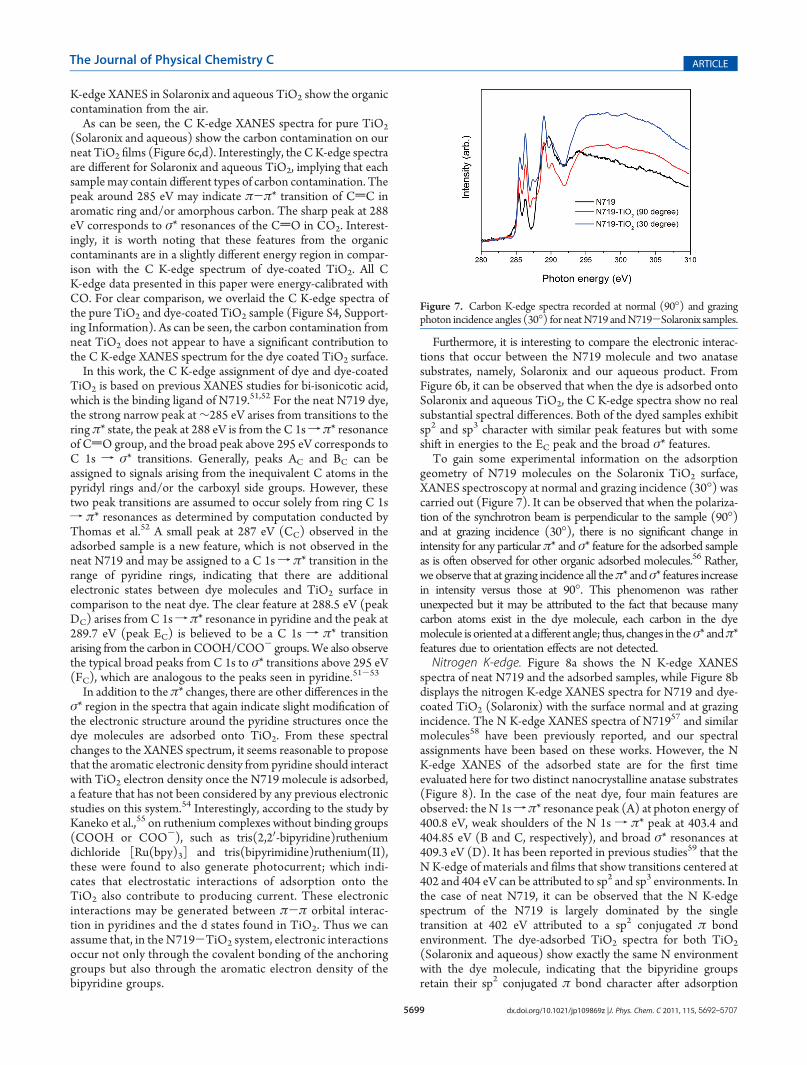
geometry of N719 molecules on the Solaronix TiO2 surface,XANES spectroscopy at normal and grazing incidence (30�) wascarried out (Figure 7). It can be observed that when the polariza-tion of the synchrotron beam is perpendicular to the sample (90�)and at grazing incidence (30�), there is no significant change inintensity for any particular π* and σ* feature for the adsorbed sampleas is often observed for other organic adsorbed molecules.56 Rather,we observe that at grazing incidence all theπ* andσ* features increasein intensity versus those at 90�. This phenomenon was ratherunexpected but it may be attributed to the fact that because manycarbon atoms exist in the dye molecule, each carbon in the dyemolecule is oriented at a different angle; thus, changes in theσ* andπ*features due to orientation effects are not detected.Nitrogen K-edge. Figure 8a shows the N K-edge XANES
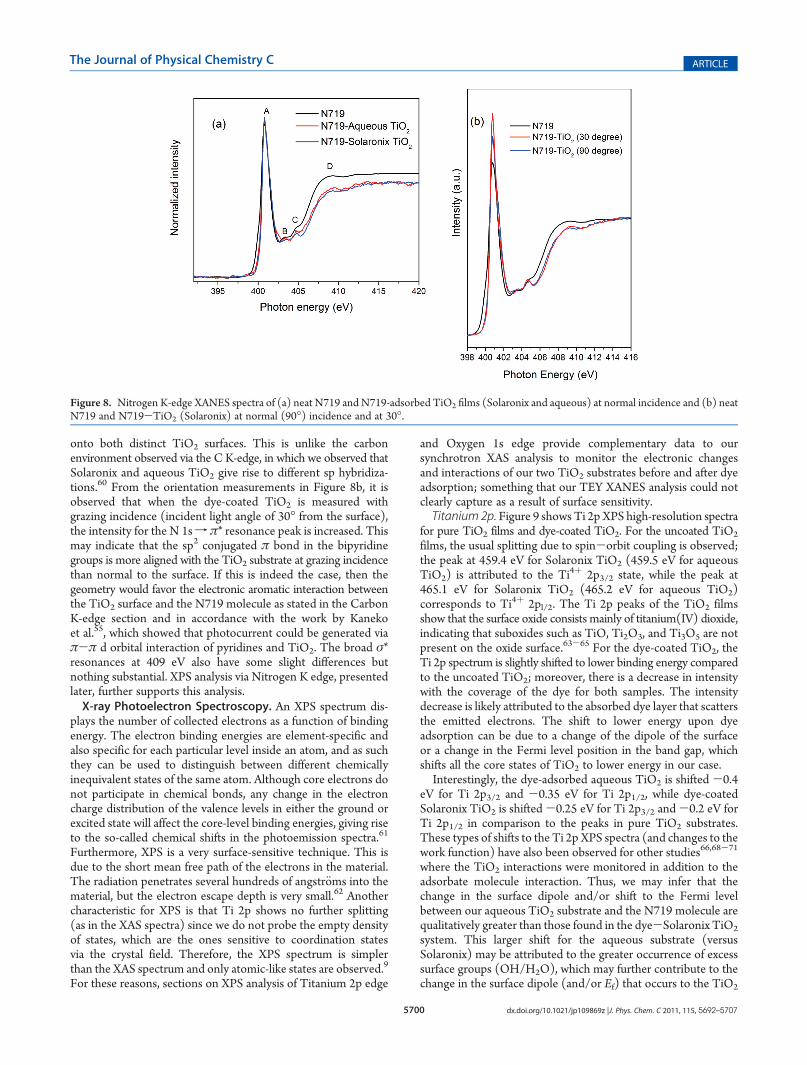
spectra of neat N719 and the adsorbed samples, while Figure 8bdisplays the nitrogen K-edge XANES spectra for N719 and dye-coated TiO2 (Solaronix) with the surface normal and at grazingincidence. The N K-edge XANES spectra of N71957 and similarmolecules58 have been previously reported, and our spectralassignments have been based on these works. However, the NK-edge XANES of the adsorbed state are for the first timeevaluated here for two distinct nanocrystalline anatase substrates(Figure 8). In the case of the neat dye, four main features areobserved: the N 1sfπ* resonance peak (A) at photon energy of400.8 eV, weak shoulders of the N 1s f π* peak at 403.4 and404.85 eV (B and C, respectively), and broad σ* resonances at409.3 eV (D). It has been reported in previous studies59 that theN K-edge of materials and films that show transitions centered at402 and 404 eV can be attributed to sp2 and sp3 environments. Inthe case of neat N719, it can be observed that the N K-edgespectrum of the N719 is largely dominated by the singletransition at 402 eV attributed to a sp2 conjugated π bondenvironment. The dye-adsorbed TiO2 spectra for both TiO2
(Solaronix and aqueous) show exactly the same N environmentwith the dye molecule, indicating that the bipyridine groupsretain their sp2 conjugated π bond character after adsorption
Figure 7. Carbon K-edge spectra recorded at normal (90�) and grazingphoton incidence angles (30�) for neatN719 andN719-Solaronix samples.
5700 dx.doi.org/10.1021/jp109869z |J. Phys. Chem. C 2011, 115, 5692–5707
The Journal of Physical Chemistry C ARTICLE
onto both distinct TiO2 surfaces. This is unlike the carbonenvironment observed via the C K-edge, in which we observed thatSolaronix and aqueous TiO2 give rise to different sp hybridiza-tions.60 From the orientation measurements in Figure 8b, it isobserved that when the dye-coated TiO2 is measured withgrazing incidence (incident light angle of 30� from the surface),the intensity for the N 1sf π* resonance peak is increased. Thismay indicate that the sp2 conjugated π bond in the bipyridinegroups is more aligned with the TiO2 substrate at grazing incidencethan normal to the surface. If this is indeed the case, then thegeometry would favor the electronic aromatic interaction betweenthe TiO2 surface and the N719 molecule as stated in the CarbonK-edge section and in accordance with the work by Kanekoet al.55, which showed that photocurrent could be generated viaπ-π d orbital interaction of pyridines and TiO2. The broad σ*resonances at 409 eV also have some slight differences butnothing substantial. XPS analysis via Nitrogen K edge, presentedlater, further supports this analysis.X-ray Photoelectron Spectroscopy. An XPS spectrum dis-
plays the number of collected electrons as a function of bindingenergy. The electron binding energies are element-specific andalso specific for each particular level inside an atom, and as suchthey can be used to distinguish between different chemicallyinequivalent states of the same atom. Although core electrons donot participate in chemical bonds, any change in the electroncharge distribution of the valence levels in either the ground orexcited state will affect the core-level binding energies, giving riseto the so-called chemical shifts in the photoemission spectra.61
Furthermore, XPS is a very surface-sensitive technique. This isdue to the short mean free path of the electrons in the material.The radiation penetrates several hundreds of angstr€oms into thematerial, but the electron escape depth is very small.62 Anothercharacteristic for XPS is that Ti 2p shows no further splitting(as in the XAS spectra) since we do not probe the empty densityof states, which are the ones sensitive to coordination statesvia the crystal field. Therefore, the XPS spectrum is simplerthan the XAS spectrum and only atomic-like states are observed.9
For these reasons, sections on XPS analysis of Titanium 2p edge
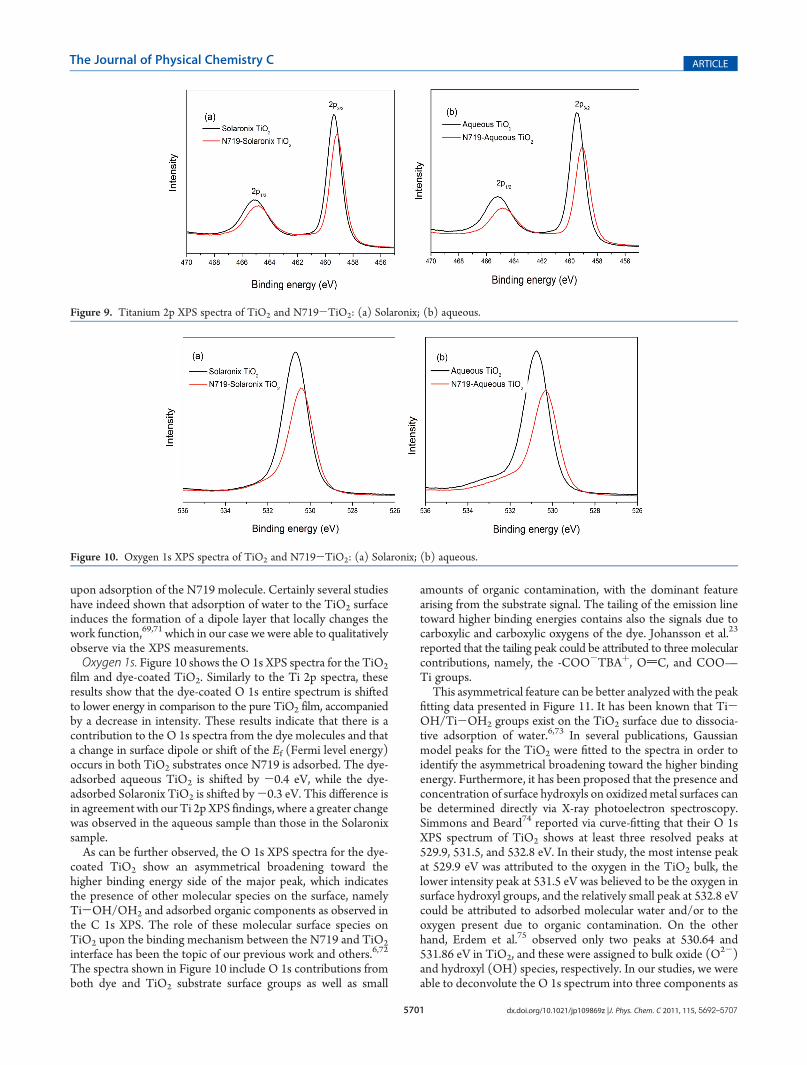
and Oxygen 1s edge provide complementary data to oursynchrotron XAS analysis to monitor the electronic changesand interactions of our two TiO2 substrates before and after dyeadsorption; something that our TEY XANES analysis could notclearly capture as a result of surface sensitivity.Titanium 2p. Figure 9 shows Ti 2p XPS high-resolution spectra
for pure TiO2 films and dye-coated TiO2. For the uncoated TiO2
films, the usual splitting due to spin-orbit coupling is observed;the peak at 459.4 eV for Solaronix TiO2 (459.5 eV for aqueousTiO2) is attributed to the Ti4þ 2p3/2 state, while the peak at465.1 eV for Solaronix TiO2 (465.2 eV for aqueous TiO2)corresponds to Ti4þ 2pl/2. The Ti 2p peaks of the TiO2 filmsshow that the surface oxide consists mainly of titanium(IV) dioxide,indicating that suboxides such as TiO, Ti2O3, and Ti3O5 are notpresent on the oxide surface.63-65 For the dye-coated TiO2, theTi 2p spectrum is slightly shifted to lower binding energy comparedto the uncoated TiO2; moreover, there is a decrease in intensitywith the coverage of the dye for both samples. The intensitydecrease is likely attributed to the absorbed dye layer that scattersthe emitted electrons. The shift to lower energy upon dyeadsorption can be due to a change of the dipole of the surfaceor a change in the Fermi level position in the band gap, whichshifts all the core states of TiO2 to lower energy in our case.Interestingly, the dye-adsorbed aqueous TiO2 is shifted -0.4
eV for Ti 2p3/2 and -0.35 eV for Ti 2p1/2, while dye-coatedSolaronix TiO2 is shifted-0.25 eV for Ti 2p3/2 and-0.2 eV forTi 2p1/2 in comparison to the peaks in pure TiO2 substrates.These types of shifts to the Ti 2p XPS spectra (and changes to thework function) have also been observed for other studies66,68-71
where the TiO2 interactions were monitored in addition to theadsorbate molecule interaction. Thus, we may infer that thechange in the surface dipole and/or shift to the Fermi levelbetween our aqueous TiO2 substrate and the N719 molecule arequalitatively greater than those found in the dye-Solaronix TiO2
system. This larger shift for the aqueous substrate (versusSolaronix) may be attributed to the greater occurrence of excesssurface groups (OH/H2O), which may further contribute to thechange in the surface dipole (and/or Ef) that occurs to the TiO2
Figure 8. Nitrogen K-edge XANES spectra of (a) neat N719 and N719-adsorbed TiO2 films (Solaronix and aqueous) at normal incidence and (b) neatN719 and N719-TiO2 (Solaronix) at normal (90�) incidence and at 30�.
5701 dx.doi.org/10.1021/jp109869z |J. Phys. Chem. C 2011, 115, 5692–5707
The Journal of Physical Chemistry C ARTICLE
upon adsorption of the N719 molecule. Certainly several studieshave indeed shown that adsorption of water to the TiO2 surfaceinduces the formation of a dipole layer that locally changes thework function,69,71 which in our case we were able to qualitativelyobserve via the XPS measurements.Oxygen 1s. Figure 10 shows the O 1s XPS spectra for the TiO2
film and dye-coated TiO2. Similarly to the Ti 2p spectra, theseresults show that the dye-coated O 1s entire spectrum is shiftedto lower energy in comparison to the pure TiO2 film, accompaniedby a decrease in intensity. These results indicate that there is acontribution to the O 1s spectra from the dye molecules and thata change in surface dipole or shift of the Ef (Fermi level energy)occurs in both TiO2 substrates once N719 is adsorbed. The dye-adsorbed aqueous TiO2 is shifted by -0.4 eV, while the dye-adsorbed Solaronix TiO2 is shifted by-0.3 eV. This difference isin agreement with our Ti 2p XPS findings, where a greater changewas observed in the aqueous sample than those in the Solaronixsample.As can be further observed, the O 1s XPS spectra for the dye-
coated TiO2 show an asymmetrical broadening toward thehigher binding energy side of the major peak, which indicatesthe presence of other molecular species on the surface, namelyTi-OH/OH2 and adsorbed organic components as observed inthe C 1s XPS. The role of these molecular surface species onTiO2 upon the binding mechanism between the N719 and TiO2
interface has been the topic of our previous work and others.6,72
The spectra shown in Figure 10 include O 1s contributions fromboth dye and TiO2 substrate surface groups as well as small
amounts of organic contamination, with the dominant featurearising from the substrate signal. The tailing of the emission linetoward higher binding energies contains also the signals due tocarboxylic and carboxylic oxygens of the dye. Johansson et al.23
reported that the tailing peak could be attributed to three molecularcontributions, namely, the -COO-TBAþ, OdC, and COO—Ti groups.This asymmetrical feature can be better analyzed with the peak
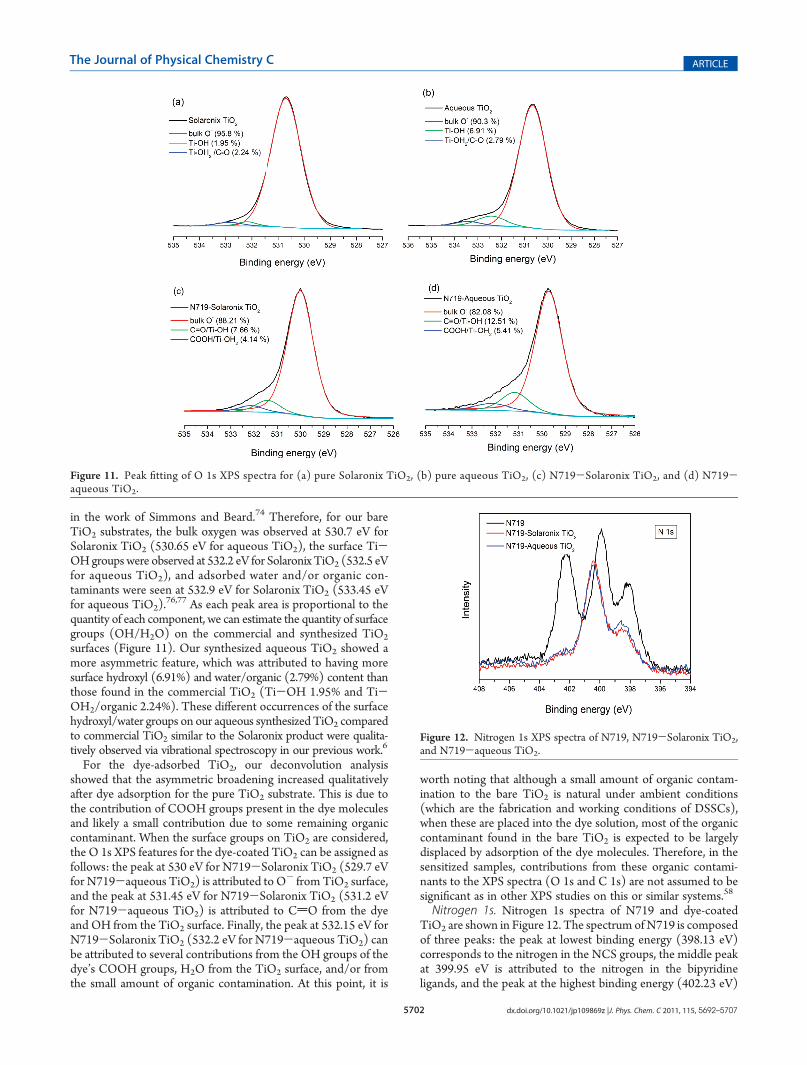
fitting data presented in Figure 11. It has been known that Ti-OH/Ti-OH2 groups exist on the TiO2 surface due to dissocia-tive adsorption of water.6,73 In several publications, Gaussianmodel peaks for the TiO2 were fitted to the spectra in order toidentify the asymmetrical broadening toward the higher bindingenergy. Furthermore, it has been proposed that the presence andconcentration of surface hydroxyls on oxidizedmetal surfaces canbe determined directly via X-ray photoelectron spectroscopy.Simmons and Beard74 reported via curve-fitting that their O 1sXPS spectrum of TiO2 shows at least three resolved peaks at529.9, 531.5, and 532.8 eV. In their study, the most intense peakat 529.9 eV was attributed to the oxygen in the TiO2 bulk, thelower intensity peak at 531.5 eV was believed to be the oxygen insurface hydroxyl groups, and the relatively small peak at 532.8 eVcould be attributed to adsorbed molecular water and/or to theoxygen present due to organic contamination. On the otherhand, Erdem et al.75 observed only two peaks at 530.64 and531.86 eV in TiO2, and these were assigned to bulk oxide (O
2-)and hydroxyl (OH) species, respectively. In our studies, we wereable to deconvolute the O 1s spectrum into three components as
Figure 9. Titanium 2p XPS spectra of TiO2 and N719-TiO2: (a) Solaronix; (b) aqueous.
Figure 10. Oxygen 1s XPS spectra of TiO2 and N719-TiO2: (a) Solaronix; (b) aqueous.
5702 dx.doi.org/10.1021/jp109869z |J. Phys. Chem. C 2011, 115, 5692–5707
The Journal of Physical Chemistry C ARTICLE
in the work of Simmons and Beard.74 Therefore, for our bareTiO2 substrates, the bulk oxygen was observed at 530.7 eV forSolaronix TiO2 (530.65 eV for aqueous TiO2), the surface Ti-OHgroups were observed at 532.2 eV for Solaronix TiO2 (532.5 eVfor aqueous TiO2), and adsorbed water and/or organic con-taminants were seen at 532.9 eV for Solaronix TiO2 (533.45 eVfor aqueous TiO2).
76,77 As each peak area is proportional to thequantity of each component, we can estimate the quantity of surfacegroups (OH/H2O) on the commercial and synthesized TiO2
surfaces (Figure 11). Our synthesized aqueous TiO2 showed amore asymmetric feature, which was attributed to having moresurface hydroxyl (6.91%) and water/organic (2.79%) content thanthose found in the commercial TiO2 (Ti-OH 1.95% and Ti-OH2/organic 2.24%). These different occurrences of the surfacehydroxyl/water groups on our aqueous synthesized TiO2 comparedto commercial TiO2 similar to the Solaronix product were qualita-tively observed via vibrational spectroscopy in our previous work.6
For the dye-adsorbed TiO2, our deconvolution analysisshowed that the asymmetric broadening increased qualitativelyafter dye adsorption for the pure TiO2 substrate. This is due tothe contribution of COOH groups present in the dye moleculesand likely a small contribution due to some remaining organiccontaminant. When the surface groups on TiO2 are considered,the O 1s XPS features for the dye-coated TiO2 can be assigned asfollows: the peak at 530 eV for N719-Solaronix TiO2 (529.7 eVfor N719-aqueous TiO2) is attributed to O
- from TiO2 surface,and the peak at 531.45 eV for N719-Solaronix TiO2 (531.2 eVfor N719-aqueous TiO2) is attributed to CdO from the dyeand OH from the TiO2 surface. Finally, the peak at 532.15 eV forN719-Solaronix TiO2 (532.2 eV for N719-aqueous TiO2) canbe attributed to several contributions from the OH groups of thedye’s COOH groups, H2O from the TiO2 surface, and/or fromthe small amount of organic contamination. At this point, it is
worth noting that although a small amount of organic contam-ination to the bare TiO2 is natural under ambient conditions(which are the fabrication and working conditions of DSSCs),when these are placed into the dye solution, most of the organiccontaminant found in the bare TiO2 is expected to be largelydisplaced by adsorption of the dye molecules. Therefore, in thesensitized samples, contributions from these organic contami-nants to the XPS spectra (O 1s and C 1s) are not assumed to besignificant as in other XPS studies on this or similar systems.58
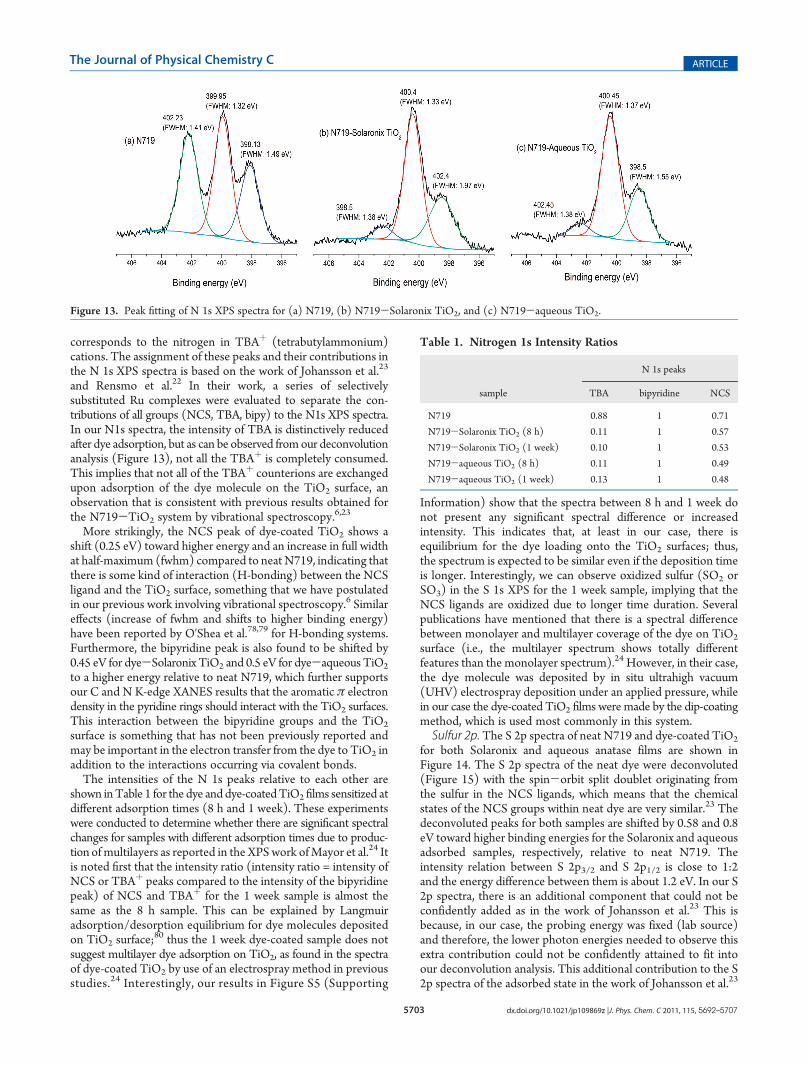
Nitrogen 1s. Nitrogen 1s spectra of N719 and dye-coatedTiO2 are shown in Figure 12. The spectrum ofN719 is composedof three peaks: the peak at lowest binding energy (398.13 eV)corresponds to the nitrogen in the NCS groups, the middle peakat 399.95 eV is attributed to the nitrogen in the bipyridineligands, and the peak at the highest binding energy (402.23 eV)
Figure 11. Peak fitting of O 1s XPS spectra for (a) pure Solaronix TiO2, (b) pure aqueous TiO2, (c) N719-Solaronix TiO2, and (d) N719-aqueous TiO2.
Figure 12. Nitrogen 1s XPS spectra of N719, N719-Solaronix TiO2,and N719-aqueous TiO2.
5703 dx.doi.org/10.1021/jp109869z |J. Phys. Chem. C 2011, 115, 5692–5707
The Journal of Physical Chemistry C ARTICLE
corresponds to the nitrogen in TBAþ (tetrabutylammonium)cations. The assignment of these peaks and their contributions inthe N 1s XPS spectra is based on the work of Johansson et al.23
and Rensmo et al.22 In their work, a series of selectivelysubstituted Ru complexes were evaluated to separate the con-tributions of all groups (NCS, TBA, bipy) to the N1s XPS spectra.In our N1s spectra, the intensity of TBA is distinctively reducedafter dye adsorption, but as can be observed fromour deconvolutionanalysis (Figure 13), not all the TBAþ is completely consumed.This implies that not all of the TBAþ counterions are exchangedupon adsorption of the dye molecule on the TiO2 surface, anobservation that is consistent with previous results obtained forthe N719-TiO2 system by vibrational spectroscopy.6,23
More strikingly, the NCS peak of dye-coated TiO2 shows ashift (0.25 eV) toward higher energy and an increase in full widthat half-maximum (fwhm) compared to neat N719, indicating thatthere is some kind of interaction (H-bonding) between the NCSligand and the TiO2 surface, something that we have postulatedin our previous work involving vibrational spectroscopy.6 Similareffects (increase of fwhm and shifts to higher binding energy)have been reported by O'Shea et al.78,79 for H-bonding systems.Furthermore, the bipyridine peak is also found to be shifted by0.45 eV for dye-Solaronix TiO2 and 0.5 eV for dye-aqueous TiO2
to a higher energy relative to neat N719, which further supportsour C and N K-edge XANES results that the aromatic π electrondensity in the pyridine rings should interact with the TiO2 surfaces.This interaction between the bipyridine groups and the TiO2
surface is something that has not been previously reported andmay be important in the electron transfer from the dye to TiO2 inaddition to the interactions occurring via covalent bonds.The intensities of the N 1s peaks relative to each other are
shown inTable 1 for the dye and dye-coatedTiO2 films sensitized atdifferent adsorption times (8 h and 1 week). These experimentswere conducted to determine whether there are significant spectralchanges for samples with different adsorption times due to produc-tion of multilayers as reported in the XPSwork ofMayor et al.24 Itis noted first that the intensity ratio (intensity ratio = intensity ofNCS or TBAþ peaks compared to the intensity of the bipyridinepeak) of NCS and TBAþ for the 1 week sample is almost thesame as the 8 h sample. This can be explained by Langmuiradsorption/desorption equilibrium for dye molecules depositedon TiO2 surface;
80 thus the 1 week dye-coated sample does notsuggest multilayer dye adsorption on TiO2, as found in the spectraof dye-coated TiO2 by use of an electrospray method in previousstudies.24 Interestingly, our results in Figure S5 (Supporting
Information) show that the spectra between 8 h and 1 week donot present any significant spectral difference or increasedintensity. This indicates that, at least in our case, there isequilibrium for the dye loading onto the TiO2 surfaces; thus,the spectrum is expected to be similar even if the deposition timeis longer. Interestingly, we can observe oxidized sulfur (SO2 orSO3) in the S 1s XPS for the 1 week sample, implying that theNCS ligands are oxidized due to longer time duration. Severalpublications have mentioned that there is a spectral differencebetween monolayer and multilayer coverage of the dye on TiO2
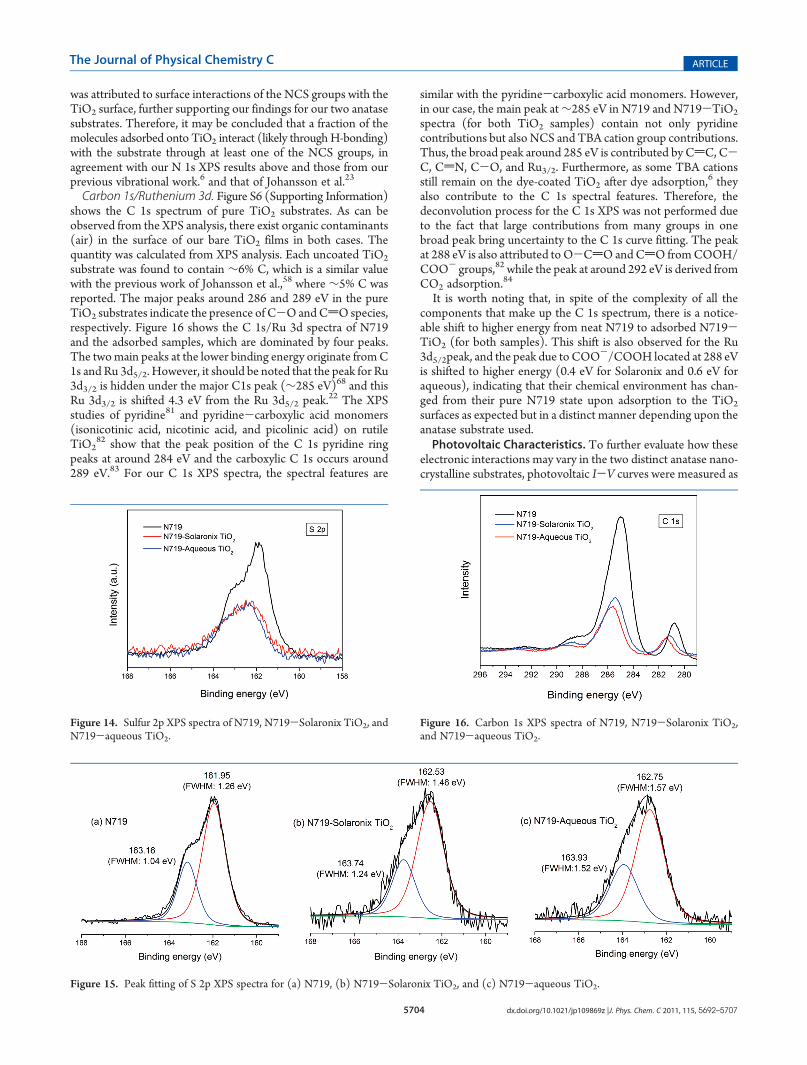
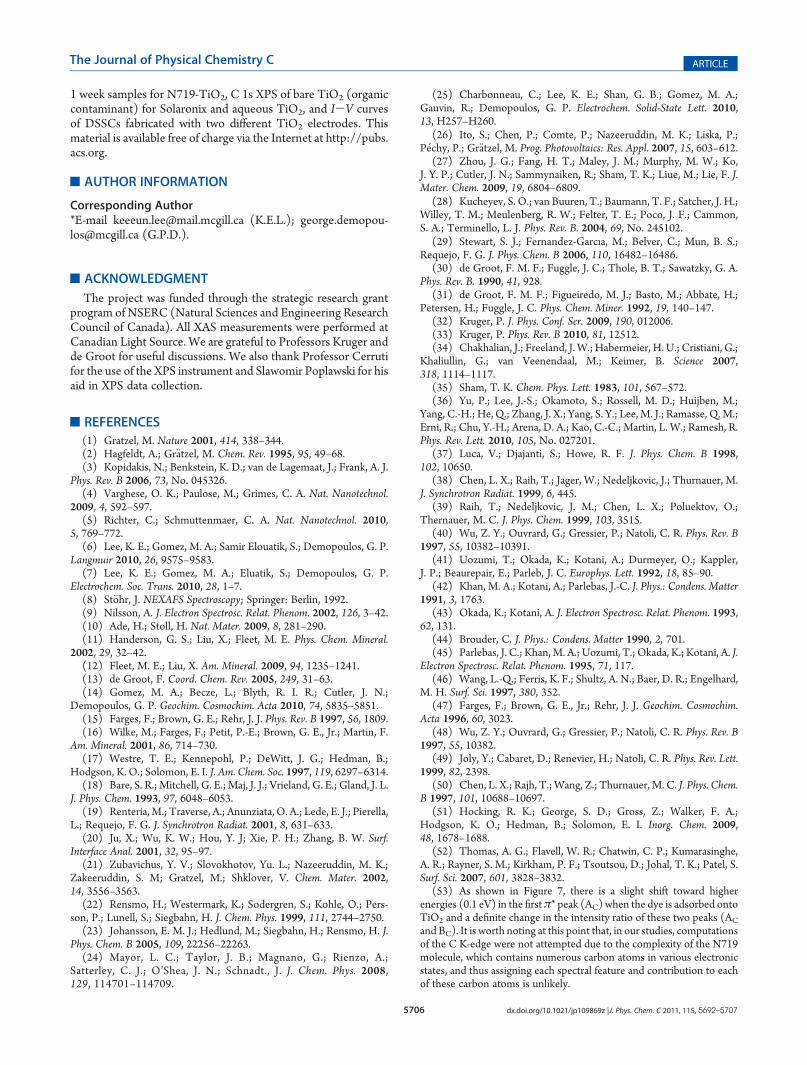
surface (i.e., the multilayer spectrum shows totally differentfeatures than the monolayer spectrum).24 However, in their case,the dye molecule was deposited by in situ ultrahigh vacuum(UHV) electrospray deposition under an applied pressure, whilein our case the dye-coated TiO2 films were made by the dip-coatingmethod, which is used most commonly in this system.Sulfur 2p. The S 2p spectra of neat N719 and dye-coated TiO2
for both Solaronix and aqueous anatase films are shown inFigure 14. The S 2p spectra of the neat dye were deconvoluted(Figure 15) with the spin-orbit split doublet originating fromthe sulfur in the NCS ligands, which means that the chemicalstates of the NCS groups within neat dye are very similar.23 Thedeconvoluted peaks for both samples are shifted by 0.58 and 0.8eV toward higher binding energies for the Solaronix and aqueousadsorbed samples, respectively, relative to neat N719. Theintensity relation between S 2p3/2 and S 2p1/2 is close to 1:2and the energy difference between them is about 1.2 eV. In our S2p spectra, there is an additional component that could not beconfidently added as in the work of Johansson et al.23 This isbecause, in our case, the probing energy was fixed (lab source)and therefore, the lower photon energies needed to observe thisextra contribution could not be confidently attained to fit intoour deconvolution analysis. This additional contribution to the S2p spectra of the adsorbed state in the work of Johansson et al.23
Figure 13. Peak fitting of N 1s XPS spectra for (a) N719, (b) N719-Solaronix TiO2, and (c) N719-aqueous TiO2.
Table 1. Nitrogen 1s Intensity Ratios
N 1s peaks
sample TBA bipyridine NCS
N719 0.88 1 0.71
N719-Solaronix TiO2 (8 h) 0.11 1 0.57
N719-Solaronix TiO2 (1 week) 0.10 1 0.53
N719-aqueous TiO2 (8 h) 0.11 1 0.49
N719-aqueous TiO2 (1 week) 0.13 1 0.48
5704 dx.doi.org/10.1021/jp109869z |J. Phys. Chem. C 2011, 115, 5692–5707
The Journal of Physical Chemistry C ARTICLE
was attributed to surface interactions of the NCS groups with theTiO2 surface, further supporting our findings for our two anatasesubstrates. Therefore, it may be concluded that a fraction of themolecules adsorbed onto TiO2 interact (likely through H-bonding)with the substrate through at least one of the NCS groups, inagreement with our N 1s XPS results above and those from ourprevious vibrational work.6 and that of Johansson et al.23
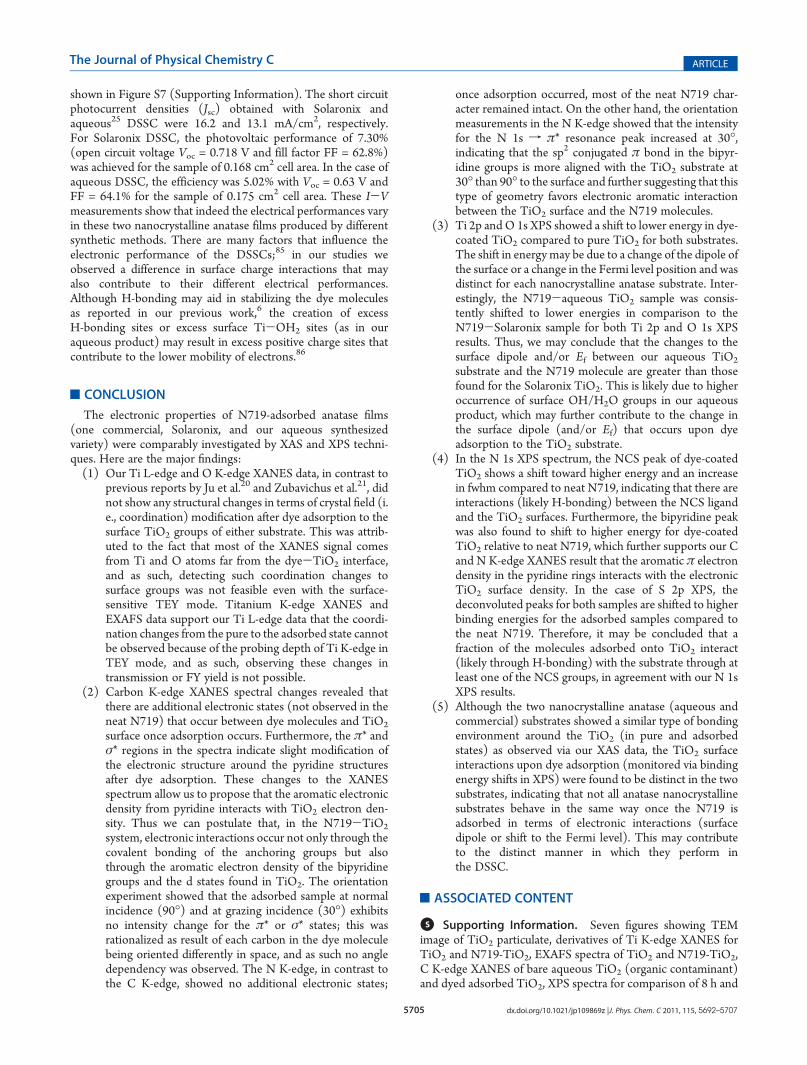
Carbon 1s/Ruthenium 3d. Figure S6 (Supporting Information)shows the C 1s spectrum of pure TiO2 substrates. As can beobserved from the XPS analysis, there exist organic contaminants(air) in the surface of our bare TiO2 films in both cases. Thequantity was calculated from XPS analysis. Each uncoated TiO2
substrate was found to contain ∼6% C, which is a similar valuewith the previous work of Johansson et al.,58 where ∼5% C wasreported. The major peaks around 286 and 289 eV in the pureTiO2 substrates indicate the presence of C-OandCdO species,respectively. Figure 16 shows the C 1s/Ru 3d spectra of N719and the adsorbed samples, which are dominated by four peaks.The twomain peaks at the lower binding energy originate fromC1s and Ru 3d5/2. However, it should be noted that the peak for Ru3d3/2 is hidden under the major C1s peak (∼285 eV)68 and thisRu 3d3/2 is shifted 4.3 eV from the Ru 3d5/2 peak.
22 The XPSstudies of pyridine81 and pyridine-carboxylic acid monomers(isonicotinic acid, nicotinic acid, and picolinic acid) on rutileTiO2
82 show that the peak position of the C 1s pyridine ringpeaks at around 284 eV and the carboxylic C 1s occurs around289 eV.83 For our C 1s XPS spectra, the spectral features are
similar with the pyridine-carboxylic acid monomers. However,in our case, the main peak at∼285 eV in N719 and N719-TiO2
spectra (for both TiO2 samples) contain not only pyridinecontributions but also NCS and TBA cation group contributions.Thus, the broad peak around 285 eV is contributed by CdC, C-C, CdN, C-O, and Ru3/2. Furthermore, as some TBA cationsstill remain on the dye-coated TiO2 after dye adsorption,
6 theyalso contribute to the C 1s spectral features. Therefore, thedeconvolution process for the C 1s XPS was not performed dueto the fact that large contributions from many groups in onebroad peak bring uncertainty to the C 1s curve fitting. The peakat 288 eV is also attributed toO-CdO andCdO fromCOOH/COO- groups,82 while the peak at around 292 eV is derived fromCO2 adsorption.
84
It is worth noting that, in spite of the complexity of all thecomponents that make up the C 1s spectrum, there is a notice-able shift to higher energy from neat N719 to adsorbed N719-TiO2 (for both samples). This shift is also observed for the Ru3d5/2peak, and the peak due to COO
-/COOH located at 288 eVis shifted to higher energy (0.4 eV for Solaronix and 0.6 eV foraqueous), indicating that their chemical environment has chan-ged from their pure N719 state upon adsorption to the TiO2
surfaces as expected but in a distinct manner depending upon theanatase substrate used.Photovoltaic Characteristics. To further evaluate how these
electronic interactions may vary in the two distinct anatase nano-crystalline substrates, photovoltaic I-V curves were measured as
Figure 14. Sulfur 2p XPS spectra of N719, N719-Solaronix TiO2, andN719-aqueous TiO2.
Figure 16. Carbon 1s XPS spectra of N719, N719-Solaronix TiO2,and N719-aqueous TiO2.
Figure 15. Peak fitting of S 2p XPS spectra for (a) N719, (b) N719-Solaronix TiO2, and (c) N719-aqueous TiO2.
5705 dx.doi.org/10.1021/jp109869z |J. Phys. Chem. C 2011, 115, 5692–5707
The Journal of Physical Chemistry C ARTICLE
shown in Figure S7 (Supporting Information). The short circuitphotocurrent densities (Jsc) obtained with Solaronix andaqueous25 DSSC were 16.2 and 13.1 mA/cm2, respectively.For Solaronix DSSC, the photovoltaic performance of 7.30%(open circuit voltage Voc = 0.718 V and fill factor FF = 62.8%)was achieved for the sample of 0.168 cm2 cell area. In the case ofaqueous DSSC, the efficiency was 5.02% with Voc = 0.63 V andFF = 64.1% for the sample of 0.175 cm2 cell area. These I-Vmeasurements show that indeed the electrical performances varyin these two nanocrystalline anatase films produced by differentsynthetic methods. There are many factors that influence theelectronic performance of the DSSCs;85 in our studies weobserved a difference in surface charge interactions that mayalso contribute to their different electrical performances.Although H-bonding may aid in stabilizing the dye moleculesas reported in our previous work,6 the creation of excessH-bonding sites or excess surface Ti-OH2 sites (as in ouraqueous product) may result in excess positive charge sites thatcontribute to the lower mobility of electrons.86
’CONCLUSION
The electronic properties of N719-adsorbed anatase films(one commercial, Solaronix, and our aqueous synthesizedvariety) were comparably investigated by XAS and XPS techni-ques. Here are the major findings:(1) Our Ti L-edge and O K-edge XANES data, in contrast to
previous reports by Ju et al.20 and Zubavichus et al.21, didnot show any structural changes in terms of crystal field (i.e., coordination) modification after dye adsorption to thesurface TiO2 groups of either substrate. This was attrib-uted to the fact that most of the XANES signal comesfrom Ti and O atoms far from the dye-TiO2 interface,and as such, detecting such coordination changes tosurface groups was not feasible even with the surface-sensitive TEY mode. Titanium K-edge XANES andEXAFS data support our Ti L-edge data that the coordi-nation changes from the pure to the adsorbed state cannotbe observed because of the probing depth of Ti K-edge inTEY mode, and as such, observing these changes intransmission or FY yield is not possible.
(2) Carbon K-edge XANES spectral changes revealed thatthere are additional electronic states (not observed in theneat N719) that occur between dye molecules and TiO2
surface once adsorption occurs. Furthermore, the π* andσ* regions in the spectra indicate slight modification ofthe electronic structure around the pyridine structuresafter dye adsorption. These changes to the XANESspectrum allow us to propose that the aromatic electronicdensity from pyridine interacts with TiO2 electron den-sity. Thus we can postulate that, in the N719-TiO2
system, electronic interactions occur not only through thecovalent bonding of the anchoring groups but alsothrough the aromatic electron density of the bipyridinegroups and the d states found in TiO2. The orientationexperiment showed that the adsorbed sample at normalincidence (90�) and at grazing incidence (30�) exhibitsno intensity change for the π* or σ* states; this wasrationalized as result of each carbon in the dye moleculebeing oriented differently in space, and as such no angledependency was observed. The N K-edge, in contrast tothe C K-edge, showed no additional electronic states;
once adsorption occurred, most of the neat N719 char-acter remained intact. On the other hand, the orientationmeasurements in the N K-edge showed that the intensityfor the N 1s f π* resonance peak increased at 30�,indicating that the sp2 conjugated π bond in the bipyr-idine groups is more aligned with the TiO2 substrate at30� than 90� to the surface and further suggesting that thistype of geometry favors electronic aromatic interactionbetween the TiO2 surface and the N719 molecules.
(3) Ti 2p andO 1s XPS showed a shift to lower energy in dye-coated TiO2 compared to pure TiO2 for both substrates.The shift in energymay be due to a change of the dipole ofthe surface or a change in the Fermi level position and wasdistinct for each nanocrystalline anatase substrate. Inter-estingly, the N719-aqueous TiO2 sample was consis-tently shifted to lower energies in comparison to theN719-Solaronix sample for both Ti 2p and O 1s XPSresults. Thus, we may conclude that the changes to thesurface dipole and/or Ef between our aqueous TiO2
substrate and the N719 molecule are greater than thosefound for the Solaronix TiO2. This is likely due to higheroccurrence of surface OH/H2O groups in our aqueousproduct, which may further contribute to the change inthe surface dipole (and/or Ef) that occurs upon dyeadsorption to the TiO2 substrate.
(4) In the N 1s XPS spectrum, the NCS peak of dye-coatedTiO2 shows a shift toward higher energy and an increasein fwhm compared to neat N719, indicating that there areinteractions (likely H-bonding) between the NCS ligandand the TiO2 surfaces. Furthermore, the bipyridine peakwas also found to shift to higher energy for dye-coatedTiO2 relative to neat N719, which further supports our Cand N K-edge XANES result that the aromatic π electrondensity in the pyridine rings interacts with the electronicTiO2 surface density. In the case of S 2p XPS, thedeconvoluted peaks for both samples are shifted to higherbinding energies for the adsorbed samples compared tothe neat N719. Therefore, it may be concluded that afraction of the molecules adsorbed onto TiO2 interact(likely through H-bonding) with the substrate through atleast one of the NCS groups, in agreement with our N 1sXPS results.
(5) Although the two nanocrystalline anatase (aqueous andcommercial) substrates showed a similar type of bondingenvironment around the TiO2 (in pure and adsorbedstates) as observed via our XAS data, the TiO2 surfaceinteractions upon dye adsorption (monitored via bindingenergy shifts in XPS) were found to be distinct in the twosubstrates, indicating that not all anatase nanocrystallinesubstrates behave in the same way once the N719 isadsorbed in terms of electronic interactions (surfacedipole or shift to the Fermi level). This may contributeto the distinct manner in which they perform inthe DSSC.
’ASSOCIATED CONTENT
bS Supporting Information. Seven figures showing TEMimage of TiO2 particulate, derivatives of Ti K-edge XANES forTiO2 and N719-TiO2, EXAFS spectra of TiO2 and N719-TiO2,C K-edge XANES of bare aqueous TiO2 (organic contaminant)and dyed adsorbed TiO2, XPS spectra for comparison of 8 h and
5706 dx.doi.org/10.1021/jp109869z |J. Phys. Chem. C 2011, 115, 5692–5707
The Journal of Physical Chemistry C ARTICLE
1 week samples for N719-TiO2, C 1s XPS of bare TiO2 (organiccontaminant) for Solaronix and aqueous TiO2, and I-V curvesof DSSCs fabricated with two different TiO2 electrodes. Thismaterial is available free of charge via the Internet at http://pubs.acs.org.
’AUTHOR INFORMATION
Corresponding Author*E-mail [email protected] (K.E.L.); [email protected] (G.P.D.).
’ACKNOWLEDGMENT
The project was funded through the strategic research grantprogram of NSERC (Natural Sciences and Engineering ResearchCouncil of Canada). All XAS measurements were performed atCanadian Light Source. We are grateful to Professors Kruger andde Groot for useful discussions. We also thank Professor Cerrutifor the use of the XPS instrument and Slawomir Poplawski for hisaid in XPS data collection.
’REFERENCES
(1) Gratzel, M. Nature 2001, 414, 338–344.(2) Hagfeldt, A.; Gr€atzel, M. Chem. Rev. 1995, 95, 49–68.(3) Kopidakis, N.; Benkstein, K. D.; van de Lagemaat, J.; Frank, A. J.
Phys. Rev. B 2006, 73, No. 045326.(4) Varghese, O. K.; Paulose, M.; Grimes, C. A. Nat. Nanotechnol.
2009, 4, 592–597.(5) Richter, C.; Schmuttenmaer, C. A. Nat. Nanotechnol. 2010,
5, 769–772.(6) Lee, K. E.; Gomez, M. A.; Samir Elouatik, S.; Demopoulos, G. P.
Langmuir 2010, 26, 9575–9583.(7) Lee, K. E.; Gomez, M. A.; Eluatik, S.; Demopoulos, G. P.
Electrochem. Soc. Trans. 2010, 28, 1–7.(8) St€ohr, J. NEXAFS Spectroscopy; Springer: Berlin, 1992.(9) Nilsson, A. J. Electron Spectrosc. Relat. Phenom. 2002, 126, 3–42.(10) Ade, H.; Stoll, H. Nat. Mater. 2009, 8, 281–290.(11) Handerson, G. S.; Liu, X.; Fleet, M. E. Phys. Chem. Mineral.
2002, 29, 32–42.(12) Fleet, M. E.; Liu, X. Am. Mineral. 2009, 94, 1235–1241.(13) de Groot, F. Coord. Chem. Rev. 2005, 249, 31–63.(14) Gomez, M. A.; Becze, L.; Blyth, R. I. R.; Cutler, J. N.;
Demopoulos, G. P. Geochim. Cosmochim. Acta 2010, 74, 5835–5851.(15) Farges, F.; Brown, G. E.; Rehr, J. J. Phys. Rev. B 1997, 56, 1809.(16) Wilke, M.; Farges, F.; Petit, P.-E.; Brown, G. E., Jr.; Martin, F.
Am. Mineral. 2001, 86, 714–730.(17) Westre, T. E.; Kennepohl, P.; DeWitt, J. G.; Hedman, B.;
Hodgson, K. O.; Solomon, E. I. J. Am. Chem. Soc. 1997, 119, 6297–6314.(18) Bare, S. R.; Mitchell, G. E.; Maj, J. J.; Vrieland, G. E.; Gland, J. L.
J. Phys. Chem. 1993, 97, 6048–6053.(19) Rentería,M.; Traverse, A.; Anunziata, O. A.; Lede, E. J.; Pierella,
L.; Requejo, F. G. J. Synchrotron Radiat. 2001, 8, 631–633.(20) Ju, X.; Wu, K. W.; Hou, Y. J; Xie, P. H.; Zhang, B. W. Surf.
Interface Anal. 2001, 32, 95–97.(21) Zubavichus, Y. V.; Slovokhotov, Yu. L.; Nazeeruddin, M. K.;
Zakeeruddin, S. M; Gratzel, M.; Shklover, V. Chem. Mater. 2002,14, 3556–3563.(22) Rensmo, H.; Westermark, K.; Sodergren, S.; Kohle, O.; Pers-
son, P.; Lunell, S.; Siegbahn, H. J. Chem. Phys. 1999, 111, 2744–2750.(23) Johansson, E. M. J.; Hedlund, M.; Siegbahn, H.; Rensmo, H. J.
Phys. Chem. B 2005, 109, 22256–22263.(24) Mayor, L. C.; Taylor, J. B.; Magnano, G.; Rienzo, A.;
Satterley, C. J.; O’Shea, J. N.; Schnadt., J. J. Chem. Phys. 2008,129, 114701–114709.
(25) Charbonneau, C.; Lee, K. E.; Shan, G. B.; Gomez, M. A.;Gauvin, R.; Demopoulos, G. P. Electrochem. Solid-State Lett. 2010,13, H257–H260.
(26) Ito, S.; Chen, P.; Comte, P.; Nazeeruddin, M. K.; Liska, P.;P�echy, P.; Gr€atzel, M. Prog. Photovoltaics: Res. Appl. 2007, 15, 603–612.
(27) Zhou, J. G.; Fang, H. T.; Maley, J. M.; Murphy, M. W.; Ko,J. Y. P.; Cutler, J. N.; Sammynaiken, R.; Sham, T. K.; Liue, M.; Lie, F. J.Mater. Chem. 2009, 19, 6804–6809.
(28) Kucheyev, S. O.; van Buuren, T.; Baumann, T. F.; Satcher, J. H.;Willey, T. M.; Meulenberg, R. W.; Felter, T. E.; Poco, J. F.; Cammon,S. A.; Terminello, L. J. Phys. Rev. B. 2004, 69, No. 245102.
(29) Stewart, S. J.; Fernandez-Garcıa, M.; Belver, C.; Mun, B. S.;Requejo, F. G. J. Phys. Chem. B 2006, 110, 16482–16486.
(30) de Groot, F. M. F.; Fuggle, J. C.; Thole, B. T.; Sawatzky, G. A.Phys. Rev. B. 1990, 41, 928.
(31) de Groot, F. M. F.; Figueiredo, M. J.; Basto, M.; Abbate, H.;Petersen, H.; Fuggle, J. C. Phys. Chem. Miner. 1992, 19, 140–147.
(32) Kruger, P. J. Phys. Conf. Ser. 2009, 190, 012006.(33) Kruger, P. Phys. Rev. B 2010, 81, 12512.(34) Chakhalian, J.; Freeland, J.W.; Habermeier, H. U.; Cristiani, G.;
Khaliullin, G.; van Veenendaal, M.; Keimer, B. Science 2007,318, 1114–1117.
(35) Sham, T. K. Chem. Phys. Lett. 1983, 101, 567–572.(36) Yu, P.; Lee, J.-S.; Okamoto, S.; Rossell, M. D.; Huijben, M.;
Yang, C.-H.; He, Q.; Zhang, J. X.; Yang, S. Y.; Lee, M. J.; Ramasse, Q.M.;Erni, R.; Chu, Y.-H.; Arena, D. A.; Kao, C.-C.; Martin, L. W.; Ramesh, R.Phys. Rev. Lett. 2010, 105, No. 027201.
(37) Luca, V.; Djajanti, S.; Howe, R. F. J. Phys. Chem. B 1998,102, 10650.
(38) Chen, L. X.; Raih, T.; Jager, W.; Nedeljkovic, J.; Thurnauer, M.J. Synchrotron Radiat. 1999, 6, 445.
(39) Raih, T.; Nedeljkovic, J. M.; Chen, L. X.; Poluektov, O.;Thernauer, M. C. J. Phys. Chem. 1999, 103, 3515.
(40) Wu, Z. Y.; Ouvrard, G.; Gressier, P.; Natoli, C. R. Phys. Rev. B1997, 55, 10382–10391.
(41) Uozumi, T.; Okada, K.; Kotani, A.; Durmeyer, O.; Kappler,J. P.; Beaurepair, E.; Parleb, J. C. Europhys. Lett. 1992, 18, 85–90.
(42) Khan, M. A.; Kotani, A.; Parlebas, J.-C. J. Phys.: Condens. Matter1991, 3, 1763.
(43) Okada, K.; Kotani, A. J. Electron Spectrosc. Relat. Phenom. 1993,62, 131.
(44) Brouder, C. J. Phys.: Condens. Matter 1990, 2, 701.(45) Parlebas, J. C.; Khan,M. A.; Uozumi, T.; Okada, K.; Kotani, A. J.
Electron Spectrosc. Relat. Phenom. 1995, 71, 117.(46) Wang, L.-Q.; Ferris, K. F.; Shultz, A. N.; Baer, D. R.; Engelhard,
M. H. Surf. Sci. 1997, 380, 352.(47) Farges, F.; Brown, G. E., Jr.; Rehr, J. J. Geochim. Cosmochim.
Acta 1996, 60, 3023.(48) Wu, Z. Y.; Ouvrard, G.; Gressier, P.; Natoli, C. R. Phys. Rev. B
1997, 55, 10382.(49) Joly, Y.; Cabaret, D.; Renevier, H.; Natoli, C. R. Phys. Rev. Lett.
1999, 82, 2398.(50) Chen, L. X.; Rajh, T.;Wang, Z.; Thurnauer, M. C. J. Phys. Chem.
B 1997, 101, 10688–10697.(51) Hocking, R. K.; George, S. D.; Gross, Z.; Walker, F. A.;
Hodgson, K. O.; Hedman, B.; Solomon, E. I. Inorg. Chem. 2009,48, 1678–1688.
(52) Thomas, A. G.; Flavell, W. R.; Chatwin, C. P.; Kumarasinghe,A. R.; Rayner, S. M.; Kirkham, P. F.; Tsoutsou, D.; Johal, T. K.; Patel, S.Surf. Sci. 2007, 601, 3828–3832.
(53) As shown in Figure 7, there is a slight shift toward higherenergies (0.1 eV) in the firstπ* peak (AC) when the dye is adsorbed ontoTiO2 and a definite change in the intensity ratio of these two peaks (AC
and BC). It is worth noting at this point that, in our studies, computationsof the C K-edge were not attempted due to the complexity of the N719molecule, which contains numerous carbon atoms in various electronicstates, and thus assigning each spectral feature and contribution to eachof these carbon atoms is unlikely.
5707 dx.doi.org/10.1021/jp109869z |J. Phys. Chem. C 2011, 115, 5692–5707
The Journal of Physical Chemistry C ARTICLE
(54) Richard, G.; Cros, A.; Mathey, Y.; Tourillon, G.; Laffon, C.;Parent, Y. J. Phys. IV 1993, 3, 789–792.(55) Kaneko, M.; Moroi, T.; Shiriishi, H. Macromol. Symp. 2002,
186, 177–185.(56) Outka, D. A.; Storhr, J.; Madix, R. J.; Rotermund, H. H.;
Hermsmeier, B.; Solomon, J. Surf. Sci. 1987, 185, 53–74.(57) Johansson, E. M. J.; Hedlund, M.; Odelius, M.; Siegbahn, H.;
Rensmo, H. J. Chem. Phys. 2007, 126, No. 244303.(58) Johansson, E. M. J.; Odelius, M.; Plogmaker, S.; Gorgoi, M.;
Svensson, S.; Siegbahn, H.; Rensmo, H. J. Phys. Chem. C 2010,114, 10314–10322.(59) Metson, J. B.; Trodahl, B. J.; Ruck, B. J.; Lanke, U. D.; Bittar, A.
Surf. Interface Anal. 2003, 35, 719–722.(60) Thomas, A. G.; Flavell, W. R.; Chatwin, C.; Rayner, S.;
Tsoutsou, D.; Kumarasinhe, A. R.; Brete, D.; Johal, T. K.; Patel, S.;Purton, J. Surf. Sci. 2005, 592, 159–168.(61) Isvoranu, C. Metal-Organic Complexes at Surfaces., Ph.D.
dissertation, Lund University, Lund, Sweden, 2010(62) Johansson, E. Interfaces in Dye-Sensitized Oxide/Hole-Con-
ductor Heterojunctions for Solar Cell Applications. Ph.D. dissertation,Uppsala University, Uppsala, Sweden, 2006(63) Gouttebaron, R.; Cornelissen, D.; Snyders, R.; Dauchot, J. P.;
Wautelet, M.; Hecq, M. Surf. Interface Anal. 2000, 30, 527–530.(64) Shirkhanzadeh, M. J. Mater. Sci.: Mater. Med 1995, 6, 206–210.(65) Kim, Y.; Yoon, C.; Kim, K.; Lee, Y. J. Vac. Sci. Technol. 2007,
A25, 1219–1225.(66) Liu, G.; Jaegermann, W.; He, J.; Sundstrom, V.; Sun, L. J. Phys.
Chem. B 2002, 106, 5814–5819.(67) Bard, A. J. J. Phys. Chem. 1982, 86, 172.(68) Liu, G.; Klein, A.; Thissen, A.; Jaegermann, W. Surf. Sci. 2003,
539, 37–48.(69) Onda, K.; Li, B.; Petek, H. Phys. Rev. B. 2004, 70, No. 045415.(70) Marques, H. P.; Canario, A. P.; Moutinho, A. M. C.; Teodoro,
O. M. N. D. Vacuum 2008, 82, 1425–1427.(71) Bundaleski, N.; Silva, A. G.; Schroder, U.; Moutinho, A. M. C.;
Teodoro, O. M. N. D. J. Phys.: Conf. Ser. 2010, 257, No. 012008.(72) Hirose, F.; Kuribayashi, K.; Suzuki, T.; Narita, Y.; Kimura, Y.;
Niwano, M. Electrochem. Solid-State Lett. 2008, 11, A109–A111.(73) Selloni, A. Nat. Mater. 2008, 7, 613–615.(74) Simmons, G. W.; Beard, B. C. J. Phys. Chem. 1987,
91, 1143–1148.(75) Erdem, B.; Hunsicker, R. A.; Simmons, G. W.; Sudol, E. D.;
Dimonie, V. L.; El-Aasser, M. S. Langmuir 2001, 17, 2664–2669.(76) Huang, N. K.; Wang, D. Z.; Lu, Z.; Lin, L. B. Surf. Coat. Technol.
1994, 70, 69–71.(77) Lopez, S.; Dunlop, H. M.; Benmalek, M.; Tourillon, G.; Wong,
M. S.; Sproul, W. D. Surf. Interface Anal. 1997, 25, 827835.(78) O’Shea, J. N.; Schnadt, J.; Br€uhwiler, P. A.; Hillesheimer, H.;
M�artensson, N. J. Phys. Chem. B 2001, 105, 1917–1920.(79) O’Shea, J. N.; Luo, Y.; Schnadt, J.; Patthey, L.; Hillesheimer, H.;
Krempasky, J.; Nordlund, D.; Nagasono, M.; Br€uhwiler, P. A.;M�artensson, N. Surf. Sci. 2001, 486, 157–166.(80) Wen, P.; Itoh, H.; Tang, W.; Feng, Q.Microporous Mesoporous
Mater. 2008, 116, 147–156.(81) Schnadt, J.; Schiessling, J.; O’Shea, J. N.; Gray, S. M.; Patthey,
L.; Johansson, M. K.-J.; Shi, M.; Krempask�y, J.; Åhlund, J.; Karlsson,P. G.; Persson, P.; M�artensson, N.; Br€uhwiler, P. A. Surf. Sci. 2003,540, 39–54.(82) Guo, Q.; Cocks, I.; Williams, E. M. Surf. Sci. 1997, 393, 1–11.(83) Schnadt, J.; O’Shea, J. N.; Patthey, L.; Schiessling, J.; Krempas-
ky, J.; Shi, M.; Martensson, N.; Br€uhwiler, P. A. Surf. Sci. 2003,544, 74–86.(84) Cueto, L. F.; Hirata, G. A.; �Sanchez, E. M. J. Sol-Gel Sci. Technol.
2006, 37, 105–109.(85) Hagfeldt, A.; Boschloo, G.; Sun, L.; Kloo, L.; Pettersson, H.
Chem. Rev. 2010, 110, 6595–6663.(86) Pal, S.; Manna, A. K.; Pati, S. K. J. Chem. Phys. 2008, 129, No.
204301.
’NOTE ADDED AFTER ASAP PUBLICATION
This article was published ASAP onMarch 7, 2011. Figure 14 andthe caption to Figure 15 have been modified. The correct versionwas published on March 16, 2011.


![Chiral Lanthanide Complexes with - and An X-ray and ...€¦ · Lanthanide-containing nanomaterials have the potential to be a sensitizer in photodynamic cancer therapy [4–6]. Radiolanthanides](https://img.pdfslide.us/doc/110x75/600d3e344db9b872512b3b2e/chiral-lanthanide-complexes-with-and-an-x-ray-and-lanthanide-containing-nanomaterials.jpg)