Embed Size (px)
Citation preview
/ . Embryol. exp. Morph. Vol. 39, pp. 59-70, 1977 59
Printed in Great Britain
Further studies on skull growth inachondroplasic (en) mice
By A. K. BREWER, D. R. JOHNSON AND W. J. MOORE1
From the Department of Anatomy, University of Leeds
SUMMARY
The morphology of the basioccipital, basisphenoid and mandibular bones in achondro-plasic (cn/cri) mice was compared with that of normal siblings. The two bones of the cranialbase were markedly reduced in length but not in width. The percentage reduction in thebasisphenoid was twice that in the basioccipital bone and of the same magnitude as thatpreviously observed in the long bones of the limbs. This difference may arise because thebasisphenoid, like the long bones, grows in length from two cartilaginous growth sites whilethe basioccipital grows from one cartilaginous and one periosteal site. The mandible of theenfen mice was also reduced in size, although to a lesser extent than were the cranial bonesand without the ensuing disproportion. The scale of the mandibular changes suggests thatthey are largely attributable to regulatory responses to the shortened cranium. The findingthat the condylar cartilage of the cn\cn mice is reduced in thickness indicates, however, thatthe en gene may have a direct effect on condylar chondrocytes.
INTRODUCTION
In a previous paper (Jolly & Moore, 1975), quantitative data were presentedon the growth of the skull in achondroplasic (enjeri) mice. It was shown thatthe en gene produces marked changes in skull proportions, in addition to itswell documented effects on the post-cranial skeleton (Lane & Dickie, 1968;Konyukhov & Paschin, 1970; Silberberg & Lesker, 1975). Particularly prominentwere shortening of the cranial base with corresponding broadening of the cal-varium and retraction of the nasal skeleton. From mainly qualitative studies(e.g. Crew, 1923; Stockard, 1941; Landauer & Chang, 1949; Griineberg, 1963)of other species, it appears that such cranial changes are common to themajority of mammalian achondroplasias.
The effects of achondroplasia on the skull are of especial interest in that thispart of the skeleton embraces, as well as the endochondral elements of thecranial base and sense capsules, the dermal bones of the calvarium and facewhich ossify intramembranously and the secondary condylar, angular andcoronoid cartilages of the mandible. The most important of the latter, thecondylar cartilage, has been shown to grow by apposition to its upper surfaceas a result of differentiation of chondrocytes in the intermediate cell zone
* Authors' address: Department of Anatomy, School of Medicine, University of Leeds,LS2 9NL, U.K.
60 A. K. BREWER, D. R. JOHNSON AND W. J. MOORE
(situated between condylar and articular cartilages) rather than the interstitialproliferation of chondrocytes which predominates at a typical epiphysealplate (Blackwood, 1966; Frommer, Monroe, Morehead & Belt, 1968; Silber-mann & Frommer, 1972). There is strong evidence that the intermediate cellzone is of periosteal origin and that the condylar cartilage is, in consequence,the product of periosteal chondrogenesis (Meikle, 1973). The chondrocytes ofthe condylar cartilage do not form columns of hypertrophic cells, as occur inepiphyseal cartilages, and they emerge, still viable, into the underlying zone ofossification (Durkin, Irving & Heeley, 1969). In view of these peculiarities, thequestion arises whether condylar chondrocytes are affected by the en gene orwhether the effects of this gene are, as suggested by Gruneberg (1963), specificfor epiphyseal chondrocytes.
The aims of the present study are to supplement the work of Jolly & Moore(1975) by (a) investigating the growth of some individual bones of the skull,including the mandible, (b) making a developmental study of these bones innormal mice and their en littermates at a variety of ages and (c) investigatingthe feasibility of different techniques for the measurement of skull growth inthe mouse.
MATERIALS AND METHODS
The achondroplasic mice used in this study were re-introduced by one of us(D.R.J.) from a stock maintained at University College London, the stockused by Jolly & Moore having become extinct. It should be pointed out thatsurvival amongst post-weaning cn[cn mice is not good: the results presentedfor mice aged 30 days or more may therefore be biased as they are based onsurvivors whose phenotype may well be less extreme than the norm.
Vital staining. 16-day-old enjen mice and normal littermates were given anintraperitoneal injection of 25, 50 or lOOmg/kg bodyweight Procion P8-B(I.C.I.). A second injection was given 24, 48 or 72 h later, and the animalskilled after a further period of up to 24 h. Heads were skinned, fixed in Bouin'sfluid, decalcified in Gooding & Stewart's decalcifier for 7 days, washed in 5 %sodium sulphate and running tap water (24 h each), dehydrated and embeddedin wax. Longitudinal sections, 15/*m thick, were washed in 70% alcohol toremove any remaining picric acid and viewed in incident ultraviolet light.
A second group of animals was injected with 5, 10 or 20 mg/kg tetracycline(Lederle) in a similar manner, but fixed in 10 % glutaraldehyde, dehydrated ingraded alcohols and embedded in resin after the method of Spurr (1969).Sections 100 jam thick, were viewed in incident ultraviolet light.
Radiography. Twelve-day-old animals were anaesthetized by intraperitonealinjection of 60 mg/kg 'Intraval Sodium' (May & Baker) and transported to theX-ray machine in a warmed insulated container. Antero-posterior views of thehead were taken using an exposure of 0-1 sec on dental fast-apical-bite-plates.The animals were allowed to recover and the procedure repeated on subsequent
Skull growth in mice 61
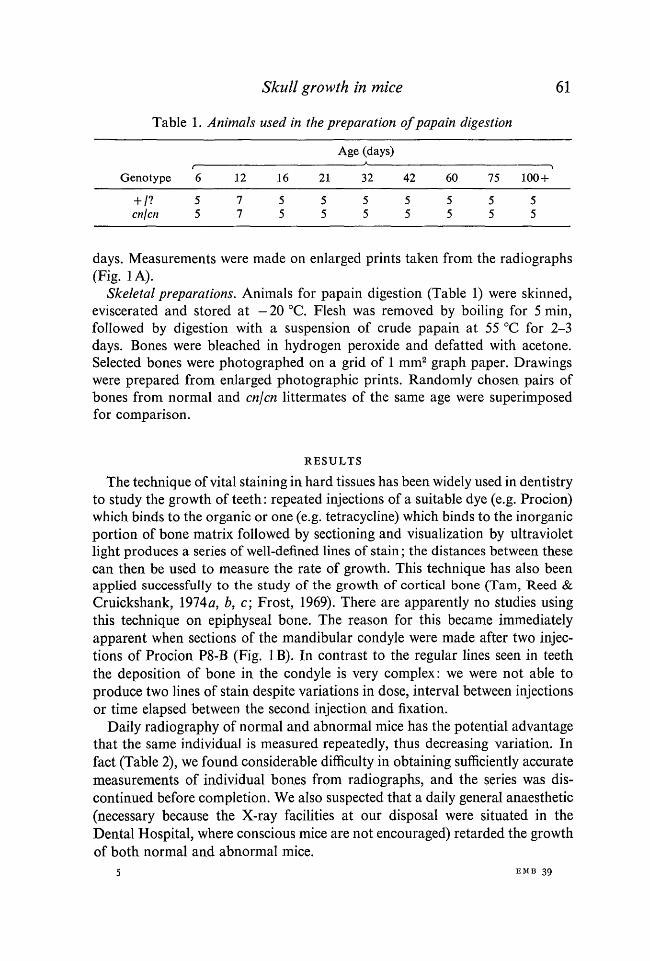
Table 1. Animals used in the preparation of papain digestion
Genotype
+ /?cnjcn
6
55
12
77
16
55
21
55
Age (days)
32
55
42
55
60
55
75
55
100 +
55
days. Measurements were made on enlarged prints taken from the radiographs(Fig. 1A).
Skeletal preparations. Animals for papain digestion (Table 1) were skinned,eviscerated and stored at — 20 °C. Flesh was removed by boiling for 5 min,followed by digestion with a suspension of crude papain at 55 °C for 2-3days. Bones were bleached in hydrogen peroxide and defatted with acetone.Selected bones were photographed on a grid of 1 mm2 graph paper. Drawingswere prepared from enlarged photographic prints. Randomly chosen pairs ofbones from normal and cnjcn littermates of the same age were superimposedfor comparison.
RESULTS
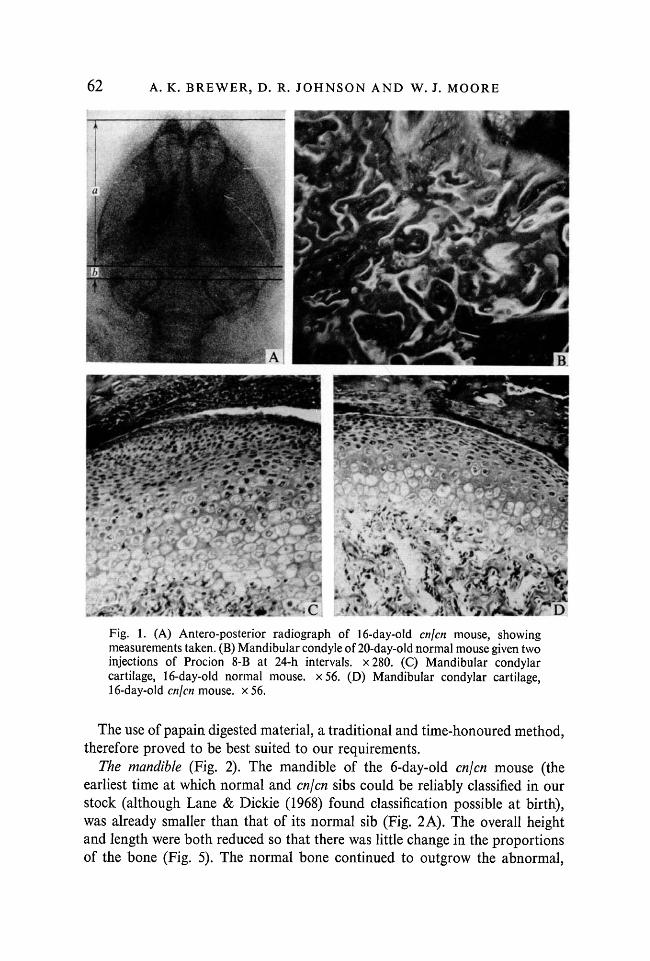
The technique of vital staining in hard tissues has been widely used in dentistryto study the growth of teeth: repeated injections of a suitable dye (e.g. Procion)which binds to the organic or one (e.g. tetracycline) which binds to the inorganicportion of bone matrix followed by sectioning and visualization by ultravioletlight produces a series of well-defined lines of stain; the distances between thesecan then be used to measure the rate of growth. This technique has also beenapplied successfully to the study of the growth of cortical bone (Tarn, Reed &Cruickshank, 1974a, b, c; Frost, 1969). There are apparently no studies usingthis technique on epiphyseal bone. The reason for this became immediatelyapparent when sections of the mandibular condyle were made after two injec-tions of Procion P8-B (Fig. IB). In contrast to the regular lines seen in teeththe deposition of bone in the condyle is very complex: we were not able toproduce two lines of stain despite variations in dose, interval between injectionsor time elapsed between the second injection and fixation.
Daily radiography of normal and abnormal mice has the potential advantagethat the same individual is measured repeatedly, thus decreasing variation. Infact (Table 2), we found considerable difficulty in obtaining sufficiently accuratemeasurements of individual bones from radiographs, and the series was dis-continued before completion. We also suspected that a daily general anaesthetic(necessary because the X-ray facilities at our disposal were situated in theDental Hospital, where conscious mice are not encouraged) retarded the growthof both normal and abnormal mice.
5 EMB 39
62 A. K. BREWER, D. R. JOHNSON AND W. J. MOORE
Fig. 1. (A) Antero-posterior radiograph of 16-day-old cnjcn mouse, showingmeasurements taken. (B) Mandibular condyle of 20-day-old normal mouse given twoinjections of Procion 8-B at 24-h intervals. x280. (C) Mandibular condylarcartilage, 16-day-old normal mouse. x56. (D) Mandibular condylar cartilage,16-day-old cnjcn mouse, x 56.
The use of papain digested material, a traditional and time-honoured method,therefore proved to be best suited to our requirements.
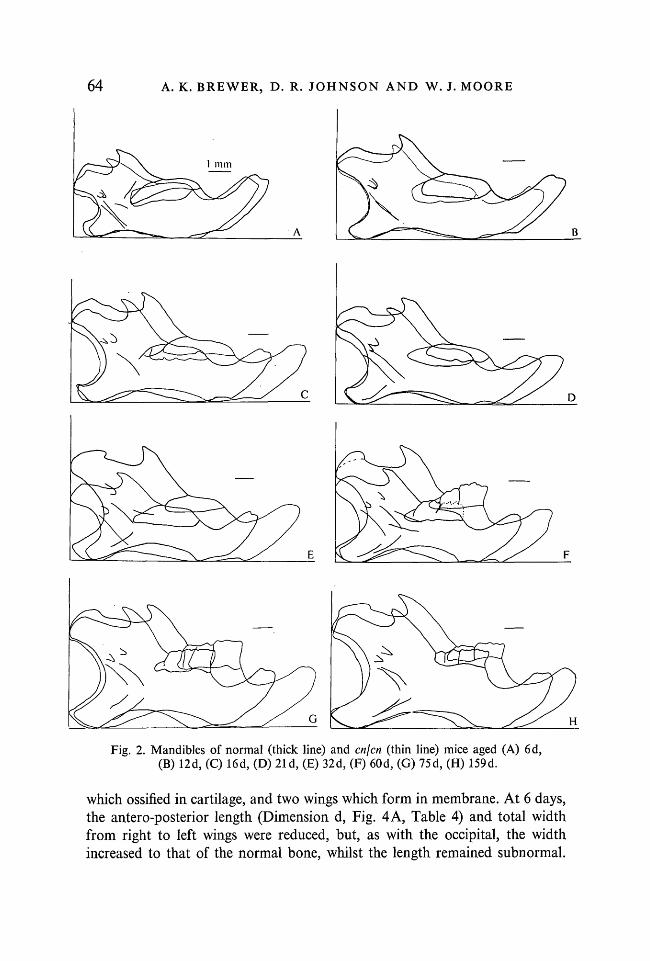
The mandible (Fig. 2). The mandible of the 6-day-old cnjcn mouse (theearliest time at which normal and cnjcn sibs could be reliably classified in ourstock (although Lane & Dickie (1968) found classification possible at birth),was already smaller than that of its normal sib (Fig. 2 A). The overall heightand length were both reduced so that there was little change in the proportionsof the bone (Fig. 5). The normal bone continued to outgrow the abnormal,
Skull growth in mice 63
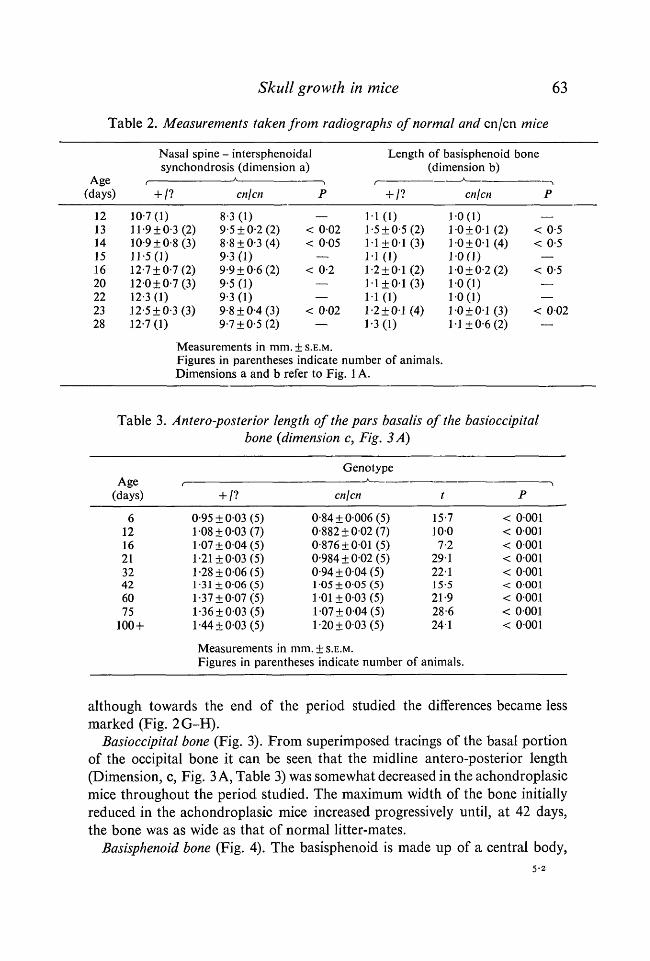
Table 2. Measurements taken from radiographs of normal and en /en mice
Age(days)
121314151620222328
Nasal spine - intersphenoidalsynchondrosis (dimension a)
+ /?
10-7(1)11-9 ±0-3 (2)10-9 ±0-8 (3)11-5(1)12-7 ±0-7 (2)12-0±0-7(3)12-3(1)12-5 ±0-3 (3)12-7(1)
A
cn/cn
83 (1)9-5 ±0-2 (2)8-8 ±0-3 (4)9-3 (1)9-9 ±0-6 (2)95 (1)9-3 (1)9-8 ±0-4 (3)9-7 + 0-5(2)
P
—
< 002< 005
—< 0-2
——
< 002—
Length
+ /?
1-1(1)1-5 ±0-5 (2)1-1+01 (3)1-1(1)1-2 ± 0 1 (2)11 +01 (3)11(01-2 + 0-1 (4)1-3(1)
of basisphenoid(dimension b)
A
cn/cn
1-0(1)10 ±01 (2)10 ±0-1 (4)1-0(1)10 ±0-2 (2)1-0(1)1-0(1)10 ±0-1 (3)11 ±0-6 (2)
bone
P
—
< 0-5< 0-5
—< 0-5
——
< 002—
Measurements in mm. ± S.E.M.Figures in parentheses indicate number of animals.Dimensions a and b refer to Fig. 1 A.
Table 3. Antero-posterior length of the pars basalis of the basioccipitalbone (dimension c, Fig. 3 A)
Age(days)
612162132426075
100 +
f
+ /?
0-95±003 (5)108 ±0-03 (7)107 ±004 (5)1-21 ±0-03 (5)1-28±006 (5)1-31 ±006 (5)1-37±007 (5)1-36±003 (5)1-44±003 (5)
Measurements in
GenotypeA
cn\cn
0-84±0006 (5)0-882±002 (7)0-876 + 0-01(5)0-984±002 (5)0-94 ±004 (5)1 05±005 (5)1 01 ±003 (5)107 ±004 (5)1-20±003 (5)
mm. ± S.E.M.Figures in parentheses indicate number
t
15-71007-2
29122-115-521-928-6241
of animals.
•>P
< 0001< 0001< 0001< 0001< 0001< 0001< 0001< 0001< 0001
although towards the end of the period studied the differences became lessmarked (Fig. 2G-H).
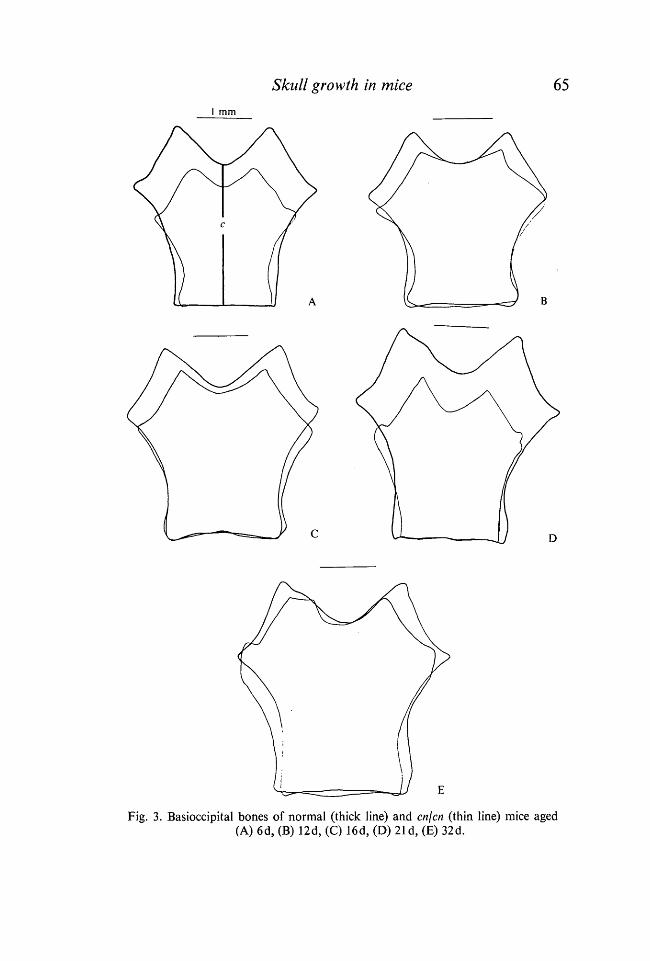
Basioccipital bone (Fig. 3). From superimposed tracings of the basal portionof the occipital bone it can be seen that the midline antero-posterior length(Dimension, c, Fig. 3 A, Table 3) was somewhat decreased in the achondroplasicmice throughout the period studied. The maximum width of the bone initiallyreduced in the achondroplasic mice increased progressively until, at 42 days,the bone was as wide as that of normal litter-mates.
Basisphenoid bone (Fig. 4). The basisphenoid is made up of a central body,5-2
64 A. K. BREWER, D. R. JOHNSON AND W. J. MOORE
Fig. 2. Mandibles of normal (thick line) and en]en (thin line) mice aged (A) 6d,(B) 12d, (C) 16d, (D) 21 d, (E) 32d, (F) 60d, (G) 75d, (H) 159d.
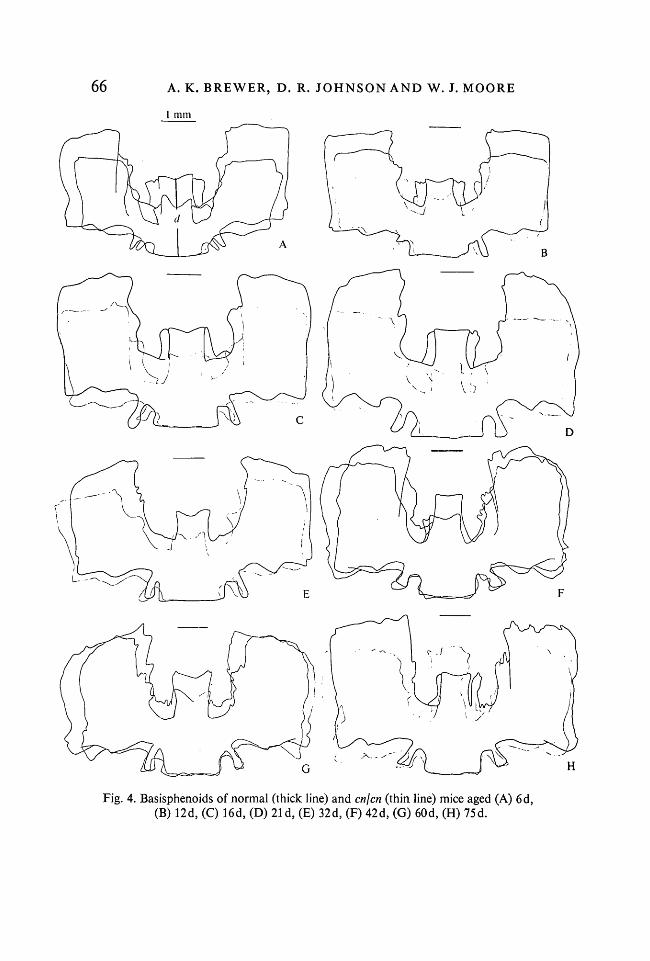
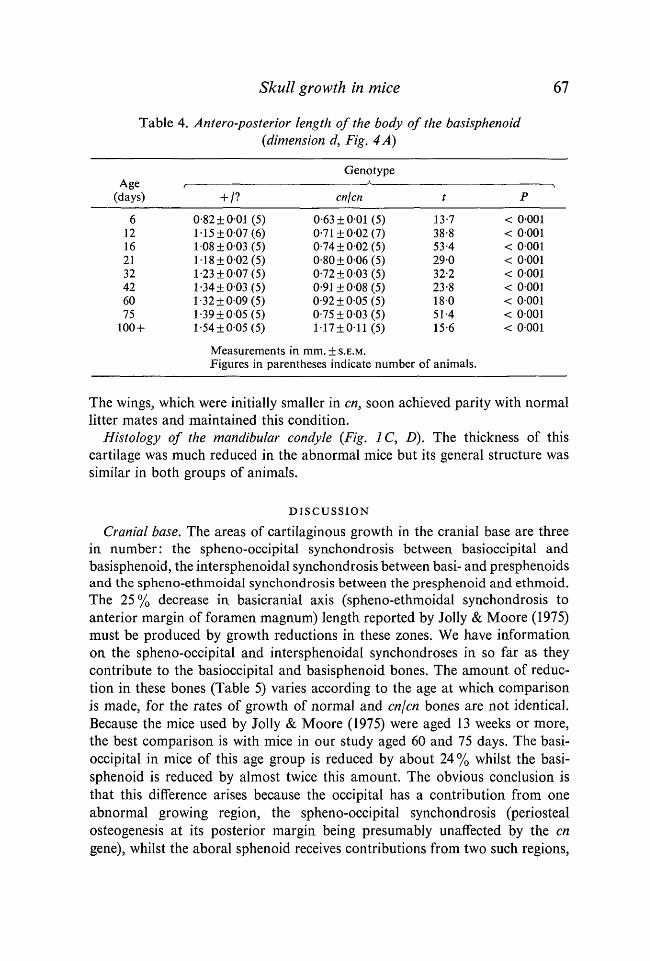
which ossified in cartilage, and two wings which form in membrane. At 6 days,the antero-posterior length (Dimension d, Fig. 4A, Table 4) and total widthfrom right to left wings were reduced, but, as with the occipital, the widthincreased to that of the normal bone, whilst the length remained subnormal.
Skull growth in mice 65
1 mm
D
Fig. 3. Basioccipital bones of normal (thick line) and cn/cn (thin line) mice aged(A) 6d, (B) 12d, (C) 16d, (D) 21 d, (E) 32d.
66 A. K. BREWER, D. R. JOHNSON AND W. J. MOORE
H
Fig. 4. Basisphenoids of normal (thick line) and en]en (thin line) mice aged (A) 6d,(B) 12d, (C) 16d, (D) 21 d, (E) 32d, (F) 42d, (G) 60d, (H) 75d.
Skull growth in mice 67
Table 4. Antero-posterior length of the body of the basisphenoid(dimension d, Fig. 4 A)
Age(days)
612162132426075
100 +
+ /?
0-82 ±001 (5)1-15±007 (6)108±003 (5)118±002 (5)1-23±007 (5)1-34±003 (5)1-32±009 (5)1-39±005 (5)1-54±005 (5)
Measurements
Genotype
cn\cn
0-63 ±001 (5)0-71 ±002 (7)0-74±002 (5)0-80±006 (5)0-72 ±0-03 (5)0-91 ±008 (5)0-92±005 (5)0-75±003 (5)1 17 ±011(5)
in mm. ±S.E.M.
t
13-738-853-429032-223-818051-415-6
Figures in parentheses indicate number of animals.
P
< 0001< 0001< 0001< 0001< 0001< 0001< 0001< 0001< 0001
The wings, which were initially smaller in en, soon achieved parity with normallitter mates and maintained this condition.
Histology of the mandibular condyle (Fig. 1C, D). The thickness of thiscartilage was much reduced in the abnormal mice but its general structure wassimilar in both groups of animals.
DISCUSSION
Cranial base. The areas of cartilaginous growth in the cranial base are threein number: the spheno-occipital synchondrosis between basioccipital andbasisphenoid, the intersphenoidal synchondrosis between basi- and presphenoidsand the spheno-ethmoidal synchondrosis between the presphenoid and ethmoid.The 25% decrease in basicranial axis (spheno-ethmoidal synchondrosis toanterior margin of foramen magnum) length reported by Jolly & Moore (1975)must be produced by growth reductions in these zones. We have informationon the spheno-occipital and intersphenoidal synchondroses in so far as theycontribute to the basioccipital and basisphenoid bones. The amount of reduc-tion in these bones (Table 5) varies according to the age at which comparisonis made, for the rates of growth of normal and cn\cn bones are not identical.Because the mice used by Jolly & Moore (1975) were aged 13 weeks or more,the best comparison is with mice in our study aged 60 and 75 days. The basi-occipital in mice of this age group is reduced by about 24% whilst the basi-sphenoid is reduced by almost twice this amount. The obvious conclusion isthat this difference arises because the occipital has a contribution from oneabnormal growing region, the spheno-occipital synchondrosis (periostealosteogenesis at its posterior margin being presumably unaffected by the engene), whilst the aboral sphenoid receives contributions from two such regions,
68 A. K. BREWER, D. R. JOHNSON AND W. J. MOORE
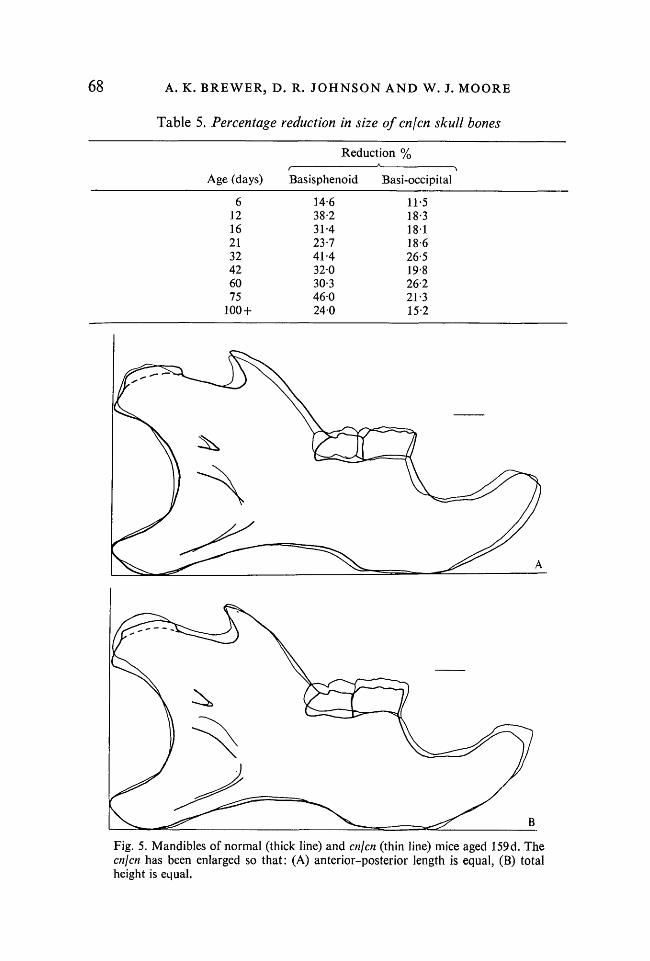
Table 5. Percentage reduction in size of cnjcn skull bones
Reduction %
; (days)
612162132426075
100 +
Basisphenoid
14-638-231-423-741-432030-3460240
Basi-occipital
11 518-318118-626-519-826-221-315-2
Fig. 5. Mandibles of normal (thick line) and cnjcn (thin line) mice aged 159d. Thecnjcn has been enlarged so that: (A) anterior-posterior length is equal, (B) totalheight is equal.
Skull growth in mice 69the spheno-occipital and intersphenoidal synchondroses. The basisphenoidmay in this respect be compared to a long bone, which also has a growingregion at each end, and indeed the reduction of some 40 % seen in the basi-sphenoid tallies well with the reduction seen in the humerus (Lane & Dickie,1968, 34-3%; Jolly & Moore, 1975, 38%; Silberberg & Lesker, 1975, 36%).
The disproportion introduced into the bodies of both basisphenoid and basi-occipital of the cnjcn mice resembles that found in the long bones of the post-cranial skeleton. In each case, the length of the bone between epiphyses(synchondroses) is reduced whilst its width remains just below, or indeed insome cases slightly exceeds, the normal dimension.
Koski & Ronning (1969, 1970) found that synchondritic cartilage grows lesswell than epiphyseal cartilage when transplanted, and this has led to a beliefin some quarters that epiphyseal and synchondritic cartilage differ in somerespect. If this is true, then the difference is not reflected in the effects of the engene.
Mandible. The mandible, however, presents a rather different picture. Here,although the overall size is reduced (11 % in Jolly & Moore's study), there isno sign of disproportion (Fig. 5).
Griineberg (1963) has suggested that appositional growth (as found in thesecondary cartilage of the mandibular condyle) is less affected by achondro-plasias than is interstitial growth. The relatively minor morphological effectsobserved in the enjen mandible would, by themselves, lead us to go further andsuggest that secondary cartilage is unaffected by this gene, the small reductionin mandibular size being attributable to regulating changes in response to theshortened cranial base and the diminution of muscle function consequent uponthe malocclusion that develops in achondroplasic mice (Moore, 1967, 1973).However, light histology revealed that the cartilage of the mandibular condyleis reduced in thickness, although not noticeably disrupted, in enjen mice,indicating that some dysfunction is present. The answer to this problem lies inthe relatively unexplored area of the differences between primary and secondarycartilage (see Hall, 1975, for a discussion of the possible phylogenetic andontogenetic significance of these tissues). Whatever these differences might be(and we are a long way from finding out, as ultrastructural studies of mandi-bular secondary cartilage are just appearing - Silbermann & Frommer, 1972;Appleton, 1975), it seems possible that the genetically determined achondro-plasias might prove a useful investigatory tool. They are clearly multifactorialin origin (Rimoin, 1975) and it may well be that one or other will be found toaffect the mandibular condyle differentially.
70 A. K. BREWER, D. R. JOHNSON AND W. J. MOORE
REFERENCES
APPLETON, J. (1975). The ultrastructure of the articular tissue of the mandibular condyle inthe rat. Archs oral Biol. 20, 823-826.
BLACKWOOD, H. J. J. (1966). Growth of the mandibular condyle of the rat studied withtritiated thymidine. Archs oral Biol. 11, 493-500.
CREW, F. A. E. (1923). The significance of an achondroplasia-like condition met with incattle. Proc. R. Soc. B 95, 228-255.
DURKIN, J. F., IRVING, P. T. & HEELEY, J. D. (1969). A comparison of the circulatory andcalcification patterns in the mandibular condyle of guinea pig with those found in the tibialepiphyseal plate. Archs oral Biol. 14, 1365-1371.
FROMMER, J., MONROE, C. W., MOREHEAD, J. R. & BELT, W. D. (1968). Autoradiographicstudy and cellular proliferation during early development of the mandibular condyle inmice. / . dent. Res. 47, 817-819.
FROST, H. M. (1969). Tetracycline-based histological analysis of bone remodelling. Calc.Tiss. Res. 3, 211-237.
GRUNEBERG, H. (1963). The Pathology of Development. Oxford: Blackwell.HALL, B. K. (1975). Evolutionary consequences of skeletal differentiation. Am. Zool. 15,
329-350.JOLLY, R. J. & MOORE, W. J. (1975). Skull growth in achondroplasic (en) mice: a craniometric
study. / . Embryol. exp. Morph. 33, 1013-1022.KONYUKHOV, B. V. & PASCHIN, Y. V. (1970). Abnormal growth of the body, internal organs
and skeletons in achondroplasic mice. Acta biol. hung. 21, 347-354.KOSKI, K. & RONNING, O. (1969). Growth potential of subcutaneously transplanted cranial
base synchondroses of the rat. Acta odont. scand. 27, 343-357.KOSK[, K. & RONNING, O. (1970). Growth potential of intracerebrally transplanted cranial
base synchondroses in the rat. Archs oral Biol. 15, 1107-1108.LANDAUER, W. & CHANG, T. K. (1949). The Ancon or otter sheep. History and genetics.
J. Hered. 40, 105-112.LANE, P. W. & DICKIE, M. M. (1968). Three recessive mutations producing disproportionate
dwarfism in mice. / . Hered. 59, 300-308.MEIKLE, M. C. (1973). The role of the condyle in the postnatal growth of the mandible.
Am. J. Orthod. 64, 50-62.MOORE, W. J. (1967). Muscular function and skull growth in the laboratory rat (Rattus
norvegicus). J. Zool. Lond. 152, 287-296.MOORE, W. J. (1973). An experimental study of the functional components of growth in the
rat mandible. Acta anat. 85, 378-385.RIMOIN, D. L. (1975). The condrodystrophies. Adv. Hum. Genet. 5, 1-118.SILBERBERG, R. & LESKER, P. (1975). Skeletal growth and development of achondroplastic
mice. Growth 39, 17-33.SILBERMANN, M. & FROMMER, J. (1972). The nature of endochondral ossification in the
mandibular condyle of the mouse. Anat. Rec. 172, 659-667.SPURR, A. R. (1969). A low viscosity epoxy resin embedding medium for electron microscopy.
/ . ultrastruct. Res. 26, 31-43.STOCKARD, C. R. (1941). The Genetic and Endocrine Basis for Differences in Form and
Behaviour. Philadelphia: The Wistar Institute of Anatomy and Biology.TAM, C. S., REED, R. & CRUICKSHANK, B. (1974a). Bone growth kinetics I. Modification of
the tetracycline labelling technique. / . Path. 113, 27-38.TAM, C. S., REED, R. & CRUICKSHANK, B. (19746). Bone growth kinetics II. Short term
observations on bone growth in Sprague-Dawley rats. / . Path. 113, 39-46.TAM, C. S., REED, R. & CRUICKSHANK, B. (1974C). Bone growth kinetics III. A biorhythm in
bone growth in the rabbit. /. Path. 114, 127-133.
(Received 10 August 1976, revised 26 January 1977)