Embed Size (px)
Citation preview

Further Education and Training Colleges in South Africa at a Glance in 2010: Eastern Cape: East Cape Midlands FET College
i
FURTHER EDUCATION AND TRAINING COLLEGES IN SOUTH AFRICA AT A GLANCE IN 2010
Eastern Cape: East Cape Midlands
FET College
Report prepared for the
Department of Higher Education and Training
Authors: Michael Cosser, Tshilidzi Netshitangani,
Thembinkosi Twalo, Shawn Rogers, Gamong
Mokgatle, Bongiwe Mncwango, Andrea Juan
with
Vanessa Taylor, Carel Garisch and Marianne Spies
Date: August 2011
Further Education and Training Colleges in South Africa at a Glance in 2010: Eastern Cape: East Cape Midlands FET College
ii
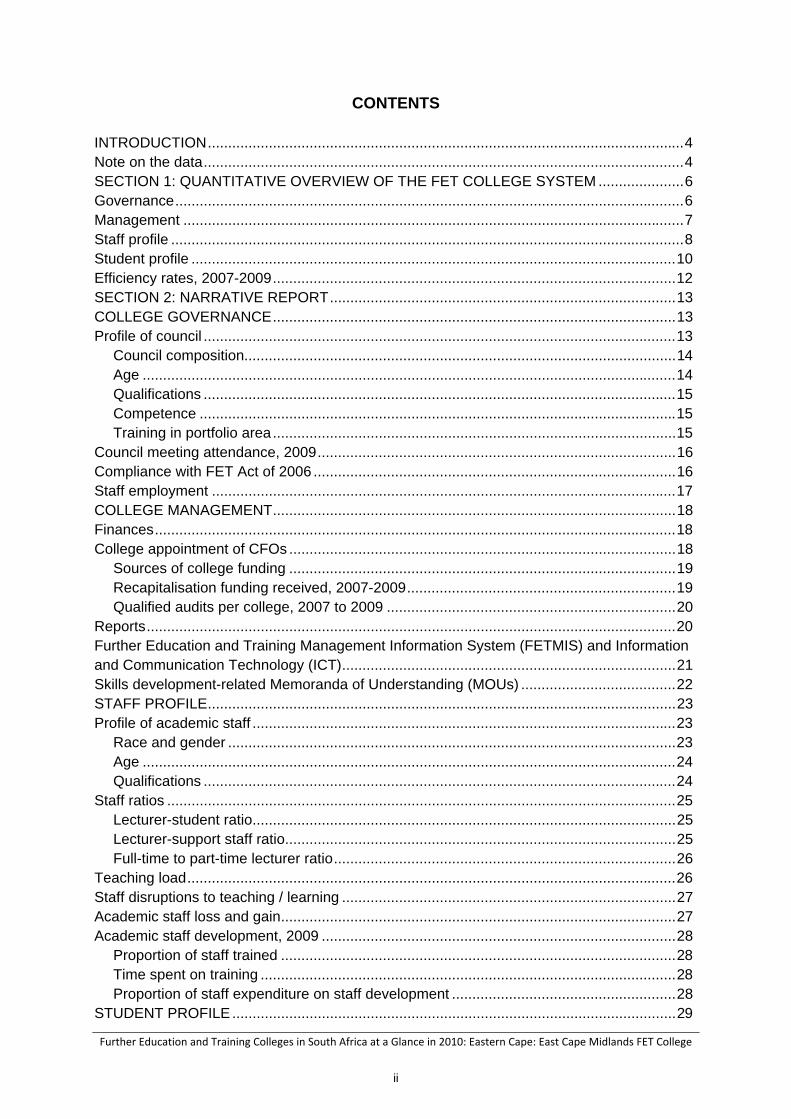
CONTENTS INTRODUCTION ..................................................................................................................... 4 Note on the data ...................................................................................................................... 4 SECTION 1: QUANTITATIVE OVERVIEW OF THE FET COLLEGE SYSTEM ..................... 6 Governance ............................................................................................................................. 6 Management ........................................................................................................................... 7 Staff profile .............................................................................................................................. 8 Student profile ....................................................................................................................... 10 Efficiency rates, 2007-2009 ................................................................................................... 12 SECTION 2: NARRATIVE REPORT ..................................................................................... 13 COLLEGE GOVERNANCE ................................................................................................... 13 Profile of council .................................................................................................................... 13
Council composition.......................................................................................................... 14 Age ................................................................................................................................... 14 Qualifications .................................................................................................................... 15 Competence ..................................................................................................................... 15 Training in portfolio area ................................................................................................... 15
Council meeting attendance, 2009 ........................................................................................ 16 Compliance with FET Act of 2006 ......................................................................................... 16 Staff employment .................................................................................................................. 17 COLLEGE MANAGEMENT ................................................................................................... 18 Finances ................................................................................................................................ 18 College appointment of CFOs ............................................................................................... 18
Sources of college funding ............................................................................................... 19 Recapitalisation funding received, 2007-2009 .................................................................. 19 Qualified audits per college, 2007 to 2009 ....................................................................... 20
Reports .................................................................................................................................. 20 Further Education and Training Management Information System (FETMIS) and Information and Communication Technology (ICT) .................................................................................. 21 Skills development-related Memoranda of Understanding (MOUs) ...................................... 22 STAFF PROFILE ................................................................................................................... 23 Profile of academic staff ........................................................................................................ 23
Race and gender .............................................................................................................. 23 Age ................................................................................................................................... 24 Qualifications .................................................................................................................... 24
Staff ratios ............................................................................................................................. 25 Lecturer-student ratio ........................................................................................................ 25 Lecturer-support staff ratio ................................................................................................ 25 Full-time to part-time lecturer ratio .................................................................................... 26
Teaching load ........................................................................................................................ 26 Staff disruptions to teaching / learning .................................................................................. 27 Academic staff loss and gain ................................................................................................. 27 Academic staff development, 2009 ....................................................................................... 28
Proportion of staff trained ................................................................................................. 28 Time spent on training ...................................................................................................... 28 Proportion of staff expenditure on staff development ....................................................... 28
STUDENT PROFILE ............................................................................................................. 29
Further Education and Training Colleges in South Africa at a Glance in 2010: Eastern Cape: East Cape Midlands FET College
iii
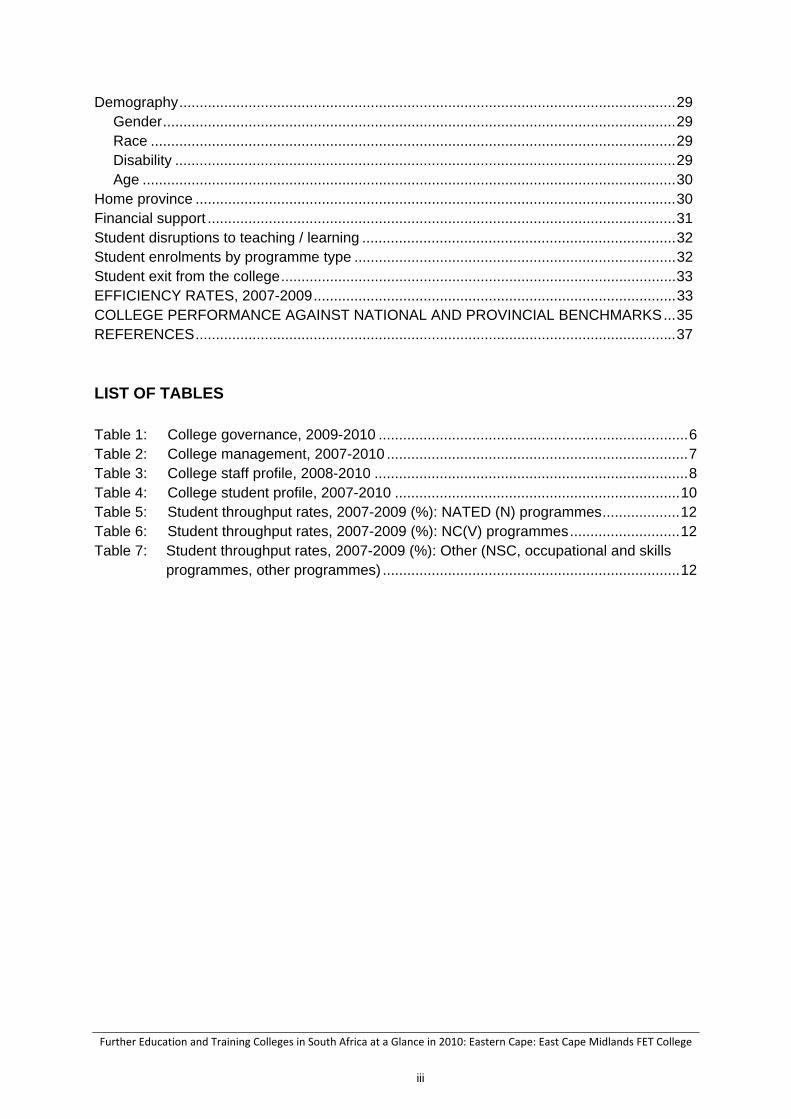
Demography .......................................................................................................................... 29 Gender .............................................................................................................................. 29 Race ................................................................................................................................. 29 Disability ........................................................................................................................... 29 Age ................................................................................................................................... 30
Home province ...................................................................................................................... 30 Financial support ................................................................................................................... 31 Student disruptions to teaching / learning ............................................................................. 32 Student enrolments by programme type ............................................................................... 32 Student exit from the college ................................................................................................. 33 EFFICIENCY RATES, 2007-2009 ......................................................................................... 33 COLLEGE PERFORMANCE AGAINST NATIONAL AND PROVINCIAL BENCHMARKS ... 35 REFERENCES ...................................................................................................................... 37
LIST OF TABLES Table 1: College governance, 2009-2010 ............................................................................ 6 Table 2: College management, 2007-2010 .......................................................................... 7 Table 3: College staff profile, 2008-2010 ............................................................................. 8 Table 4: College student profile, 2007-2010 ...................................................................... 10 Table 5: Student throughput rates, 2007-2009 (%): NATED (N) programmes ................... 12 Table 6: Student throughput rates, 2007-2009 (%): NC(V) programmes ........................... 12 Table 7: Student throughput rates, 2007-2009 (%): Other (NSC, occupational and skills
programmes, other programmes) ......................................................................... 12
Further Education and Training Colleges in South Africa at a Glance in 2010: Eastern Cape: East Cape Midlands FET College
4
INTRODUCTION
In May-June 2010 the Human Sciences Research Council (HSRC) undertook, on behalf of the National Board for Further Education and Training (NBFET), an audit of the Further Education and Training (FET) college sector in South Africa. The corporate campuses of all fifty colleges were visited over a two-day period. In the course of the audit, the HSRC collected information on college governance and management, staff and student profiles, and student efficiency rates. While the research team’s brief was to focus on college governance and management in an attempt to address the question of whether colleges were ready to be absorbed into the newly-formed Department of Higher Education and Training (DHET) and to operate on a defined autonomy basis, the comprehensiveness of the audit (entailing visits to all 50 colleges) provided the research team with an opportunity to collect information on the other aforementioned aspects: staff and student profiles; and student efficiency rates. The decision to collect these other pieces of information was motivated also by the rationale that colleges’ ability to participate in the survey would itself provide a good indication of their capacity for self-governance. Indeed, the findings of the audit bear out the differential capacity of the different parts of the sector in responding to an exercise of this kind.
This report is indicator-driven, the key points of measurement within the five areas under investigation (governance; management; staff profiles; student profiles; and efficiency rates) having been condensed into high-level findings that can readily be absorbed by policy-makers and departmental officials alike.
There are two sections to this report. The first presents, in five sub-sections, a set of tables containing key high-level findings of the project. The five sub-sections are: Governance; Management; Staff Profiles; Student Profiles; and Efficiency Rates. The second section comprises a narrative report based upon the tables in Section 1.
The organising principle behind the report is comparative. There is a report on each of the fifty colleges, each report comparing the college’s status or performance on any given indicator to the national profile and to the profile of the province in which the college is located. This enables the reader to assess “at a glance” the extent to which the college conforms to or deviates from national and provincial profiles.
Note on the data
Every effort was made, during the fieldwork period and over the two months following it, to collect the six pieces of data from each college reproduced in the appendices: three questionnaires – Governance, Management and Administration, and Profiles and Efficiency Indicators; and three spreadsheets – council member, staff, and student profiles. Certain colleges were not, however, able to provide all the data requested. In total, the HSRC received completed Governance, Management and Administration, and Profiles and Efficiency Indicators questionnaires from all 50 colleges, council member spreadsheets from 41 of the 50 colleges, staff member spreadsheets from 46 of the 50 colleges, and student spreadsheets from 41 of the 50 colleges.
Further Education and Training Colleges in South Africa at a Glance in 2010: Eastern Cape: East Cape Midlands FET College
5
In order to provide as full a picture as possible of staff and student profiles, the research team has elected to supplement the missing data with data from the Further Education and Training Management Information System (FETMIS) data of the DHET. Accordingly, certain data in the tables in Section 1 are taken or derived from the recently released preliminary data-sets on the FET college system (DHET, 2011). The full data-set, showing which data is FET audit- and which data is FETMIS-derived, is available on request.
Further Education and Training Colleges in South Africa at a Glance in 2010: Eastern Cape: East Cape Midlands FET College
6
SECTION 1: QUANTITATIVE OVERVIEW OF THE FET COLLEGE SYSTEM
Governance
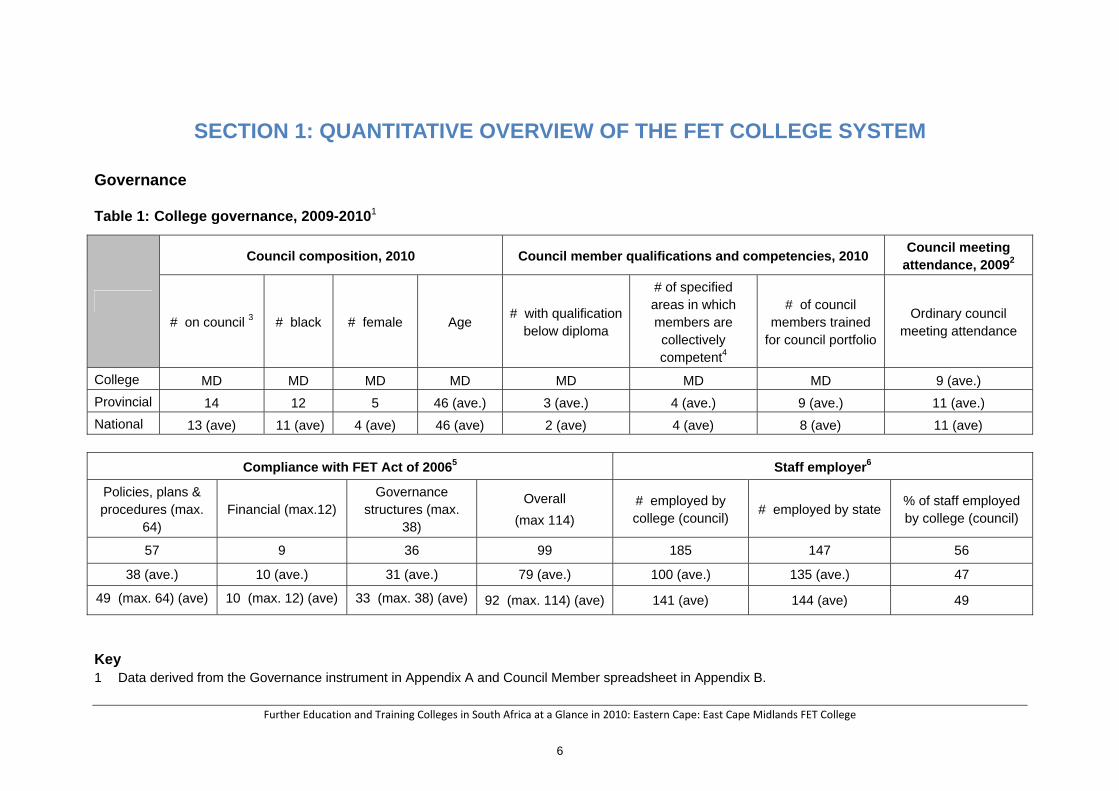
Table 1: College governance, 2009-20101
Council composition, 2010 Council member qualifications and competencies, 2010 Council meeting
attendance, 20092
# on council 3 # black # female Age # with qualification
below diploma
# of specified areas in which members are collectively competent4
# of council members trained
for council portfolio
Ordinary council meeting attendance
College MD MD MD MD MD MD MD 9 (ave.)
Provincial 14 12 5 46 (ave.) 3 (ave.) 4 (ave.) 9 (ave.) 11 (ave.)
National 13 (ave) 11 (ave) 4 (ave) 46 (ave) 2 (ave) 4 (ave) 8 (ave) 11 (ave)
Compliance with FET Act of 20065 Staff employer6
Policies, plans & procedures (max.
64) Financial (max.12)
Governance structures (max.
38)
Overall
(max 114)
# employed by college (council)
# employed by state % of staff employed by college (council)
57 9 36 99 185 147 56
38 (ave.) 10 (ave.) 31 (ave.) 79 (ave.) 100 (ave.) 135 (ave.) 47
49 (max. 64) (ave) 10 (max. 12) (ave) 33 (max. 38) (ave) 92 (max. 114) (ave) 141 (ave) 144 (ave) 49
Key 1 Data derived from the Governance instrument in Appendix A and Council Member spreadsheet in Appendix B.

Further Education and Training Colleges in South Africa at a Glance in 2010: Eastern Cape: East Cape Midlands FET College
7
2 Combined attendance of the first four meetings listed by the college divided by the total possible attendance of the four meetings. 3 The FET Act (2006) specifies that there should be 16 members on the council. 4 No. of categories (out of 7) in which the college collectively has competence as per the FET Act of 2006 (one point allocated per category regardless of
how many members are competent in a category). 5 The following variables were included under “Policies, plans and procedures”: V4.1-8; V4.18-33; V5.8; V12.2-7. Under “Financial governance” the
following were included: V4.9-15. Under “Governance structures” the following were included: V1.2-3; V8.1-5; V9.1-4; V9.6-7; V9.9; V11.1-5. 6 Staff = all staff of the college (lecturing, management and support), of whom only two – the principal and his/her deputy – should (according to the FET Act
of 2006) be management staff and employed by the state. Data derived from the Staff member spreadsheet in Appendix C.
Management
Table 2: College management, 2007-20101
Finances Reports FETMIS System ICT
# of colleges with CFOs
Sources of college
funding (%)2
Recapitalisation funding received,
2007-2009
# of qualified
audits per college,
2007-2009
College submission of reports to
council, 2007-20093Name of system 4
Effectiveness of college usage of
ICT5
(max. rating 42)
College 1 39 R 37,490,000 3 20 COLTECH 32
Provincial 1 (actual) 43 R 34,729,285 (ave.) 1 (ave.) 21 (ave.) DB2000 (6 actual) 20 (ave.)
National 14 (actual) 39 R 39,316,380(ave) 1 (ave) 19 (max. 24) (ave) COLTECH (28 actual) 29 (max. 42) (ave)
# of skills development-related MOUs
Business Local communities SETAs Other education & training institutions
Local governmental departments and
municipalities Other institutions
9 0 1 2 2 1
2 (ave.) 0 (ave.) 1 (ave.) 2 (ave.) 2 (ave.) 1 (ave.)
2 (ave) 0 (ave) 1 (ave) 1 (ave) 1 (ave) 0 (ave)
Further Education and Training Colleges in South Africa at a Glance in 2010: Eastern Cape: East Cape Midlands FET College
8
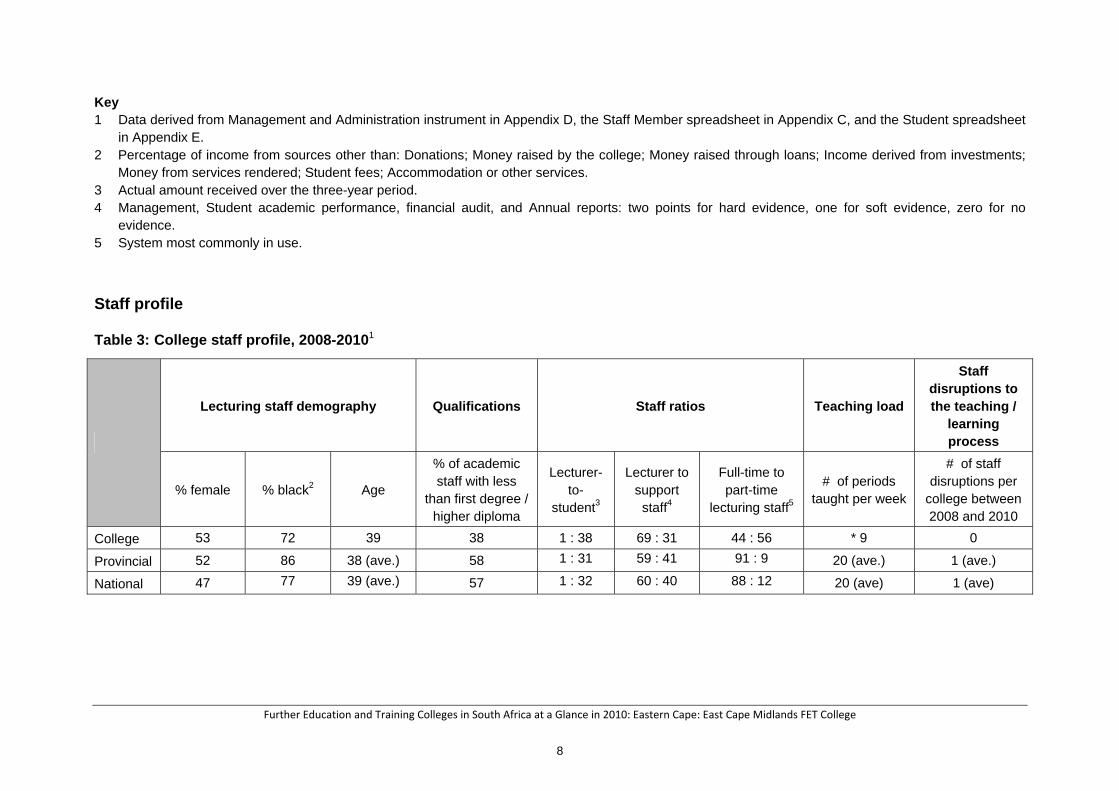
Key 1 Data derived from Management and Administration instrument in Appendix D, the Staff Member spreadsheet in Appendix C, and the Student spreadsheet
in Appendix E. 2 Percentage of income from sources other than: Donations; Money raised by the college; Money raised through loans; Income derived from investments;
Money from services rendered; Student fees; Accommodation or other services. 3 Actual amount received over the three-year period. 4 Management, Student academic performance, financial audit, and Annual reports: two points for hard evidence, one for soft evidence, zero for no
evidence. 5 System most commonly in use.
Staff profile
Table 3: College staff profile, 2008-20101
Lecturing staff demography Qualifications Staff ratios Teaching load
Staff disruptions to the teaching /
learning process
% female % black2 Age
% of academic staff with less
than first degree / higher diploma
Lecturer-to-
student3
Lecturer to support staff4
Full-time to part-time
lecturing staff5
# of periods taught per week
# of staff disruptions per
college between 2008 and 2010
College 53 72 39 38 1 : 38 69 : 31 44 : 56 * 9 0
Provincial 52 86 38 (ave.) 58 1 : 31 59 : 41 91 : 9 20 (ave.) 1 (ave.)
National 47 77 39 (ave.) 57 1 : 32 60 : 40 88 : 12 20 (ave) 1 (ave)

Further Education and Training Colleges in South Africa at a Glance in 2010: Eastern Cape: East Cape Midlands FET College
9
Academic staff loss and gain, 2008-2010
2008 2009 2010 Net loss/gain,
2008-20106
Total no. of lecturing
staff Gain Loss Main cause
of loss Gain Loss
Main cause of loss
Gain Loss Main cause
of loss
College 14 15 Resignation 16 6 Resignation 19 3 Resignation +25 110
Provincial 25 (ave.) 16 (ave.) Resignation 57 (ave.) 8 (ave.) Retirement 41 (ave.) 2 (ave.) Death &
Resignation42 (ave.) 133 (ave.)
National 44 (ave) 30 (ave) Resignation (25 actual) (MD = 17)
59 (ave) 23 (ave) Resignation (26 actual) (MD = 17)
28 (ave) 7 (ave) Resignation (27 actual) (MD = 19)
+46 (ave) 167 (ave.)
Academic staff development in 2009
Proportion of staff trained (%)7 Time spent on training per staff member (days) Proportion of total college expenditure on
staff development (%)
College 118 4 2
Provincial 63 4 (ave) 1.6
National 65 10 (ave) 1.4
Key *=FETMIS data 1 Data derived from the Management and Administration instrument in Appendix D and the Staff Member spreadsheet in Appendix E. 2 Black = black African, coloured and Indian / Asian. 3 Ratio of total number of lecturing staff to total number of students enrolled. 4 Percentage of total lecturing staff to percentage of total support staff. 5 Percentage of total full-time lecturing staff to percentage of total part-time lecturing staff. 6 Average net gain = “+” (e.g., +25); average net loss = “-” (e.g., -10). 7 Categories are: retirement; ill-health; death; resignation; unhappiness with college; and other. 8 Number of staff trained (v43.6) divided by the number of academic staff in the college (v.47.28+v47.37) (Management instrument, Appendix D).
Further Education and Training Colleges in South Africa at a Glance in 2010: Eastern Cape: East Cape Midlands FET College
10
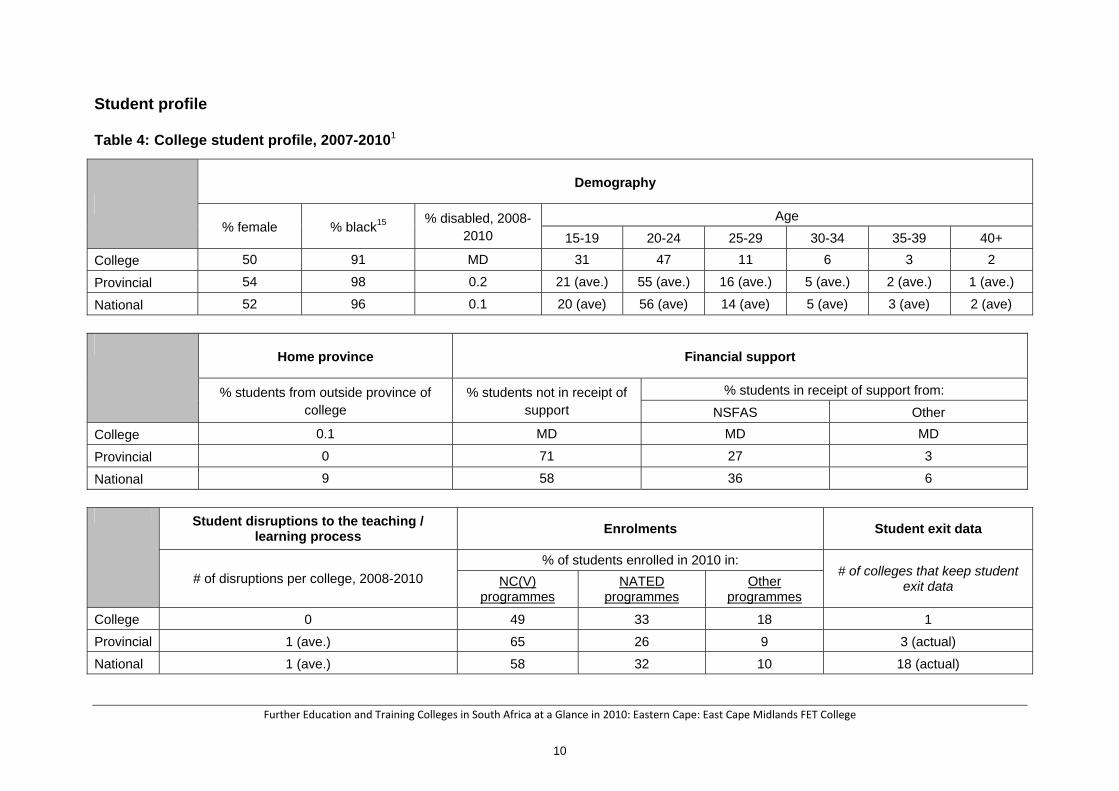
Student profile
Table 4: College student profile, 2007-20101
Demography
% female % black15 % disabled, 2008-
2010
Age
15-19 20-24 25-29 30-34 35-39 40+
College 50 91 MD 31 47 11 6 3 2
Provincial 54 98 0.2 21 (ave.) 55 (ave.) 16 (ave.) 5 (ave.) 2 (ave.) 1 (ave.)
National 52 96 0.1 20 (ave) 56 (ave) 14 (ave) 5 (ave) 3 (ave) 2 (ave)
Home province Financial support
% students from outside province of college
% students not in receipt of support
% students in receipt of support from:
NSFAS Other
College 0.1 MD MD MD
Provincial 0 71 27 3
National 9 58 36 6
Student disruptions to the teaching /
learning process Enrolments Student exit data
# of disruptions per college, 2008-2010 % of students enrolled in 2010 in:
# of colleges that keep student exit data NC(V)
programmes NATED
programmes Other
programmes
College 0 49 33 18 1
Provincial 1 (ave.) 65 26 9 3 (actual)
National 1 (ave.) 58 32 10 18 (actual)
Further Education and Training Colleges in South Africa at a Glance in 2010: Eastern Cape: East Cape Midlands FET College
11
Key 1 Data derived from the Management and Administration instrument in Appendix D and the Student spreadsheet in Appendix E.
Further Education and Training Colleges in South Africa at a Glance in 2010: Eastern Cape: East Cape Midlands FET College
12
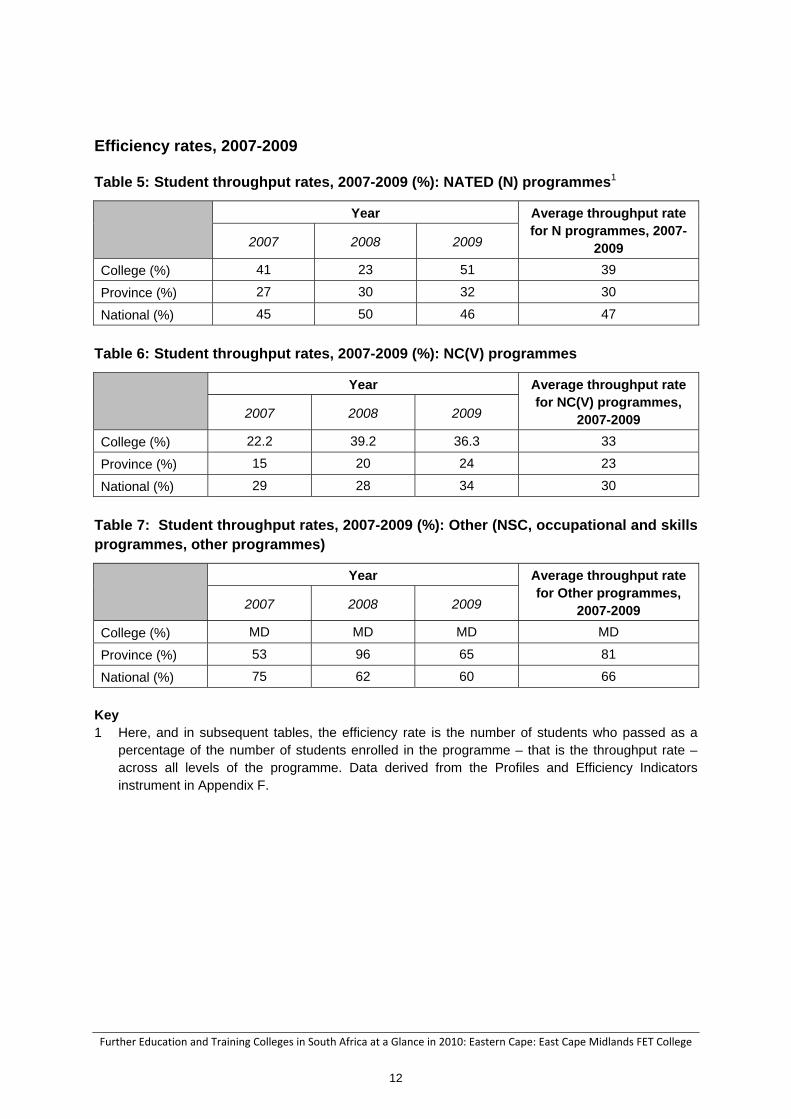
Efficiency rates, 2007-2009
Table 5: Student throughput rates, 2007-2009 (%): NATED (N) programmes1
Year Average throughput rate for N programmes, 2007-
2009 2007 2008 2009
College (%) 41 23 51 39
Province (%) 27 30 32 30
National (%) 45 50 46 47
Table 6: Student throughput rates, 2007-2009 (%): NC(V) programmes
Year Average throughput rate for NC(V) programmes,
2007-2009 2007 2008 2009
College (%) 22.2 39.2 36.3 33
Province (%) 15 20 24 23
National (%) 29 28 34 30
Table 7: Student throughput rates, 2007-2009 (%): Other (NSC, occupational and skills programmes, other programmes)
Year Average throughput rate for Other programmes,
2007-2009 2007 2008 2009
College (%) MD MD MD MD
Province (%) 53 96 65 81
National (%) 75 62 60 66
Key 1 Here, and in subsequent tables, the efficiency rate is the number of students who passed as a
percentage of the number of students enrolled in the programme – that is the throughput rate – across all levels of the programme. Data derived from the Profiles and Efficiency Indicators instrument in Appendix F.
Further Education and Training Colleges in South Africa at a Glance in 2010: Eastern Cape: East Cape Midlands FET College
13
SECTION 2: NARRATIVE REPORT
COLLEGE GOVERNANCE
Profile of council
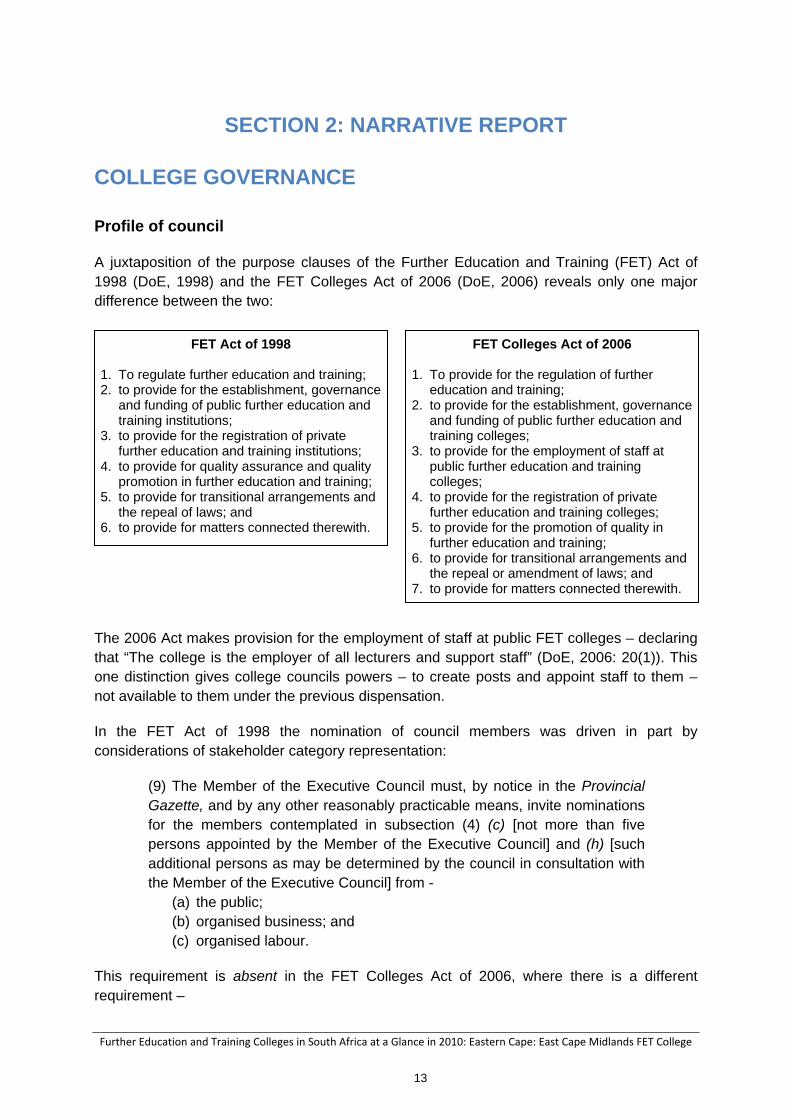
A juxtaposition of the purpose clauses of the Further Education and Training (FET) Act of 1998 (DoE, 1998) and the FET Colleges Act of 2006 (DoE, 2006) reveals only one major difference between the two:
The 2006 Act makes provision for the employment of staff at public FET colleges – declaring that “The college is the employer of all lecturers and support staff” (DoE, 2006: 20(1)). This one distinction gives college councils powers – to create posts and appoint staff to them – not available to them under the previous dispensation.
In the FET Act of 1998 the nomination of council members was driven in part by considerations of stakeholder category representation:
(9) The Member of the Executive Council must, by notice in the Provincial Gazette, and by any other reasonably practicable means, invite nominations for the members contemplated in subsection (4) (c) [not more than five persons appointed by the Member of the Executive Council] and (h) [such additional persons as may be determined by the council in consultation with the Member of the Executive Council] from -
(a) the public; (b) organised business; and (c) organised labour.
This requirement is absent in the FET Colleges Act of 2006, where there is a different requirement –
FET Act of 1998
1. To regulate further education and training; 2. to provide for the establishment, governance
and funding of public further education and training institutions;
3. to provide for the registration of private further education and training institutions;
4. to provide for quality assurance and quality promotion in further education and training;
5. to provide for transitional arrangements and the repeal of laws; and
6. to provide for matters connected therewith.
FET Colleges Act of 2006
1. To provide for the regulation of further education and training;
2. to provide for the establishment, governance and funding of public further education and training colleges;
3. to provide for the employment of staff at public further education and training colleges;
4. to provide for the registration of private further education and training colleges;
5. to provide for the promotion of quality in further education and training;
6. to provide for transitional arrangements and the repeal or amendment of laws; and
7. to provide for matters connected therewith.

Further Education and Training Colleges in South Africa at a Glance in 2010: Eastern Cape: East Cape Midlands FET College
14
(6) The council must, in consultation with the Member of the Executive Council, appoint four additional external persons with financial, human resources and legal skills as members of the council
– a requirement extended in the Standard College Statute (which also forms part of the 2006 Act) to include “a broad spectrum of competencies in the fields of education, business, finance, law, marketing, information technology and human resource management” (DoE, 2006: 6(1)(h)). Appointment of lecturing staff, then, pre-supposes certain kinds of academic and professional expertise amongst council members – which underpins the nature of the investigation of college council composition below.
Council composition
The FET Act of 2006 specifies that there should be 16 members on each college council. The reasons for having a fairly large number of persons on councils are implied rather than explicitly stated in the FET Act (2006). From the Governance table in Section 1 we see that the average number of council members at national level is 13 and at provincial level is 14 – which falls short of the requirement of the Act. East Cape Midlands FET College did not supply this information.
The council should be broadly representative of the community served by the public college in terms of race, gender and disability (DoE, 2006: 7(c)). With regard to race, it should also be representative in terms of national and provincial demographics. With regard to gender, the council composition should ideally reflect the percentage distribution of females in the general population (52% female).
In 1998, Hall (1999) found, in a study of technical colleges in KwaZulu-Natal, that the majority (49%) of council members were white. There are no figures for the country as a whole (the National Business Initiative publications (Powell & Hall, 2000; 2002; 2004) do not report on this); but from the 2010 audit we see that, nationally, an average of 11 council members are black (black here, and throughout the report, comprises black African, coloured, and Indian / Asian persons). There has been a major change in council member representation since the late 1990s, black representation now approximating the proportion of black people in the general population (around 90%). Provincially, on average 12 council members are black. This data is missing for the college in question.
From a gender perspective, 5 members of council provincially are female. No figures for the college are available. Female representivity at provincial and national levels therefore falls significantly short of the 52% ideal. By implication, colleges have a long way to go to achieve the optimal balance in this regard.
Age
Our interpretation of the age of council members is that a council with an average age of below 30 is possibly too young and inexperienced to govern a college with wisdom, while an average age of 60 or more would suggest that the council is on average too old, in that while it brings collective experience and wisdom to the governing process, it does not cater for

Further Education and Training Colleges in South Africa at a Glance in 2010: Eastern Cape: East Cape Midlands FET College
15
youth by bringing new blood into the council. The average age of council members in this province is 46, identical to the national average. There are no data for this college.
Qualifications
From a qualifications perspective, the possession by a council member of a diploma or above would ensure that members have a certain depth of knowledge in a particular discipline and are therefore well qualified to make judgements about issues of college governance, especially regarding academic matters. At national level on average 2 council members have qualifications below a diploma while at provincial level on average 3 council members have qualifications below a diploma. The college has not furnished the qualifications of the council members. However, from the available data we see that 1 council member has a qualification below a diploma. These figures suggest a relatively high level of education amongst council members.
Competence
The 2006 Act, as indicated earlier, requires broad council competence in a range of specified areas. If all external members have expertise in the same field, however, this will compromise the ability of the council to make decisions requiring expertise in the other specified areas. A balance, therefore, would seem to be required. Collective competence in four of the seven areas would seem to suggest an adequate representation of areas of expertise; anything below four suggests that expertise may be lacking. Nationally, the profile reveals that members are mostly competent in four areas: education, followed by finance, business, and then law. At the provincial level, we see that members are competent in education, finance and human resource management. The college council profile reveals that external members are competent in six areas: Education, business, finance, law, marketing, and human resource management.
Training in portfolio area
Besides the possession of qualifications and experience in a specified area, council members should ideally have undergone some training in their portfolio areas. A training rate where fewer than half of the council members have been trained in their portfolio area would suggest that the council is not optimally placed to make governance decisions, while a rate of more than half would suggest basic competence in decision making. At the national level, we see that an average of 8 out of 13 council members have received some training in their portfolio area – suggesting a healthy emphasis on training by the college. At the provincial level an average of 9 members have been trained. There are no data for this college.
While training in a portfolio area would seem to be important, however, exposure to portfolio-specific training in governance is no guarantee of enhanced performance. This aspect was not gauged in the course of the fieldwork.
Further Education and Training Colleges in South Africa at a Glance in 2010: Eastern Cape: East Cape Midlands FET College
16
Council meeting attendance, 2009
One of the concerns around any elected body’s functionality is the extent of meeting attendance (let alone meaningful participation). The capacity of a body to make decisions representative of the various constituencies of which it is composed would seem to depend fundamentally on the number of persons either voting for or achieving consensus on a particular issue. Clause 10(2) of the 2006 FET Colleges Act specifies that a council meeting quorum is half plus 1. This suggests that, to be considered adequate, the average attendance of ordinary council meetings in any given college should be above 50%. Poor attendance would therefore be below 50%.
We see from the national profile that the average ordinary council meeting attendance per college in 2009 – an average for the first four meetings for which attendance was indicated by college council secretaries – was 11 out of a national average of 13 members per council. Well above 50% of members attended ordinary council meetings nationally, then – a robust state of affairs. This compares with a provincial average of 11 out of 14 persons per college council. There are no data for this college.
Compliance with FET Act of 2006
A range of questions in the Governance instrument probed the extent to which FET colleges have complied with specifications of the FET Act of 2006 in three areas: policies, plans and procedures for college governance; financial governance; and governance structure establishment. (See the Governance instrument for the full set of variables included under these three areas.) 1
The Governance instrument asked project field-workers to indicate whether colleges had provided hard evidence (H) of the existence of a characteristic, soft, or spoken (S), evidence of a characteristic, or no evidence of a characteristic. Two points per variable were awarded for hard evidence, one for soft evidence, and zero for no evidence. As the Governance table in Section 1 of this report reveals, colleges could score a maximum of 64 points on the “Policies, plans and procedures” section, 12 points on the “Financial governance” section, and 38 points on the “Governance structure establishment” section – a grand total of 114 points.
While the national averages indicate greater compliance with financial governance and governance structure establishment than with policy, plan and procedure establishment, any score less than 100% in each of these three categories – or a total score of 114 – connotes a lack of full compliance, which in terms of corporate governance indicates greater or lesser deficiency.
With regard to “Policies, plans and procedures” – which included questions on the college’s strategic plan, student support, code of conduct and disciplinary measures for staff and
1 The following variables were included under “Policies, plans and procedures”: V4.1-V4.8; V4.18-V4.33; V5.8; V12.2-V12.7. Under “Financial governance” the following were included: V4.9-4.13, and V4.15. Under “Governance structures” the following were included: V1.2-V1.3; V8.1-V8.5; V9.1-V9.4; V9.6-V9.7; V9.9; V11.1-V11.5.

Further Education and Training Colleges in South Africa at a Glance in 2010: Eastern Cape: East Cape Midlands FET College
17
students, conditions of employment for staff, the language policy of the college, and the college’s admissions policy – the national average score was 49 (out of 64) per college. The provincial average was 38, and the college score was 57 – well above these averages.
With regard to “Financial governance” – which included questions on college appointment of an auditor and a financial officer, approval of the college’s financial budget, and council determination of tuition and accommodation fees payable by students / employees – the national average score was 10 (out of 12) per college. The provincial average was 10, and the college score was 9.
With regard to “Governance structure establishment” – which included questions on council establishment of an academic board and students’ representative council, appointment of committees, the composition of the academic board, and the determination of the functions of and procedures at committee meetings – the national average score was 33 (out of 38) per college. The provincial average was 31, and the college score was 36.
From a provincial perspective, the cumulative or overall average score is 79 out of 114. This is slightly below the national average of 92. The college scores 99 out if 114. This is higher than the national and provincial averages. Though the college meets most of the requirements, adequate documentation is not kept. The main implication for this college is that, in the interests of accountability and compliance, more attention must be paid to administration.
Staff employment
The staff spreadsheet gauged the extent to which the college had indeed appropriated for itself the role of staff employer as required by the 2006 FET Colleges Act. “Staff” includes all staff of the college (lecturing, management and support), of whom only two – the Principal and his / her deputy – are management staff and appointed by the Member of the Executive Council (Education) in the province.
The profile of staff appointed by the college versus those appointed by the state indicates the colleges’ levels of compliance with the FET Act of 2006. Nationally, an average of 141 staff members were found to have been appointed by the college (council), 144 by the Department of Education: 49% of staff, then, were appointed by the college (council). Since all staff except management were supposed to have been appointed by the college in the wake of the 2006 FET Act, there has been widespread non-compliance with this aspect of the legislation.
Blame for such non-compliance cannot, however, be laid at the door of individual colleges. Before the FET Act of 2006 was enacted, some colleges already had a large number of council-employed staff – due in part to the state’s failure to fill college posts. After the promulgation of the Act, the transfer of departmental staff to colleges was handled provincially rather than at college level. Staff were never fully transferred to colleges, moreover, because of failed negotiations between staff (unions) and the Department of Education over the issue. This resulted in colleges’ retention of all the departmental staff (other than those who elected not to remain in the college) they had prior to the Act. Non-
Further Education and Training Colleges in South Africa at a Glance in 2010: Eastern Cape: East Cape Midlands FET College
18
compliance with the staff transfer requirement, therefore, is a systemic rather than a college issue.
A further aggravating factor is that while, in the FET audit, most colleges classified department staff transferred to colleges as department staff, some colleges, depending on their interpretations of the request for information, may have classified these staff as college council employees. This means that while some colleges would have reported that the majority of their staff had been employed by their councils, most colleges will have reported half or fewer than half of their lecturing staff as being employed by their councils (Taylor, 2011).
The declaration arising from the 2010 FET Summit asserted that, henceforth, all core staff of the college would be appointed by the DHET, all non-core staff by the college. This distinction mirrors the situation in schools, where School Governing Bodies (SGBs) appoint what the Department of Basic Education would deem “supernumerary” staff to reduce teacher-student ratios in the classroom. The rationale behind the DHET’s decision with regard to FET college staffing is presumably to allow colleges to appoint part-time staff drawn from industry on an ad hoc, modular basis as the need arises.
The irony is that college non-compliance with regard to staffing, whatever the reasons for it, may have simplified the staffing procedures that will follow from the DHET’s new staffing policy.
COLLEGE MANAGEMENT
Finances
This section on the management of college finances deals with four areas: the number of colleges with Chief Financial Officers (CFOs); the sources of college funding; receipt of recapitalisation funds; and the number of qualified audits per college.
College appointment of CFOs
Although the FET Colleges Act of 2006 does not demand that colleges appoint CFOs – the requirement is that “The council of a public college must appoint a financial officer” (DoE, 2006: 32(2)) – the person responsible for managing college finances must perforce deal with huge and / or complex budgets and be well versed in the Public Finance Management Act (PFMA) and Treasury regulations. The likelihood of a financial officer succeeding in this role is slight. For this reason, some colleges – notably those in the Western Cape – have appointed CFOs.
At the national level, only 14 of the 50 colleges have appointed a CFO – which may contribute to the high number of qualified audits reported by colleges over a three-year period (2007-2009). At the provincial level, only 1 out of the 7 colleges has appointed a CFO: East Cape Midlands. The weak financial controls which are manifested through the qualified audits in 2007, 2008 and 2009 are a poor reflection on the CFO, however, as many colleges without CFOs performed better with regard to financial management.
Further Education and Training Colleges in South Africa at a Glance in 2010: Eastern Cape: East Cape Midlands FET College
19
Sources of college funding
Whence colleges derive their funding is a key issue for college management. Since all colleges in the FET sector are (in different measures) state-funded, we would expect departmental funding to constitute the largest source of college income. This is assessed in each college in relation to other sources of income.
The question posed in the Management questionnaire concerned the percentage of income derived from sources other than: donations; money raised by the college; money raised through loans; income derived from investments; money from services rendered; student fees; and accommodation or other services. Nationally, 39% of college income was derived from sources other than those listed – which means that nearly three-fifths of college income came from the listed sources, which do not include a grant from the Department of Education. This accounts in large measure for the financial plight in which many colleges find themselves.
At the provincial level, an average of 43% of funding comes from sources other than those listed above. In this college, 39% of the college funds were derived from partnership and project income and the Department of Education grant. This places a heavy burden on the college’s income generating capacity. This college had not received its government grant at the time of the data collection.
Recapitalisation funding received, 2007-2009
One major source of income over the period 2007 to 2009 was the Recapitalisation Fund, set up by the state to inject colleges with much-needed capital to position them to become major players in the post-school education and training landscape. An excerpt from the 21 June 2006 Minutes of the Education and Recreation Select Committee of the Parliamentary Monitoring Group looking at the recapitalisation of FET colleges (Parliamentary Monitoring Group, 2006) is worth quoting from extensively in this regard, since it encapsulates the context within which the Recapitalisation Fund was established:
Ms Penny Vinjevold (Deputy Director-General: Further Education and Training (FET), DOE) addressed the Committee …. She explained that the recapitalisation of the Further Education and Training Colleges (FET Colleges) was aiming to address the problem of unemployed youth in the country. At present 87% of children were enrolled in secondary schools, and the FET colleges had the least enrolment in South Africa. The Department aimed to improve the quality of the programmes offered and increase the enrolment in the colleges. The old N1 to N6 programs were out of date and were not leading to employment. These programmes would be phased out from 2007. The FET colleges did have the capacity and infrastructure, Treasury had given R1,9 billion for the recapitalisation process and thirteen new programmes would be introduced in 2007.
Against this backdrop, this college report seeks to pit the recapitalisation amount received by the college against the average amounts received by colleges nationally and provincially. From the Management table in Section 1 we see that the national average was R39,316,380.
Further Education and Training Colleges in South Africa at a Glance in 2010: Eastern Cape: East Cape Midlands FET College
20
The provincial average was R34, 729,285, while this particular college received an amount of R37, 490,000. This is higher than the provincial but lower than the national average. Since the Recapitalisation amounts received by colleges depended on the nature and strengths of their submissions for funding, however, the reasons for the differentials in the amounts received by colleges in a province and by the different provinces in the country are not strictly comparable. A sizeable proportion of the fund in this college was spent on: building new classrooms 43%, upgrading, refurbishing and altering infrastructure 32%, and purchasing equipment 18%.
Qualified audits per college, 2007 to 2009
An unqualified audit is issued when it is the opinion of a firm’s auditors that its financial statements are fairly presented in accordance with generally accepted accounting principles (GAAP). Such an audit does not necessarily mean that the firm is financially strong or that its future is favourable, since even financially weak firms generally receive unqualified audits (Financial Dictionary, 2010b). A qualified audit is issued when an auditor states that he/she is unable to render a full opinion about a company’s finances, or a portion thereof, because the company’s accounting does not meet with GAAP or because the information was for some reason incomplete. In other words, a qualified opinion states that the company’s accounting is so inadequate that the auditor cannot render an opinion (Financial Dictionary, 2010b).
Nationally we see that, on average, each college in the country received a qualified audit in two of the three years (2007, 2008 and 2009) under review. This is a poor reflection on the accounting capacity of colleges, underscoring the need for a CFO to be appointed in each college. This said, the appointment of a CFO is no guarantee either of the financial soundness of a college or of its capacity to receive an unqualified audit – though a competent CFO is likely to be an asset to any organisation.
Provincially, the figure is 1 qualified audit per college over the 3-year period. This college received qualified audits in 2007, 2008 and 2009 despite the fact that it had a CFO.
Reports
Each FET college, as per the 2006 Act, needs to submit a number of specified reports to its council on an annual basis. The measure here is of the composite number of management, student academic performance, financial audit and annual reports submitted to council over a three-year period (2007-2009). The college should score 22 to 24 points on this measure to be compliant (two points for the existence of hard evidence, one for soft evidence, and zero for no evidence). The annual report for 2009 may not have been produced yet at the time of the survey, in May / June 2010 – hence the small margin of error.
Nationally, we see that, on average, each college scored 19 out of 24 points on this measure. This suggests that colleges across the board are falling short of the requirement of the Act, if only by a small margin. Provincially the figure is 21, while in this college the figure is 20.
Further Education and Training Colleges in South Africa at a Glance in 2010: Eastern Cape: East Cape Midlands FET College
21
Further Education and Training Management Information System (FETMIS) and Information and Communication Technology (ICT)
FET college management of information is one of the more critical aspects of its operational capacity. In an information age where the collection and storage of data are computerised, Information and Communication Technology (ICT) and Management Information Systems (MIS) are often synonymous. The FET audit ascertained that in practice the two are indeed inextricably linked – MIS relying entirely on the ICT platform in place in the college.
The Management instrument sought to ascertain which particular system was used in each of the 50 colleges. In the light of the fact that many colleges have traditionally used the COLTECH system, we briefly review this system here. On its web-site (COLTECH, 2010), COLTECH describes itself as having been established in 1990 to provide training to staff members of technical colleges (hence the name). In June 1991, COLTECH bought an administration system used by five colleges since 1990 with all rights. This system was revamped, and reference manuals and training manuals were written, leading to the implementation of the first COLTECH system in June 1992. Between 1992 and 2000 the number of users increased to more than 110 technical colleges, community colleges and schools. There are purportedly more than 30 colleges of education using the system.
The first measure used here reports on the system most commonly used nationally, provincially and in the college in question. Nationally, we see that the COLTECH system is most widely used; 28 of the 50 colleges use this system. MIS usage tends to be provincially determined. For example, in the Free State and KwaZulu-Natal all colleges use the COLTECH system, in the North West the DB 2000 system, while in the Eastern Cape, Limpopo, Mpumalanga and the Western Cape, almost all colleges uses the same, provincially-determined, system. In Gauteng, however, half the colleges use COLTECH, while the other half use other systems. Staff
DB 2000 is the predominant system used in the Eastern Cape. East Cape Midlands, however, uses the COLTECH system.
The questions in the Management instrument from which the second composite variable used here – Effectiveness of college usage of ICT (regardless of the name of the system) – were constructed have to do with e-mail connectivity, internet access, inter-campus connectivity, college-Department communication, web-site management, use of ICT in the teaching / learning process and in student support, and ICT support and maintenance. As in the case of the Compliance section in the Governance instrument reported on above, two points were awarded for the existence of hard evidence, one for soft / spoken evidence, and zero for no evidence of the characteristic. Nationally, each college scored, on average, 29 out of a possible 42 points on this measure – suggesting that colleges collectively have a long way to go in meeting the needs of their end users (whether staff, students, stakeholders, or their education line managers). KwaZulu-Natal scores an average of 20. This college scores 32.
Further Education and Training Colleges in South Africa at a Glance in 2010: Eastern Cape: East Cape Midlands FET College
22
Skills development-related Memoranda of Understanding (MOUs)
The number of skills development-related MOUs between a college and external stakeholders (education and training institutions, Sector Education and Training Authorities (SETAs) and industries) is in all likelihood a strong measure of the responsiveness of the college to the skills demands of the labour market. MOUs below are considered according to six categories:
1. Business 2. Local communities 3. SETAs 4. Other (non-SETA) education and training institutions 5. Local government departments and municipalities; and 6. Other institutions not yet mentioned.
Across the board, there are very few MOUs with external stakeholders at both national and provincial levels. Whether this is a function of incomplete reporting by colleges themselves or by the fieldworkers who verified this reporting is not clear; it may be that colleges disclose further MOUs when they verify the accuracy of the current report.
The average number of MOUs with business at the national level is 2 per college, while the average number of MOUs with SETAs, Other education and training institutions, and Local government departments and municipalities is 1 per college. Nationally there are on average no MOUs with local communities or other (unspecified) institutions. Particularly noteworthy, from an FET Summit policy perspective, is the paucity of MOUs with SETAs – one of the key indicators of college success as identified at the FET Summit itself. 2
The province has the following averages of MOUs: business (2), SETAs (1), Other education and training institutions (2), local government (2), and Other institutions (1). The college score on these six measures is 15. This is higher than the provincial and national average number of MOUs. East Cape Midlands has MOUs with Business (9), SETAs (1), local government (2), Other education and training institutions (2) and Other institutions (1). As the college offers business-related programmes it is appropriate – and very pleasing – that there are so many MOUs with business. The exact nature of the other MOUs is unknown and it is therefore difficult to draw any further conclusions.
2 The Minister of Higher Education and Training, Dr Blade Nzimande, made an impassioned plea at the Summit both to SETAs and to industry to forge partnerships with the colleges to offer qualification programmes which would be SETA-accredited.
Further Education and Training Colleges in South Africa at a Glance in 2010: Eastern Cape: East Cape Midlands FET College
23
STAFF PROFILE
Profile of academic staff
Race and gender
Section 7 of the 2006 FET Colleges Act specifies that lecturers and support staff be employed with due regard to: ability; equity; redress of past injustices; and representivity. Three of the four have a particular bearing on race, gender and disability.
In 2002 (Powell & Hall, 2004), 54% of lecturing staff nationally were black, while 46% were white. While this reflects an improvement on the 1998 profile, where only 39% of the lecturing staff were black, it nonetheless paints a skewed picture of racial distribution in a country where nine out of ten persons are black. The profile in 2010, 16 years into democracy, reveals that 77% of lecturing staff are black – as against a black student population in 2010 of 96%. While 77% reflects a highly commendable 23 percentage point improvement within an eight-year period, it continues to reflect a lack of black representation in the staff complement.
The gender profile is somewhat less encouraging. In 2002 (Powell & Hall, 2004), 47% of lecturing staff were female. That percentage has not changed in eight years. Attempts will need to be made to grow the female quotient to 52% – the percentage of females in the general population. The odds, it may be argued, are stacked against women in a largely technical arena. Engineering and business studies have dominated N-programme provision since inception, and five of the NC(V) programme areas – Management, Building & civil construction, Engineering & related design, Electrical infrastructure construction, and Mechatronics – are traditionally male-dominated preserves. But as the student enrolment profile in universities has shown (Cosser with Sehlola, 2009), while 29% of male students who were in grade 12 in 2005 enrolled in business / commerce programmes (rather than in other programme areas) in universities in 2006, 32% of female students did so. This suggests that the business-oriented programmes in the NC(V) – Office Administration; Marketing; and Finance, Economics & Accounting – as well as programmes such as Information Technology & Computer Science, Primary Agriculture, Hospitality, Tourism, and Education, Training & Development should be able to attract more female students. And if more female students enter these fields, the lecturing staff component should follow suit.
With a female staff quotient of 53%, which is higher than the national average, East Cape Midlands is slightly above the 52% benchmark for female representivity, by 1 percentage point. The college also fares better than the provincial average, which is 52%. In terms of racial representivity, the college has a 72% staff proportion that is black, falling short of provincial and national representation in the general population. Transformation seems not to have been achieved in terms of race. However, it is difficult to draw this conclusion in an emphatic sense as we are unclear about the number of new appointments made. The college may in fact actively follow the principles of redress and transformation when making new appointments.

Further Education and Training Colleges in South Africa at a Glance in 2010: Eastern Cape: East Cape Midlands FET College
24
The college figure is, however, similar to the national average for racial demographics. Overall at provincial level we see that transformation has occurred at a fast rate in respect of both gender and racial representivity, with averages of 52% for female staff and 86% for black staff employed.
Age
The staff profile table indicates the average age of lecturing staff across the college sector. An average age of above 55 would seem to be too high, suggesting that no new blood is coming into the college and that skills transfer to the younger generation is not occurring. Older staff, moreover, may not be the best placed persons to teach on the NC(V), some college principals suggesting that older staff struggle to appropriate new teaching methodologies.
From the profiles we see that, nationally, the average age of lecturing staff in 2010 is 39; provincially it is 38, and in this college it is also 39. These figures suggest an equitable distribution of younger and older staff across the system. Nationally, the average age of lecturing staff in 2002 was 42 (Powell & Hall, 2004). The average age of staff has therefore hovered around the 40-year mark over the past 8 years. This suggests that there has been a steady influx of new staff to replace ageing or retiring staff.
An average age of around 40, however, masks some of the dynamics that may be operating in colleges (Taylor, 2011). There are often very young and inexperienced staff at one end of the age continuum (frequently college graduates with no work experience and no experience in their field of training) while at the other end there are older and sometimes retired persons with work experience who have started teaching at colleges (this is often the case with engineering staff). With staff sitting at the extremes of the age continuum, average age comes in at about 40. Many good lecturers in the 35-50 range have left colleges. It is this group that tends to be more experienced.
Qualifications
The National Business Initiative report of 2004 (Powell & Hall, 2004) deemed lecturing staff with less than a diploma to be un- or under-qualified, and therefore considered staff with a diploma to be qualified. However, in this report our benchmark for qualified staff is staff with a degree or higher diploma. The benchmark here is the National Policy Framework for Teacher Education and Development in South Africa (the NPFTED – DoE, 2007), which specifies that all school-teachers are to be degreed. Such a requirement would seem to be equally, if not more, important in the context of technical and vocational education and training (TVET) at the FET (i.e., grade 10-12-equivalent) level and above, given that FET colleges now fall within the higher education and training band by virtue of their inclusion within the DHET.
In 2002, the percentage of lecturing staff with less than a degree / higher diploma was 54%. In 2010, we see that, nationally, 57% of lecturing staff have less than a degree / higher diploma, which indicates not only that there has been a regression in the qualifications levels of staff but that nearly half of all lecturing staff nationally are not deemed qualified by the NPFTED standard. Universities of technology will have to work with colleges to ensure that
Further Education and Training Colleges in South Africa at a Glance in 2010: Eastern Cape: East Cape Midlands FET College
25
their staff achieve higher mean rates of qualification. At the provincial level, 58% of lecturing staff have less than a degree / higher diploma, while in this college 38% are at this level – far fewer than at the provincial and national levels.
Qualification level is not the only measure of lecturer effectiveness, however. Staff experience in industry and teaching experience in the college are equally important measures in determining lecturer qualification for the job. In this regard, the national profile reveals that 74% of lecturers in 2010 had three or more years’ experience in industry, and that 58% had three or more years’ experience in college teaching (in their present college). Provincial and college figures are available on request.
Staff ratios
Lecturer-student ratio
It is a truism that the smaller the class, the more individual attention students receive, the higher their academic performance should be. A consideration of the lecturer-student ratio in colleges is therefore important. In 2002 (Powell & Hall, 2004), the lecturer-student ratio was 1 : 20. In 2010, the ratio is 1 : 32. This means that class sizes have increased significantly over the decade to a ratio approximating the norm proposed for the schooling system (between 1 : 35 and 1 : 40). An essentially favourable lecturer : student ratio in the college system does suggest, however, that student outcomes should be much better than they are. Provincially, the ratio is 1 : 31. The ratio for this college is 1 : 38.
Lecturer-support staff ratio
The ratio of lecturing to support staff may be a measure of how much emphasis an institution places on the teaching / learning process. A strong lecturing staff contingent may convey this message. At the same time, an under-staffed support structure may place undue administrative burdens on lecturing staff, impacting negatively on teaching time. Balance is therefore required. In 2002 (Powell & Hall, 2004), the lecturer-support staff ratio nationally was 1.9 : 1 (or 65 : 35, in percentage terms). By 2010 this had shifted to a ratio of 60% : 40%, indicating a slight shift towards a larger administrative staff complement over the decade.
Provincially, the ratio of lecturing to support staff is 59 : 41. The ratio for this college is 69 : 31.
While the data might seem to indicate a favourable lecturer to support staff ratio, however, this does not necessarily mean that lecturers are well supported. In a college environment lecturers do not have direct administrative support. While there may appear to be a sufficiently large number of support staff, however, given that such a complement includes staff in central offices (managers, PAs and administrators) and at campus level (campus managers, receptionists, and grounds and hostel staff), lecturing staff are largely responsible for their own administration (Taylor, 2011). Time spent out of the classroom, then, is likely to be devoted to the very high administrative load attached to offering NC(V) programmes.

Further Education and Training Colleges in South Africa at a Glance in 2010: Eastern Cape: East Cape Midlands FET College
26
Full-time to part-time lecturer ratio
According to Hall (1999), we would expect – based on the large number of instructional offerings – to see a range of full-time versus part-time lecturing staff in colleges. Ninety-three percent of lecturing staff in KwaZulu-Natal technical colleges in 1998 were on full-time contracts – which for Hall pointed to the high cost of employing part-time staff.
With the introduction of the NC(V), however, the provisioning dynamics have changed. In 2010, the national ratio of full- to part-time lecturing staff was 88 : 12, still heavily skewed towards full-time staff – but hardly surprising given that colleges are funded to provide full-time NC(V) programmes. When colleges do provide learnership and skills programmes they usually contract in staff, predominantly on a part-time basis, to offer them. Such staff are remunerated from the funds received for the particular programmes being provided (Taylor, 2011).
Provincially, the picture is different as the Eastern Cape shows a ratio of 91 : 9. The ratio for this college is 44 : 56. The reasons for such a high proportion of part-time staff in this college would need to be investigated.
The FET Summit provision for colleges to appoint non-core staff may be interpreted as an invitation to colleges to expand their programme provision through the appointment of part-time staff. However, the funding for such appointments would clearly have to come either from colleges themselves or through partnerships with SETAs and the private sector.
College-SETA and college-private sector partnerships increasingly became a core dimension of the programme mix, particularly in the more “settled” colleges, in the years (2004-2006) immediately preceding the onset of the NC(V) dispensation. In other words, colleges embraced demand-led, unit standard-based, NQF-aligned provisioning (learnerships, NQF-aligned qualifications, skills programmes, and the like) in partnership with external stakeholders. Such delivery was largely driven by contracted, part-time teaching staff – almost a separate provisioning stream – and human resource departments out of necessity had to adapt their systems to facilitate the recruitment and appointment of suitable staff. This state of institutional adjustment effectively came to a halt as a result of the all-consuming demands of NC(V)-alignment and –implementation (Garisch, 2011).
Teaching load
The issue of teaching load explains the staff complement, the extent to which lecturing staff are over- or under-extended, and the extent to which staff can give individual attention to students. In most cases, lecturer time is devoted to teaching (theory and / or practicals), lesson preparation, marking, and general administrative duties. Nationally, the average number of periods per week spent on teaching theory and running practicals is 20 – which in a 40-hour week leaves half lecturers’ time for non-contact duties (preparation, marking, and administrative responsibilities). While this would seem to reflect a balanced allocation of time and human resources, however, the inordinately large administrative burden imposed by the NC(V) probably, as indicated above, accounts for the large majority of this non-contact time.
Further Education and Training Colleges in South Africa at a Glance in 2010: Eastern Cape: East Cape Midlands FET College
27
A limitation of this indicator lies in the fact that teaching periods are of different lengths – some 60 minutes, some 35 minutes, and some possibly of other lengths – depending on the post level. It would therefore have made more sense for the instrument to have asked colleges to indicate the number of hours taught per week.
Staff disruptions to teaching / learning
Staff disruptions are a sign of staff dissatisfaction with an aspect of their jobs, which impacts negatively on productivity, morale, the teaching / learning process, and student behaviour (the ripple effect of staff disruption). Disruptions may be symptomatic of management problems, governance concerns, or other issues. Staff disruptions impact negatively on the image of the institution, which is likely to affect student enrolment decisions. Even one staff disruption per year, of whatever nature and whatever the cause, is detrimental to an institution.
Nationally, every college on average experienced 1 staff disruption over the three-year period (2008-2010), which systemically reflects very poorly on the FET college sector as a whole. At the provincial level, we see that there was also 1 disruption per college. In this college, no staff disruptions were reported for this period. This is a better reflection than the national average (1) and provincial average (1) and could be indicative of the college’s leadership quality.
Academic staff loss and gain
The anecdotal sense of the writing team from visits to the colleges – collectively, covering in the region of twenty colleges – was that there was a net loss of lecturing staff over the three-year period. However, the data firmly contradict this.
In terms of average net loss / gain over the three-year period under investigation, we see that at national level there was an average gain of 46 lecturing staff and at the provincial level a net gain of 25, which is considerably lower than the national average. East Cape Midlands also shows a gain in staff which, at 14, is modest compared to the national and provincial averages.
At the level of staff turnover, nevertheless, we calculate from the national profile figures that, across the three years, an average of 7 staff left each college per trimester; and if we compare these losses with the average number of lecturing staff per college (167 nationally), we see that staff turnover amounted to 4% per trimester.3
The main cause of staff loss – resignation – is reported in Table 3 in Section 1 of this report – on the assumption, made at the instrument design stage, that there would have been a net loss, not gain, of staff given the changes in employment conditions of staff following the promulgation of the FET Act of 2006. The reasons for net gain have not been probed, but are likely to be due to the need to appoint staff to teach on the NC(V) programmes in addition to the N-programmes, as well as to replace staff losses.
3 Total loss of staff over three years = 61. Divided by 3 to obtain an annual average, this is 20.3; and divided by 3 again to obtain a trimester average, this is 6.8 (rounded off to 7).
Further Education and Training Colleges in South Africa at a Glance in 2010: Eastern Cape: East Cape Midlands FET College
28
At the provincial level, retirement is the main cause of staff loss. At East Cape Midlands resignation is the main cause of staff turnover.
Academic staff development, 2009
Academic staff development is important not only for enhancing lecturers’ knowledge and understanding of their areas of expertise but for its impact on student academic performance. Where new curricula (for example, the NC(V)) are introduced, it is imperative that lecturers learn not only what to teach but how to teach the new programme.
Proportion of staff trained
Deciding what an acceptable level of training is will depend on the training model (cascaded down from the Department of Education) and the qualifications of staff, as well as the reduced need for training this implies). At the national level, we see that, on average, 65% of staff were trained across the entire college system in 2009.4 For three-quarters of lecturing staff to have undergone some form of staff development represents a high level of training – a level nevertheless incommensurate with the poor academic results of college students across the system, as reported on below. Provincially, 63% of lecturing staff received some training. At this college, all staff (the calculated figure is 118% of staff!) have undergone some form of skills development. This figure is considerably higher than the provincial and national averages.
Time spent on training
Nationally, each academic staff member trained spent on average a total of 10 days on training. Again, the acceptability of this figure depends on the type and purpose of the training – though 10 days per staff member means 10 days (or two working weeks) out of the classroom. Provincially, the figure is lower, at 4 working days. Similarly, in this college, 4 working days per annum were spent on academic staff development.
Proportion of staff expenditure on staff development
Nationally, the audit revealed that, on average, 1.4% of colleges’ total expenditure went on academic staff development over the 2009/10 period (7 colleges did not supply data for this calculation). It is difficult to pronounce on the acceptability of this figure; but given that companies pay 1% of their annual payroll to the SETA under which they fall, the staff development expenditure figure would seem to be acceptable. The impact of staff development, however, is not easily measurable: one needs to control for other factors that may explain improvements in staff performance. But where there are obvious benefits of development that lead, for example, to staff attainment of qualifications, staff promotions, improved assessment and moderation practices, and improved student outcomes that are demonstrably due to staff training, such development would seem to be justified.
4 Data for this and the next calculation (of the average number of days spent on staff training per annum) came from two sources: the FET audit, which accounts for the data for 34 of the 50 colleges; and the FETMIS database, which accounts for the data for the remaining 16 colleges.
Further Education and Training Colleges in South Africa at a Glance in 2010: Eastern Cape: East Cape Midlands FET College
29
At the provincial level, 1.6% of total expenditure went on staff development. East Cape Midlands spent 2% of total expenditure on staff development in 2009 – significantly higher than the national and provincial figures.
STUDENT PROFILE
Demography
Gender
While in 2002 (Powell & Hall, 2004) a total of 40% of students enrolled in colleges were female, by 2010 this figure had risen to 52% – which is exactly representative of the proportion of females in the general population. The implications of this shift at the systemic level are enormous: females are now fully represented in the college sector. However, this figure masks differences that may obtain at programmatic and course levels, not to mention at faculty / department / school management levels.
This college has a female population of 50%, which meets the requirements in terms of equity, redress and representivity. Transformation has occurred at a lesser rate than in other colleges provincially, as Eastern Cape colleges show an enrolment of 54% for female students.
Race
From a race perspective, 96% of students nationally are black, which is higher by 6% than the percentage of black people in the general population and in fact over-representative of the black population. The effect of this is the displacement of the 2002 figure of 17% of white students in the college sector (Powell & Hall, 2004) into other institutional types (presumably universities) and therefore, ironically, the continued marginalisation of black African learners.
The provincial and college figures for percentage black student enrolments are very similar – 98% and 91% respectively. The provincial figure also reflects an over-representation of black students.
Disability
With regard to disability, the Code of Good Practice on the Employment of People with Disabilities (DoL, 2002) provides a framework for the recruitment and selection of persons with disabilities which would apply equally within the FET college sector as within all other workplaces.
Nationally, 0.1% of students enrolled over the 2008-2010 period were reportedly disabled. This percentage is based on data from only 24 of the 50 colleges, however, and is therefore unreliable. At the provincial level 0.2% of enrolled students were disabled. The percentage for this college could not be calculated because the college does not keep data on student disability.
Further Education and Training Colleges in South Africa at a Glance in 2010: Eastern Cape: East Cape Midlands FET College
30
Age
The age of South African technical college / FET college students has traditionally set them apart from their international counterparts. Whereas students in the Australian TAFE system, for example, span age categories across the traditional student and working-age spectrum (58% of TAFE graduates in 1999 were older than 24 – NCVER, 1999: 40), South African students are on average far younger. Thus, for example, in 2002 (Powell & Hall, 2004) the largest proportion of students (42%) were 20 to 24 years old, followed by 15 to 19 year olds (23%), 25 to 29 year olds (18%), 30 to 34 year olds (9%), 35 to 40 year olds (5%) and 41-plus-year-olds (4%).
The 2010 cohort reveals that, nationally, three-quarters (76%) of students were under 24 at the time of the survey in May / June. Fifty-six percent of students fell into the 20 to 24 year age category – an increase of 14 percentage points over the 2002 figure. From a comparative perspective – comparing the 2010 data with the NBI (Powell & Hall, 2004) distribution – South African college students are on average getting younger: whereas in 2002, 36% of students were older than 24, in 2010 only 24% of students are older than 24. One of the greatest challenges confronting the sector is to attract working-age persons into colleges to upgrade their skills and for colleges not to be seen as the exclusive preserve of school leavers. This is not to gainsay the importance of the sector as a stepping stone to university study for those pursuing technical and / or technological subjects, but only to flag the importance of developing an older cohort of student workers through a strengthened relationship between colleges and industry.
In Eastern Cape we find that 21% of students fall in the 15 to 19 year bracket with 55% in the 20-24 year bracket, 16% in the 25 to 29-year bracket, 5% in the 30-34 year bracket and older students make up the remaining 4%. At this college 31% of students are between the ages of 15 and 19, 47% fall into the 20 to 24-year bracket, 11% in the 25 to 29-year bracket 6% in the 30-34 year bracket and older students make up the remaining 5%. While from these figures we see that this college closely follows the national distribution pattern in that the majority of students fall into the 15 to 24-year age group, there is a particularly large group under 20 years old, indicating significant overlap with the schooling sector.
Home province
The home province of students is an important variable because it indicates the extent to which students choose, or have, to migrate to access FET college learning. The assumption behind FET institutional planning is that all students should be able, and want, to enrol in colleges in their home provinces. However, in the 2010 profile we see that almost 1 in 10 students nationally (9%) migrated to other provinces to access a college education. Without probing the reasons for this, we can speculate that student migration is a sub-set of the larger migration patterns we see in the country, where large numbers of the population migrate from rural to more urbanised provinces, particularly where there are greater perceived employment prospects. Thus, for example, a previous HSRC study (Kok, Gelderblom, Oucho & Van Zyl, 2005) has shown that while the Western Cape and Gauteng are net importers of people, the Eastern Cape, KwaZulu-Natal and the northern provinces contiguous with Gauteng (the North West, Limpopo and Mpumalanga) are net exporters of people.
Further Education and Training Colleges in South Africa at a Glance in 2010: Eastern Cape: East Cape Midlands FET College
31
From the 32 college profiles that provided the FET audit data for this calculation, we see that the Kok et al. finding is indeed borne out in the Gauteng figures: a massive 29% of students enrolled in colleges in the province hailed from other provinces. The KwaZulu-Natal profile contradicts the Kok et al. finding, however: according to the FET audit, 10% of students studying in the province’s colleges came from other provinces to do so. Similarly, 15% of Mpumalanga students came from other provinces – the only data likely to be fairly reliable, since all 3 colleges in the province keep migration data. Because of the high proportion of missing data, then, the findings as a whole, and particularly the national findings, should be treated with caution.
Financial support
From a national planning perspective it is clearly very important for the DHET to be able to plan its successive budgets according to the current profile of students accessing study loans and bursaries. Hence the focus in this report on National Student Financial Aid Scheme (NSFAS) funding of students. Such an exercise also throws light upon the financial situations of students and their parents’ / guardians’ income levels. The increased use of NSFAS support may be indicative of the extent to which information about student support is made available to students and potential students in colleges and in their communities.
Collection of data on student financial support is also important for the college in terms of its request for annual subsidy for student fees from the Department of Education.
From the 2010 FET audit we see that 58% of students nationally (N = 22 colleges only) were not recipients of financial support. If this figure is indeed representative of the country as a whole, it underscores the significance of the DHET decision to fund all final year financially needy FET college students enrolled in 2011. The figure of 58% not in receipt of financial support compares with a figure of 71% in the province. This data is missing for the college in question.
Of the 42% of students who did receive support, 36% nationally received support from the NSFAS, 6% from non-NSFAS sources. A calculation from statistics in NSFAS (NSFAS, 2010) and DBE (2010) reveals that 53,537 of the 420,475 students enrolled in FET colleges in 2009 received NSFAS funding (13% of the students enrolled in that year), which would suggest that the NSFAS-funded student figures from the FET audit are hugely inflated.
By way of comparison, a calculation from statistics in the same two sources (NSFAS, 2010; DBE, 2010) reveals that 138,235 of the 837,779 students enrolled in universities in 2009 (17%) received NSFAS funding. Very similar proportions of FET college and university students were therefore recipients of NSFAS financial support in 2009.
Provincially, 27% of students were supported by the NSFAS and 3% of students received non-NSFAS funding support. The percentages for this college could not be calculated because the college did not keep data on student financial support.
Further Education and Training Colleges in South Africa at a Glance in 2010: Eastern Cape: East Cape Midlands FET College
32
Student disruptions to teaching / learning
Student disruptions may have various causes: symptoms of dissatisfaction with certain aspects of college management, administration, or teaching, including finance, fees, meals and accommodation; first-year students’ ball and other social events; orientation and initiation practices; or unhappiness with lecturers – to name some of the more common ones. Or there may be external causes, such as service delivery protests in the community – which upsets learning by virtue of student involvement in such protests or the intimidation of students by those members of the community who are protesting.
As in the case of staff disruptions, nationally every college experienced, on average, 1 student disruption over the three-year period (2007-2009). The impact of such disruptions on student academic performance is incalculable, but is likely to be large.
Provincially, the average number of student disruptions per college over the three-year period was 1. This college experienced no disruptions over the period.
Student enrolments by programme type
In 2002 (Powell & Hall, 2004), 86% of students enrolled in colleges were enrolled in N-programmes, the balance (14%) in non-N (i.e., non-accredited) programmes. In 2010, by contrast, 58% of students nationally were enrolled in NC(V) programmes, 32% in N-programmes, and the balance (10%) in other programmes (adult learning, skills, learnership, and NIC programmes). At the provincial level, 65% of students were enrolled in NC(V) programmes, 26% in N-programmes and the balance (9%) in non-NC(V), non-N programmes. At this college we see that 49% of students were enrolled in NC(V) programmes, 33% in N-programmes and 18% in non-NC(V), non-N programmes.
Expansion of the FET college sector is henceforth to be driven by a Programme Qualifications Mix (PQM) approach (FET Summit Task Team 2, 2010). The proposal reads as follows:
This proposal assumes that there is a need for institutional diversity, that not all colleges will provide the same programmes and that the exact programme and qualification mix will be determined based on an agreed upon set of criteria …. One consequence of this diversity will be that individual colleges may develop areas of special programmatic expertise. In these areas they may well offer a spread of programmes across a range of related occupational areas and across more than one level on the NQF. They may also develop more structured partnerships with relevant SETAs. This will enable learners to progress from one occupational level to the next at the same college. Such colleges may well form programmatic partnerships with relevant universities of technology and other universities.
The enrolment profile depicted above provides clear guidelines for how differentiation by programme offering and thence expansion of the college sector might proceed.
Further Education and Training Colleges in South Africa at a Glance in 2010: Eastern Cape: East Cape Midlands FET College
33
Student exit from the college
The FET audit revealed that very few colleges nationally – only 18 out of 50 (N = 44) – keep exit data on students. This lack of key data renders claims about the employability of FET college graduates highly unreliable. Since so few colleges actually keep student exit data, however, these figures are hardly representative. The key finding here is in fact the paucity of colleges keeping data on student destinations – an important task for colleges in the context of unsubstantiated claims about the employability of FET college graduates.
Provincially, the situation is more positive on average. Three of Eastern Cape’s colleges keep such data. The college under investigation is one of them.
EFFICIENCY RATES, 2007-2009
The importance of efficiency indicators cannot be overemphasized: they provide an indication of how efficient a college is in terms of student performance – the key responsibility of colleges. The standard of a college is judged by the academic performance of its students.
The efficiency indicators reported below refer to the throughput rates of students in the colleges over a three-year period (2007-2009). The throughput rate is calculated by dividing the number of students who pass an examination by the number of students who enrolled for the programme for which the examination constitutes the summative assessment. In others words, unlike pass rates, which divide the number of students who pass as a percentage of the number of students who sat for the examination, the throughput rate includes those students who dropped out of the course during the trimester or year.
The throughput rates discussed here do not trace a cohort of students from one year of study to another – which is ideally the best way to assess student performance. Rather, the rates measure throughput in the course of each of the three years and then across the three-year period.
Throughput rates are reported by programme type – that is: NATED, NC(V), and “Other”. The latter type includes general education, learnerships, skills programmes, adult learning programmes, national introductory courses (NICs), and “other” programmes not mentioned. Disaggregations are not provided here, since the focus is on headcount enrolments and not student enrolments across the different courses that make up a programme (where there would obviously be duplications of headcount enrolments).
The data below are not likely to be completely reliable. Their unreliability may be a function of various factors, five being the following. First, the national examinations section of the Department of Education may not have furnished colleges with examination results timeously. Second, there may have been poor moderation and quality assurance of data. Third, missing data in the tables in Section 1 may be attributable to lack of administrative capacity in the college supplying the data. Fourth, many colleges supplied data on student enrolments but not on student passes. A zero or lack of response may have been interpreted by the fieldworker as missing data, notwithstanding careful re-checking of the data against the Profiles and Efficiency Indicators questionnaire after the data capturing phase. And fifth,
Further Education and Training Colleges in South Africa at a Glance in 2010: Eastern Cape: East Cape Midlands FET College
34
with regard to NC(V) throughput rates, not all colleges interpreted “passed” as students who passed all seven subjects in the NC(V); anecdotal evidence suggests that some colleges may have interpreted “passed” as “passed five subjects”, some as “passed four subjects”.
Another difficulty lies in the interpretation of data for the calculation of the throughput rate for NATED programmes. At the time of the research the NATED programmes were being phased out, hence the drastic decrease in numbers in the years 2007-2009. In 2009 some colleges had no new intake: the students who enrolled did so for the purposes of completing incomplete qualifications. Because large numbers of these students were not registered for full qualifications, potential certifications were not considered. Such colleges, for statistical purposes, counted only those students who were registered for a full qualification, for example, all four subjects on the same level. It appears that not all colleges interpreted certification statistics in the same manner.
With these provisos, we see that, at the macro level, students enrolled for N-programmes perform, on average, better than students enrolled for NC(V) programmes, and that students enrolled for “Other” programmes perform much better than students in the other two programme types. The national average throughput rate for N-programmes is 47%, for NC(V) programmes it is 30%, and for “Other” programmes it is 66%. Expressed differently, for every 100 students who enrolled for Other programmes, 34 either failed or dropped out; for every 100 students who enrolled for N-programmes, 53 either failed or dropped out; and for every 100 students who enrolled for NC(V) programmes, a massive 70 students failed or dropped out. The throughput rates for N-Programmes and NC(V) programmes are alarmingly low, the rate for Other programmes significantly higher. These are not flattering figures by any standards, and point to the amount of work FET colleges need to do to persuade their line managers and their clients alike (students, their parents / guardians, and the nation at large) that the colleges are, at worst, functional.
A comparison between these rates and those of students seven years ago, in 2002 (Powell & Hall, 2004) – when the NC(V) programme was of course not offered – reveals that the throughput rate of students enrolled for N-programmes at the post-N3 level in 2002 was 57%, at the FET level (i.e., N1, N2 and N3) 47%. The 2009 throughput rate of 45% is marginally lower than in 2002 at the FET level and significantly lower at the combined level (i.e., N1 through N6), where the rate was 52%.
While it is not possible to make a direct comparison between the FET college and schooling sectors – since the Department of Education publishes examination results for matriculants and not for all students enrolled in grades 10 to 12 (DoE, 2010) – it is nevertheless instructive to compare the throughput rate of students enrolled for the NC(V) in 2008 (the latest results available) with that of students enrolled for grade 12. Such a comparison reveals that while the throughput rate of FET college students enrolled for NC(V) programmes in 2008 was 28%, the throughput rate of those enrolled in grade 12 in schools was 58% – more than double that of college students. There is, proverbially, no comparison between the results of students of the two sectors.
Furthermore, the trimester and semester enrolment options within colleges render annual throughput rates misleading as students can enrol in the third trimester of a year and complete a learning programme six months later, in the next year. For this reason, the above
Further Education and Training Colleges in South Africa at a Glance in 2010: Eastern Cape: East Cape Midlands FET College
35
comparisons – between the 2002 and 2009 throughput rates in colleges and between the 2008 throughput rates in colleges and schools – should be taken to be merely indicative.
At the provincial level, the throughput rates are: 30% for N programmes; 23% for NC(V) programmes; and 81% for Other programmes. This mimics the national pattern, with learners faring better in N-programmes than in NC(V) courses and Other programmes exhibiting throughput rates that are significantly higher than the other two programme types. The throughput rates for this college show 39% for N-programmes and 33% for NC(V) programmes. The college does not offer “Other” programmes. The college fares better than the provincial but worse than the national average for N-programmes, and better than both the province and the country in respect of throughput rates for NC(V) programmes.
COLLEGE PERFORMANCE AGAINST NATIONAL AND PROVINCIAL BENCHMARKS
From the above presentation of findings against the indicators measured, we see that the college under investigation performed, on average, better than or at least at the same level as the country and the province on indicators for overall compliance with the FET Act of 2006, appointment of a CFO, submission of reports to council, ICT effectiveness, MOUs, staff and student representivity in terms of gender, and staff and student disruptions to teaching and learning. The college fared worse than the country and the province on indicators for academic staff qualifications and the fact that despite having a CFO, the college had three qualified audits in the period under review. By and large, the throughput rates for the national, provincial and college levels are disturbingly low, so although the college may be doing well in some respects, if it falls short in its core business, it cannot be commended.
From the above presentation of findings against the indicators measured, we see that East Cape Midlands College performed, on average, better than the province and the country as a whole. The challenges faced by the college, as reported in interviews with the council chair and the principal, are as follows:
1. Loss of power by principals of the former colleges, which did not go down well as they had to accept new leadership structures.
2. Lack of resources. Funds were required not only to resource the new college but also for the cost of merging. The cost of travelling to Graaf Reinett, 240 kilometers away from the main campus, and Grahamstown, which is 140 kilometers away, is significant; these costs were not provided for in the merger processes and budgets. East Cape Midlands College serves a metropolitan area but also the rural hinterland of the Karoo. These are vast areas to be serviced, so intra-campus connectivity is a huge cost to the college.
3. As in many other FET colleges, the dual accountability of the college principal to the province and the college council is a serious problem. The principal explained that the tools he needs to work with are a cell phone, lap top computer and a car. The Education Department ensures the availability of the car and pays for travelling, but it does not pay for accommodation and has not provided the principal with a cell phone.
Further Education and Training Colleges in South Africa at a Glance in 2010: Eastern Cape: East Cape Midlands FET College
36
4. The relationship between the College Council and the province is fragile as communication is poor, which causes uncertainty and confusion. For instance the Graaf Reinett premises are rented and the lease agreement expires in March 2011. The provincial office is not cooperating in the college’s request for building premises for the Graaf Reinett campus; hence the campus might have to close if the lack of cooperation by the provincial office persists. The college feels disregarded and ignored by the provincial office; a large amount of the CEO’s time is spent on damage control on what are the provincial office’s responsibilities, which have been neglected.
5. The Act introduces the imposition of employer status to the College Council, which in the Act remains ambiguous. It gives the responsibility of making employment decisions to the Chair of the College Council rather than the Principal of the College. Council has more powers than the principal and the spirit of the Act shows that internal control of the college is seen to be inferior to external control.
6. If Councils are to be employers, they must have the best advice, expertise, resources and authority. There is a growing chorus that Councils should not be employers. There is a school of thought which holds that there should only be one employer for all college employees with all the necessary resources, authority and expertise. Currently, the college is frustrated and delayed by the provincial office as it has to pay millions of rands for approved posts, yet the provincial office does not give the funds for appointment to the college. The college budget thus gets re-prioritised by the provincial office, and the control of these resources affects its strategic goals.
Another school of thought holds that councils should be the employers as they can respond promptly to the college needs provided that they have all the necessary resources, expertise and authority. One does not always get a quick response to simple questions that are sent to the provincial office; in fact, the provincial department is not very helpful. This is exacerbated by the fact that in the Eastern Cape, the MEC and the DG change frequently. When the college makes a presentation to the MEC and then finds out that he is no longer in that position and has to start the process all over again, this takes time as the new incumbent has to learn about the new portfolio. So the incumbents spend a significant amount of time adjusting to the new portfolio. When they finally adjust, they get changed. This process continue until the end of the political administration; when its five-year term ends, elections are held and new personnel replace those who had just adjusted to their portfolios. The council chairperson concludes that the challenge is not the personalities but the system, which has a high personnel turnover.
A third school of thought seeks to strike a balance between the two, claiming it is too risky for the state to create a large institution and then hand it over to communities to run. The government needs to have some control over these institutions. Hence effective and efficient mechanisms need to be established which give autonomy to the colleges and enough authority to the state to monitor them without interruption.
Further Education and Training Colleges in South Africa at a Glance in 2010: Eastern Cape: East Cape Midlands FET College
37
REFERENCES
COLTECH (2010). COLTECH Computer Training. Retrieved on 27 October 2010 from: http://www.coltech.co.za/index.php?option=com_frontpage&Itemid=1.
Cosser, M. with Sehlola, S. (2009). Ambitions Revised: Grade 12 Learner Destinations One Year On. Cape Town: HSRC Press.
DBE (Department of Basic Education) (2010). Education Statistics in South Africa 2009. Pretoria.
DoE (Department of Education) (1998). Further Education and Training Act, Act No. 98 of 1998. Pretoria.
DoE (2006). Further Education and Training Colleges Act, 2006. Pretoria.
DoE (2007). National Policy Framework for Teacher Education and Development in South Africa. Pretoria.
DoE (2010). Education Statistics in South Africa 2008. Pretoria: 2010.
DoL (Department of Labour) (2002). Employment Equity Act (Act No. 55 of 1998): Code of Good Practice: Key Aspects on the Employment of People with Disabilities. Pretoria.
FET Summit Task Team 2 (2010). Unpublished report to the Further Education and Training Summit. Task Team 2: The Programme Mix for FET Colleges. Recommendations. 31 August.
Financial Dictionary (2010a). Unqualified opinion. Retrieved on 27 October 2010 from: http://financial-dictionary.thefreedictionary.com/Unqualified+Opinion.
Financial Dictionary (2010b). Qualified opinion. Retrieved on 27 October 2010 from: http://financial-dictionary.thefreedictionary.com/Qualified+Opinion.
Goozee, G. (2001) The Development of TAFE in Australia. Adelaide: National Centre for Vocational Education Research.
Garisch, C. (2011). Personal communication with the writing team.
Hall, G. (2009). Quantitative overview of the technical colleges of KwaZulu-Natal. In Kraak, A. & Hall, G. (eds.), Transforming Further Education and Training in South Africa. A Case Study of Technical Colleges in KwaZulu-Natal. Volume One: Qualitative Findings and Analysis. Cape Town: HSRC Press. 103-148.
Kok, P., Gelderblom, D., Oucho, J. & Van Zyl, J. (eds.) (2005). Migration in South and Southern Africa: Dynamics and Determinants. Cape Town: HSRC Press.
NCVER (National Centre for Vocational Education Research) (1999) Australian Vocational Education and Training Statistics 1999. Student Outcomes Survey National Report. Leabrook.
Further Education and Training Colleges in South Africa at a Glance in 2010: Eastern Cape: East Cape Midlands FET College
38
NSFAS (National Student Financial Aid Scheme) (2010). NSFAS fact sheet. Retrieved on 8 December 2010 from: http://www.nsfas.org.za/web/view/general/statistics/loanstatistics.
Parliamentary Monitoring Group (2006). Minutes of the Select Committee on Education and Recreation. Retrieved on 26 October 2010 from: http://www.pmg.org.za/node/7983.
Powell, L. & Hall, G. (2000). Quantitative Overview of South African Technical Colleges. Johannesburg: Colleges Collaboration Fund, National Business Initiative.
Powell, L. & Hall, G. (2002). Quantitative Overview of the Further Education and Training College Sector. The New Landscape. Pretoria: Department of Education.
Powell, L. & Hall, G. (2004). Quantitative Overview of the Further Education and Training College Sector April 2004. A Sector in Transition. Pretoria: Department of Education.
Taylor, V. (2011). Personal communication with the writing team.


![Further Education and Training Colleges Act [No. 16 of 2006]€¦ · 2 No. 29469 GOVERNMENT GAZETTE, I1 DECEMBER 2006 Act No. 16,2006 FURTHER EDUCATION AND TRAINING COLLEGES ACT,](https://img.pdfslide.us/doc/110x75/5ead80cb78792243b469b209/further-education-and-training-colleges-act-no-16-of-2006-2-no-29469-government.jpg)