Embed Size (px)
DESCRIPTION
qwerty
Citation preview

Analysing the Causes of Child Stunting in DPRK
Written by:
Roger Shrimpton, PhD Honorary Senior Research Fellow
Centre for International Child Health Institute of Child Health
London UK
and
Yongyout Kachondham MD, MPH,
Director, Research, Policy and Capacity Development Program Thai Health Promotion Foundation
Bangkok Thailand
October 2003

Table of Contents Executive Summary .......................................................................................... 2 Introduction ....................................................................................................... 3 The Conceptual Framework .............................................................................. 4 Methods............................................................................................................. 6 Results ............................................................................................................... 8 Temporal Predictors .............................................................................. 8 Maternal and Foetal Nutrition Immediate Predictors............................................................................. 8 Disease Nutrient Intake Underlying Predictors ........................................................................... 9 Health, Water and Sanitation Services Maternal and Child Care Household Food Security Basic Predictors................................................................................... 10 All Predictors....................................................................................... 11 Discussion ....................................................................................................... 11 Conclusion and Recommendations ................................................................. 13 Annex I: Tables and Figures ........................................................................... 14 Annex II: References....................................................................................... 35

2
Executive Summary Although there has been considerable improvement, the nutritional situation in DPRK still warrants a lot of concern. The 2002 nutrition assessment results suggest that child underweight rates in DPRK are now as good if not better than many other countries in East Asia. However the prevalence rate of 42% for stunting encountered in 2002 is still “very high” according to accepted international criteria. DPRK continues to rely on humanitarian aid for a quarter of its food needs. The question now becomes, if the child malnutrition rates have improved so much, how might the food aid be better used in the future and/or what else might be done to further improve stunting of children in particular. In order to better understand the problem of stunting in DPRK an analysis was carried out of its possible causes. A modified version of the UNICEF conceptual framework was used to guide this analysis, which took into account the influence of the temporal predictors of child malnutrition, namely maternal nutritional status and foetal growth. The data from the 2002 Nutrition assessment of 10 provinces/cities was used to carry out the analysis. Although the 2002 nutrition assessment data set is not ideally suited to using the conceptual framework to try to analyse for the causes of stunting, it still allows some important conclusions to be reached about the possible causes of stunting of children in DPRK. Maternal nutritional status and food intake seem to be associated with child stunting. Of the temporal predictors only maternal mid-upper arm circumference showed a significant association with stunting. Of the immediate level predictors in the disease category, only the occurrence of diarrhoea in the previous two weeks was found to be significantly associated with child stunting. In the immediate level category of nutrient intake, whilst 65% of children received vitamin A capsule in the previous 6 months, stunting rates were a half of those not receiving. Similarly stunting rates were significantly higher among the children born to the one third of mothers that got vitamin A capsules at birth. The children of the mothers that had consumed meat or egg the day before were less likely to be stunted as were the children of the one third of mothers that had eaten rice and of the one third that had eaten pulses the day before. The overwhelming majority of households (99.6%) were reported to have at least some food stored in the house, suggesting that quantitatively food security was not a problem. Stunting was less common in children of mothers who reported having rice (35%) or wheat (34%) than in children of mothers who reported having maize (43%) or other foods (43%) as the main food staple stored in the house. The location of the house of the child in rural or in urban areas had no effect on their stunting rates. There were however strong provincial differences in stunting levels across the provinces/cities with less stunting (<30%) in the cities of Pyongyang and Nampo, and high rates (>35%) elsewhere. A multivariate analysis identified four predictors that were statistically significant correlates of stunting. These predictors included maternal mid-upper arm circumference, whether the mother ate meat or eggs the day before, whether the main food in store was rice or wheat, and if the number of antenatal visits were less than seven. The most significant of these predictors was the number of antenatal visits. Every effort should be applied to developing an integrated package of interventions to improve maternal nutritional status, preferably before getting pregnant, and to protecting foetal and infant growth. The condition of mothers in DPRK is generally poor. About one third of mothers of children under two in DPRK have either anaemia and/or low body mass as predicted by low mid-upper arm circumference.

3
Introduction In early 2002, little was known outside of the Democratic Peoples Republic Korea (DPRK) of the recent nutrition situation; especially since famine conditions had prevailed in the early to mid-nineties. A non-representative survey of young children in government kindergartens carried out by the World Food Programme (WFP) in 1997 found 38% to be stunted1. A population based internationally observed representative survey carried out in 1998 found child underweight rates to be 60% the worst rate of any nation in the world at the time2. A representative population based survey carried out by the Government in 20003 that wasn’t internationally observed, claimed that underweight rates were reduced to 28%. The internationally observed food and nutrition survey carried out in ten of the twelve provinces and cities in October 2002, which covered at least 80% of the national population, found child underweight rates to be 21%4. The 2002 results suggest that child underweight rates in DPRK had decreased at 10% a year since 1998, i.e. 200 times faster than the Asian average in the nineties5, and are now as good if not better than many other countries in East Asia. Furthermore, the low birth weight rates reported by the mothers of children born in the last two years was 6.7%, a rate more likely to be found in an industrialised country. This information all suggests that food aid has indeed been well used in DPRK. Although there has been considerable improvement, the nutritional situation in DPRK still warrants a lot of concern and continued support from all agencies concerned. The prevalence rate of 42% for stunting encountered in 2002 is still “very high” according to the criteria established by the World Health Organisation6. Stunting has been considered an indication of chronic nutrition or something that has happened in the past, but this is a misconception since although the nutritional insult may have happened in the past the consequent process is still ongoing. Stunted children are more likely to get sick and die than underweight or wasted children are7 8. Of further concern is a two-fold difference in stunting rates between the best-placed Nampo City (26%) and the worst placed Ryanggan Province (50%). The purpose of this report is to use the information collected in the 2002 food and nutrition survey to investigate the possible causes of the stunting, and suggest ways to improve this situation, especially in the provinces most affected. The question now becomes, if the child malnutrition rates have improved so much, how might the food aid be better used in the future and/or what else might be done to further improve stunting of children in particular. DPRK continues to rely on humanitarian aid for a quarter of its food needs9, and donors continue to request proof that food aid is being delivered to the most needy. The UNICEF nutrition strategy approved by the Executive Board in 199010 recognising the local specific nature and the multiple causality of nutrition problems, recommended the use of a descriptive approach rather than a prescriptive one for solving nutrition problems. The strategy proposed the use of a conceptual framework that organised causes and outcomes, in order to facilitate a “triple A process” of assessing and analysing the problem and deciding what action to take. This report aims to use the conceptual framework to analyse the causes of stunting of children in the DPRK and through that analysis make recommendations on the actions to take. As UNICEF looks forward in the development of its joint programme of collaboration with the Government of DPRK, it will increasingly be prioritising the five themes given prominence in the UNICEF Medium Term Strategic Plan11. Integrated early child development (IECD) is one of five such priorities, along with girl’s education, immunisation “plus”, fighting HIV/AIDS, and improved protection of children from violence, abuse, exploitation and discrimination. The aim of IECD is to help achieve the Millennium Development Goals and the related World Fit For Children Goals for the year 2015.The IECD

4
emphasis is on getting the best start in life and on breaking the cycle of poverty and growth failure that enshrouds the lives of so many of the worlds children. IECD thus focuses on children under three years of age, including the period before birth, in the belief that if foetal and infant growth can be protected, then young child stunting for instance, could be eliminated within a decade. The UNICEF DPRK country programme will thus need to further refine and better define its IECD approach by the time the next country programme begins. If a set of activities for stunting prevention can be put in place by then it would offer an exciting avenue for IECD to push into in DPRK in the period 2005-2010. The Conceptual Framework Many authors have proposed the use of frameworks and models for studying and predicting the determinants of child survival and development in developing countries. Mosley and Chen were the first to develop an analytical framework for the study of the determinants of child survival in developing countries12. Van Norren also proposed an intermediate variables model for studying the effects of primary health care interventions13. Victora and colleagues also recommended the use of conceptual frameworks in the analysis of complex hierarchical inter-relationships of determinants of disease14. The conceptual framework proposed by UNICEF as part of its Nutrition Strategy is shown in Figure 1. The framework recognises that there are many possible causes of child malnutrition and that solving such malnutrition problems requires a proper understanding of the importance of the various different causes, otherwise attempted solutions are likely to fail. It has three layers of causality, namely the basic more distal level, the underlying or intermediate level, and the immediate or proximal level. These three levels also correspond to different levels of collectivity, namely the immediate level is the individual, the underlying the family and/or community, and the basic level that of a nation or a society as a whole. The UNICEF nutrition conceptual frame work is designed to help facilitate the process of assessing, analysing and deciding on what actions to take at all levels of society to resolve nutrition problems. This is also known as the “Triple A” process (Assessment, Analysis, Action). The first important contribution of the conceptual framework is in communicating the dual importance of disease and nutrient intake in generating child malnutrition. That is that the immediate causes of malnutrition are both disease and nutrient intake, and that fixing malnutrition requires dealing with both causes. For example, unless hygienic measures are established for preparation of infant foods and or the infant is exclusively breastfed for the first six months of life, then excessive and repeated diarrhoea will lead to growth faltering regardless of the adequacy of nutrient intake. The second important contribution of the conceptual framework is that the three underlying causes are all equally essential but alone insufficient. The underlying causes are household food security; health, water and sanitation services; and maternal and child care. Household food security concerns the adequacy of food available at the household level, which covers both qualitative adequacy and quantitative adequacy, i.e. it is not just about satisfying energy needs but all the nutrients. Food security is also related to the degree of effort required (i.e. number of hours worked a day) and its fragility, i.e. the reserves available. Health, water and sanitation services relates to the availability of adequate drinking water and adequate faeces disposal systems, and the availability of health services such as immunisations and treatments for child illnesses such as diarrhoeal disease and acute respiratory infections.

5
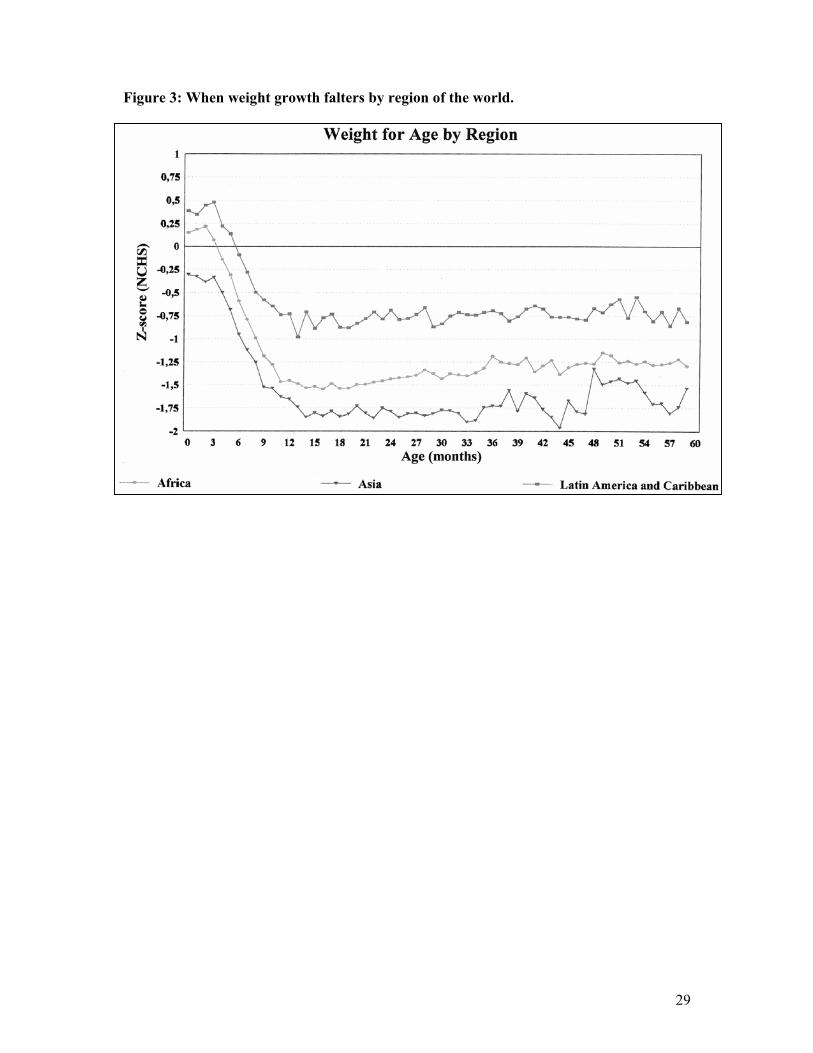
Perhaps the most innovative contribution of the UNICEF conceptual framework was the development of the concept of maternal and child care. As is shown in Figure 2, maternal and child care relates to the practices that are customary in the households in relation to how food and diseases are dealt with. Caring practices concerning how food available at the household level is distributed within the household, whether that food is hygienically prepared, and whether available health services are availed of. Gender disparities are most commonly manifested in the way women are cared for at the community and household level prior to and during pregnancy, and how girls are treated once born. The whole dimension of care is developed in full in the UNICEF manual for facilitating improved caring practices by communities15. The basic level of causality concerns the resources available to families and communities, and the rules that govern how those resources are distributed at the level of society. The most basic of causes relates to the availability of natural resources such as agricultural land, water for irrigation, petroleum and gas, iron and other metal ores, gems, and forests. How these resources are transformed into goods that can be marketed for profit, and the distribution of such profits among members of society are determined by the political and economics systems in place and are a reflection of how society is organised. The equity of the distribution of such resources is a measure of the political system adopted by the nation. The level of education of the members of society also has a strong influence over how resources are used at the level of the family and the community. The cultural beliefs inherent to the society also influence the way resources are used at the level of the family and the community and distributed across society. Resolving nutritional problems by taking action which effect changes at different levels of causality requires different time scales. Solving problems at the individual level with population wide short term magic bullet “treatments” is very effective, although it may not be sustainable over the long run. An example is the distribution of vitamin A capsules twice a year, ensuring individual requirements regardless of dietary intake. Changes in the underlying level causes are more complex, require more time and are medium term. For example encouraging the production of home gardens for growing fruit and vegetables so that vitamin A rich foods are available for consumption at the household level can take several years to show an effect. Changes in basic causes are most complex and require longer terms for resolution. For example if there are local beliefs that the consumption of vitamin A rich foods is bad for women and children, it may take a generation to change such beliefs. Solving problems at the underlying and basic levels takes longer but leads to more sustainable population wide solutions. Tackling a problem at one level shouldn’t mean not tackling the same problem at another level of causality. One of the shortcomings of the nutrition strategy and conceptual framework is that insufficient emphasis is given to the life-cycle nature of the nutrition problem. The nutrition strategy didn’t sufficiently recognise the influence of maternal nutrition and poor foetal growth on the occurrence of malnutrition in pre-school children. As shown in Figures 3 and 4, in nearly all populations length/height growth is normal after two years of age, and most weight growth faltering occurs before the end of the first year of life. It is increasingly recognised that to prevent child malnutrition, especially stunting, radical population wide interventions are needed before birth16. Thus, there is a need to include in the conceptual framework a broad spectrum of outcomes that are temporally linked to child survival growth and development (i.e. maternal health and nutrition status, and foetal growth). This report uses a modified UNICEF conceptual framework to look at the temporal, immediate,

6
underlying and basic causes of stunting as shown in Figure 5. A new layer of causality is included which covers the temporal relationships between maternal nutrition, foetal growth and child stunting. The immediate, underlying and basic determinants of these various outcomes are very similar and although the same interventions may contribute to improving all of them, the timing of the interventions will have very different results. Methods The methods used to carry out the 2002 Food and Nutrition assessment in DPRK have already been described in detail elsewhere17, and so only the main points are summarised here. The sample of the survey is representative of the universe of all households in the 10 provinces including 3 municipal cities. The randomisation process for selecting the sample households in each province/city was performed in two stages. Firstly, all Dong or Ri of the 10 provinces/cities served as the sampling frame to each randomly select 20 of them, which formed the primary sampling unit (PSU). This selection was performed according to the urban-rural proportion so that 200 PSU were randomly selected proportionate to size. Secondly, in each PSU, one nursery was randomly selected from a list of nurseries and two children from the list of those enrolled in that nursery were randomly selected as the index households. These two households, together with the 14 households with children under seven years of age closest to them, together formed the secondary sampling unit (SSU). Thus, 30 households were selected for each PSU, and a total number of 6000 households were surveyed in SSUs of the ten provinces/cities. In each household, only the youngest child under two years of age was included in the survey, giving 6000 children. The sample size is considered sufficient to generate child malnutrition rate estimates with a 4-6% margin of error and with 95% confidence intervals at the provincial level, taking into account the design effect of 2. The questionnaire was largely based on the UNICEF MICS2 questionnaire18, with those parts not directly pertinent to the food nutrition objectives of the survey removed because of the time constraints imposed by the 10 days of fieldwork agreed with Government. The “bare bones” questionnaire was composed of four parts; household questions, maternal and newborn health questions, child anthropometry and maternal clinical investigation. New questionnaires were developed and included to assess household food stores and maternal food patterns. These questionnaires were developed in collaboration with ICN and CBS staff and were initially field-tested during the training period. The household food security questions module was included in the household questions section of the questionnaire and applied in the whole sample of 6 thousand households. The maternal food pattern module concerning foods eaten by the mother the day before was only applied to the mothers of children aged less than two in the maternal and newborn health question section of the questionnaire. Mothers were also asked to recall the birth weight of their children aged less than two years of age. A detailed field survey manual was prepared and shared with data collection teams, which explained all methods, procedures and questions in the survey. Prior to the fieldwork the anthropometry team was subject to a physical anthropometry techniques standardisation protocol19, after which seven of the team had further training to improve measurement techniques. All data collection was carried out in ten days of fieldwork carried out in the last 3 weeks of October 2002. In each PSU, the provincial logistics team had drawn rudimentary maps

7
showing the houses of the children in the selected nurseries and prepared the local communities to be at home on the day of the visit. When the data collection team arrived in a PSU, they visited the nursery and randomly selected two children from the register and their names and address were noted down. In order to save time the interviews and examinations were all carried out in a central location, often the nursery, where conditions were more appropriate for the mother to be interviewed and examined, and the child to be weighed and measured. All child anthropometry methods conformed to international standards20. Weight was measured to the nearest 0.1kg using the UNISCALE (UNICEF Supply Division, Copenhagen, Denmark) and height/length to the nearest 1.0 mm using a locally adapted wooden measuring board. The maternal clinical module included maternal weight, the mothers mid-upper arm circumference (MUAC) and a finger prick haemoglobin test. Mother’s weight was measured to the nearest 0.1kg using a UNISCALE, and all children aged less than two years of age were weighed in the arms of their mother by first weighing the weight of the mother and then after taring the scale, weighing the mother and the child together. The mother’s weight was recorded. In addition, the mothers Mid Upper Arm Circumference (MUAC) was measured to the nearest 1.0 mm using a plastic insertion tape obtained from UNICEF Indonesia. For those mothers of children under two years of age who agreed, blood samples were collected from the mother by finger prick and Haemoglobin was measured in the field using the Haemocue method (HemoCue AB, Angelholm, Sweden). Data entry, verification and processing were done using EPI- INFO 6 version 6.04d and ANTHRO version 1.01 developed by US Center for Disease Control (CDC) in collaboration with the World Health Organisation (WHO)21. The cut offs used to define stunting were those recommended by the World Health Organisation22, i.e. less then two Z-scores of height for age as compared to the NCHS standard were considered to be stunted. The cut-offs for maternal nutritional status used to determine the extent of malnutrition were maternal weight 40kg and for middle upper arm circumference 22.5 cm. Both cut-offs have been found appropriate for detecting high risk of having a low birth weight baby in Asian populations where mothers are of short stature23. For anaemia the cut-off used for blood haemoglobin level was 12 g%, the level recommended by WHO for use in non-pregnant women of reproductive age24. Data analysis was carried out using by SPSSPC version 10.0.5 for Windows (SPSS, Mississippi, USA). Provincial level frequency, rate, cross tabulation and correlation were tabulated and calculated initially and those results have been reported elsewhere25. As a first step in this more in-depth analysis, the information available in the questionnaire was verified in order to create a list of relevant variables for use in the analysis. This was achieved by analysing one by one the various questions from the nutrition assessment questionnaires looking at their potential for creating meaningful indicators. The various causes, or more correctly, “predictors” of stunting were allocated to groups according to their classification in the conceptual framework at the basic, underlying, immediate and temporal levels, as shown in Table 1 and Figure 2. The relationship of these various predictors, with stunting at the individual level was analysed by doing cross tabulations using the Chi Squared test for significance of associations. Those predictors found to give a significant association with stunting based on the Chi squared test were then subject to multivariate binomial regression analysis.

8
Results CRITERION The stunting criterion being used in this analysis is confined to those aged two years and under. As is shown in Figure 5, the process of stunting is essentially all over by 2 years of age in the DPRK, as the mean Z-score of height for age flattens and becomes parallel to the reference growth pattern by the second year. Any analysis that separates out younger children in the first months of life and compares them with older children will inevitably find differences in stunting rates, since the children in the first year of life are less stunted. The mean Z-score of height for age is already one standard deviation below the reference in the first year of life, suggesting that this process really did begin before birth. As is shown in Figure 6 the occurrence of stunting is very different in the ten provinces cities, with Nampo and Pyongyang less than 30% stunted as compared to the others all over 35% stunted, with South Hamgyong and Ryanggan having more than 45% stunted. TEMPORAL PREDICTORS Maternal and Foetal Nutrition The various indicators of maternal nutrition available for analytical purposes include maternal weight, maternal mid-upper arm circumference, and maternal haemoglobin levels. These variables are only available on the mothers of children aged less than two complete years. The haemoglobin levels are available on an even more restricted number of mothers, i.e. those that consented to finger tip puncture for blood examination. The relationship between these various maternal nutrition variables and stunting are shown in Table 2. About one third of mothers had small mid-upper arm circumferences, a third were anaemic and one in five had small body weight. Only mid-upper arm circumference showed a significant association with stunting (Chi Squared =4.723 P=0.03). Although the relationships with body weight and maternal anaemia were similar in terms of proportions of stunting and in the same direction, these were not statistically significant due to small numbers. As is shown in Table 3 the association between MUAC and stunting is not the same across all the 10 provinces/cities. In only seven of the provinces/cities is the relationship the same (the more prevalent smaller MUAC, the more prevalent stunting), of which only three are statistically significant, and in the other three the association is either the same or in the other direction. IMMEDIATE PREDICTORS Disease The only disease variables that were measured in the nutrition assessment were those of child infections, including whether the child had had diarrhoea and/or acute respiratory infections in the previous two weeks. As shown in Table 4 about one in five children had had diarrhoea as compared to a third having had respiratory infection. Only the occurrence of diarrhoea in the previous two weeks was found to be significantly associated with stunting in children aged less than two (Chi Squared =3.135, p=0.043). Nutrient intake The coverage of vitamin A capsules seems to be negatively associated with stunting. Children whose mothers received a vitamin A capsules and who received them themselves were more likely to be stunted. Whilst 65% of children received vitamin A capsule in the previous 6 months, stunting rates were a half of those not receiving (Chi Squared = 102.22, p=<0.0001).

9
A similar negative association is seen with regard to mothers getting a vitamin A capsule at birth. Only one third of mothers got vitamin A capsules at birth, and stunting rates were significantly higher among the children born to these mothers (Chi squared = 6.518, p=0.038). Maternal food patterns seem to have an important relationship with child stunting. Half the mothers had consumed meat or egg the day before and their children were less likely to be stunted (Chi Squared = 18.168, p=<0.0001). Similarly, the children of the one third of mothers that had eaten rice and of the one third that had eaten pulses the day before were less likely to be stunted (Chi Squared = 13.199, p= <0.0001and Chi squared 4.371, p=0.37 respectively). However, the consumption of fruit and vegetables by the mothers the day before showed no such association. Mothers consuming fortified foods and supplements had children that were less affected by stunting, although only significantly so for supplements (Chi squared =3.446, p=0.036). In Table 5, the frequency of stunting is consistently greater in the children of mothers who hadn’t eaten meat and/or eggs the day before in only 7 of the ten provinces/cities. This association was only statistically significant in North Hamgyong. In the three other provinces/cities stunting is smaller in two and in one it is the same, although these associations are not statistically significant. UNDERLYING CAUSES Health, Water and Sanitation Services There seems to be no significant influence on child stunting of the coverage of health services. Only two indicators can be used to judge the adequacy of health care services, namely the coverage of antenatal care and of immunisations. As is shown in Table 5, the coverage of antenatal care has a very highly significant association with the level of stunting, but perhaps in the reverse direction to that expected (Chi Squared =102.22, p=<0.0001). Similarly, the levels of stunting were highest in the children who had the highest coverage of immunisation. As is shown in Table 7 those who have more antenatal care are more likely to be malnourished in all of the provinces/cities. However, because of the small numbers in the province/city level analysis the association was only significant in one province, South Hwanghae. Maternal and Child Care The only indicators available to judge the adequacy of maternal and child care are breastfeeding and care of the child during illness. As shown in Table 8 the prevalence of stunting in the 98% of under two year olds that were ever breast-fed is higher than in those 2% that were never breastfed (Chi square = 3.135, p=0.043). The degree of stunting in the 80% of under two year olds still being breastfed is not significantly different to that of those no longer breastfed. The numbers of children with illness and that were not fed properly are too few and are not meaningful to analyse. Household Food Security There seems to be an association between the main staple stored in the house and stunting. The household food availability module has questions that allow inferences to be made about both the quantitative and qualitative aspects of household food security. The overwhelming majority of households (99.6%) were reported to have at least some food stored in the house, suggesting that quantitatively food security was not a problem. There is considerable

10
variability across the ten provinces cities as to what was the main food stored in the household, as is shown in Figure 7. Maize was the most common main staple in seven provinces cities and rice was most common in Pyongyang and South Hwanghae. In Ryanggang the most common staple food stored was potato. As shown in Table 9, the types of container or place used to store food varied, with the most common store being a box, basket or sack (85%) followed by an earthenware pot (63%) or a cupboard (54%) and with few refrigerators (6%). Thus, most houses had more than one place to store food. The main foods reported to be stored in those household stores were either maize (43.2%), rice (35.2%) wheat (10.4%) or others foods (11.3%) such as sweet potatoes, Irish potatoes, millet or barley. The source of the main staple foods was most often from the public distribution centres (58%), the farmers food ration (35%) or WFP (7%). Simple mathematics allows us to conclude that it was also common for houses to have more than one food stored in the house. The most common “other foods” stored in the house were vegetables (98%), (most probably “kimchi”), followed by pulses (69%), fruits (25%) and fortified foods from WFP (5%). Stunting was less common in children of mothers who reported having rice (35%) or wheat (34%) than in children of mothers who reported having maize (43%) or other foods (43%) as the main food staple stored in the house (Chi Square = 45.037, p<0.0001). Stunting was also less common in children of mothers who reported having WFP fortified foods stored in the house, and whose source of main food was the WFP ration ((Chi square = 22.68, p<0.0001). There was no difference in the level of stunting between those families that got their main food from the public distribution system compared to those that got it from the farmers ration. Table 10 shows that the presence of either rice or wheat in the main food store is consistently associated with less stunting in only six of the provinces/cities, and significantly so in three of them. In the other four provinces/cities those that eat rice/wheat are more stunted, and in one of these, South Hamgyong, the difference is statistically significant. BASIC PREDICTORS The data available in the food and nutrition survey 2002 is somewhat limited in terms of basic causes of stunting and wasting. The household information module is very limited since many of the MICS modules were suppressed in the elaboration of the “bare bones” nutrition assessment questionnaire. The variables available and their relationship with stunting are shown in Table 11. Quite remarkably, all mothers had completed middle school and a quarter had even finished high school. Stunting rates were essentially the same in children of mothers who had completed middle school. None of the mothers of children under seven was aged less than 20 years of age, and most mothers (59%) were aged 30-40 years of age. Stunting was also more common when the mother was older (Chi squared = 24.468,df 2, p<0.0001). Around a third of houses had only one child aged under-seven years of age, around a half had two, and only 8% had three. Stunting of the youngest child aged less than seven complete years was more common in households with only one (40%) and two children (40%) than in those with three (30.3%) children under seven. (Chi Square =18.38, df 2, p<0.0001). Only 26% of houses had three people present, 54% had 4 persons present and 19% had five or more. Stunting in the youngest child was less common in the households with five or more members (36%) than in those with four (40%) or three members (40%) although these differences were not significant. The location of the house of the child in rural or in urban areas had no effect on the stunting rates of children in those houses. There were however strong provincial differences in stunting levels across the provinces/cities (Chi Square =

11
140.390 p<0.0001), with less stunting in the cities of Pyongyang and Nampo, and high rates elsewhere, as is shown in Figure 6. ALL PREDICTORS A multivariate analysis identified four predictors that were statistically significant correlates of stunting, as is shown in Table 12. These predictors included maternal mid-upper arm circumference, whether the mother ate meat or eggs the day before, whether the main food in store was rice or wheat, and if the number of antenatal visits were less than seven. The most significant of these predictors was the number of antenatal visits. The predictors that were excluded from the model after being entered include whether the baby was born low birth weight or not, whether the child was given BCG vaccination or not, and whether the child had had an infection in the previous two weeks. Discussion Although the 2002 nutrition assessment data set is not ideally suited to using the conceptual framework to try to analyse for the causes of stunting, it still allows some important conclusions to be reached about the possible causes of stunting of children in DPRK. The “bare bones” MICS survey is lacking in many predictors that might have helped to better explain the causality of stunting. The water and sanitation module of the MICS questionnaire was not included in the nutrition assessment, and so the influence of these predictors on stunting could not be analysed. The household food questionnaire was rudimentary and only gathered very crude indices of food availability. The reproductive history of the mother was also suppressed, and this is known to influence child malnutrition variables. We don’t know how many of the mothers of children under two were pregnant, nor their parity, all of which would have allowed better assessment of the condition of the mother. But still some interesting patterns emerge from the data, nearly all of which point to the condition of the mothers as being the critical area of important causes of stunting. Although at first the negative associations between stunting and the coverage of health care services seem counter-intuitive and hard to understand, it may in fact prove to be logical. The strong negative association (overall it was significant but when breakdown to provincial level, only South Hwanghae was significant) between those with more than seven antenatal visits and stunting may just be because those mothers were in a special situation, needed extra attention during pregnancy, and subsequently had babies with lower birth weight. It also means these efforts were not able to prevent stunting, and that even with more attention the interventions given, if any, were unsuccessful at least with regard to stunting. The fact that these mothers are almost a half of those with children aged under-two years of age may reflect the harsh reality of mothers in DPRK who have to work during pregnancy and although sick, may in fact not get much medication or treatment. The commune health workers and the commune health station are all in very close proximity to the mothers at the community level and once pregnant there is at least monthly contact between the mothers and the health service. It is therefore likely that a mother that had more than seven antenatal contacts was in some way needing help or not feeling well and so got even more attention. Such a mother that was sicker during pregnancy might well end up having a more stunted child. The strongly negative association of stunting of children that received and didn’t receive the vitamin A capsule might appear to be the reverse of that which is expected, since if the child received a vitamin A capsule in the last six months, it means that the nutrient requirements of the child have been guaranteed. This is likely to be a reflection of the age of those that didn’t

12
receive the capsule, since it is not given to those aged less than 6 months of age, when stunting is still low in prevalence. Why this negative association should also be observable in the children of mothers that received a vitamin A capsule at birth cannot be explained by the age of the child, however. If the mother receives vitamin A capsules at birth, then her vitamin A requirements are also guaranteed for several months and her breast milk vitamin A levels will be higher, thus also benefiting her child. It may just mean that the coverage of Vitamin A at birth is higher in areas that are less privileged. The results do suggest that maternal nutritional status, especially their food patterns, is associated with stunting in DPRK. Whether the dietary pattern reported by the mother was the same when the mother was in pregnancy and/or before her pregnant state, we cannot say, but we can surmise that although the consumption of animal protein by these groups of mothers is not likely to be constant over time the differences across the groups is likely to be. These strong associations with the protein foods do not necessarily mean that it is the protein per se that is the important factor. Meat and egg are not only rich in protein but also in many micronutrients, most notably iron and zinc. The association of stunting with whether or not rice or wheat was the main staple stored in the house is also interesting, even if difficult to interpret further. The association between stunting and the presence of WFP in the food store of the house is likely to be due to differences in age of such children because mothers only get WFP food if the child is still under one year of age, when stunting rates are still low. The association of stunting to MUAC but not to birth weight of the baby is supportive of the idea that the causes of stunting are different to the causes of wasting or underweight. The MUAC is closely associated with the body mass index of the mother, and a likely indication of what pre-pregnancy weight might have been. The birth weights of babies in DPRK were extremely good with only 7% being born less than 2.5kg. Birth weight is a reflection of weight gain in the latter part of pregnancy specially and the adequacy of energy intake in that period. Stunting however is more likely to be determined in the early part of pregnancy and influenced by the quality of the diet more than the quantity of the diet. Even though there was no association found between stunting and anaemia the fact that a third of mothers were anaemic is of concern, and with greater numbers this association would likely have been significant. The location of the household has important associations with stunting. Although there are no differences between urban and rural dwellings, there are important differences across provinces/cities, with residence in Nampo and Pyongyang offering considerable advantage. The differences associated with size of the household, age of the mother, and the number of children under seven, are likely to be related to the increased chance of the child under seven being younger and therefore less stunted. The lack of a consistent association between stunting and the various predictors used in the analysis emphasise how the discovery of these different associations doesn’t prove causality. Indeed the causality of stunting is unlikely to be due to a single factor and multiple factor interventions need to be developed in each province that take into consideration the temporal, immediate, underlying and basic causes in each province. The analysis does suggest however that such a package should strongly consider the inclusion of interventions that improve maternal nutritional status and protect foetal and infant growth.

13
Conclusions and Recommendations The level of stunting among children under-two years of age in DPRK is still very high and a matter of great concern. The stunting problem requires the continued and urgent attention of all parties concerned. The consequences of stunting are not only reflected in the short term in greater child mortality but also over the medium and long term in poorer school performance, decreased work capacity and increased risk of adult morbidity and early death. The data set from the 2002 nutrition assessment, although not ideally suited to using the conceptual framework to analyse the causes of stunting in DPRK, does allow some interesting hypothesis to be generated and certainly point to the maternal condition as being critically important in the generation of stunted children. Stunting rates in children certainly show strong associations with maternal food patterns, with maternal nutritional status and the coverage of health services during pregnancy. The condition of mothers in DPRK is generally poor. About one third of mothers of children under two in DPRK have either anaemia and/or low body mass as predicted by low mid-upper arm circumference. Every effort should be applied to developing an integrated package of interventions to improve maternal nutritional status, preferably before getting pregnant, and to protecting foetal and infant growth.

14
Annex 1: Tables and Figures CONTENTS: Table 1: The variables used and the predictors created in order to analyse the causes of
stunting in the data obtained from the DPRK food and nutrition survey 2002......................15 Table 2: Temporal level causes: maternal and foetal nutritional status and child stunting..................16 Table 3: The association between maternal malnutrition based on small mid-upper arm
circumference and stunting by province/city in DPRK 2002 ................................................17 Table 4: Immediate level predictors: maternal and child nutrient intake and disease in relation
to child stunting......................................................................................................................18 Table 5: The association between whether the mother ate meat or eggs the day before and
stunting of her child under-two years of age by province/city in DPRK...............................19 Table 6: Underlying level predictors: health, water and sanitation services in relation to
child stunting..........................................................................................................................20 Table 7: The association between whether the mother had more than seven antenatal care
contacts and stunting of her child under-two years of age by province/city in DPRK ..........21 Table 8: Underlying level predictors: maternal and child care ............................................................22 Table 9: Underlying level predictors: household food security in relation to child stunting ...............23 Table 10: The association between whether the main food in store was rice or wheat (yes/no),
and stunting of the child under-two years of age by province/city in DPRK ........................24 Table 11: Basic level predictors of child stunting in 10 provinces/cities of DPRK in 2002..................25 Table 12: Multivariate logistic regression analysis of the predictors of young child stunting in
ten provinces/cities of DPRK.................................................................................................26 Figure 1: The UNICEF Conceptual Framework depicting the causes of child malnutrition ................27 Figure 2: Care and the conceptual framework for child malnutrition ...................................................28 Figure 3: When weight growth falters by region of the world ..............................................................29 Figure 4: When length growth falters by region of the world ...............................................................30 Figure 5: A modified conceptual framework recognising life cycle dimension of nutritional
insults and outcomes ..............................................................................................................31 Figure 6: When length/height growth falters in DPRK 2002 ................................................................32 Figure 7: Stunting rates in children aged less than 8 years of age in 10 provinces/cities of
DPRK 2002(%)......................................................................................................................33 Figure 8: The frequency of main food groups reported to be stored in the house by province/
city of DPRK 2002.................................................................................................................34

15
Table 1: The variables used and the predictors created in order to analyse the causes of stunting with data obtained from the DPRK food and nutrition survey 2002.
Outcome/Criterion: Child Stunting
Temporal predictors: Mother nutritional status
Mid Upper Arm Circumference Weight Anaemia Foetal growth
Birth weight Immediate predictors: Food/nutrient intake:
Vitamin A capsules (mother) Vitamin A capsule (child) Diet (type of food) the day before (mother) Diseases:
Acute respiratory infection (child) Diarrhoea (child) Underlying predictors: Household food security Existence of food store Variety of food kept in food store Health, water and sanitation services Antenatal care Immunisation Maternal and child care practices Breastfeeding Care of child in illness Basic Predictors: Education Mother’s education Family composition
Number of people in household Number of children under seven Mother age
Material wealth Refrigerator
Location Province
Urban/rural

16
Table 2: Temporal level causes: maternal and foetal nutritional status and child stunting.
Maternal and foetal nutrition predictors N Frequency Stunting %
Chi Squared P
<22.5 591 35 33.8 Mid-upper Arm Circumference (cm) 22.5+ 1333 65 29.7 4.915 0.027
<11 203 37.2 34.5 Haemoglobin (g/dl) 11+ 404 62.8 29.2 1.758 0.185
<45 470 18.1 33.4 45-<50 1939 68.5 30.7
Maternal nutrition
Body weight (kg)
50+ 399 13.5 29.3 1.882 0.390
<2.5 166 7.2 33.7 Foetal nutrition
Birthweight (kg) 2.5+ 2335 92.8 31.0 0.521 0.471

17
Table 3: The association between maternal malnutrition based on small mid-upper arm circumference and stunting by province/city in DPRK 2002.
Province MUAC <22.5cm Number Frequency
(%) Stunting
(%) Chi
Squared Probability
Kaesong Yes 37 14.0 64.9 No 227 86.0 33.5
13.318 <0.0001
Nampo Yes 43 15.0 9.3 No 243 85.0 17.7 1.874 0.171
N Hamgyong Yes 39 14.2 38.5 No 236 85.8 34.7 0.202 0.653
N Hwanghae Yes 31 11.4 35.5 No 241 88.6 27.9 0.767 0.249
N Phyongan Yes 44 14.9 27.3 No 251 85.1 33.1 0.489 0.283
Pyongyang Yes 72 25.6 29.2 No 209 74.4 16.7 5.177 0.023
Ryanggang Yes 50 19.2 38.0 No 210 80.8 37.6 0.002 0.541
S Hamgyong Yes 44 15.4 50.0 No 241 84.6 34.4 3.872 0.049
S Hwanghae Yes 33 12.4 39.4 No 233 87.6 29.2 1.423 0.233
S Phyongan Yes 39 13.1 30.8 No 259 86.9 33.5 0.337 0.562

18
Table 4: Immediate level predictors: maternal and child nutrient intake and disease in relation to child stunting. Predictors Indicator Number Frequency
(%) Stunting Chi
squared Probability
Diarrhoea yes 551 19.8 34.1Diarrhoea no 2230 80.2 30.2 3.135 0.043
ARI yes 764 33.6 29.4
Child disease in last 2 weeks ARI no 1513 66.4 30.6 0.219 0.338
Vitamin A capsule yes
1824 65.4 37.4Child took Vitamin A capsule in last 6 months
Vitamin A capsule no
963 34.5 18.9 102.22 <0.0001
Mother got capsule
924 33.1 34.1Vitamin A capsule for mother after birth
Mother didn’t get capsule
1864 66.8 29.5 6.518 0.038
Meat/egg yes 1391 49.8 27.3Meat/egg no 1400 50.2 34.8 18.168 <0.0001
Rice yes 2493 86.2 30.6Rice no 298 13.8 40.3 13.199 <0.0001
Maize yes 1894 69.6 31.8Maize no 897 30.4 29.4 1.645 0.107
Pulse yes 1782 61.0 29.7Pulse no 1009 39.0 33.5 4.373 0.037
Fruit yes 927 35.3 29.2Fruit no 1702 64.7 31.1 1.915 0.166
Veg yes 2696 98.6 31.8Veg no 37 1.4 32.4 0.035 0.853
Fortified food yes
265 16.7 25.7
Fortified food no
1319 83.3 29.9 1.960 0.091
Supplement yes 483 29.7 25.9
Mother ate from these food groups the day before
Supplement no 1146 70.3 30.9 3.446 0.036

19
Table 5: The association between whether the mother ate meat or eggs the day before and stunting of her child under-two years of age by province/city in DPRK.
Province Ate
meat/eggs yesterday
Number Frequency (%)
Stunting (%)
Chi Squared Probability
Kaesong Yes 167 63.3 34.1 No 97 36.7 44.3 2.712 0.100
Nampo Yes 227 78.8 15.0 No 61 21.2 24.6 3.146 0.076
N Hamgyong Yes 226 45.7 23.8 No 150 54.3 44.7 13.069 <0.0001
N Hwanghae Yes 135 49.8 28.9 No 136 50.2 28.7 0.001 0.538
N Phyongan Yes 212 70.7 34.4 No 88 29.3 27.3 1.458 0.227
Pyongyang Yes 188 66.9 17.6 No 93 33.1 24.7 2.009 0.156
Ryanggang Yes 84 32.2 40.5 No 177 67.8 36.7 0.341 0.559
S Hamgyong Yes 93 32.6 35.5 No 192 67.4 37.5 0.109 0.422
S Hwanghae Yes 71 26.7 26.8 No 195 73.3 31.8 0.430 0.263
S Phyongan Yes 88 29.4 31.8 No 211 70.6 36.5 0.440 0.263

20
Table 6: Underlying level predictors: health, water and sanitation services in relation to child stunting. Health service Indicator Number Frequency Stunting Chi Squared P
0 31 1.1 38.9 1-3 386 13.8 27.2 4-6 1058 37.9 27.5
Antenatal care frequency during pregnancy 7-9 1314 47.1 34.8
18.276 <0.001
BCG yes 2471 89.0 31.5 BCG no 306 11.0 27.8 1.747 0.104
Measles yes 1882 67.7 37.1 Measles no 895 32.2 18.4 98.523 <0.001
DPT yes 1858 66.9 31.9 DPT no 919 33.1 29.4 1.847 0.094
Polio yes 2711 98.1 31.2
Child immunisation
Polio no 67 1.9 23.9 1.655 0.123

21
Table 7: The association between whether the mother had more than seven antenatal care contacts and stunting of her child under-two years of age by province/city in DPRK.
Province Antenatal care >7 times
Number Frequency (%)
Stunting (%)
Chi Squared Probability
Kaesong Yes 103 38.9 38.3 No 162 61.1 37.9 0.004 0.947
Nampo Yes 63 21.9 19.0 No 225 78.1 16.4 0.236 0.627
N Hamgyong Yes 124 45.1 38.7 No 151 54.9 32.5 1.168 0.280
N Hwanghae Yes 220 81.5 30.0 No 50 18.5 24.0 0.714 0.398
N Phyongan Yes 104 34.9 33.7 No 194 65.1 31.4 0.152 0.697
Pyongyang Yes 136 48.4 23.5 No 145 51.6 16.6 2.141 0.143
Ryanggang Yes 109 41.9 43.1 No 151 58.1 33.8 2.354 0.125
S Hamgyong Yes 156 54.7 38.5 No 129 45.3 34.9 0.388 0.533
S Hwanghae Yes 126 47.2 40.5 No 141 52.8 20.6 12.568 <0.001
S Phyongan Yes 114 38.0 38.6 No 186 62.0 32.8 1.045 0.307

22
Table 8: Underlying level predictors: maternal and child care. Predictor N Frequency Stunted Chi Square ProbabilityEver breastfed yes 2710 97.4 34.5 Ever breastfed no 71 2.6 30.2 3.135 0.043
Breastfed now yes 2170 79.8 29.6 Breastfed now no 548 20.2 30.5 0.219 0.338

23
Table 9: Underlying level predictors: household food security in relation to child stunting. Household food security characteristic
N Frequency (%)
Stunting (%)
Chi Square
Probability
Type of food store Cupboard yes 3217 53.7 39.8 Cupboard no 2777 46.3 34.4 0.834 0.361
Box/Basket/Sack yes 5071 84.6 38.7 Box/Basket/Sack no 923 15.4 42.0 3.625 0.057
Earthenware Pot yes 3805 63.5 40.3 Earthenware Pot no 2189 36.5 37.3 5.220 0.022
Refrigerator yes 389 6.5 32.6 Refrigerator no 5606 93.5 39.7 7.543 0.006
Other yes 389 8.6 31.3 Other no 3920 91.4 40.0 14.717 <0.0001
Main Food in Store Rice 2106 35.2 35.0 Maize 2587 43.2 42.8 Wheat 622 10.4 34.1 Barley 84 11.3 43.2 Millet 50 0.8 44.0 Irish Potato 456 7.6 43.0 Sweet Potato 86 1.4 36.0
45.037 <0.0001
Other foods in store Pulse yes 4161 69.4 39.3 Pulses no 1833 30.6 39.1 0.130 0.467
Vegetables yes 5862 97.8 39.3 Vegetables no 131 2.2 39.1 0.187 0.360
Fruits yes 1530 25.5 37.2 Fruits no 4463 74.5 39.9 3.585 0.058
Fortified foods yes 329 5.5 26.7 Fortified foods no 5659 94.5 39.9 22.689 <0.0001
Source of Main Food PDC ration 3465 57.8 40.2 WFP ration 441 7.4 27.0 Farmers ration 2078 34.7 40.1 Others 10 0.2 55.6
31.490 <0.0001

24
Table 10: The association between whether the main food in store was rice or wheat (yes/no), and stunting of the child under-two years of age by province/city in DPRK.
Province
Main food in store is Rice or Wheat
Number Frequency (%)
Stunting (%)
Chi Squared Probability
Kaesong Yes 102 37.3 37.3 No 162 38.3 38.3 0.027 0.868
Nampo Yes 190 17.9 17.9 No 98 15.3 15.3 0.307 0.508
N Hamgyong Yes 150 28.0 28.0 No 126 43.7 43.7 7.359 0.007
N Hwanghae Yes 149 30.2 30.2 No 121 27.3 27.3 0.279 0.598
N Phyongan Yes 161 30.2 30.2 No 139 32.3 32.3 0.531 0.466
Pyongyang Yes 210 18.6 18.6 No 71 23.9 23.9 0.960 0.327
Ryanggang Yes 71 26.8 26.8 No 190 42.1 42.1 5.167 0.023
S Hamgyong Yes 143 43.0 43.0 No 142 36.8 36.8 4.549 0.033
S Hwanghae Yes 151 31.8 31.8 No 115 28.7 28.7 0.295 0.587
S Phyongan Yes 128 28.1 28.1 No 171 40.4 40.4 4.802 0.028

25
Table 11: Basic level predictors of child stunting in 10 provinces/cities of DPRK in 2002.
Household Characteristic Number Frequency Stunting (%)
Chi squared Probability
No. People in household 3 1586 26.8 40.14 3230 53.9 39.95+ 1178 19.3 36.2
5.465 0.065
No. Children <8 years of age
1 2250 37.5 40.42 3253 54.3 39.83 490 8.2 30.2
18.380 <0.0001
Age of Mother (years) 20-29 2336 39.0 35.430-39 3512 58.6 41.440+ 146 2.4 46.6
24.468 <0.0001
Mothers Education Middle school 4559 76.1 39.7High school 1435 23.9 37.8 1.670 0.196
Refrigerator at home Yes 389 6.5 32.6No 5605 93.5 39.7 7.543 0.006
Rural location Yes 2516 42.0 39.6No 3478 58.0 38.9 0.297 0.586
Province Location Kaesong 599 10.0 44.4Nampo 598 10.0 23.2North Hamgyong 600 10.0 42.8North Hwanghae 599 10.0 39.4North Phyongan 599 10.0 42.4Pyongyang 599 10.0 27.0Ryanggang 600 10.0 46.7South Hamgyong 600 10.0 45.5South Hwanghae 599 10.0 38.6South Phyongan 600 10.0 42.2
140.390 <0.0001

26
Table 12: Multivariate logistic regression analysis of the predictors of young child stunting in ten provinces/cities of DPRK.
Predictor B S.E. Wald df Sig. Exp (B) 95.0% C.I. for EXP (B)
Lower Upper Mother ate meat the day before (yes vs. no) 0.33 0.10 10.75 1.0 0.001 1.39 1.14 1.69Main food stored is either rice or wheat (yes vs. no) 0.25 0.10 6.30 1.0 0.012 1.29 1.06 1.56Antenatal visits less than 7 (yes vs. no) 0.36 0.10 13.55 1.0 0.000 1.44 1.18 1.74Maternal MUAC greater than 22.5 cm (yes vs. no) 0.33 0.10 10.42 1.0 0.001 1.40 1.14 1.71Constant -2.69 0.28 94.93 1.0 0.000 0.07
Variable(s) entered on step 1: DIAURIYN, MF4, MAINFD2, MN2G, IM3, BW3, MUACC1.

27
Figure 1: The UNICEF Conceptual Framework depicting the causes of child malnutrition.
18
Insufficient HealthServices & Unhealthy
Environment
Child Malnutrition
InadequateMaternal and Child-
Care
InsufficientHousehold
Food Security
Resources & ControlHuman, Economic & Organisational
Potential resources:
The Causes of Malnutrition
Inadequate dietary intake
Disease
Basic causes (PREDICTORS)
Immediate causes (PREDICTORS)
Underlying causes (PREDICTORS)
Inadequate Education
Political and Ideological Superstructure
Economic Structure
Manifestations (CRITERION)

28
Figure 2: Care and the conceptual framework for child malnutrition.
Insufficient HealthServices & Unhealthy
Environment
Malnutrition
InsufficientHousehold
Food Security
Resources & ControlHuman, Economic & Organisational
Potential resources:
Causes of Malnutrition
Inadequate dietary intake
Disease
Basic causes
Immediate causes
Underlying causes
Inadequate Education
Political and Ideological Superstructure
Economic Structure
Manifestations
Care for womenBreastfeeding/Feeding;Psychosocial Care;Food Processing; Hygiene Practices;
Home Health Practices
29
Figure 3: When weight growth falters by region of the world.

30
Figure 4: When length growth falters by region of the world.

31
Figure 5: A modified conceptual framework recognising life cycle dimension of nutritional insults and outcomes.
Maternal Nutritional Status
Foetal survival growth and development
Child survival growth and development
Nutrient intakes
Health, water and sanitation services
Infections
Household Food Security
Maternal and Child Care Practices
Cultural and traditional beliefsEducation and human capital Moral and ethical principles Legal frameworks Natural resources Environmental influences Infrastructure
IMMEDIATE CAUSES
UNDERLYING CAUSES
TEMPORALLY RELATED OUTCOMES
BASIC CAUSES

32
Figure 6: When length/height growth falters in DPRK.
Age Group
6 years and over
5 to less than 6 yea
4 to less than 5 yea
3 less than 4 years
2 to less than 3 yea
1 to less than 2 yea
6 months to less tha
less than 6 months
Mea
n H
AZ
-1.0
-1.2
-1.4
-1.6
-1.8
-2.0

33
Figure 7: Stunting rates in children aged less than 8 years of age in 10 province/cities of DPRK (%).
Figure 7. Stunting rates in children aged less than 8 years of age in 10 province/cities of DPRK (%)
0 5 10 15 20 25 30 35 40 45 50
Kaesong
Nampo
North Hamgyong
North Hwanghae
North Phyongan
Pyongyang
Ryanggang
South Hamgyong
South Hwanghae
South Phyongan

34
Figure 8: The frequency of main food groups reported to be stored in the house by province/city of DPRK 2002.
PROV
South Phyongan
South Hwanghae
South Hamgyong
Ryanggang
Pyongyang
North Phyongan
North Hwanghae
North Hamgyong
Nampo
Kaesong
Cou
nt500
400
300
200
100
0
main food group
rice
maize
wheat
other

35
Annex 2: References 1 Katona-Apte J and Mokdad A. 1998. Malnutriton of children in the Democratic Peoples Republic of North Korea. J Nutr 128: 1315-1319. 2 The Democratic People’s Republic of Korea Nutrition Survey Report. Pyongyang: UNICEF 1999. 3 Central Bureau of Statistics. Report of the second multiple indicator cluster survey 2000, DPRK. Pyongyang: Central Bureau of Statistics DPRK. 4 Central Bureau of Statistics, DPRK. Report on the DPRK Nutrition Assessment. Pyongyang: Central Bureau of Statistics DPRK 2002 (http://www.reliefweb.int/library/documents/2003/unicef-dprk-20feb.pdf). 5 Mason J, Hunt J, Parker D and Jonsson U. Investing in child nutrition in Asia. Asian Development Review. 17(1-2): 1-32. 1999. 6 WHO 1995. Physical status: The use and interpretation of anthropometry. WHO Technical Report Series No 854. Geneva: The World Health Organisation. 7 Tomkins AM, Dunn DT, Hayes RJ, 1989. Nutritional status and risk for morbidity among young Gambian children allowing for social and environmental factors. Trans. Roy. Soc. Trop. Med. Hyg. 83: 282-87. 8 Deen JL, Walraven GEL, von Seidin L 2002. Increased risk for malaria in chronically malnourished children under 5 years of age in rural Gambia. Journal of Tropical Paediatrics. 48:78-83 9 Bhatia R and Thorne-Lyman AL. Food shortages and nutrition in North Korea. Lancet 2002; 360; Supplement 1;s27-s28. 10 UNICEF 1990. The Nutrition Strategy. New York: UNICEF Programme Division. 11 UNICEF 2002. UNICEF’s Priorities for Children 2002-2005. New York: UNICEF 12 Mosley WH and Chen LC. 1984. An analytical framework for the study of child survival in developing countries. Population and Development Review. 10:25-45 13 Van Norren, B. 1988/89. Combating the infections-malnutrition syndrome: an intermediate-variables model for studying the effects of primary health care interventions. Netherlands Review of Development Studies 2:105-120. 14 Victora CG, Huttly SR, Fuchs SC, Olinto MT. 1997. The role of conceptual frameworks in epidemiological analysis: a hierarchical approach. Int J Epidemiol. 26(1):224-7. 15 UNICEF, 1997. The Care Initiative: Assessment, Analysis and Action to Improve Care or Nutrition. UNICEF, Nutrition Section, New York. 16 Shrimpton, R, Victora, CG, Onis M, Lima, R, Blossner, M, Clugston G, 2001. The worldwide timing of growth faltering: implications for nutritional interventions. Pediatrics 107(5) e75. 17 Central Bureau of Statistics, DPRK. Report on the DPRK Nutrition Assessment. Pyongyang: Central Bureau of Statistics DPRK 2002 (http://www.reliefweb.int/library/documents/2003/unicef-dprk-20feb.pdf). 18 UNICEF. MICS2 Questionnaire. New York: UNICEF. 2002. Available from URL: http://www.childinfo.org. 19 WHO. Measurement and standardisation protocols. WHO Multicentre Reference Growth study. Appendix B. Geneva: World Health Organisation.1999. 20 Department of Technical Cooperation and Development and Statistical Office. Assessing the nutritional status of young children in household surveys: How to weigh and measure children. New York: United Nations. 1986. 21 Division of Nutrition. EPI-INFO6.0d. Atlanta: Center for Disease Control. Available from: URL: http://www.cdc.gov/epiinfo 22 WHO. Physical status: The use and interpretation of anthropometry. WHO Technical Report Series No 854. Geneva: The World Health Organisation. 1995 23 Krasovec K and Anderson MA. Maternal Nutrition and Pregnancy outcomes: Anthropometric Assessment. PAHO Scientific Publication No. 529 In: Part II Prepregnancy weight. Washington: Pan American Health Organisation. 1991 24 WHO. Iron deficiency anaemia: assessment, prevention, control: A guide for programme managers. 1993 WHO/UNICEF/UNU Technical Workshop. Geneva: WHO 2001. 25 Central Bureau of Statistics, DPRK. Report on the DPRK Nutrition Assessment. Pyongyang: Central Bureau of Statistics DPRK 2002 (http://www.reliefweb.int/library/documents/2003/unicef-dprk-20feb.pdf).