Embed Size (px)
Citation preview
Methods
Fungal community analysis by high-throughput sequencing ofamplified markers – a user’s guide
Bj€orn D. Lindahl1, R. Henrik Nilsson2, Leho Tedersoo3, Kessy Abarenkov3, Tor Carlsen4, Rasmus Kjøller5,
Urmas K~oljalg3, Taina Pennanen6, Søren Rosendahl5, Jan Stenlid1 and Havard Kauserud4
1Department of Forest Mycology and Plant Pathology, Swedish University of Agricultural Sciences, Box 7026, SE-750 07, Uppsala, Sweden; 2Department of Biological and Environmental
Sciences, University of Gothenburg, Box 461, SE-405 30, Gothenburg, Sweden; 3Institute of Ecology and Earth Sciences/Natural History Museum, University of Tartu, 46 Vanemuise St.,
51014, Tartu, Estonia; 4Department of Biology, University of Oslo, PO Box 1066, Blindern, N-0316, Oslo, Norway; 5Department of Biology, University of Copenhagen, Øster Farimagsgade
2D, 1353, Copenhagen, Denmark; 6The Finnish Forest Research Institute, PL 18, FI-01301, Vantaa, Finland
Author for correspondence:Bj€orn D. Lindahl
Tel: +46 18 672725
Email: [email protected]
Received: 3 January 2013
Accepted: 18 February 2013
New Phytologist (2013)doi: 10.1111/nph.12243
Key words: 454-pyrosequencing,bioinformatics, barcoding, environmentalsequencing, internal transcribed spacer (ITS)region, PCR.
Summary
� Novel high-throughput sequencing methods outperform earlier approaches in terms of res-
olution and magnitude. They enable identification and relative quantification of community
members and offer new insights into fungal community ecology. These methods are currently
taking over as the primary tool to assess fungal communities of plant-associated endophytes,
pathogens, and mycorrhizal symbionts, as well as free-living saprotrophs.� Taking advantage of the collective experience of six research groups, we here review the
different stages involved in fungal community analysis, from field sampling via laboratory pro-
cedures to bioinformatics and data interpretation. We discuss potential pitfalls, alternatives,
and solutions.� Highlighted topics are challenges involved in: obtaining representative DNA/RNA samples
and replicates that encompass the targeted variation in community composition, selection of
marker regions and primers, options for amplification and multiplexing, handling of sequenc-
ing errors, and taxonomic identification.� Without awareness of methodological biases, limitations of markers, and bioinformatics
challenges, large-scale sequencing projects risk yielding artificial results and misleading
conclusions.
Introduction
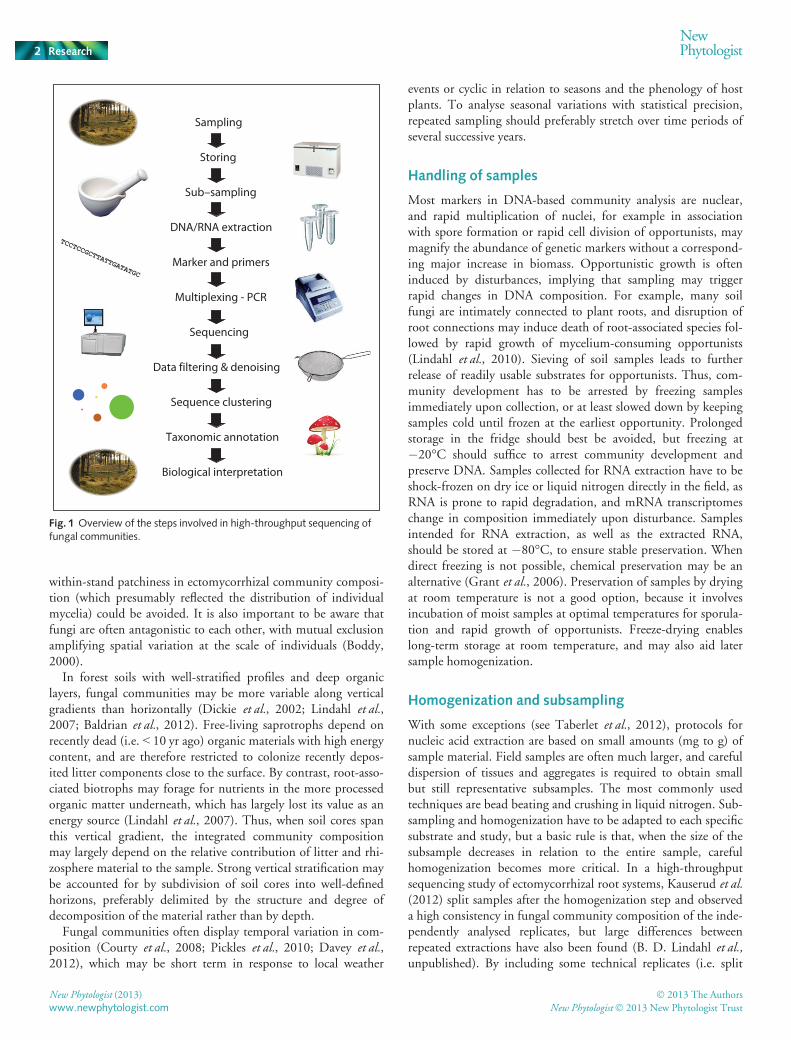
The increasing use of molecular markers to identify fungi andanalyse fungal communities in a phylogenetic context has initi-ated a boom in fungal ecology and phylogenetics. Our under-standing of the important roles of fungi in symbiotic andpathogenic interactions with plants, as well as in transformationof plant litter and nutrient cycling, is thereby rapidly increasing.In particular, high-throughput sequencing methods enabledetailed, semiquantitative analysis of fungal communities in largesample sets and provide ecological information that extends farbeyond that provided by previous methods in terms of detail andmagnitude. The process from field samples to species abundancedata involves a long series of steps, from sampling via laboratoryhandling to bioinformatics treatment (Fig. 1). At each step, thereis a risk of losing and distorting information. Here we present anoverview of the steps involved, highlight potential pitfalls, discussalternatives, and propose solutions.
Sampling
The collecting of field samples to cover the targeted variation andenable statistically robust conclusions at the desired scale of infer-ence represents a major challenge, and optimal strategies concern-ing the number and spatial distribution of samples have beendiscussed extensively (Petersen et al., 2005; Prosser, 2010;Lennon, 2011). Collection of fungal samples calls for some addi-tional consideration, because of the indeterminate growth ofmycelia and the multitude of contrasting morphologies andtrophic strategies that coexist and interact in fungal communities.
Individual mycelia may sometimes reach metres or much morein size (Smith et al., 1992; Douhan et al., 2011), and to avoidspatial autocorrelation as a result of repeated sampling of singleindividuals, it is important to employ a minimum distancebetween samples that exceeds the largest expected size of fungalmycelia. For example, Lilleskov et al. (2004) found that, by keep-ing a minimum distance of 3 m between samples, most of the
� 2013 The Authors
New Phytologist� 2013 New Phytologist TrustNew Phytologist (2013) 1
www.newphytologist.com
Research
within-stand patchiness in ectomycorrhizal community composi-tion (which presumably reflected the distribution of individualmycelia) could be avoided. It is also important to be aware thatfungi are often antagonistic to each other, with mutual exclusionamplifying spatial variation at the scale of individuals (Boddy,2000).
In forest soils with well-stratified profiles and deep organiclayers, fungal communities may be more variable along verticalgradients than horizontally (Dickie et al., 2002; Lindahl et al.,2007; Baldrian et al., 2012). Free-living saprotrophs depend onrecently dead (i.e. < 10 yr ago) organic materials with high energycontent, and are therefore restricted to colonize recently depos-ited litter components close to the surface. By contrast, root-asso-ciated biotrophs may forage for nutrients in the more processedorganic matter underneath, which has largely lost its value as anenergy source (Lindahl et al., 2007). Thus, when soil cores spanthis vertical gradient, the integrated community compositionmay largely depend on the relative contribution of litter and rhi-zosphere material to the sample. Strong vertical stratification maybe accounted for by subdivision of soil cores into well-definedhorizons, preferably delimited by the structure and degree ofdecomposition of the material rather than by depth.
Fungal communities often display temporal variation in com-position (Courty et al., 2008; Pickles et al., 2010; Davey et al.,2012), which may be short term in response to local weather
events or cyclic in relation to seasons and the phenology of hostplants. To analyse seasonal variations with statistical precision,repeated sampling should preferably stretch over time periods ofseveral successive years.
Handling of samples
Most markers in DNA-based community analysis are nuclear,and rapid multiplication of nuclei, for example in associationwith spore formation or rapid cell division of opportunists, maymagnify the abundance of genetic markers without a correspond-ing major increase in biomass. Opportunistic growth is ofteninduced by disturbances, implying that sampling may triggerrapid changes in DNA composition. For example, many soilfungi are intimately connected to plant roots, and disruption ofroot connections may induce death of root-associated species fol-lowed by rapid growth of mycelium-consuming opportunists(Lindahl et al., 2010). Sieving of soil samples leads to furtherrelease of readily usable substrates for opportunists. Thus, com-munity development has to be arrested by freezing samplesimmediately upon collection, or at least slowed down by keepingsamples cold until frozen at the earliest opportunity. Prolongedstorage in the fridge should best be avoided, but freezing at�20°C should suffice to arrest community development andpreserve DNA. Samples collected for RNA extraction have to beshock-frozen on dry ice or liquid nitrogen directly in the field, asRNA is prone to rapid degradation, and mRNA transcriptomeschange in composition immediately upon disturbance. Samplesintended for RNA extraction, as well as the extracted RNA,should be stored at �80°C, to ensure stable preservation. Whendirect freezing is not possible, chemical preservation may be analternative (Grant et al., 2006). Preservation of samples by dryingat room temperature is not a good option, because it involvesincubation of moist samples at optimal temperatures for sporula-tion and rapid growth of opportunists. Freeze-drying enableslong-term storage at room temperature, and may also aid latersample homogenization.
Homogenization and subsampling
With some exceptions (see Taberlet et al., 2012), protocols fornucleic acid extraction are based on small amounts (mg to g) ofsample material. Field samples are often much larger, and carefuldispersion of tissues and aggregates is required to obtain smallbut still representative subsamples. The most commonly usedtechniques are bead beating and crushing in liquid nitrogen. Sub-sampling and homogenization have to be adapted to each specificsubstrate and study, but a basic rule is that, when the size of thesubsample decreases in relation to the entire sample, carefulhomogenization becomes more critical. In a high-throughputsequencing study of ectomycorrhizal root systems, Kauserud et al.(2012) split samples after the homogenization step and observeda high consistency in fungal community composition of the inde-pendently analysed replicates, but large differences betweenrepeated extractions have also been found (B. D. Lindahl et al.,unpublished). By including some technical replicates (i.e. split
Storing
Sub–sampling
DNA/RNA extraction
Marker and primers
TCCTCCGCTTATTGATATGC
Multiplexing - PCR
Sequencing
Data filtering & denoising
Taxonomic annotation
Sampling
Biological interpretation
Sequence clustering
Fig. 1 Overview of the steps involved in high-throughput sequencing offungal communities.
New Phytologist (2013) � 2013 The Authors
New Phytologist� 2013 New Phytologist Trustwww.newphytologist.com
Research
NewPhytologist2
samples), the magnitude of stochastic effects and biases originat-ing during subsampling, extraction, PCR, and sequencing maybe assessed and put in relation to between-sample differences. Ifduplicate subsamples differ much in community composition,extraction protocols should be modified to allow larger samplesizes (e.g. in 50-ml tubes). When many samples are pooled, repli-cation could even be implemented during sampling, so that twocomposite samples are collected and analysed from the same plot,providing information about stochastic variation associated withsampling. Should the sampling-associated noise threaten to over-shadow more subtle treatment effects or ecological correlations,sampling effort would have to be increased.
After homogenization, new spatial structures may easily be cre-ated in the samples, for example by density fractionation at theslightest bumping. Ideally, subsampling should therefore be con-ducted by repeated subdivision rather than by a single ‘grab sam-pling’ (Petersen et al., 2005). When subsamples are small,community composition may be affected by stochastic samplingeffects, as a result of the discrete nature of the sampled nuclei.This issue may be particularly problematic when screening forinfectious propagules, such as resting spores, which may occur atlow densities but still have a major ecological impact, for exampleas plant pathogens.
To ensure that fungal diversity is equally represented for allsamples, DNA should be extracted from equivalent amounts ofstarting material. However, because densities may differ by ordersof magnitude between different substrates, the distinctionbetween volume- and weight-based quantification becomesimportant. For soil samples, determination of mass loss on igni-tion previous to extraction enables extraction from equalamounts of organic matter, which may be more relevant thantotal mass or volume.
Extraction and purification
There are a multitude of methods and ‘ready-to-use’ kits availablefor extraction and purification of nucleic acids from field samplesof different kinds, but they all rely on the same basic processes:(1) mechanical disruption of tissues, (2) solubilization of cellmembranes by detergents under high salt concentrations, in orderto release nucleic acids into solution and prevent electrostaticbinding to contaminants, (3) removal of solid residues, (4) selec-tive binding of nucleic acids to a solid matrix, or selective precipi-tation of nucleic acids and pelleting by centrifugation, (5)washing off of contaminants, and (6) elution/solubilization ofnucleic acids.
Extraction protocols should yield high and uniform amountsof DNA, while the concentration of PCR inhibitors is mini-mized, so that optimal PCR conditions may be achieved. Toavoid biases during sample preparation, the same DNA extrac-tion protocol should ideally be used for all samples (Tedersooet al., 2010a), although the relative efficiency of extraction meth-ods may differ greatly between tissues and soil types (Martin-Laurent et al., 2001). For challenging substrates, such as forestsoils with high humus content, a ‘raw extract’ produced by celldisruption and DNA precipitation may have to be further
purified by binding of DNA to a silica matrix. Some of the prob-lems with purity may be overcome by reducing the amount ofstarting material for DNA extraction. Counterintuitively, dilu-tion of templates may often increase PCR yield as a result ofrelease of inhibition (Wilson, 1997).
Markers and primers
The ideal marker for fungal community studies should: haveprimer sites that are shared by all fungi, be of appropriate lengthfor efficient amplification and sequencing, have high interspecificvariation but low intraspecific variation, and be possible to alignacross all fungi. No known markers meet all these requirements.However, components of the nuclear ribosomal repeat unit(rDNA) are by far the most commonly used genetic markers forphylogenetic and taxonomic identification of microorganisms.The genes for the small subunit (SSU: 16S/18S) and large sub-unit (LSU: 23S/25S/28S) are juxtaposed and (in eukaryotes) sep-arated by the internal transcribed spacer (ITS) region, which istranscribed but spliced away before assembly of the ribosomes.The ITS region is composed of two highly variable spacers, ITS1and ITS2, and the intercalary 5.8S gene. This rDNA operonoccurs in multiple copies in genomes, providing up to 100 timesmore DNA template from the same starting material than for sin-gle-copy genes (Herrera et al., 2009). The rDNA genes are highlyconserved across large groups of organisms, making them idealtargets for general PCR primers that aim to amplify a wide rangeof taxa. However, amplified fragments must also contain enoughvariation to be informative at the phylogenetic level of interest.This is the main reason why the ITS region has been particularlyattractive for mycologists. Because the ITS region does not codefor ribosome components, it is highly variable; with a few excep-tions (Gazis et al., 2011), even closely related species differ insequence. At the same time, intraspecific variation is relativelylow (Schoch et al., 2012). Intragenomic differences in ITSsequences have been detected in a few fungal taxa such asLaetiporus spp. (Lindner & Banik, 2011), but this does not seemto be a widespread phenomenon in Dikarya (D. L. Lindner et al.,unpublished). Using primers located in the adjoining ribosome-encoding genes or in the intercalary 5.8S gene, the ITS regionmay be amplified from a wide range of fungi. The choice ofgenetic marker also has to take the availability of reference data-bases into account, with ITS sequences having by far the best rep-resentation for Dikarya (Begerow et al., 2010). Thus, the ITSregion was recently proposed as the formal barcode for fungi(Schoch et al., 2012). Although useful for species separation, theITS region is too variable to address the phylogeny of higherranks, that is, at the level of families and orders. When aiming toestimate phylogenetic distances across major fungal groups, theLSU provides an attractive alternative, being more conservedthan the ITS and possible to align across distantly related taxa,yet also providing some resolution at lower taxonomic ranks(Porter & Golding, 2012). The more conserved SSU and LSUare widely used for Glomeromycota. In this phylum, single indi-viduals may contain several divergent rDNA sequences (Sanders& Croll, 2010), and we have little knowledge of how the
� 2013 The Authors
New Phytologist� 2013 New Phytologist TrustNew Phytologist (2013)
www.newphytologist.com
NewPhytologist Research 3

sequences obtained from field samples are distributed withinmycelia and species.
In prokaryotes, the small subunit (16S) has been the prime tar-get for phylogenetics and community analysis. Therefore, it mayseem natural to use the corresponding SSU gene for fungi. How-ever, in fungi and other eukaryotes, the SSU is more conservedthan in prokaryotes (see Fig. 1 in Hartmann et al., 2010). Unlessthe focus is restricted to the highest phylogenetic ranks, that is,phyla and orders, the SSU gene provides little phylogenetic infor-mation and species delimitation power for Dikarya (Schochet al., 2012), and is therefore not recommended as a target forspecies-level analysis of fungal communities. In many previousstudies where the SSU was used as the target marker, conclusionswere drawn at the level of species, based on perfect matches withdatabase references but ignoring the fact that identical sequencescould be found in hundreds of other species across entire ordersof fungi. Identical SSU sequences may be shared between sapro-trophs, parasites, and mycorrhizal fungi, because these ecologicalstrategies have evolved repeatedly in relatively small phylogeneticlineages (Hibbett et al., 2000; James et al., 2006; Tedersoo et al.,2010b).
Protein-encoding genes usually occur as single copies in ge-nomes, which may be advantageous for quantitative comparisonof taxon abundances but disadvantageous during amplification.As a consequence of the nonconserved third base, protein-encod-ing genes contain more variation in the form of substitutionscompared with deletions and insertions, enabling alignmentacross phylogenetically distant groups in spite of high variation insequence. Furthermore, coding genes often contain introns withsufficient power for discrimination among species. A disadvan-tage with many protein-coding genes is that they occur in genefamilies where within-genome gene duplications often have takenplace within the same time-frame as speciation, making the iden-tification of gene orthologues problematic (Lindahl & Taylor,2004; B€odeker et al., 2009). In addition, because of the noncon-served third base, it is difficult to design primers that cover allpossible sequence variants, even when highly conserved func-tional domains are targeted.
Extraction of total DNA from environmental substrates mayinclude material from dormant or even dead organisms, as freeDNA may be preserved adsorbed to soil particles (Taberlet et al.,2012). By contrast, RNA has a shorter biological half-life rangingfrom minutes to hours (Kebaara et al., 2006). Transcribed mes-senger RNA (mRNA) which carries coding information of func-tional genes may be analysed to relate activity to specific geneproducts and eco-physiological functions (Kellner et al., 2010).However, because the functional and taxonomic annotation ofgenes is still far from completed and relatively few species are rep-resented by their entire genomes in databases, the ribosomalgenes remain the primary target of fungal community identifica-tion. Ribosomal RNA (rRNA) is quantitatively abundant andeasily extracted from environmental samples (Pennanen et al.,2004), but the low phylogenetic resolution of these codingregions limits their use for species identification. Processing oftranscribed rRNA to form mature ribosomes in eukaryotesincludes splicing of the ITS regions, which is known to take place
within a few minutes after transcription (Ko�s & Tollervey,2010). This short window of time offers a possibility to amplifytaxonomically valuable ITS sequences from newly transcribedRNA, reflecting very recent metabolic activity – even more recentthan that indicated by SSU rRNA (reviewed by Rajala et al.,2011). The transient nature of ITS transcripts in the RNA poolmakes them an attractive target when studying responses offungal communities to short-term environmental fluctuations.
A multitude of primers have been designed and successfullyapplied to amplify fungal rDNA and rRNA from the environ-ment. Most of these primers were originally designed to targetfungi specifically, but turned out to amplify the DNA of othereukaryote lineages as well (e.g. ITS1–ITS5; White et al., 1990).The ITS1F primer (Gardes & Bruns, 1993) discriminates wellagainst plants and has been widely used in analyses of plant-associated fungal communities. Primers such as ITS4B (Gardes& Bruns, 1993) and LB-W (Tedersoo et al., 2008) were designedwith the aim of specifically targeting ectomycorrhizal fungibelonging to Basidiomycota. Hitherto, most primers have beenconstructed with amplification of monospecific samples (e.g.mycorrhizal root tips or pathogen-infected tissues) in mind.Nonbiased amplification of complex communities is morechallenging, and competition for primers means that even singlemismatches between primer and template impede or strongly biasamplification (Ihrmark et al., 2012). With the possible exceptionof the primers LR3/TW13 and LR5/TW14, which target highlyconserved sites within the LSU, all fungus-specific and ‘universal’primers inadvertently discriminate against specific fungal taxa(Bellemain et al., 2010). Thus, the choice of primer has a signifi-cant impact on how fungal communities are translated intoamplicon communities. When the goal is to retrieve as manydifferent fungi as possible, we recommend the use of primercombinations and primers with degenerate positions (i.e. mix-tures of many different primers; e.g. Ihrmark et al., 2012; Tojuet al., 2012). If primers with low specificity are used, nonfungalsequences may be removed at a later stage of the analysis. Itshould be noted, however, that when degenerate primers are usedwith high cycle numbers, depletion of specific primers in the mix-tures may bias amplification in favour of species that matchother, less depleted primers (Polz & Cavanaugh, 1998).
The length of the amplified fragments is a critical parameterthat has to be considered when primers are chosen. Longer frag-ments contain more information for phylogenetic analyses. How-ever, when aiming for minimized amplification biases, amplifiedfragments should be kept short, as increasing length of the targetamplicon has a significant negative effect on assessments ofmicrobial richness and biases community composition (Huberet al., 2009; Engelbrektson et al., 2010). With longer stretches ofconserved sequence in the amplicons, the incidence of chimericsequences also increases (Fonseca et al., 2012). By using primersites in the 5.8S gene, amplification may be restricted to eitherthe ITS1 or the ITS2 region only. Ihrmark et al. (2012) used newprimers in the 5.8S gene to amplify 250–400-bp fragments con-taining the ITS2 region and found that diversity and communitycomposition were much better preserved than when the entireITS region was amplified. Additional primers with a similar
New Phytologist (2013) � 2013 The Authors
New Phytologist� 2013 New Phytologist Trustwww.newphytologist.com
Research
NewPhytologist4

purpose were designed by Toju et al. (2012). ITS1 and ITS2share many properties, and similar results can be obtained withthe two markers (Mello et al., 2011; Bazzicalupo et al., 2012).However, ITS2 is generally less variable in length compared withITS1 and lacks the problem of co-amplification of a 5′ SSUintron that is common in many ascomycetes. The ITS2 has alsorelatively conserved secondary structure among eukaryotes, whichpotentially enables higher level phylogenetic comparisons and theuse of ITS2 as a universal barcode across eukaryotic kingdoms(Coleman, 2009; Koetschan et al., 2010). Furthermore, ITS2 issomewhat better represented than ITS1 in databases (Nilssonet al., 2009).
With respect to Glomeromycota and other non-Dikarya lin-eages, it is more problematic to recommend primers, as we stilllack information on the diversity in many groups. For Glomer-omycota, a combination of taxonomically inclusive primers fornested PCR, involving the partial SSU, ITS, and partial LSU,has been elaborated (Kr€uger et al., 2009). Alternatively, a vari-able region of the SSU is amplified with the primers NS31-AM1, and the variable D2 region of the LSU is amplified withthe primer FLR3 (aka glo454) in combination with either FLR4or NDL22 (aka TW13) (van Tuinen et al., 1998; Gollotte et al.,2004; Lee et al., 2008; €Opik et al., 2009; Lekberg et al., 2012).Recently, other primers or primer combinations have beensuggested (Lee et al., 2008; Stockinger et al., 2010), which alsotarget regions in the SSU and LSU. The SSU has also been suc-cessfully used as a marker for Chytridiomycota (Freeman et al.,2009).
Multiplexing
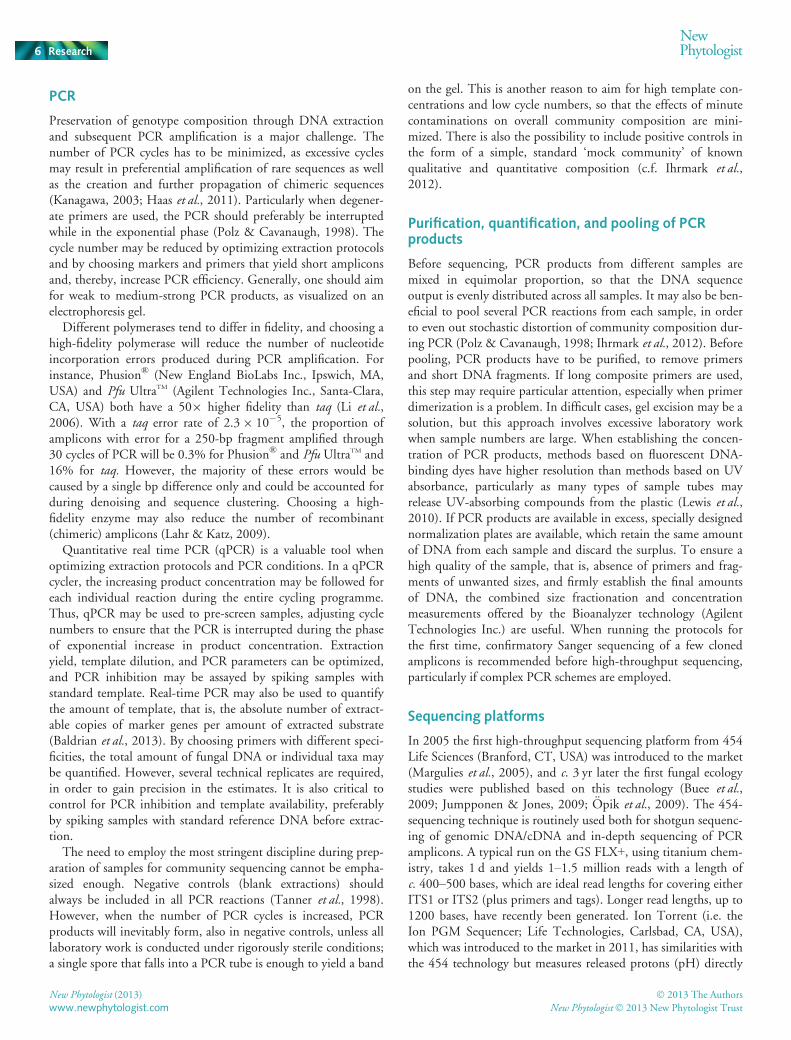
To make optimal use of high-throughput sequencing technolo-gies, tagged amplicons from several samples may be mixed andsequenced in a single run. Sequences are then assigned to samplesbased on short sequence tags (i.e. molecular identifiers – MIDs),which are unique to each sample. In addition, most high-throughput sequencing methods require that amplicons are fittedwith specific adaptor sequences. The adaptor sequences, as well asthe tags, can be incorporated into the PCR primers, but they mayalso be added by ligation to the PCR products. Three options areavailable (Table 1).(1) Both adaptors and sample tags are included in the PCRprimers (Jumpponen & Jones, 2009). This method enables direc-tional sequencing, which is beneficial if the fragments are toolong to be sequenced throughout their entire length. However, in
some labs such long primer constructs (> 45 bp) has proved toimpair PCR efficiency and to cause problems with primer dimer-ization (Wallander et al., 2010). Such problems may be amelio-rated by a nested PCR approach, where ordinary primers areused during most of the PCR and the extended primers are addedduring the last few cycles (Kauserud et al., 2012), but such com-plicated PCR schemes may increase the risk of contaminationand distortion of relative abundances.(2) Sample tags are included in the PCR primer but adaptors areadded to the PCR product by ligation (Ihrmark et al., 2012).This method reduces the length of primers to < 30 bp, and PCRmay be conducted using standard programmes. With adaptorsadded by ligation, amplicons will be sequenced in random orien-tation. This may cause problems for long amplicons, wheresequences from different ends may have no or only partial over-lap. Nondirectional sequencing also implies that half of thesequences have to be reversed before further analysis. Further-more, the 5′-end nucleotides of the tags may interfere with liga-tion, so that certain samples are favoured in the final mix(Ihrmark et al., 2012). This problem may be overcome by fittingall sample tags with the same 5′-end nucleotide or by addingmore PCR product from certain samples.(3) Both adaptors and sample tags are ligated onto PCR prod-ucts. Here, the same standard primers may be used for all sam-ples, but PCR products from different samples have to be keptseparated through ligation. When many samples are analysed,this method increases work-load and costs considerably.
Berry et al. (2011) found indications that tag-extended prim-ers may introduce biases in community composition andadvised that tagged primers are added during the last PCRcycles. However, in later tests of different tags on artificiallyassembled communities (Ihrmark et al., 2012), tag-related biaseswere marginal. It is, however, important that the two nucleo-tides at the 3′ end of the tag do not match with correspondingnucleotides in the target priming site, which would allow thetag to act as an extension of the primer, potentially causingpositive amplification bias. Switching of sample tags after pool-ing of separately amplified PCR products may have an impacton sequencing results and lead to numerous false positives as aresult of cross-contamination (Carlsen et al., 2012). To be ablecontrol for this phenomenon, amplicons may be tagged at bothends. In order to minimize the risk of misidentification ofsequence tags, it is also important that all tags differ from eachother by at least two nucleotides (Parameswaran et al., 2007;Faircloth & Glenn, 2012).
Table 1 Different options for the addition ofsample tags and sequencing adapters to PCRproducts
1 Primers ADAPTOR - TAG - PRIMER PRIMER - TAG - ADAPTORPCR ADAPTOR - TAG - PRIMER ----------------- PRIMER - TAG - ADAPTOR
2 Primers TAG - PRIMER PRIMER - TAGPRC TAG - PRIMER ----------------- PRIMER - TAGLigation ADAPTOR - TAG - PRIMER ----------------- PRIMER - TAG - ADAPTOR
3 Primers PRIMER PRIMERPCR PRIMER ----------------- PRIMERLigation ADAPTOR - TAG - PRIMER ----------------- PRIMER - TAG - ADAPTOR
� 2013 The Authors
New Phytologist� 2013 New Phytologist TrustNew Phytologist (2013)
www.newphytologist.com
NewPhytologist Research 5
PCR
Preservation of genotype composition through DNA extractionand subsequent PCR amplification is a major challenge. Thenumber of PCR cycles has to be minimized, as excessive cyclesmay result in preferential amplification of rare sequences as wellas the creation and further propagation of chimeric sequences(Kanagawa, 2003; Haas et al., 2011). Particularly when degener-ate primers are used, the PCR should preferably be interruptedwhile in the exponential phase (Polz & Cavanaugh, 1998). Thecycle number may be reduced by optimizing extraction protocolsand by choosing markers and primers that yield short ampliconsand, thereby, increase PCR efficiency. Generally, one should aimfor weak to medium-strong PCR products, as visualized on anelectrophoresis gel.
Different polymerases tend to differ in fidelity, and choosing ahigh-fidelity polymerase will reduce the number of nucleotideincorporation errors produced during PCR amplification. Forinstance, Phusion® (New England BioLabs Inc., Ipswich, MA,USA) and Pfu UltraTM (Agilent Technologies Inc., Santa-Clara,CA, USA) both have a 509 higher fidelity than taq (Li et al.,2006). With a taq error rate of 2.39 10�5, the proportion ofamplicons with error for a 250-bp fragment amplified through30 cycles of PCR will be 0.3% for Phusion® and Pfu UltraTM and16% for taq. However, the majority of these errors would becaused by a single bp difference only and could be accounted forduring denoising and sequence clustering. Choosing a high-fidelity enzyme may also reduce the number of recombinant(chimeric) amplicons (Lahr & Katz, 2009).
Quantitative real time PCR (qPCR) is a valuable tool whenoptimizing extraction protocols and PCR conditions. In a qPCRcycler, the increasing product concentration may be followed foreach individual reaction during the entire cycling programme.Thus, qPCR may be used to pre-screen samples, adjusting cyclenumbers to ensure that the PCR is interrupted during the phaseof exponential increase in product concentration. Extractionyield, template dilution, and PCR parameters can be optimized,and PCR inhibition may be assayed by spiking samples withstandard template. Real-time PCR may also be used to quantifythe amount of template, that is, the absolute number of extract-able copies of marker genes per amount of extracted substrate(Baldrian et al., 2013). By choosing primers with different speci-ficities, the total amount of fungal DNA or individual taxa maybe quantified. However, several technical replicates are required,in order to gain precision in the estimates. It is also critical tocontrol for PCR inhibition and template availability, preferablyby spiking samples with standard reference DNA before extrac-tion.
The need to employ the most stringent discipline during prep-aration of samples for community sequencing cannot be empha-sized enough. Negative controls (blank extractions) shouldalways be included in all PCR reactions (Tanner et al., 1998).However, when the number of PCR cycles is increased, PCRproducts will inevitably form, also in negative controls, unless alllaboratory work is conducted under rigorously sterile conditions;a single spore that falls into a PCR tube is enough to yield a band
on the gel. This is another reason to aim for high template con-centrations and low cycle numbers, so that the effects of minutecontaminations on overall community composition are mini-mized. There is also the possibility to include positive controls inthe form of a simple, standard ‘mock community’ of knownqualitative and quantitative composition (c.f. Ihrmark et al.,2012).
Purification, quantification, and pooling of PCRproducts
Before sequencing, PCR products from different samples aremixed in equimolar proportion, so that the DNA sequenceoutput is evenly distributed across all samples. It may also be ben-eficial to pool several PCR reactions from each sample, in orderto even out stochastic distortion of community composition dur-ing PCR (Polz & Cavanaugh, 1998; Ihrmark et al., 2012). Beforepooling, PCR products have to be purified, to remove primersand short DNA fragments. If long composite primers are used,this step may require particular attention, especially when primerdimerization is a problem. In difficult cases, gel excision may be asolution, but this approach involves excessive laboratory workwhen sample numbers are large. When establishing the concen-tration of PCR products, methods based on fluorescent DNA-binding dyes have higher resolution than methods based on UVabsorbance, particularly as many types of sample tubes mayrelease UV-absorbing compounds from the plastic (Lewis et al.,2010). If PCR products are available in excess, specially designednormalization plates are available, which retain the same amountof DNA from each sample and discard the surplus. To ensure ahigh quality of the sample, that is, absence of primers and frag-ments of unwanted sizes, and firmly establish the final amountsof DNA, the combined size fractionation and concentrationmeasurements offered by the Bioanalyzer technology (AgilentTechnologies Inc.) are useful. When running the protocols forthe first time, confirmatory Sanger sequencing of a few clonedamplicons is recommended before high-throughput sequencing,particularly if complex PCR schemes are employed.
Sequencing platforms
In 2005 the first high-throughput sequencing platform from 454Life Sciences (Branford, CT, USA) was introduced to the market(Margulies et al., 2005), and c. 3 yr later the first fungal ecologystudies were published based on this technology (Buee et al.,2009; Jumpponen & Jones, 2009; €Opik et al., 2009). The 454-sequencing technique is routinely used both for shotgun sequenc-ing of genomic DNA/cDNA and in-depth sequencing of PCRamplicons. A typical run on the GS FLX+, using titanium chem-istry, takes 1 d and yields 1–1.5 million reads with a length ofc. 400–500 bases, which are ideal read lengths for covering eitherITS1 or ITS2 (plus primers and tags). Longer read lengths, up to1200 bases, have recently been generated. Ion Torrent (i.e. theIon PGM Sequencer; Life Technologies, Carlsbad, CA, USA),which was introduced to the market in 2011, has similarities withthe 454 technology but measures released protons (pH) directly
New Phytologist (2013) � 2013 The Authors
New Phytologist� 2013 New Phytologist Trustwww.newphytologist.com
Research
NewPhytologist6

rather than light. The major advantages of Ion Torrent are itsshort run-time (c. 2 h), high yields, and a competitive price com-pared with 454-sequencing. According to the manufacturer, thenew Ion Proton Sequencer may generate 60–80 million 200-basereads (with the Proton I chip). The shorter read lengths havehitherto made Ion Torrent unsuitable for the analysis of the ITSregion, but up to 400-bp sequences have recently been generated.Illumina sequencing (Illumina Inc., San Diego, CA, USA) iscurrently the most successful and most widely adopted next-generation sequencing platform, but has hitherto not beenadopted for analysis of fungal communities because of limitedread lengths. However, according to the manufacturer, paired-end sequences on the MiSeq platform now enable 29 250-baseread lengths and a yield of c. 30 million reads. The sequencingplatform SOLiD (Life Technologies) also results in a high num-ber (up to 4.8 billion) of short reads. As a consequence of theirreduced costs and tremendous yields, both Ion Torrent and Illu-mina MiSeq will obviously challenge the Roche 454 technology.So-called ‘third-generation sequencing platforms’ are based onsingle-molecule and real-time sequencing, with the first platform,PacBio RS, introduced in 2011 by Pacific Biosciences (MenloPark, CA, USA). Read lengths may be up to several kb but thesequence quality and output are still too low for diversity analysesbased on amplified markers. However, by sequencing the tem-plate several times (circular consensus sequencing), reads of highquality may be produced. Other upcoming techniques that willprobably have a substantial impact on the field are based on regis-tering the DNA (or RNA) as it goes through nanopores placed inartificial membranes. For comprehensive reviews of current andfuture sequencing technologies, see Glenn (2011) and Shokrallaet al. (2012). Further up-to-date news on this rapidly developingtopic may be found at http://seqanswers.com.
Bioinformatics analysis
As PCR errors become visible when sequences are based on singlemolecules of PCR product, and high-throughput methods alsogenerate frequent errors during the sequencing procedure, datasets derived by high-throughput sequencing must be subjected toextensive quality control measures (Kunin et al., 2010). The samedata set analysed using only read-score-based filtering versus moreadvanced filtering methods may differ around five-fold in thenumber of derived operative taxonomic units (OTUs; Quinceet al., 2009). ITS sequences seem to be particularly prone to 454-sequencing errors, presumably because of the high incidence ofhomopolymers, that is, repetitions of a single nucleotide, whichare a major source of error in 454-sequencing (Balzer et al.,2011).
The read-score-based base-pair pruning applied by thesequencing factory is at best a poor replacement for sequencequality management programs such as AMPLICONNOISE (Quinceet al., 2011), the Denoiser implemented in QIIME (Reeder &Knight, 2010), DADA (Rosen et al., 2012) and ACACIA (Bragget al., 2012), which are all tailored for high-throughput sequenc-ing data. AMPLICONNOISE also supports detection of sequencechimeras, whose presence otherwise would inflate diversity
estimates significantly (Fonseca et al., 2012). 454-sequencingdata sets may contain a nontrivial number of sequences that rep-resent primer dimers, seemingly random sequence data, or genesegments other than the one targeted (Balzer et al., 2011). It mayhappen, as in the study by Wallander et al. (2010), that as muchas 95% of 454-sequencing reads have to be excluded because ofquality-related issues, but 20–40% is a more common figure.Whether or not a sequence represents the ITS region can beestablished using ITSx (http://microbiology.se/software/itsx/),which uses hidden Markov models and the HMMER package(Eddy, 2011) to detect the flanking SSU, 5.8S and LSU genes.The ITS1 and ITS2 as well as the full ITS region can then beextracted automatically from the sequence data set depending onwhich genes were detected. A similar tool for the SSU wasreleased by Bengtsson et al. (2011). Diversity estimates alsodepend on the amount of sequences derived from samples, andone way to reduce bias associated with different numbers of readsin the different samples is to randomly subsample all samplesdown to the size of the smallest sample (Gihring et al., 2012).
Establishment of sequence similarities requires alignment ofsequences. When global alignments are possible, as is the case forless variable markers, such as the LSU and SSU, data may beentered into commonly used pipelines developed for generalmicrobial ecology, such as MOTHUR (Schloss et al., 2009). Globalalignment also enables analysis of the phylogenetic distancebetween communities, using tools such as UniFrac (Hamadyet al., 2010), in which the difference between communitiesdepends not only on which members are included, but also onhow closely related they are. However, for the ITS region, meth-ods based on global alignments are impractical, because of highvariability in sequence and length, and clustering of ITSsequences usually has to depend on pairwise alignments. Pairwisealignments require major computational capacities, and severalavailable bioinformatics pipelines specially developed for process-ing of fungal ITS data sets derived by 454-sequencing, includingCLOTU (Kumar et al., 2011), SCATA (http://scata.mykopat.slu.se),and PLUTOF (Abarenkov et al., 2010a), run as web-based tools onhigh-capacity computer clusters.
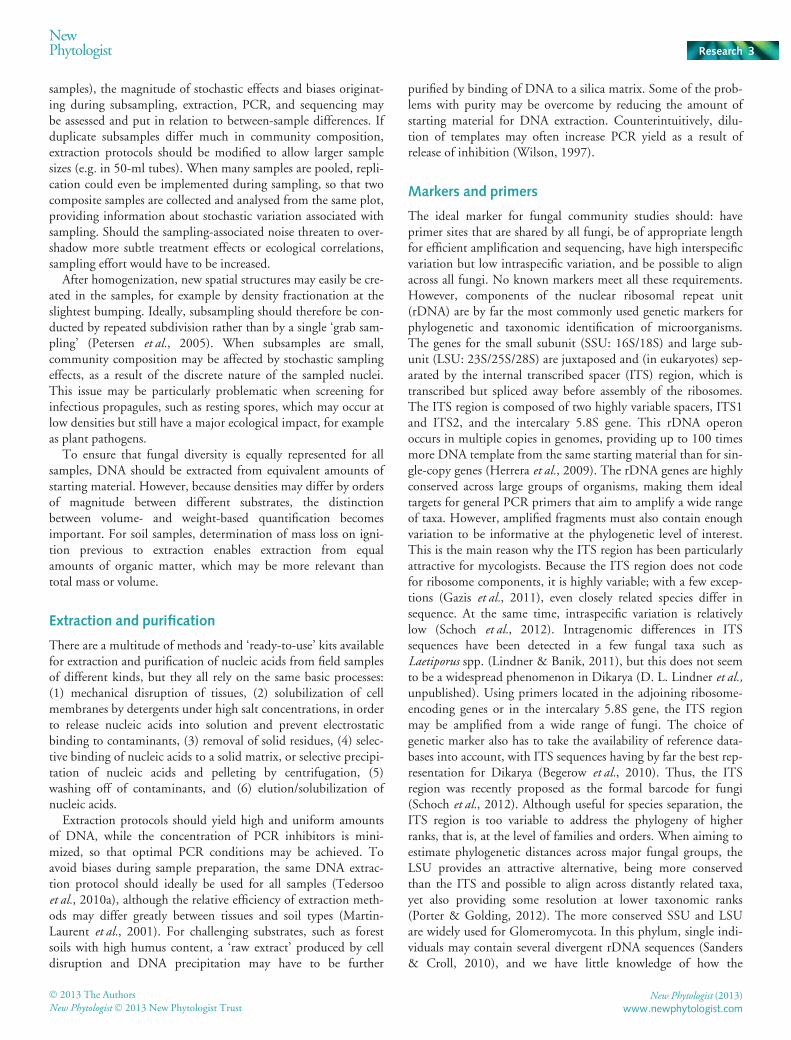
During clustering, sequences sharing a predefined level of simi-larity are assembled into OTUs. Complete-linkage clustering(furthest neighbour) yields OTUs that can be thought of as circu-lar; with a 97% similarity threshold, all sequences within a clusterwill be at most 3% different from each other. With single-linkageclustering (nearest neighbour), a 97% similarity threshold meansthat it is enough that a sequence is at most 3% different from anyother sequence in the OTU to be included in that OTU, andOTUs tend to be amoeboid rather than circular (Fig. 2).BLASTCLUST (ftp://ftp.ncbi.nih.gov/blast/) is an example of asingle-linkage clustering program, and CLOTU, SCATA, PLUTOF,and MOTHUR all feature single-linkage clustering. Complete-link-age algorithms (e.g. UCLUST; Edgar, 2010) are sensitive to thechoice of seed sequences, which typically relies on sequencefrequencies or length. This is not a concern for single-linkageclustering, which is deterministic, that is, the same OTUs arearrived at irrespective of seed sequence. The ‘greedy clustering’ ofsingle-linkage methods, where clusters expand until there are no
� 2013 The Authors
New Phytologist� 2013 New Phytologist TrustNew Phytologist (2013)
www.newphytologist.com
NewPhytologist Research 7

similar sequences left to enter, makes them efficient in the han-dling of sequencing errors (Huse et al., 2010), and single-linkageclustering may to some extent replace more computationallyintensive quality management programs. However, single-linkageclustering requires that OTUs are phylogenetically well separatedfrom their neighbours, or there is a major risk that they mergeinto large clusters (a ‘snowballing effect’). Furthermore, it isimportant to consider that local alignments over subsections ofsequences usually lead to higher pairwise similarities than globalalignments, and local alignments with a low match-length thresh-old may yield overly large clusters.
An alternative to pairwise comparisons, which may be attrac-tive when computational capacity is limited, is to compare sam-ple sequences to a set of identified reference sequences, forexample, with MAFFT (Katoh & Frith, 2012) or QIIME (Caporasoet al., 2010; https://github.com/qiime/its-reference-otus). Thismethod is best suited for inventories of well-described taxa, buthas obvious limitations when exploring less charted parts of thefungal kingdom.
An increasing number of clustering programs apply other simi-larity measures than absolute distances, relying on, for example,the grammatical structure of the sequence data (notably GRAM-
CLUSTER by Russell et al. (2010), CROP by Hao et al. (2011), andCRUNCHCLUST by Hartmann et al. (2012)).
CRUNCHCLUST, CLOTU, and SCATA are notable in offering apyrosequencing homopolymer collapse option, where OTUs can-not be delimited based on differences in homopolymer regionsalone. Furthermore, both CLOTU and SCATA allow easy checkingfor noncompatible tag combinations when tags are fitted at bothends of amplicons. Sequence clustering produces the best resultswhen sequences of comparable coverage are employed, and theuser should consider running tools, such as ITSx (http://microbiology.se/software/itsx/) or V-XTRACTOR (Hartmann et al.,2010; Kerekes et al., 2013) for SSU and LSU, to ensure that thequery sequences are at least roughly comparable in terms of cov-erage of the target region.
To assign taxonomic affiliations to the sequences obtained is amajor challenge, and projects should be planned both with ampletime for data analysis in mind and in such a way that bioinfor-matics and taxonomic expertise is accounted for among the pro-ject members. Following the sequence clustering step, the derivedOTUs are typically examined for taxonomic affiliation through
BLAST-based similarity searches in the INSD or UNITE(Abarenkov et al., 2010b) databases or, for LSU sequences,through a Bayesian classifier (Liu et al., 2012). We recommendthe use of the most common sequence in each OTU as a basis fortaxonomic examination (less favoured options include the longestsequence in each OTU or the consensus sequence). The INSDsequence corpus is in part compromised by the presence of incor-rectly annotated, chimeric, or otherwise substandard entries, andthe user is well advised to use the UNITE (ITS; Abarenkov et al.,2010b; Tedersoo et al., 2011), SILVA (SSU; Pruesse et al., 2007)or MaarjAM (SSU; Glomeromycota; €Opik et al., 2010) databasesinstead. UNITE maintains a downloadable copy of the fungalITS sequences in INSD (http://unite.ut.ee/repository.php), andthis copy is subject to third-party annotation and other qualitymanagement measures. More than 75 000 INSD sequences havebeen annotated, including the exclusion of c. 1000 chimericentries and the taxonomic annotation and re-annotation of13 500 entries, and for local similarity searches, this data set ismuch to be preferred over a raw dump of the INSD.
Complications associated with the taxonomic affiliation ofsequences based on BLAST searches are discussed in Christen(2008) and Kang et al. (2010). Although dependent on settings,BLAST searches tend to favour long sequence, and the presenceof conserved sequence segments in the query sequence, and any-one analysing high-throughput derived ITS sequences may wantto prune any large parts of the SSU, LSU, and possibly also the5.8S from their ITS sequences before doing similarity searches. Itshould be recognized that proper sequence-based identificationinvolves delimitation of taxa and requires understanding of fun-damental phylogenetics as well as a basic taxonomic overview ofthe fungal kingdom (Nilsson et al., 2008). There are countlessexamples of how blind reliance on best BLAST hits for identifica-tion may lead in totally wrong directions. The construction of a‘rough’ phylogenetic tree, based on a crude alignment andneighbour joining of sample and reference sequences, may aidunderstanding of the material in a phylo-taxonomic context. Fora schematic overview of the phylogenetic composition and diver-sity across samples, BLAST results can be imported and viewedin the program MEGAN (Huson et al., 2011). Based on the consis-tency of the top BLAST matches, the sequences will be mappedat different levels in a predefined taxonomy (e.g. the GenBanktaxonomy). The SCATA pipeline approaches OTU identificationin a different way, with database references and sample sequencesclustered together. The reference sequences included in eachOTU are listed in the data output, allowing assignment of taxo-nomic identities.
Another alternative to BLAST for taxonomic assignment isprovided by the na€ıve Bayesian classifier method (Liu et al.,2012) implemented in the ribosomal database project (Wanget al., 2007). Starting from a large training set of well-annotatedreference sequences, the Bayesian classifier attempts to assignquery sequence to the various taxonomic levels offered by the ref-erence sequences. It computes a bootstrap value for each assign-ment, thus providing a rough measure of confidence of theassignment at each level. Its accuracy is comparable to, or some-what better than, that of BLAST, and it is substantially faster
(b)(a)
Fig. 2 Illustration of (a) single-linkage clustering and (b) complete-linkageclustering of the same objects in a two-dimensional space. Arrowsindicate the clustering threshold distance. With the same clusteringthreshold distance, single-linkage clustering yields fewer clusters and fewersingletons.
New Phytologist (2013) � 2013 The Authors
New Phytologist� 2013 New Phytologist Trustwww.newphytologist.com
Research
NewPhytologist8

than the latter. A potential downside of the LSU classifier is thelimited number (and taxonomic scope) of the public fungal LSUsequences. However, given the more conserved nature of theLSU compared with the ITS region, LSU sequences from previ-ously unsequenced lineages are typically still assignable to highertaxonomic ranks such as order or class, which is not always thecase with ITS sequences.
Finally, it is important that data are stored in a publicly acces-sible way, and that the bioinformatics handling of data is prop-erly accounted for in publications (Nilsson et al., 2011). Anextensive list of bioinformatics resources can be found in Biket al. (2012).
Data interpretation
In spite of denoising and the use of ‘greedy’ clustering algorithms,high-throughput data sets usually contain a large number of sin-gletons (unique sequences present only once in the data set) thatdeviate to varying degrees from the original template. As sucherroneous singletons inflate diversity, a common practicehas been to remove them before downstream statistical analyses(Tedersoo et al., 2010a), but of course many singletons may rep-resent authentic, rare taxa (Kauserud et al., 2012). The abun-dance of artificial singletons in high-throughput data sets makesestimates of total sample diversity by endpoint extrapolation ofrarefaction curves risky. As the incidence of erroneous singletonsincreases with sequencing effort, species accumulation curvestend to increase infinitely (Quince et al., 2009). This implies thatthe relevance of diversity estimators, such as Jackknife and Chaoindices, which rely on the abundance of singletons and double-tons relative to more common OTUs, may be questioned forhigh-throughput sequencing data (Dickie, 2010). It remainsuncertain to what extent this problem can be ameliorated byproper bioinformatics procedures.
The reliability of OTUs with a low number of sequences mayalso be questioned, and a conservative approach has been toremove all clusters with less than, for example, five reads. How-ever, the appropriate cut-off level for removing ‘low-frequencyclusters’ depends on the total number of sequences per sampleand the clustering parameter settings. If the primary aim of stud-ies is to investigate community–environment relationships oreffects of experimental treatments rather than estimating alphadiversity or screening for rare taxa, it has been found that pruningof rare OTUs has a marginal effect on subsequent multivariatestatistical analyses (Gobet et al., 2010). By contrast, particularattention has to be paid to the validity of rare OTUs when dataare analysed based on presence/absence. As false positives mayoccur as a result of tag switching (Carlsen et al., 2012), and eventhe slightest cross-contamination may have a major impact, werecommend pruning of OTUs with low numbers of sequences.Such pruning should preferably be carried out on a per-samplebasis, as an OTU that is common in one sample may occur as alow-abundant contaminant in other samples.
To what degree high-throughput sequencing data can be usedquantitatively is much debated (Amend et al., 2010; Baldrianet al., 2013). When interpreting community analyses based on
molecular markers, it is important to remember that abundanceof genetic markers in extracts does not reflect biomass in the sam-ples. Amplification of an artificial community assembled fromPCR products showed that community structure may be fairlywell conserved through PCR and 454-sequencing, provided thatthe amplicons are short and primers match with all species in thecommunity (Ihrmark et al., 2012). By contrast, the quantitativecomposition of an artificially assembled spore community wasnot well reflected by 454-sequencing in the study of Amend et al.(2010), suggesting that diverging numbers of rDNA repeats indifferent species in combination with differences in extractabilitymay lead to severe quantitative biases. Furthermore, accuratequantification of genomes in a sample does not suffice to describetaxonomic biomass distribution; species with long, filamentouscells are likely to be underrepresented, whereas fungi with yeast-like growth and/or small cells may be overrepresented, because oftheir high nucleus to biomass ratio.
Concluding remarks
New high-throughput methods outperform earlier approaches interms of resolution and magnitude and offer unprecedentedinsights into fungal community ecology. However, withoutawareness of methodological biases, limitations of markers orbioinformatics challenges, large-scale sequencing risks yieldingartificial results and misleading conclusions. Thus, early claims ofastonishingly high species richness in 454-sequenced ampliconswere exaggerated, because of problems in distinguishing technicalartefacts from true diversity. Although more sophisticatedbioinformatics tools are now available, high-throughput assess-ment of species richness remains a major technical challenge.Furthermore, considering that even a species represented by a sin-gle spore would be recorded in a sufficiently deeply sequencedsample, the biological relevance of such assessments may be ques-tioned. Absolute analyses of species presence and diversity are alsosensitive to contaminations during sampling, laboratory process-ing and sequencing. We argue that the major benefit ofhigh-throughput methods rather lies in the capacity to provideinformation about the main fungal colonizers in large numbersof samples, to a progressively decreasing cost in terms of moneyand laboratory labour. In the near future, automated processingof samples may increase the scope and statistical power of ecolog-ical studies even further. In addition, novel sequencing tech-niques continually increase data output, which in combinationwith rapidly expanding databases of entire genomes enables adevelopment away from molecular markers and PCR amplifica-tion towards direct analysis of meta-genomes and meta-tran-scriptomes of complex fungal communities (Kuske & Lindahl,2013).
Acknowledgements
This article was written within the framework of the collabora-tion networks ‘Fungi in Boreal Forest Soils’, funded by Nord-Forsk, and ‘NEFOM’, funded by the European Forest Institute.Additional funding from the Swedish Research Council
� 2013 The Authors
New Phytologist� 2013 New Phytologist TrustNew Phytologist (2013)
www.newphytologist.com
NewPhytologist Research 9

FORMAS to B.D.L. and R.H.N. is acknowledged. The authorsare grateful to Martin Bidartondo and three anonymous review-ers for advice and comments.
References
Abarenkov K, Nilsson RH, Larsson K-H, Alexander IJ, Eberhardt U, Erland S,
Hoiland K, Kjøller R, Larsson E, Pennanen T et al. 2010b. The UNITE
database for molecular identification of fungi – recent updates and future
perspectives. New Phytologist 186: 281–285.Abarenkov K, Tedersoo L, Nilsson RH, Vellak K, Saar I, Veldre V, Parmasto E,
Prous M, Aan A, Ots M et al. 2010a. PlutoF – a web based workbench forecological and taxonomic research, with an online implementation for fungal
ITS sequences. Evolutionary Bioinformatics 6: 189–196.Amend AS, Seifert KA, Bruns TD. 2010.Quantifying microbial communities
with 454 pyrosequencing: does read abundance count?Molecular Ecology 19:5555–5565.
Baldrian P, Kolarik M, Stursova M, Kopecky J, Valaskova V, Vetrovsky T,
Zifcakova L, Snajdr J, Ridl J, Vlcek C et al. 2012. Active and total microbial
communities in forest soil are largely different and highly stratified during
decomposition. The ISME Journal 6: 248–258.Baldrian P, V�etrovsk�y T, Cajthaml T, Dobi�a�sov�a P, Petr�ankov�a M, �Snajdr J,
Eichlerov�a I. 2013. Estimation of fungal biomass in forest litter and soil.
Fungal Ecology 6: 1–11.Balzer S, Malde K, Jonassen I. 2011. Systematic exploration of error sources in
pyrosequencing flowgram data. Bioinformatics 27: i304–i309.Bazzicalupo AL, B�alint M, Schmitt I. 2013. Comparison of ITS1 and ITS2
rDNA in 454 sequencing of hyperdiverse fungal communities. Fungal Ecology6: 102–109.
Begerow D, Nilsson H, Unterseher M, Maier W. 2010. Current state and
perspectives of fungal DNA barcoding and rapid identification procedures.
Applied Microbiology and Biotechnology 87: 99–108.Bellemain E, Carlsen T, Brochmann C, Coissac E, Taberlet P, Kauserud H.
2010. ITS as an environmental DNA barcode for fungi: an in silico approach
reveals potential PCR biases. BMC Microbiology 10: 189.Bengtsson J, Eriksson KM, Hartmann M, Wang Z, Shenoy BD, Grelet GA,
Abarenkov K, Petri A, Rosenblad MA, Nilsson RH. 2011.Metaxa: a software
tool for automated detection and discrimination among ribosomal small
subunit (12S/16S/18S) sequences of archaea, bacteria, eukaryotes,
mitochondria, and chloroplasts in metagenomes and environmental sequencing
datasets. Antonie van Leeuwenhoek 100: 471–475.Berry D, Ben-Mahfoudh K, Wagner M, Loy A. 2011. Barcoded primers used in
multiplex amplicon pyrosequencing bias amplification. Applied andEnvironmental Microbiology 77: 7846–7849.
Bik HM, Porazinska DL, Creer S, Caporaso JG, Knight R, Thomas WK. 2012.
Sequencing our way towards understanding global eukaryotic biodiversity.
Trends in Ecology and Evolution 27: 233–243.Boddy L. 2000. Interspecific combative interactions between wood-decaying
basidiomycetes. FEMS Microbiology Ecology 31: 185–194.B€odeker ITM, Nygren CMR, Taylor AFS, Olson�A, Lindahl BD. 2009. ClassII
peroxidase encoding genes are present in a wide phylogenetic range of
ectomycorrhizal fungi. The ISME Journal 3: 1387–1395.Bragg L, Stone G, Imelfort M, Hugenholtz P, Tyson GW. 2012. Fast, accurate
error-correction of amplicon pyrosequences using Acacia. Nature Methods 9:425–426.
Buee M, Reich M, Murat C, Morin E, Nilsson RH, Uroz S, Martin F. 2009.
454 pyrosequencing analyses of forest soils reveal an unexpectedly high fungal
diversity. New Phytologist 184: 449–456.Caporaso JG, Kuczynski J, Stombaugh J, Bittinger K, Bushman FD, Costello
EK, Fierer N, Pe~na AG, Goodrich JK, Gordon JI et al. 2010.QIIME allows
analysis of high-throughput community sequencing data. Nature Methods 7:335–336.
Carlsen T, Bjørnsgaard-Aas A, Lindner D, Vr�alstad T, Schumacher T,
Kauserud H. 2012. Don’t make a mista(g)ke: is tag switching an overlooked
source of error in amplicon pyrosequencing studies? Fungal Ecology 5:747–749.
Christen R. 2008. Global sequencing: a review of current molecular data and new
methods available to assess microbial diversity.Microbes and Environments 23:253–268.
Coleman AW. 2009. Is there a molecular key to the level of “biological species” in
eukaryotes? A DNA guide.Molecular Phylogenetics and Evolution 50: 197–203.Courty P-E, Franc A, Garbaye J. 2008. Temporal changes in the ectomycorrhizal
community in two soil horizons of a temperate oak forest. Applied andEnvironmental Microbiology 74: 5792–5801.
Davey ML, Heegaard E, Halvorsen R, Ohlson M, Kauserud H. 2012. Seasonal
trends in the biomass and structure of bryophyte-associated fungal
communities explored by 454 pyrosequencing. New Phytologist 195: 844–856.Dickie IA. 2010. Insidious effects of sequencing errors on perceived diversity in
molecular surveys. New Phytologist 188: 916–918.Dickie IA, Xu B, Koide RT. 2002. Vertical niche differentiation of
ectomycorrhizal hyphae in soil as shown by T-RFLP analysis. New Phytologist156: 527–535.
Douhan GW, Vincenot L, Gryta H, Selosse MA. 2011. Population genetics of
ectomycorrhizal fungi: from current knowledge to emerging directions. FungalBiology 115: 569–597.
Eddy SR. 2011. Accelerated Profile HMM Searches. PLoS Computational Biology7: e1002195.
Edgar RC. 2010. Search and clustering orders of magnitude faster than BLAST.
Bioinformatics 26: 2460–2461.Engelbrektson A, Kunin V, Wrighton KC, Zvenigorodsky N, Chen F, Ochman
H, Hugenholtz P. 2010. Experimental factors affecting PCR-based estimates
of microbial species richness and evenness. The ISME Journal 4: 642–647.Faircloth BC, Glenn TC. 2012. Not all sequence tags are created equal:
designing and validating sequence identification tags robust to indels. PLoSONE 7: e42543.
Fonseca VG, Nichols B, Lallias D, Quince C, Carvalho GR, Power DM, Creer
S. 2012. Sample richness and genetic diversity as drivers of chimera formation
in nSSU metagenetic analyses. Nucleic Acids Research 40: e66.Freeman KR, Martin AP, Karki D, Lynch RC, Mitter MS, Meyer AF, Longcore
JE, Simmons DR, Schmidt SK. 2009. Evidence that chytrids dominate fungal
communities in high-elevation soils. Proceedings of the National Academy ofSciences, USA 106: 18315–18320.
Gardes M, Bruns TD. 1993. ITS primers with enhanced specificity for
basidiomycetes – application to the identification of mycorrhizae and rusts.
Molecular Ecology 2: 113–118.Gazis R, Rehner S, Chaverri P. 2011. Species delimitation in fungal endophyte
diversity studies and its implications in ecological and biogeographic inferences.
Molecular Ecology 20: 3001–3013.Gihring TM, Green SJ, Schadt CW. 2012.Massively parallel rRNA gene
sequencing exacerbates the potential for biased community diversity compar-
isons due to variable library sizes. Environmental Microbiology 14: 285–290.Glenn TC. 2011. Field guide to next-generation DNA sequencers.MolecularEcology Resources 11: 759–769.
Gobet A, Quince C, Ramette A. 2010.Multivariate Cutoff Level Analysis
(MultiCoLA) of large community data sets. Nucleic Acids Research 38: e155.Gollotte A, van Tuinen D, Atkinson D. 2004. Diversity of arbuscular
mycorrhizal fungi colonising roots of the grass species Agrostis capillaris andLolium perenne in a field experiment.Mycorrhiza 14: 111–117.
Grant S, Grant WD, Cowan DA, Jones BE, Ma YH, Ventosa A, Heaphy S.
2006. Identification of eukaryotic open reading frames in metagenomic cDNA
libraries made from environmental samples. Applied and EnvironmentalMicrobiology 72: 135–143.
Haas BJ, Gevers D, Earl AM, Feldgarden M, Ward DV, Giannoukos G, Ciulla
D, Tabbaa D, Highlander SK, S€odergren E et al. 2011. Chimeric 16S rRNA
sequence formation and detection in Sanger and 454-pyrosequenced PCR
amplicons. Genome Research 21: 494–504.Hamady M, Lozupone C, Knight R. 2010. Fast UniFrac: facilitating high-
throughput phylogenetic analyses of microbial communities including analysis
of pyrosequencing and PhyloChip data. The ISME Journal 4: 17–27.Hao X, Jiang R, Chen T. 2011. Clustering 16S rRNA for OTU prediction: a
method of unsupervised Bayesian clustering. Bioinformatics 27: 611–618.Hartmann M, Howes CG, Abarenkov K, Mohn WW, Nilsson RH. 2010.
V-Xtractor: an open-source, high-throughput software tool to identify and
New Phytologist (2013) � 2013 The Authors
New Phytologist� 2013 New Phytologist Trustwww.newphytologist.com
Research
NewPhytologist10
extract hypervariable regions of small subunit (16 S/18 S) ribosomal RNA gene
sequences. Journal of Microbiological Methods 83: 250–253.Hartmann M, Howes CG, Vaninsberghe D, Yu H, Bachar D, Christen R,
Nilsson RH, Hallam SJ, Mohn WW. 2012. Significant and persistent impact
of timber harvesting on soil microbial communities in northern coniferous
forests. The ISME Journal 6: 2199–2218.Herrera ML, Vallor AC, Gelfond JA, Patterson TF, Wickes BL. 2009. Strain-
dependent variation in 18S ribosomal DNA copy numbers in Aspergillusfumigatus. Journal of Clinical Microbiology 47: 1325–1332.
Hibbett DS, Gilbert LB, Donoghue MJ. 2000. Evolutionary instability of
ectomycorrhizal symbioses in basidiomycetes. Nature 407: 506–508.Huber JA, Morrison HG, Huse SM, Neal PR, Sogin ML, Welch DBM. 2009.
Effect of PCR amplicon size on assessments of clone library microbial diversity
and community structure. Environmental Microbiology 11: 1292–1302.Huse SM, Welch DM, Morrison HG, Sogin ML. 2010. Ironing out the wrinkles
in the rare biosphere through improved OTU clustering. EnvironmentalMicrobiology 12: 1889–1898.
Huson DH, Mitra S, Weber N, Ruscheweyh H, Schuster SC. 2011. Integrative
analysis of environmental sequences using MEGAN4. Genome Research 21:1552–1560.
Ihrmark K, B€odeker ITM, Cruz-Martinez K, Friberg H, Kubartova A, Schenck
J, Strid Y, Stenlid J, Brandstr€om-Durling M, Clemmensen KE et al. 2012.New primers to amplify the fungal ITS2 region – evaluation by 454-
sequencing of artificial and natural communities. FEMS Microbiology Ecology82: 666–677.
James TY, Kauff F, Schoch CL, Matheny PB, Hofstetter V, Cox CJ, Celio G,
Gueidan C, Fraker E, Miadlikowska J et al. 2006. Reconstructing the earlyevolution of Fungi using a six-gene phylogeny. Nature 443: 818–822.
Jumpponen A, Jones KL. 2009.Massively parallel 454 sequencing indicates
hyperdiverse fungal communities in temperate quercus macrocarpa
phyllosphere. New Phytologist 184: 438–448.Kanagawa T. 2003. Bias and artifacts in multitemplate polymerase chain
reactions (PCR). Journal of Bioscience and Bioengineering 96: 317–323.Kang S, Mansfield MA, Park B, Geiser DM, Ivors KL, Coffey MD, Grunwald
NJ, Martin FN, Levesque CA, Blair JE. 2010. The promise and pitfalls of
sequence-based identification of plant-pathogenic fungi and oomycetes.
Phytopathology 100: 732–737.Katoh K, Frith MC. 2012. Adding unaligned sequences into an existing
alignment using MAFFT and LAST. Bioinformatics 28: 3144–3146.Kauserud H, Kumar S, Brysting AK, Nord�en J, Carlsen T. 2012.High
consistency between replicate 454 pyrosequencing analyses of ectomycorrhizal
plant root samples.Mycorrhiza 22: 309–315.Kebaara BW, Nielsen LE, Nickerson KW, Atkin AL. 2006. Determination of
mRNA half-lives in Candida albicans using thiolutin as a transcription
inhibitor. Genome 49: 894–899.Kellner H, Zak DR, Vandenbol M. 2010. Fungi unearthed: transcripts
encoding lignocellulolytic and chitinolytic enzymes in forest soil. PLoSONE 5: e10971.
Kerekes J, Kaspari M, Stevenson B, Nilsson RH, Hartmann M, Amend A,
Bruns TD. 2013. Nutrient enrichment increased species richness of leaf litter
fungal assemblages in a tropical forest. Molecular Ecology. doi:10.1111/mec.
12259.
Koetschan C, F€orster F, Keller A, Schleicher T, Ruderisch B, Schwarz R, M€uller
T, Wolf M, Schultz J. 2010. The ITS2 Database III - sequences and structures
for phylogeny. Nucleic Acids Research 38: D275–D279.
Ko�s M, Tollervey D. 2010. Yeast pre-rRNA processing and modification occur
cotranscriptionally.Molecular Cell 37: 745–746.Kr€uger M, Stockinger H, Kr€uger C, Sch€ussler A. 2009. DNA-based species level
detection of Glomeromycota: one PCR primer set for all arbuscular
mycorrhizal fungi. New Phytologist 183: 212–223.Kumar S, Carlsen T, Mevik B-H, Enger P, Blaalid R, Shalchian-Tabrizi K,
Kauserud H. 2011. CLOTU: an online pipeline for processing and clustering
of 454 amplicon reads into OTUs followed by taxonomic annotation. BMCBioinformatics 12: 182.
Kunin V, Engelbrektson A, Ochman H, Hugenholtz P. 2010.Wrinkles in the
rare biosphere: pyrosequencing errors can lead to artificial inflation of diversity
estimates. Environmental Microbiology 12: 118–123.
Kuske CR, Lindahl BD. 2013.Metagenomics for study of fungal ecology. In:
Martin F, ed. Ecological genomics of the fungi. Hoboken, NJ, USA: Wiley-
Blackwell.
Lahr DJG, Katz LA. 2009. Reducing the impact of PCR-mediated recombina-
tion in molecular evolution and environmental studies using a new-generation
high-fidelity DNA polymerase. BioTechniques 47: 857–863.Lee J, Lee S, Young JPW. 2008. Improved PCR primers for the detection and
identification of arbuscular mycorrhizal fungi. FEMS Microbiology Ecology 65:339–349.
Lekberg Y, Schnoor T, Kjøller R, Gibbons SM, Hansen LH, Al-Soud WA,
Sørensen SJ, Rosendahl S. 2012. 454-sequencing reveals stochastic local
reassembly and high disturbance tolerance within arbuscular mycorrhizal fungal
communities. Journal of Ecology 100: 151–160.Lennon JT. 2011. Replication, lies and lesser-known truths regarding
experimental design in environmental microbiology. EnvironmentalMicrobiology 13: 1383–1386.
Lewis LK, Robson MH, Vecherkina Y, Ji C, Beall GW. 2010. Interference with
spectrophotometric analysis of nucleic acids and proteins by leaching of
chemicals from plastic tubes. BioTechniques 48: 297–302.Li M, Diehl F, Dressman D, Vogelstein B, Kinzler KW. 2006. BEAMing up
for detection and quantification of rare sequence variants. Nature Methods 3:95–97.
Lilleskov EA, Bruns TD, Horton TR, Taylor DL, Grogan P. 2004. Detection of
forest stand-level spatial structure in ectomycorrhizal fungal communities.
FEMS Microbiology Ecology 49: 319–332.Lindahl BD, de Boer W, Finlay RD. 2010. Disruption of root carbon transport
into forest humus stimulates fungal opportunists at the expense of mycorrhizal
fungi. The ISME Journal 4: 872–881.Lindahl BD, Ihrmark K, Boberg J, Trumbore SE, H€ogberg P, Stenlid J, FinlayRD. 2007. Spatial separation of litter decomposition and mycorrhizal nitrogen
uptake in a boreal forest. New Phytologist 173: 611–620.Lindahl BD, Taylor AFS. 2004. N-acetylhexosaminidase coding genes in
ectomycorrhizal basidiomycetes. New Phytologist 164: 193–199.Lindner DL, Banik MT. 2011. Intragenomic variation in the ITS rDNA region
obscures phylogenetic relationships and inflates estimates of operational
taxonomic units in genus Laetiporus.Mycologia 103: 731–740.Liu KL, Porras-Alfaro A, Kuske CR, Eichorst SA, Xie G. 2012. Accurate, rapid
taxonomic classification of fungal large-subunit rRNA genes. Applied andEnvironmental Microbiology 78: 1523–1533.
Margulies M, Egholm M, Altman WE, Attiya S, Bader JS, Bemben LA, Berka J,
Braverman MS, Chen YJ, Chen ZT et al. 2005. Genome sequencing in
microfabricated high-density picolitre reactors. Nature 437: 376–380.Martin-Laurent F, Philippot L, Hallet S, Chaussod R, Germon JC, Soulas G,
Catroux G. 2001. DNA extraction from soils: old bias for new microbial
diversity analysis methods. Applied and Environmental Microbiology 67:2354–2359.
Mello A, Napoli C, Murat C, Morin E, Marceddu G, Bonfante P. 2011. ITS-1
versus ITS-2 pyrosequencing: a comparison of fungal populations in truffle
grounds.Mycologia 103: 1184–1193.Nilsson RH, Kristiansson E, Ryberg M, Hallenberg N, Larsson K-H. 2008.
Intraspecific ITS variability in the kingdom fungi as expressed in the
international sequence databases and its implications for molecular species
identification. Evolutionary Bioinformatics 4: 193–201.Nilsson RH, Ryberg M, Abarenkov K, Sj€okvist E, Kristiansson E. 2009. The
ITS region as a target for characterization of fungal communities using
emerging sequencing technologies. FEMS Microbiology Letters 296: 97–101.Nilsson RH, Tedersoo L, Lindahl BD, Kjøller R, Carlsen T, Quince C,
Abarenkov K, Pennanen T, Stenlid J, Bruns T et al. 2011. Towardsstandardization of the description and publication of next-generation
sequencing datasets of fungal communities. New Phytologist 191: 314–318.€Opik M, Metsis M, Daniell TJ, Zobel M, Moora M. 2009. Large-scale parallel
454 sequencing reveals host ecological group specificity of arbuscular
mycorrhizal fungi in a boreonemoral forest. New Phytologist 184: 424–437.€Opik M, Vanatoa A, Vanatoa E, Moora M, Davison J, Kalwij JM, Reier U,
Zobel M. 2010. The online database MaarjAM reveals global and ecosystemic
distribution patterns in arbuscular mycorrhizal fungi (Glomeromycota). NewPhytologist 188: 223–241.
� 2013 The Authors
New Phytologist� 2013 New Phytologist TrustNew Phytologist (2013)
www.newphytologist.com
NewPhytologist Research 11

Parameswaran P, Jalili R, Tao L, Shokralla S, Gharizadeh B, Ronaghi M, Fire AZ.
2007. A pyrosequencing-tailored nucleotide barcode design unveils opportunities
for large-scale sample multiplexing.Nucleic Acids Research 35: e130.Pennanen T, Caul S, Daniell TJ, Griffiths BS, Ritz K, Wheatley RE. 2004.
Community-level responses of metabolically-active soil microorganisms to the
quantity and quality of substrate inputs. Soil Biology & Biochemistry 36:841–848.
Petersen L, Minkkinen P, Esbensen KH. 2005. Representative sampling for
reliable data analysis: theory of Sampling. Chemometrics and IntelligentLaboratory Systems 77: 261–277.
Pickles BJ, Genney DR, Potts JM, Lennon JJ, Anderson IC, Alexander IJ. 2010.
Spatial and temporal ecology of Scots pine ectomycorrhizas. New Phytologist186: 755–768.
Polz MF, Cavanaugh CM. 1998. Bias in template-to-product ratios in
multitemplate PCR. Applied and Environmental Microbiology 64: 3724–3730.Porter TM, Golding GB. 2012. Factors that affect large subunit ribosomal DNA
amplicon sequencing studies of fungal communities: classification method,
primer choice, and error. PLoS ONE 7: e35749.
Prosser JI. 2010. Replicate or lie. Environmental Microbiology 12: 1806–1810.Pruesse E, Quast C, Knittel K, Fuchs B, Ludwig W, Peplies J, Gl€ockner FO.
2007. SILVA: a comprehensive online resource for quality checked and aligned
ribosomal RNA sequence data compatible with ARB. Nucleic Acids Research 35:7188–7196.
Quince C, Lanzen A, Curtis TP, Davenport RJ, Hall N, Head IM, Read LF,
Sloan WT. 2009. Accurate determination of microbial diversity from 454
pyrosequencing data. Nature Methods 6: 639–641.Quince C, Lanzen A, Turnbaugh PJ. 2011. Removing noise from pyrosequenced
amplicons. BMC Bioinformatics 12: 38.Rajala T, Peltoniemi M, Hantula J, M€akip€a€a R, Pennanen T. 2011. RNA
reveals a succession of active fungi during the decay of Norway spruce logs.
Fungal Ecology 4: 437–444.Reeder J, Knight R. 2010. Rapid denoising of pyrosequencing amplicon data:
exploiting the rank-abundance distribution. Nature Methods 7: 668–669.Rosen MJ, Callahan BJ, Fisher DS, Holmes SP. 2012. Denoising PCR-amplified
metagenome data. BMC Bioinformatics 13: 283.Russell DJ, Way SF, Benson AK, Sayood K. 2010. A grammar-based distance
metric enables fast and accurate clustering of large sets of 16S sequences. BMCBioinformatics 11: 601.
Sanders IR, Croll D. 2010. Arbuscular mycorrhiza: the challenge to understand
the genetics of the fungal partner. Annual Review of Genetics 44: 271–292.Schloss PD, Westcott SL, Ryabin T, Hall JR, Hartmann M, Hollister EB,
Lesniewski RA, Oakley BB, Parks DH, Robinson CJ et al. 2009. Introducingmothur: open-source, platform-independent, community-supported software
for describing and comparing microbial communities. Applied andEnvironmental Microbiology 75: 7537–7541.
Schoch CL, Seifert KA, Huhndorf S, Robert V, Spouge JL, Levesque CA, Chen
W. 2012. Nuclear ribosomal internal transcribed spacer (ITS) region as a
universal DNA barcode marker for Fungi. Proceedings of the National Academyof Sciences, USA 109: 6241–6246.
Shokralla S, Spall JL, Gibson JF, Hajibabaei M 2012. Next-generation
sequencing technologies for environmental DNA research.Molecular Ecology21: 1794–1805.
Smith ML, Bruhn JN, Anderson JB. 1992. The fungus Armillaria bulbosa isamong the largest and oldest living organisms. Nature 356: 428–431.
Stockinger H, Kruger M, Schussler A. 2010. DNA barcoding of arbuscular
mycorrhizal fungi. New Phytologist 187: 461–474.Taberlet P, Prud’homme SM, Campione E, Roy J, Miquel C, Shehzad W,
Gielly L, Rioux D, Choler P, Cl�ement J-C et al. 2012. Soil sampling and
isolation of extracellular DNA from large amount of starting material suitable
for metabarcoding studies.Molecular Ecology 21: 1816–1820.Tanner MA, Goebel BM, Dojka MA, Pace NR. 1998. Specific ribosomal
DNA sequences from diverse environmental settings correlate with
experimental contaminants. Applied and Environmental Microbiology 64:3110–3113.
Tedersoo L, Abarenkov K, Nilsson RH, Schussler A, Grelet GA, Kohout P,
Oja J, Bonito GM, Veldre V, Jairus T et al. 2011. Tidying up internationalnucleotide sequence databases: ecological, geographical, and sequence quality
annotation of ITS sequences of mycorrhizal fungi. PLoS ONE 6: e24940.
Tedersoo L, Jairus T, Horton BM, Abarenkov K, Suvi T, Saar I, K~oljalg U.
2008. Strong host preference of ectomycorrhizal fungi in a Tasmanian wet
sclerophyll forest as revealed by DNA barcoding and taxon-specific primers.
New Phytologist 180: 479–490.Tedersoo L, May TW, Smith ME. 2010b. Ectomycorrhizal lifestyle in fungi:
global diversity, distribution, and evolution of phylogenetic lineages.
Mycorrhiza 20: 217–263.Tedersoo L, Nilsson RH, Abarenkov K, Jairus T, Sadam A, Saar I, Bahram M,
Bechem E, Chuyong G, K~oljalg U. 2010a. 454 pyrosequencing and Sanger
sequencing of tropical mycorrhizal fungi provide similar results but reveal
substantial methodological biases. New Phytologist 188: 291–301.Toju H, Tanabe AS, Yamamoto S, Sato H. 2012.High-coverage ITS primers for
the DNA-based identification of ascomycetes and basidiomycetes in
environmental samples. PLoS ONE 7: e40863.
van Tuinen D, Jacquot E, Zhao B, Gollotte A, Gianinazzi-Pearson V. 1998.
Charecterization of root colonization profiles by a microcosm community of
arbuscular mycorrhizal fungi using 25S rDNA-targeted nested PCR.MolecularEcology 7: 879–887.
Wallander H, Johansson U, Sterkenburg E, Brandstr€om-Durling M, Lindahl
BD. 2010. Production of ectomycorrhizal mycelium peaks during canopy
closure in Norway spruce forests. New Phytologist 187: 1124–1134.Wang Q, Garrity GM, Tiedje JM, Cole JR. 2007. Naive Bayesian classifier for
rapid assignment of rRNA sequences into the new bacterial taxonomy. Appliedand Environmental Microbiology 73: 5261–5267.
White TJ, Bruns T, Lee S, Taylor J. 1990. Amplification and direct sequencing
of fungal ribosomal RNA genes for phylogenetics. In: Innis MA, Gelfland DH,
Sninsky JJ, White TJ, eds. PCR protocols: a guide to methods and applications.San Diego, CA, USA: Academic Press, 315–322.
Wilson IG. 1997. Inhibition and facilitation of nucleic acid amplification.
Applied and Environmental Microbiology 63: 3741–3751.
New Phytologist (2013) � 2013 The Authors
New Phytologist� 2013 New Phytologist Trustwww.newphytologist.com
Research
NewPhytologist12