Embed Size (px)
Citation preview

Funding local government in Michigan: a broken system?
Gerald R. Ford Presidential Museum March 28, 2013

The Michigan Public Policy Survey • Census survey – all counties, cities, townships,
and villages (72% response rates); twice/year
• Respondents – chief elected and appointed officials
• Topics – wide range, such as fiscal health, budget priorities, economic development, intergovernmental cooperation, employee policies, labor unions, state relations, environmental sustainability, citizen engagement, much more.
2

Warning Signs
“Within five years all of our urban cores are going to be where Flint is at today, unless some significant changes are made.
The way we finance cities today is broken.”
- Ed Kurtz, Emergency Financial Manager, City of Flint (Michigan Radio, 1/30/2013)
3

Warning Signs “We cannot continue to do all things for all people
like we have done in the past.
We tried doing more with less. That worked for a while.
Doing more with less has kind of reached its limits, and now we’re suggesting we’re going to do less with less.”
- David Hollister, former Mayor of Lansing, chair of blue ribbon committee on Lansing’s finances (Lansing State Journal, 3/15/2013)
4

Presentation Outline
• Era of Local Government Retrenchment
• A 2nd Retrenchment Looming?
• What Local Leaders Say Should Be Done
5

A Decade of Funding Cuts
6
Revenue sharing cuts
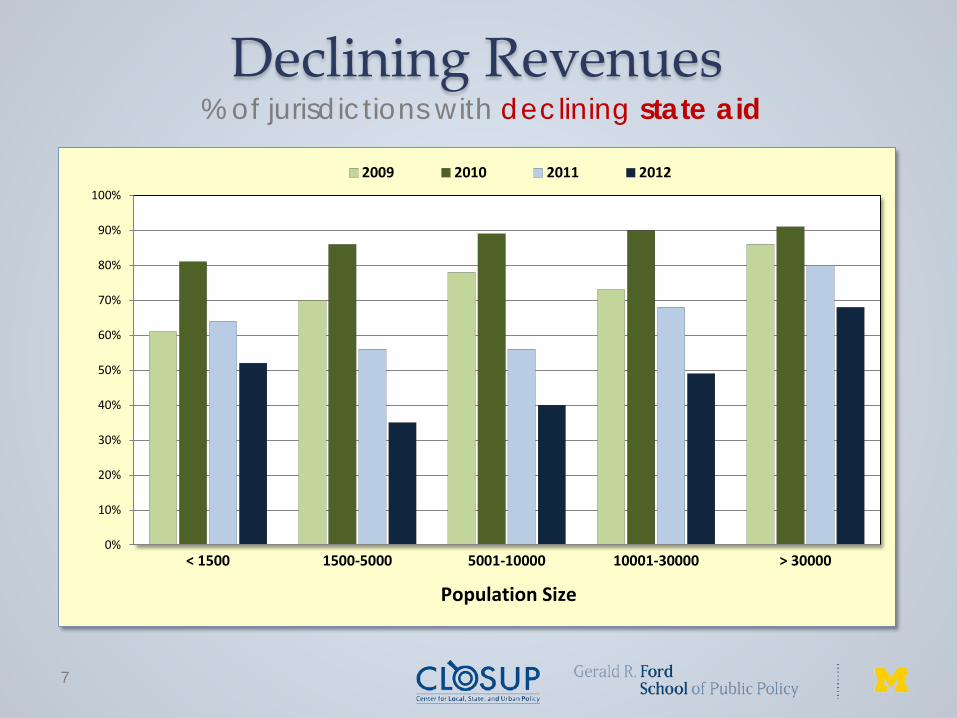
7
% of jurisdictions with declining state aid
Declining Revenues
0%
10%
20%
30%
40%
50%
60%
70%
80%
90%
100%
< 1500 1500-5000 5001-10000 10001-30000 > 30000
2009 2010 2011 2012
Population Size

Declining Revenues
8
% of jurisdictions with declining property tax revenues
0%
10%
20%
30%
40%
50%
60%
70%
80%
90%
100%
< 1500 1500-5000 5001-10000 10001-30000 > 30000
2009 2010 2011 2012
Population Size Population Size Population Size Population Size Population Size Population Size Population Size Population Size
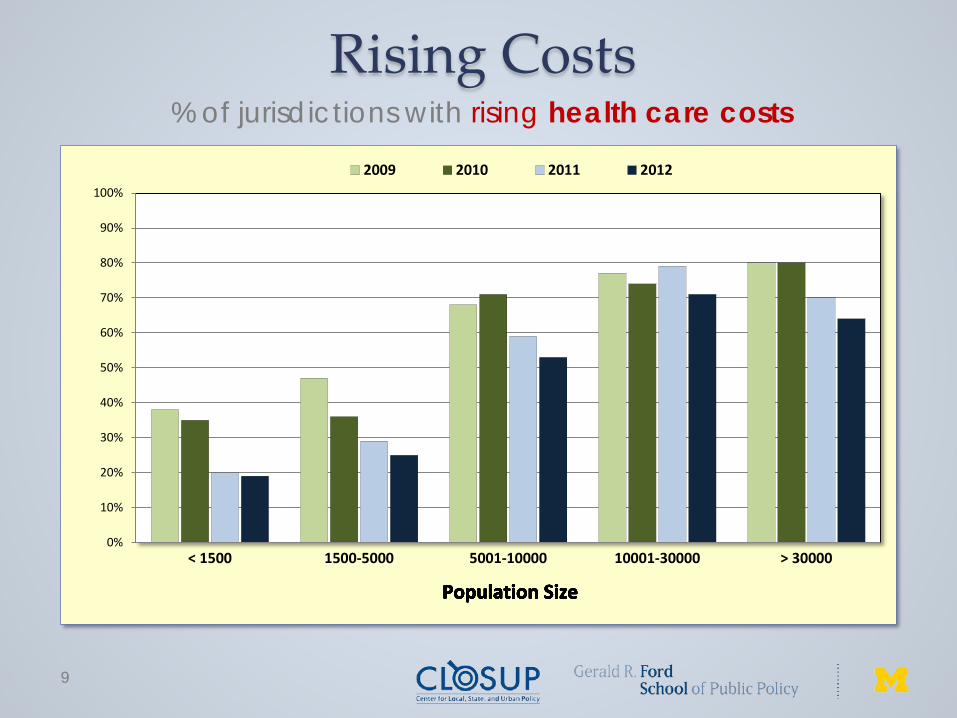
Rising Costs
9
% of jurisdictions with rising health care costs
0%
10%
20%
30%
40%
50%
60%
70%
80%
90%
100%
< 1500 1500-5000 5001-10000 10001-30000 > 30000
2009 2010 2011 2012
Population Size Population Size Population Size Population Size Population Size Population Size Population Size Population Size

Rising Costs
10
% of jurisdictions with rising pension costs
0%
10%
20%
30%
40%
50%
60%
70%
80%
90%
100%
< 1500 1500-5000 5001-10000 10001-30000 > 30000
2009 2010 2011 2012
Population Size Population Size Population Size Population Size

Government Actions
11
% of jurisdictions increasing debt
0%
10%
20%
30%
40%
50%
60%
70%
80%
90%
100%
< 1500 1500-5000 5001-10000 10001-30000 > 30000
2009 2010 2011 2012
Population Size Population Size Population Size Population Size Population Size Population Size Population Size

Government Actions
12
% of jurisdictions increasing reliance on GF balance
0%
10%
20%
30%
40%
50%
60%
70%
80%
90%
100%
< 1500 1500-5000 5001-10000 10001-30000 > 30000
2009 2010 2011 2012
Population Size Population Size Population Size Population Size Population Size Population Size Population Size

Government Actions
13
% of jurisdictions cutting staff levels
0%
10%
20%
30%
40%
50%
60%
70%
80%
90%
100%
< 1500 1500-5000 5001-10000 10001-30000 > 30000
2009 2010 2011 2012
Population Size Population Size Population Size Population Size Population Size Population Size Population Size Population Size

Government Actions
14
% of jurisdictions shifting health care costs to employees
0%
10%
20%
30%
40%
50%
60%
70%
80%
90%
100%
< 1500 1500-5000 5001-10000 10001-30000 > 30000
2010 2011 2012
Population Size Population Size Population Size Population Size Population Size Population Size Population Size
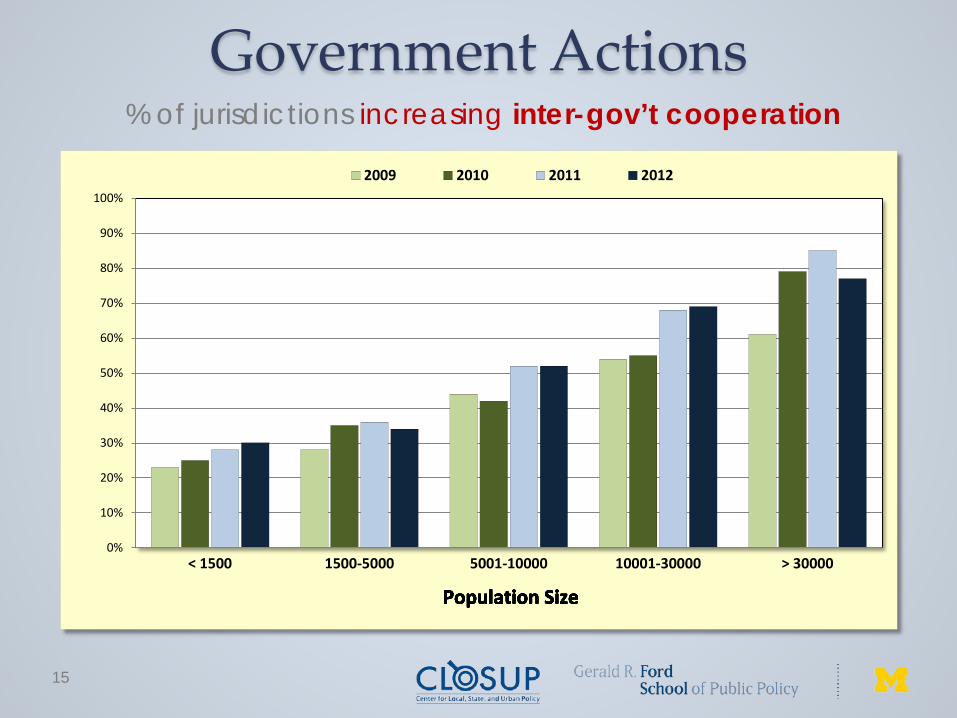
Government Actions
15
% of jurisdictions increasing inter-gov’t cooperation
0%
10%
20%
30%
40%
50%
60%
70%
80%
90%
100%
< 1500 1500-5000 5001-10000 10001-30000 > 30000
2009 2010 2011 2012
Population Size Population Size Population Size Population Size Population Size Population Size Population Size
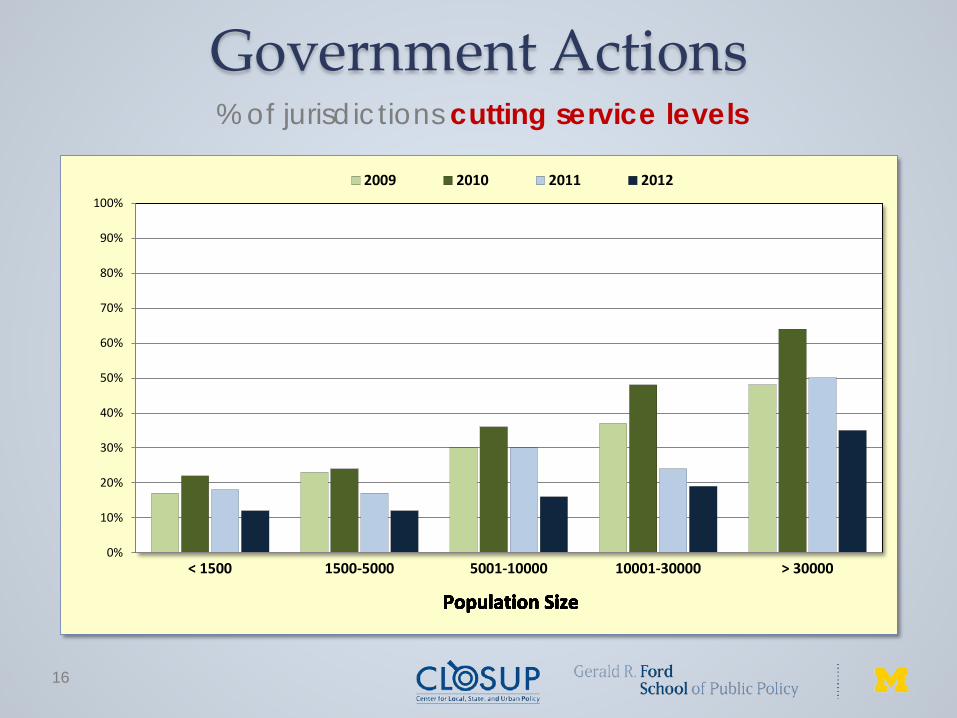
Government Actions
16
% of jurisdictions cutting service levels
0%
10%
20%
30%
40%
50%
60%
70%
80%
90%
100%
< 1500 1500-5000 5001-10000 10001-30000 > 30000
2009 2010 2011 2012
Population Size Population Size Population Size Population Size Population Size Population Size Population Size Population Size Population Size

Spreading Fiscal Problems
17
2009: less able to meet fiscal needs, by county
Jurisdictions within County
Green: < 25% Yellow: 25-50% Red: > 50%
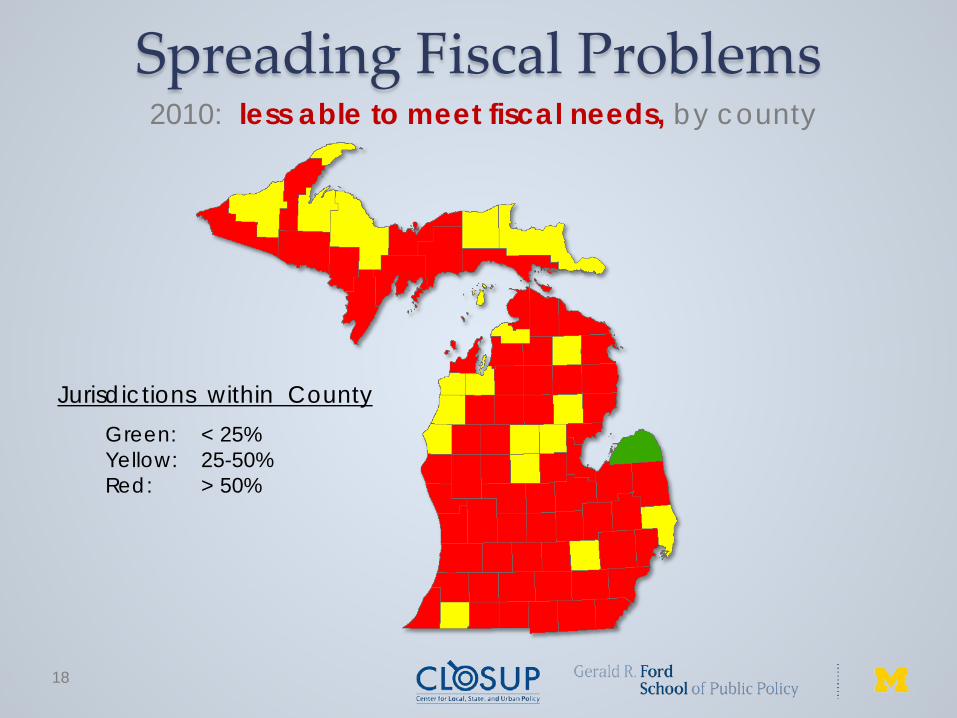
Spreading Fiscal Problems
18
2010: less able to meet fiscal needs, by county
Jurisdictions within County
Green: < 25% Yellow: 25-50% Red: > 50%
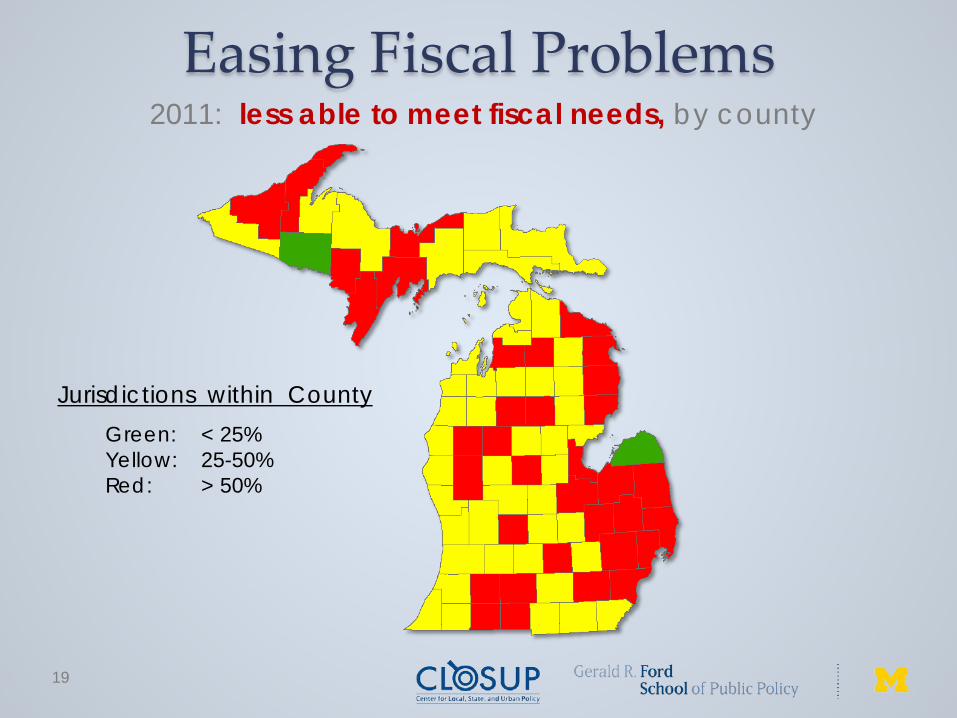
Easing Fiscal Problems
19
2011: less able to meet fiscal needs, by county
Jurisdictions within County
Green: < 25% Yellow: 25-50% Red: > 50%

Easing Fiscal Problems
20
2012: less able to meet fiscal needs, by county
Jurisdictions within County
Green: < 25% Yellow: 25-50% Red: > 50%

Status of Fiscal Health Today
21
• General Fund Balance o 66% say levels are about right or even too high o 23% say too low (41% in largest jurisdictions)
• Cash Flow o 91% say not much of a problem or not a problem at all o 18% in largest jurisdictions say somewhat of a problem
• Package of Services
o 79% are very or somewhat satisfied with package of services still delivered today

Presentation Outline
• Era of Local Government Retrenchment
• A 2nd Retrenchment Looming?
• What Local Leaders Say Should Be Done
22
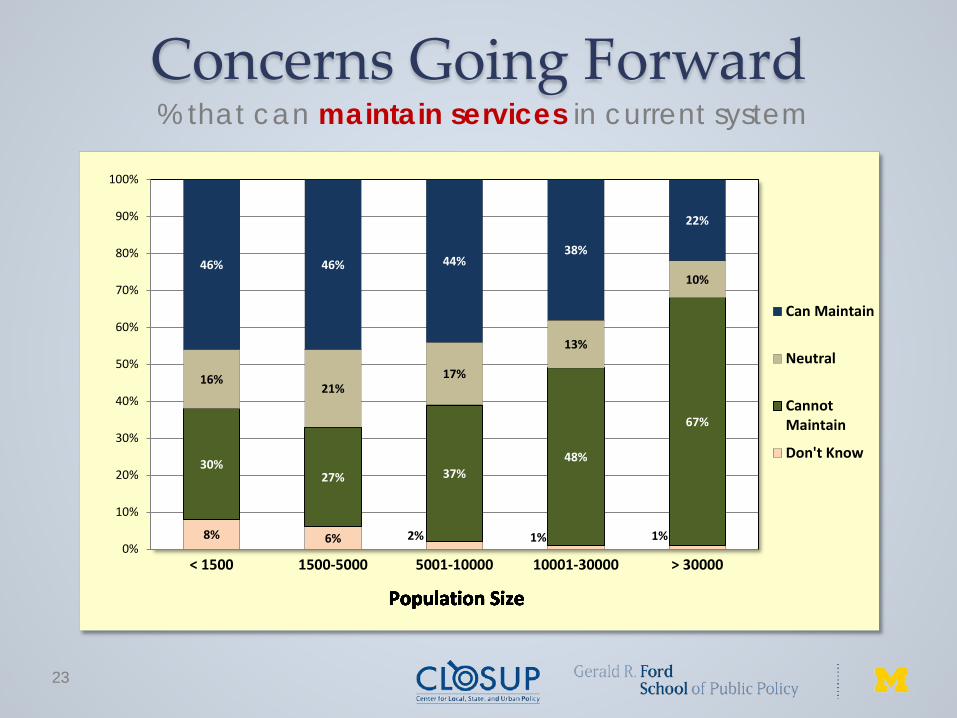
Concerns Going Forward
23
% that can maintain services in current system
8% 6% 2% 1% 1%
30% 27% 37%
48%
67%
16% 21%
17%
13%
10% 46% 46% 44%
38%
22%
0%
10%
20%
30%
40%
50%
60%
70%
80%
90%
100%
< 1500 1500-5000 5001-10000 10001-30000 > 30000
Can Maintain
Neutral
CannotMaintain
Don't Know
Population Size Population Size Population Size Population Size Population Size Population Size Population Size Population Size

Spreading Fiscal Problems
24
Able to maintain services, by county
Jurisdictions within County
Red: < 50% Green: > 50%
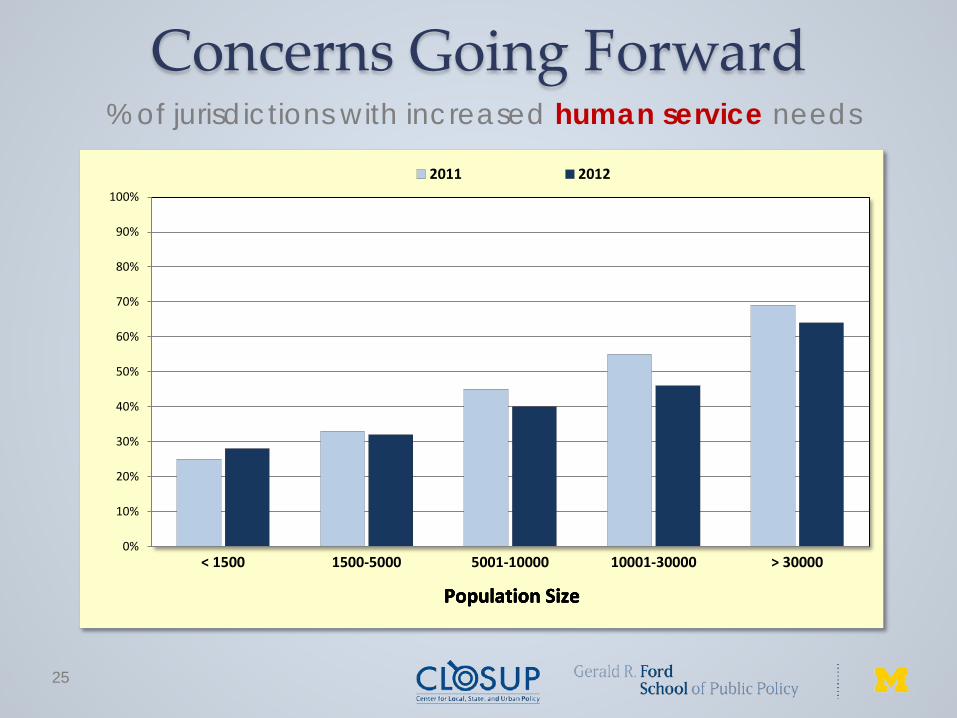
Concerns Going Forward
25
% of jurisdictions with increased human service needs
0%
10%
20%
30%
40%
50%
60%
70%
80%
90%
100%
< 1500 1500-5000 5001-10000 10001-30000 > 30000
2011 2012
Population Size Population Size Population Size Population Size
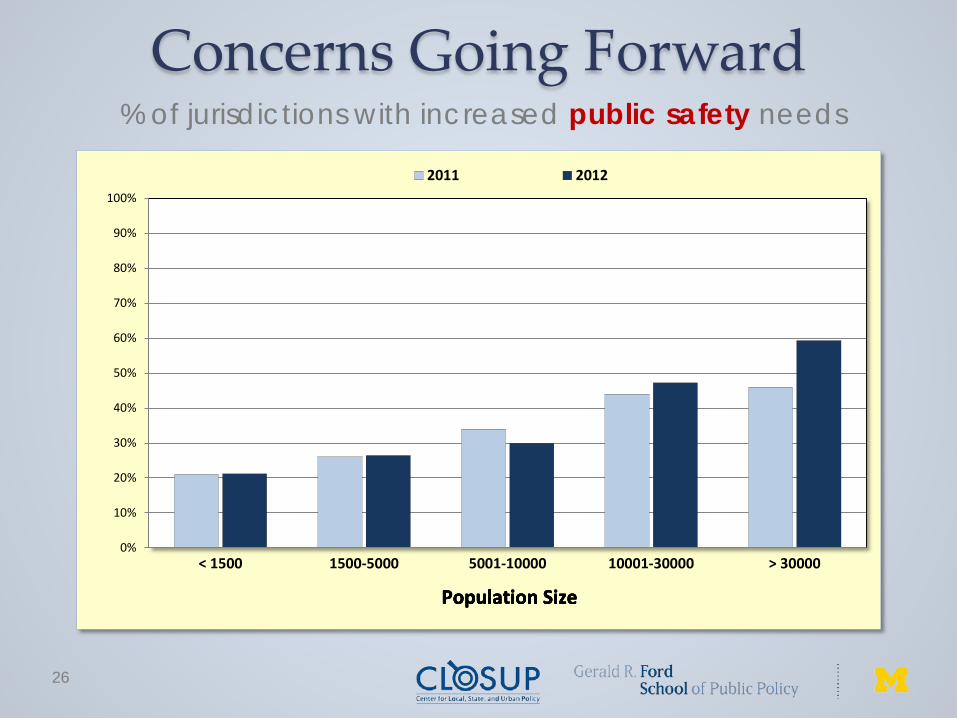
Concerns Going Forward
26
% of jurisdictions with increased public safety needs
0%
10%
20%
30%
40%
50%
60%
70%
80%
90%
100%
< 1500 1500-5000 5001-10000 10001-30000 > 30000
2011 2012
Population Size Population Size Population Size Population Size

Concerns Going Forward
27
% of jurisdictions with increased infrastructure needs
0%
10%
20%
30%
40%
50%
60%
70%
80%
90%
100%
< 1500 1500-5000 5001-10000 10001-30000 > 30000
2011 2012
Population Size Population Size Population Size Population Size

Concerns Going Forward
28
% that can improve services in current system
12% 9% 3% 1% 1%
37% 38% 46%
61%
79%
26% 26% 24%
17%
6% 25% 27% 27%
21% 14%
0%
10%
20%
30%
40%
50%
60%
70%
80%
90%
100%
< 1500 1500-5000 5001-10000 10001-30000 > 30000
Can Improve
Neutral
CannotImprove
Don't Know
Population Size Population Size Population Size Population Size Population Size Population Size Population Size Population Size Population Size Population Size Population Size Population Size
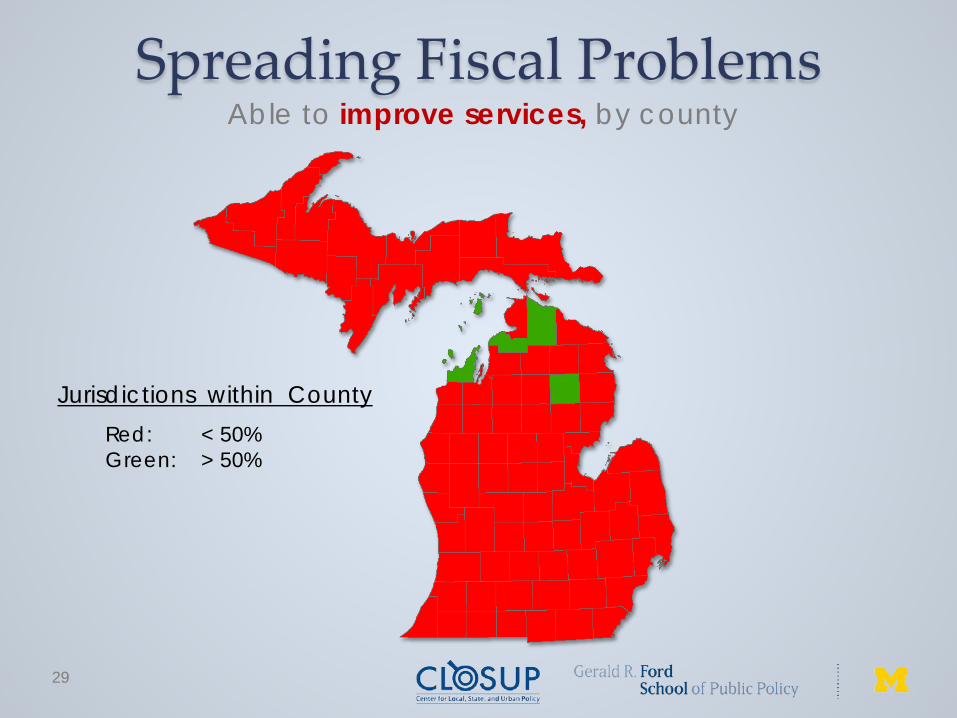
Spreading Fiscal Problems
29
Able to improve services, by county
Jurisdictions within County
Red: < 50% Green: > 50%

Presentation Outline
• Era of Local Government Retrenchment
• A 2nd Retrenchment Looming?
• What Local Leaders Say Should Be Done
30
Support for Funding Reform
31
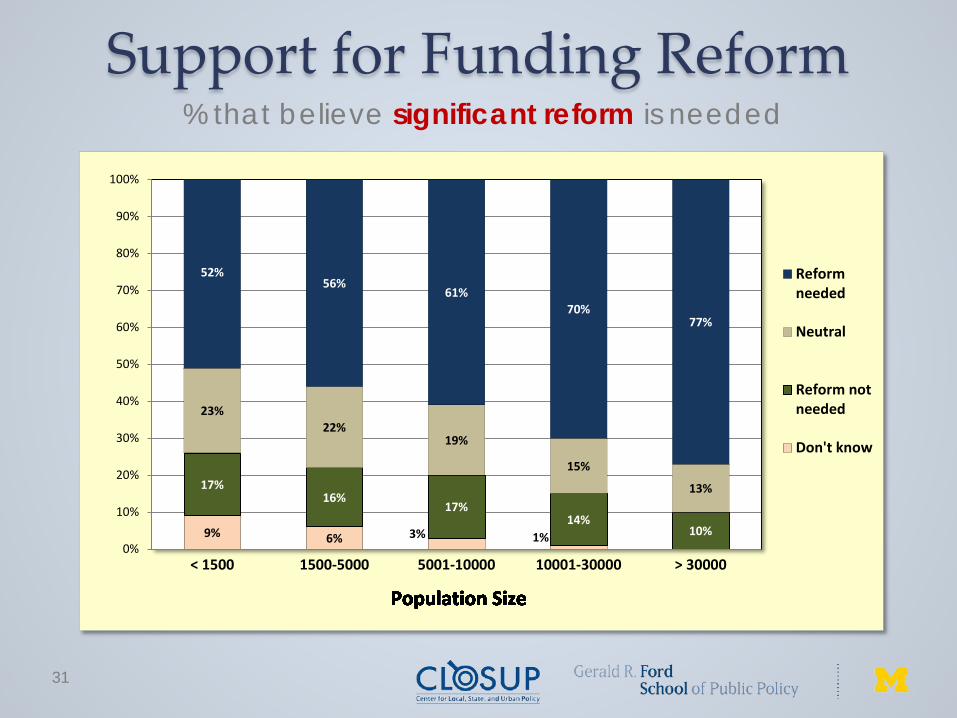
% that believe significant reform is needed
9% 6% 3% 1%
17% 16%
17% 14%
10%
23% 22%
19%
15%
13%
52% 56%
61% 70%
77%
0%
10%
20%
30%
40%
50%
60%
70%
80%
90%
100%
< 1500 1500-5000 5001-10000 10001-30000 > 30000
Reformneeded
Neutral
Reform notneeded
Don't know
Population Size Population Size Population Size Population Size Population Size Population Size Population Size Population Size Population Size Population Size Population Size Population Size Population Size Population Size Population Size Population Size
Support for Funding Reform
32
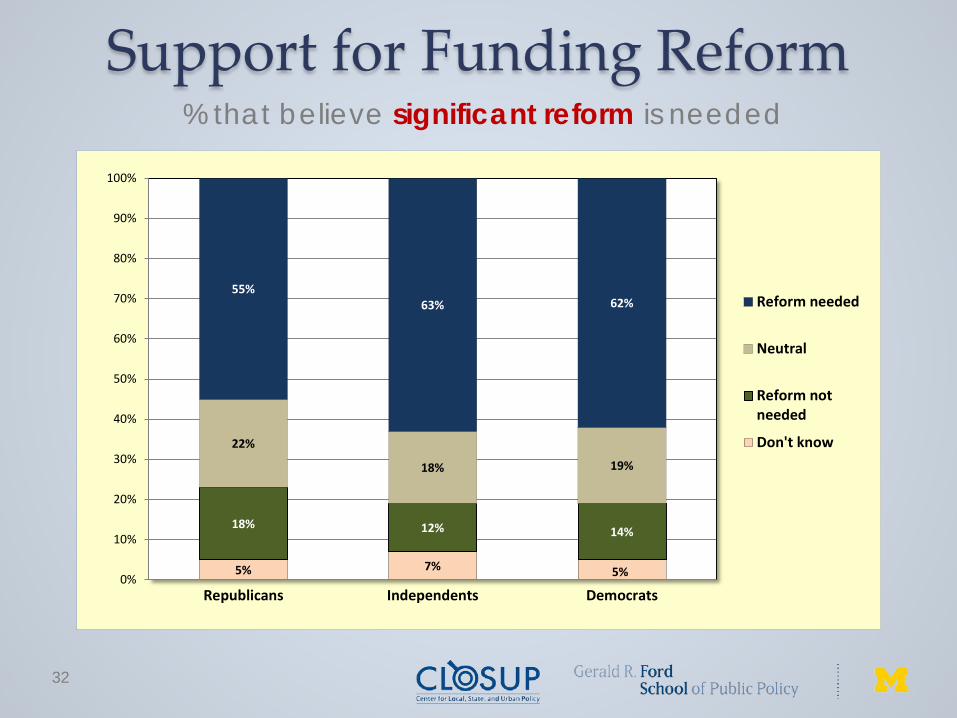
% that believe significant reform is needed
5% 7% 5%
18% 12% 14%
22%
18% 19%
55% 63% 62%
0%
10%
20%
30%
40%
50%
60%
70%
80%
90%
100%
Republicans Independents Democrats
Reform needed
Neutral
Reform notneeded
Don't know

Support for Funding Reform
33
% that would target specific funding elements to reform
26%
27%
32%
37%
30%
36%
38%
42%
35%
16%
20%
32%
41%
50%
45%
44%
41%
54%
Regional taxation
Local income tax
Economic Vitality Incentive Program
Personal Property Tax (PPT)
Constitutional revenue sharing
Proposal A
Headlee Amendment
Sales tax
Gas tax
Not Important at All Somewhat Important Very Important
6%
12%
9%
8%
15%
15%
12%
37%
29%
Support for Funding Reform
34
Suggested reforms
• Property taxes: o Eliminate Headlee and Proposal A o Ease revenue caps o Lower/ease the automatic millage rollbacks o Allow automatic millage rollups
Quote:
“I would revise Proposal A to get rid of the tax rate differences between homestead and non-homestead and eliminate the caps. I would revise the Headlee amendment so that millage rates could both be rolled back and rolled up without a vote of the people.”
Support for Funding Reform
35
Suggested reforms
• Sales taxes: o Increase the sales tax rate o Increase the sales tax base (add services, food, internet
sales, etc.) o Allow local sales taxes, or local control of state sales tax
Quote:
“It’s a bit like a three-legged stool. Right now we only have the ability to collect revenues from one leg of the stool and as a result the whole system is unbalanced. Making it possible to levy a local sales tax – or easier to levy an income tax – would re-balance the stool and allow us to reduce property tax rates.”
Support for Funding Reform
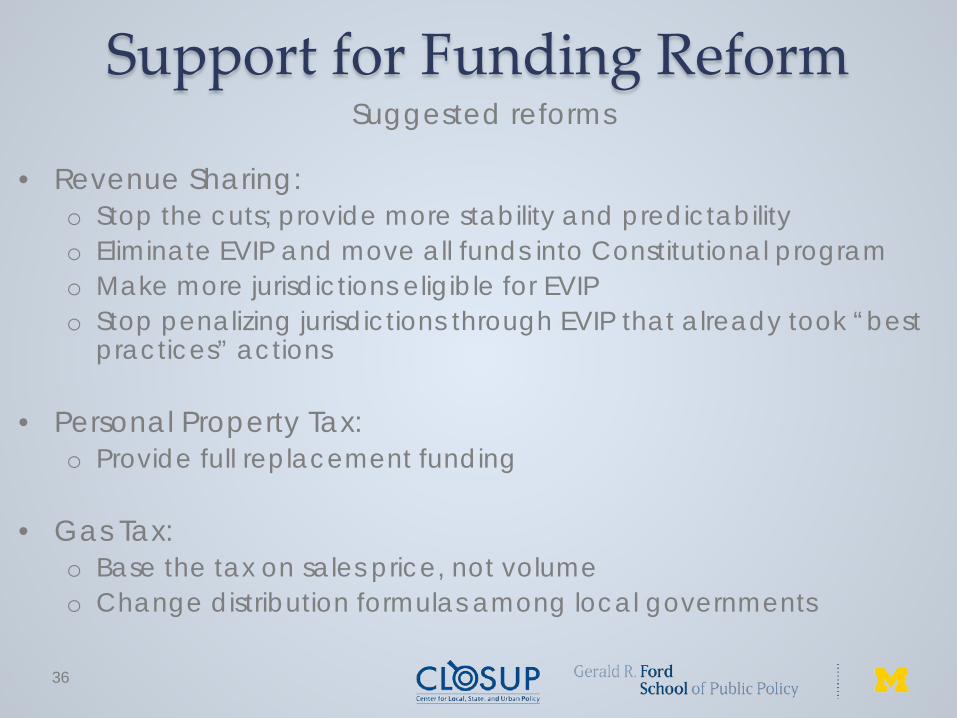
36
Suggested reforms
• Revenue Sharing: o Stop the cuts; provide more stability and predictability o Eliminate EVIP and move all funds into Constitutional program o Make more jurisdictions eligible for EVIP o Stop penalizing jurisdictions through EVIP that already took “best
practices” actions
• Personal Property Tax: o Provide full replacement funding
• Gas Tax:
o Base the tax on sales price, not volume o Change distribution formulas among local governments

A Broken Funding System?
38
key findings
• Long period of fiscal squeeze: falling revenues and rising costs.
• Local governments were very active in responding: have largely preserved fiscal health and tried to protect services.
• However, only 43% believe current system of funding will allow them to maintain their current package of services in the future; only 26% think it will allow improvements or provision of new services.
• 58% say significant reform is needed. Among them, overwhelming percentages say each major piece of the system needs reform.
• But there is no particular consensus on the fixes.
• It is time to discuss the system of funding local government.

Funding local government in Michigan: a broken system?
Gerald R. Ford Presidential Museum March 28, 2013
www.closup.umich.edu